Embed Size (px)
Citation preview
FY2014 Annual Report: NOS Tide Gauge Network Page 1 of 12
Progress Report NOS Tide Gauge Network
Sea Level Analysis Period of Activity: 01 October 2013 – 30 September 2014 Principal Investigator Audra Luscher NOAA National Ocean Service/CO-OPS SSMC4, Station 6525 1305 East West Highway Silver Spring, MD 20910 [email protected]
Financial Contact Jason Shadid NOAA National Ocean Service/CO-OPS SSMC4, Station 6527 1305 East West Highway Silver Spring, MD 20910 [email protected]
Senior Scientist Stephen Gill NOAA National Ocean Service/CO-OPS SSMC4, Station 6515 1305 East West Highway Silver Spring, MD 20910 [email protected]
Signature Date
Signature Date
Signature Date
Co-Principal Investigator Adria Schneck-Scott NOAA National Ocean Service/ CO-OPS SSMC4, Station 7201 1305 East West Highway Silver Spring, MD 20910 [email protected]
Co-Principal Investigator Dr. Chris Zervas NOAA National Ocean Service/ CO-OPS SSMC4, Station 7317 1305 East West Highway Silver Spring, MD 20910 [email protected]
Co-Principal Investigator Dr. William Sweet NOAA National Ocean Service/ CO-OPS SSMC4, Station 7331 1305 East West Highway Silver Spring, MD 20910 [email protected]
Co-Principal Investigator Chris Paternostro NOAA National Ocean Service/ CO-OPS SSMC4, Station 7210 1305 East West Highway Silver Spring, MD 209010 [email protected]
Co-Principal Investigator Dr. Joseph Park NOAA National Ocean Service/ CO-OPS SSMC4 1305 East West Highway Silver Spring, MD 20910 [email protected]
FY2014 Annual Report: NOS Tide Gauge Network Page 2 of 12
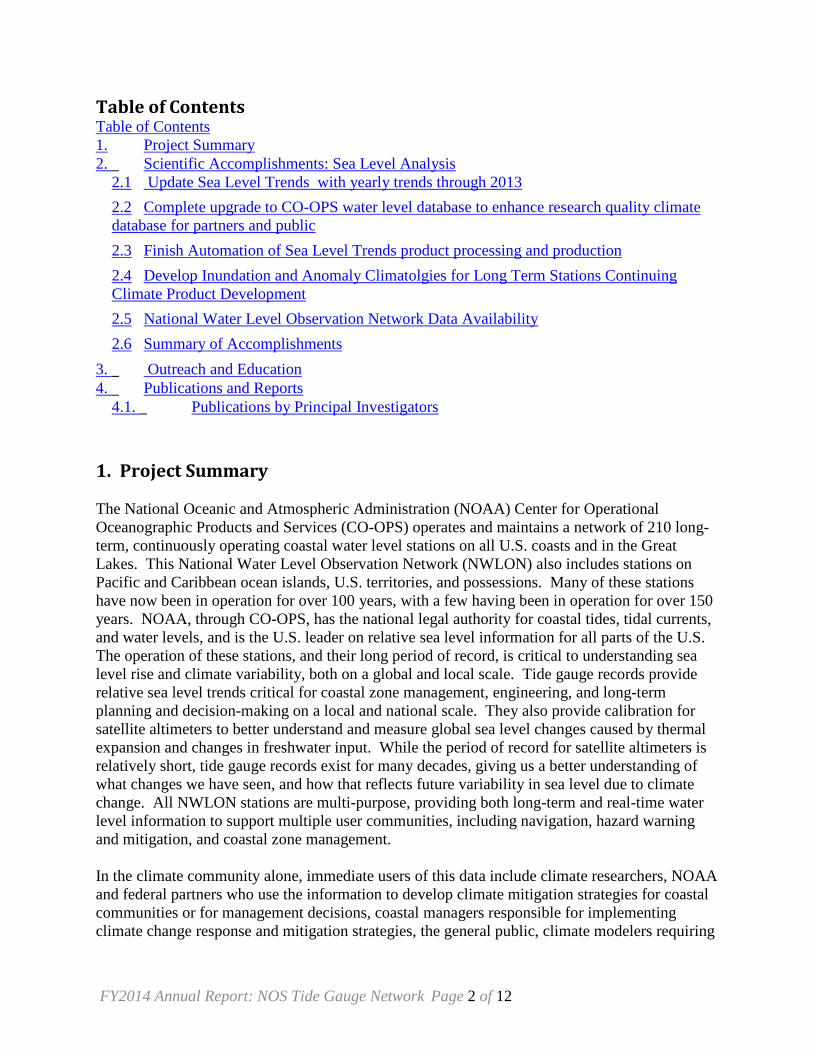
Table of Contents Table of Contents 1. Project Summary 2. _ Scientific Accomplishments: Sea Level Analysis
2.1 Update Sea Level Trends with yearly trends through 2013 2.2 Complete upgrade to CO-OPS water level database to enhance research quality climate database for partners and public 2.3 Finish Automation of Sea Level Trends product processing and production 2.4 Develop Inundation and Anomaly Climatolgies for Long Term Stations Continuing Climate Product Development 2.5 National Water Level Observation Network Data Availability 2.6 Summary of Accomplishments
3. _ Outreach and Education 4. _ Publications and Reports
4.1. _ Publications by Principal Investigators 1. Project Summary The National Oceanic and Atmospheric Administration (NOAA) Center for Operational Oceanographic Products and Services (CO-OPS) operates and maintains a network of 210 long-term, continuously operating coastal water level stations on all U.S. coasts and in the Great Lakes. This National Water Level Observation Network (NWLON) also includes stations on Pacific and Caribbean ocean islands, U.S. territories, and possessions. Many of these stations have now been in operation for over 100 years, with a few having been in operation for over 150 years. NOAA, through CO-OPS, has the national legal authority for coastal tides, tidal currents, and water levels, and is the U.S. leader on relative sea level information for all parts of the U.S. The operation of these stations, and their long period of record, is critical to understanding sea level rise and climate variability, both on a global and local scale. Tide gauge records provide relative sea level trends critical for coastal zone management, engineering, and long-term planning and decision-making on a local and national scale. They also provide calibration for satellite altimeters to better understand and measure global sea level changes caused by thermal expansion and changes in freshwater input. While the period of record for satellite altimeters is relatively short, tide gauge records exist for many decades, giving us a better understanding of what changes we have seen, and how that reflects future variability in sea level due to climate change. All NWLON stations are multi-purpose, providing both long-term and real-time water level information to support multiple user communities, including navigation, hazard warning and mitigation, and coastal zone management. In the climate community alone, immediate users of this data include climate researchers, NOAA and federal partners who use the information to develop climate mitigation strategies for coastal communities or for management decisions, coastal managers responsible for implementing climate change response and mitigation strategies, the general public, climate modelers requiring
FY2014 Annual Report: NOS Tide Gauge Network Page 3 of 12
local information to downscale global models and develop local projections, and many others. All CO-OPS data are available real-time, and products, including long-term trends and monthly and annual means, are available through the CO-OPS Sea Levels Trends web site, and are archived at all three Global Sea Level Observing System (GLOSS) archive centers. The data are also available through the Permanent Service for Mean Sea Level. Twenty-five NWLON stations currently constitute the U.S. contribution to the GLOSS Core Network, and 45 are part of the GLOSS-Long Term Trend (LTT) network. CO-OPS also supports the Global Earth Observation System of Systems (GEOSS) by providing on-line sea level trends and analysis for 240 international stations, including 77 in the GLOSS Core Network and 85 in the GLOSS-LTT network. CO-OPS operates and maintains the GLOSS Altimetry (ALT) tide gauge at the Oil Platform Harvest for satellite altimeter calibration and evaluation, and by maintaining the long-term tide station at Bermuda. These efforts directly support the NOAA Climate Program Office (CPO) deliverable with respect to sea level: to identify changes resulting from trends and variability in climate. Failure to continue operation of CO-OPS’ observing systems, update long-term time series, and analyze sea level trends on a national and global scale would cause a large gap in the Global Ocean Observing System for Climate and negatively impact understanding of both local and global sea level changes as an indicator of climate change. Additionally, local sea level trend information is being used more frequently by coastal planners and decision makers as policy is beginning to reflect better climate science. Hindering access to that information through lack of support for CO-OPS Sea Levels Trends and associated products would force managers to go back to making generalizations, often at the expense and risk of the general public through poor planning. 2. Scientific Accomplishments: Sea Level Analysis Sea level analysis accomplishments by CO-OPS in the area of climate variability can be divided into four primary tasks, as outlined in the FY14 work plan delivered by CO-OPS to CPO. FY14 work was primarily a continuation of the work begun in previous years, with some added benefit to CPO and the climate community through increased emphasis on global sea level analysis. All four tasks directly support the Climate Program Office’s sea level deliverable, to identify changes resulting from trends and variability in climate. These tasks are:
● Update Sea Level Trends with yearly trends through 2013 ● Complete upgrade of the CO-OPS water level database to enhance the research quality
climate database for partners and the public ● Finish automation of the Sea Level Trends product processing and production; continued
product development ● Develop East Coast inundation and anomaly climatologies for long term stations;
continuing product development .
2.1 Update Sea Level Trends with yearly trends through 2013
FY2014 Annual Report: NOS Tide Gauge Network Page 4 of 12
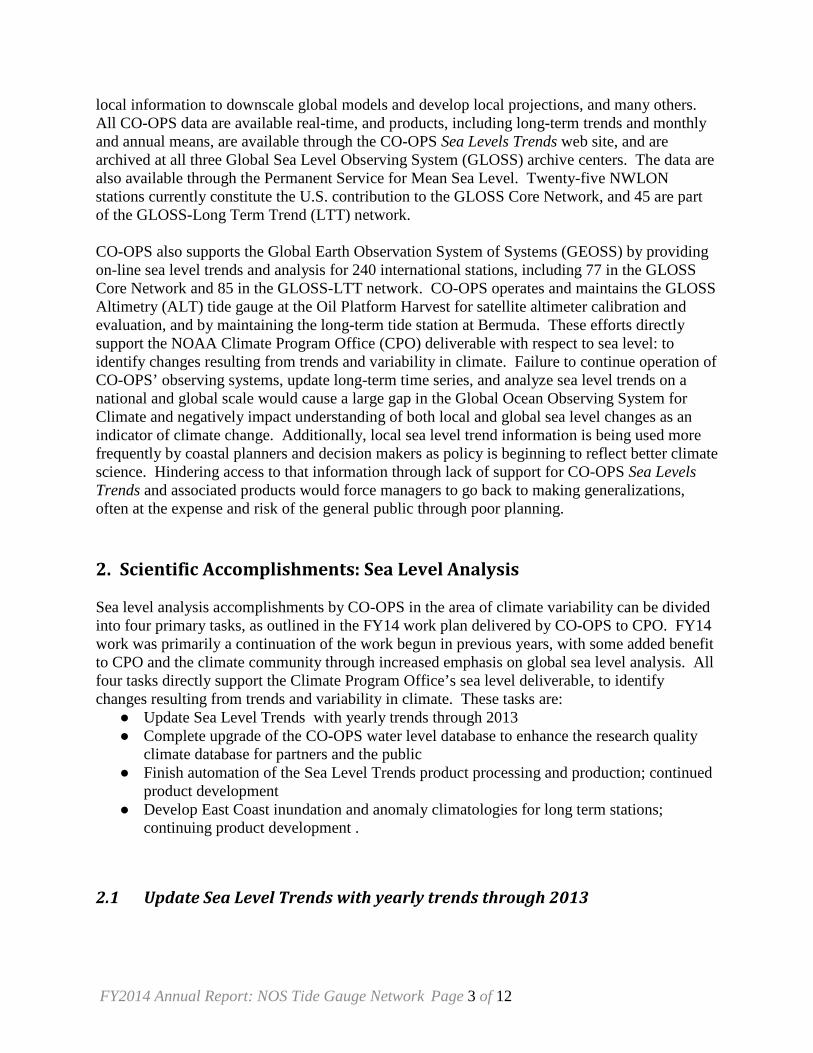
Between September 2008 and September 2014, the Sea Levels Trends website has displayed sea level trends for CO-OPS stations calculated with data up to the year 2006. In response to the needs of our users, such as coastal managers, CO-OPS adopted a policy of recalculating sea level trends every year since 2006 for all the stations still in operation and making the updated trends available on Sea Levels Trends. Since the 2006 trends were based on long data sets (of at least 30 years), the use of a few more years of data only makes the calculated trends slightly more precise. Comparisons of small year-to-year changes in trend should not be taken as evidence of acceleration or deceleration in the rate of sea level change. Therefore, Sea Levels Trends added a multiyear sea level trends comparison plot that exhibits the total trend variation from year to year (Figure 1).
Figure 1. Depicts yearly trend calculations from 2006-2012.
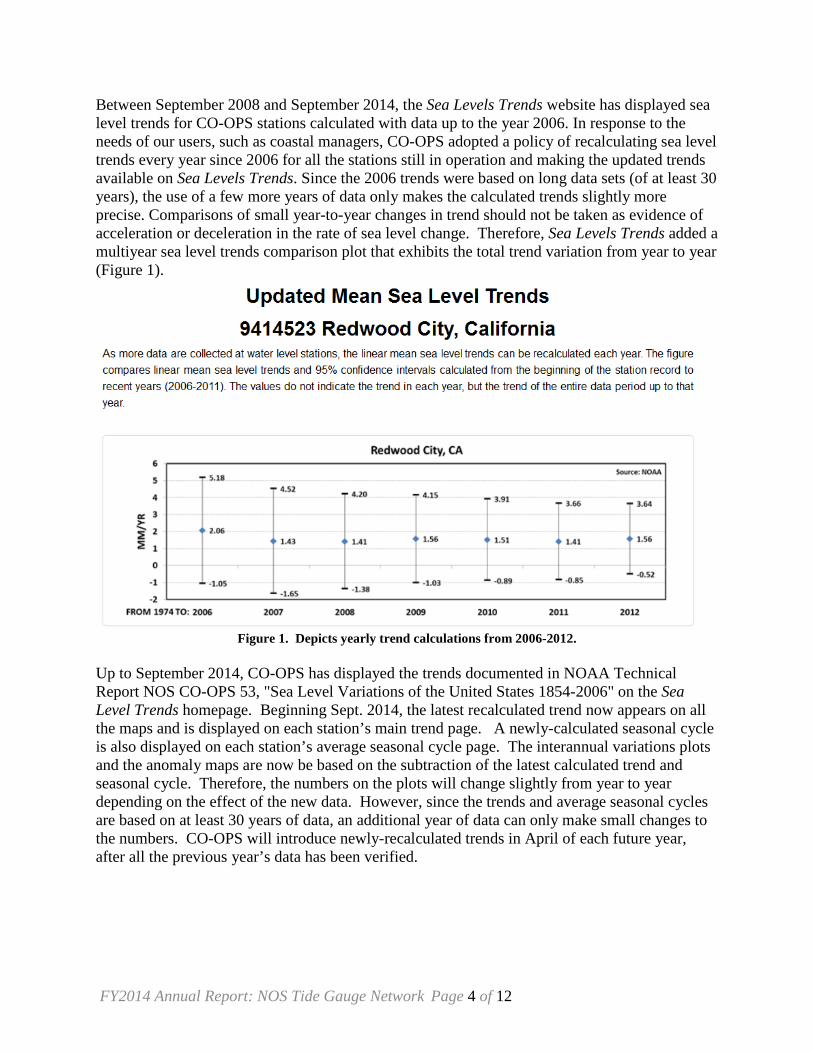
Up to September 2014, CO-OPS has displayed the trends documented in NOAA Technical Report NOS CO-OPS 53, "Sea Level Variations of the United States 1854-2006" on the Sea Level Trends homepage. Beginning Sept. 2014, the latest recalculated trend now appears on all the maps and is displayed on each station’s main trend page. A newly-calculated seasonal cycle is also displayed on each station’s average seasonal cycle page. The interannual variations plots and the anomaly maps are now be based on the subtraction of the latest calculated trend and seasonal cycle. Therefore, the numbers on the plots will change slightly from year to year depending on the effect of the new data. However, since the trends and average seasonal cycles are based on at least 30 years of data, an additional year of data can only make small changes to the numbers. CO-OPS will introduce newly-recalculated trends in April of each future year, after all the previous year’s data has been verified.
FY2014 Annual Report: NOS Tide Gauge Network Page 5 of 12
Figure 2. Online US sea level trends recalculated with all data up to 2013.
In summary of FY14 accomplishments, the identified task was:
● Update Sea Level Trends with yearly trends through 2013
The identified deliverables were: Deliverable a: Update sea level trends through 2013 are posted on Sea Levels Trends. This Deliverable has been completed.
2.2 Complete upgrade of the CO-OPS water level database to enhance the research quality climate database for partners and the public
CO-OPS has been compiling and quality controlling the data necessary to produce long term sea level trends. However, there are significant historical data records that are still in non-digital form and/or require additional quality control before public distribution. In addition, some are missing ancillary and metadata information in the existing CO-OPS database structures. By providing a verified long-term data set and eliminating any discrepancies in historic data, CO-OPS will help eliminate error in the utilization of the data for various climate applications. This
FY2014 Annual Report: NOS Tide Gauge Network Page 6 of 12
will also increase efficiency across the climate community and minimize inaccurate or conflicting information, as currently users of CO-OPS data are often forced to analyze portions of the record themselves if they want a full, verified, sea level record. This effort supports CPO’s sea level directive in understanding sea level variability by providing public access to a climate-quality sea level data record for the U.S. In FY13, through no additional CPO funding, work on compiling complete and accurate data sets, with appropriate metadata and ancillary data sets continued, and has been made available to the public. Though no additional funding will be requested, there will be deliverables detailing continued work in the FY14 work plan. In summary of FY14 accomplishments, the identified task was:
● Complete upgrade CO-OPS water level database to enhance research quality climate database for partners and the public
The identified deliverables were: Deliverable a: All historic sea level data reviewed and verified: Completed Deliverable b: Research-quality dataset available to the public for 156 NWLON stations Deliverable c: A complete metadata record for each station, including verified extreme water level information. Work on deliverable a and b is approximately 60% complete. Progress has also been made on deliverable c and is estimated to be complete in FY14.
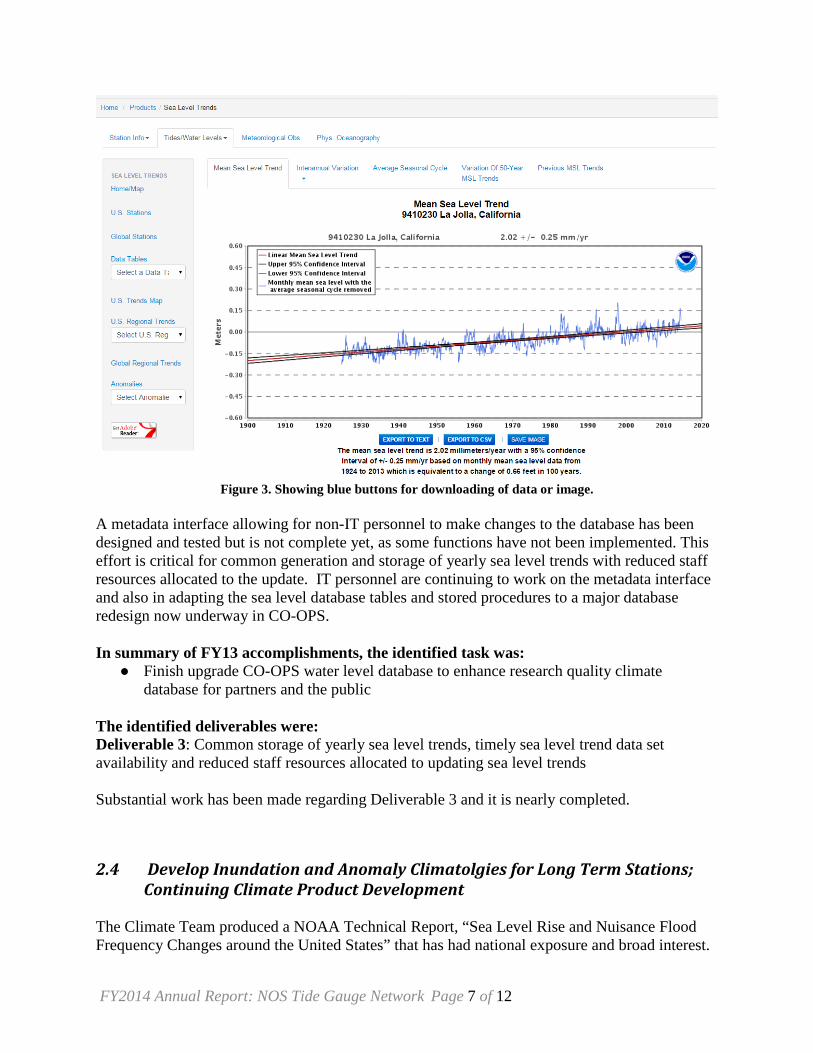
2.3 Finish Automation of Sea Level Trends product processing and production In FY14, substantial progress was made toward automating sea level trends processing and production, despite the impact of personnel changes on the IT division’s ability to focus on this project. Major accomplishments include creation and implemention of the new sea level trend database. Graphics and new webpages previously designed and tested on our internal development server are now available on our public website as of September 2014. Although the look of the website is the similar, several enhancements make the site more useful to the public.
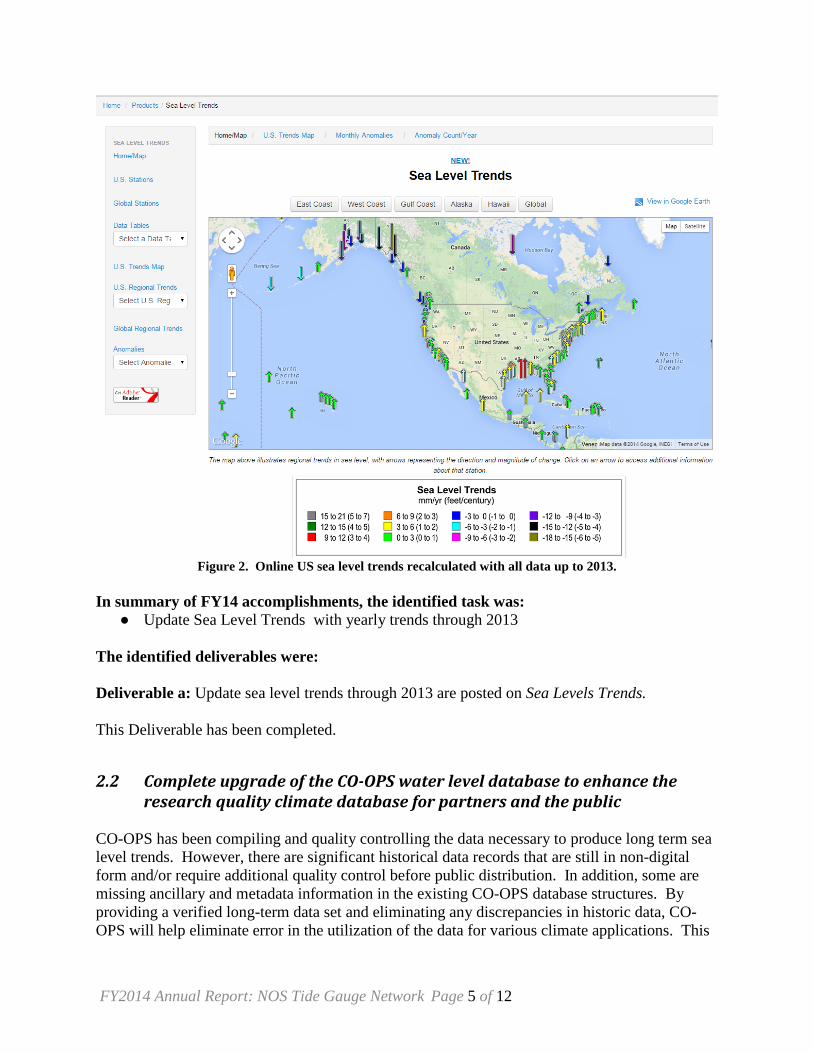
● All data displayed on a graph can be downloaded as a text file or comma-separated value (csv) file which can be easily read into spreadsheets. The option of downloading the graph as a png image is also available (Figure 3).
● Data in tables can be downloaded as a text file, a csv file, or as a formatted pdf file. ● Improved navigation through the website by page tabs. ● Global (non-U.S.) stations organized by region and country.
FY2014 Annual Report: NOS Tide Gauge Network Page 7 of 12
Figure 3. Showing blue buttons for downloading of data or image.
A metadata interface allowing for non-IT personnel to make changes to the database has been designed and tested but is not complete yet, as some functions have not been implemented. This effort is critical for common generation and storage of yearly sea level trends with reduced staff resources allocated to the update. IT personnel are continuing to work on the metadata interface and also in adapting the sea level database tables and stored procedures to a major database redesign now underway in CO-OPS. In summary of FY13 accomplishments, the identified task was:
● Finish upgrade CO-OPS water level database to enhance research quality climate database for partners and the public
The identified deliverables were: Deliverable 3: Common storage of yearly sea level trends, timely sea level trend data set availability and reduced staff resources allocated to updating sea level trends Substantial work has been made regarding Deliverable 3 and it is nearly completed.
2.4 Develop Inundation and Anomaly Climatolgies for Long Term Stations; Continuing Climate Product Development
The Climate Team produced a NOAA Technical Report, “Sea Level Rise and Nuisance Flood Frequency Changes around the United States” that has had national exposure and broad interest.
FY2014 Annual Report: NOS Tide Gauge Network Page 8 of 12
To help support clear messaging around the Sweet et al. (2014) report , CO-OPS has distilled this to three key messages, which are:
● Nuisance coastal is the most sensible consequence of climate change related sea level rise.
● Nuisance coastal flooding is rapidly increasing along the entire coastline of the continental U.S.
● The cumulative toll from increased nuisance flooding will have major impacts on our coastal communities by effecting storm drainage, road closures, and local economies.
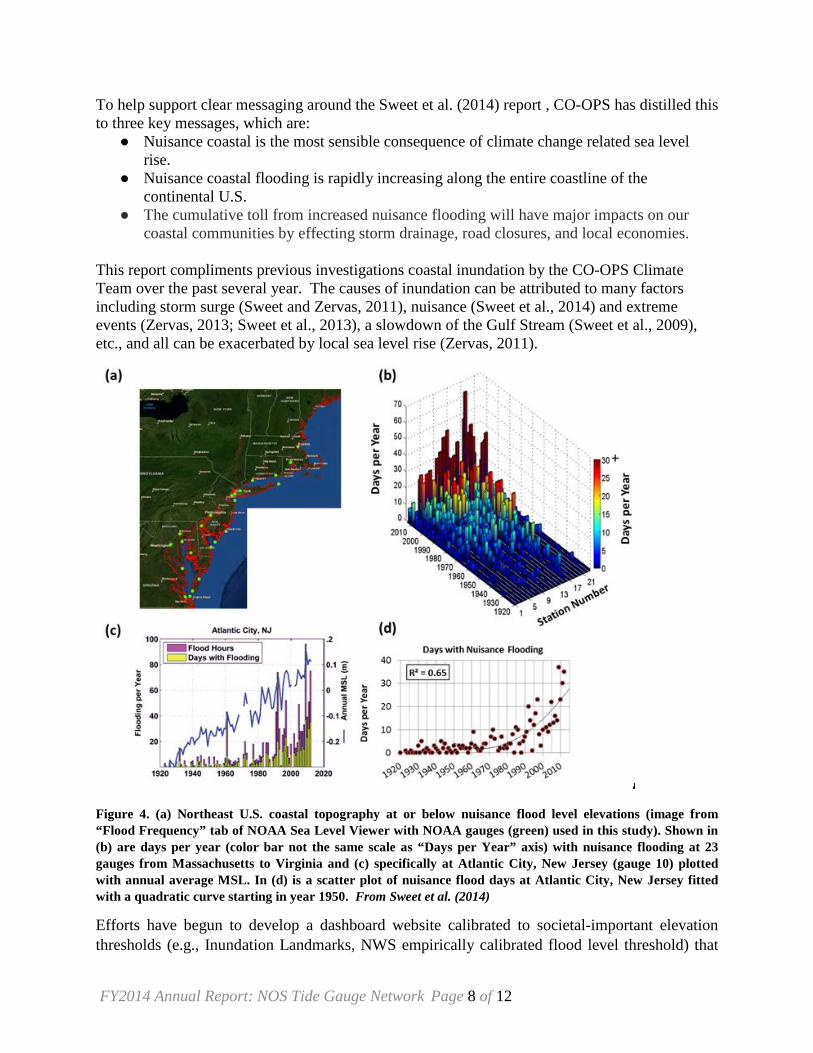
This report compliments previous investigations coastal inundation by the CO-OPS Climate Team over the past several year. The causes of inundation can be attributed to many factors including storm surge (Sweet and Zervas, 2011), nuisance (Sweet et al., 2014) and extreme events (Zervas, 2013; Sweet et al., 2013), a slowdown of the Gulf Stream (Sweet et al., 2009), etc., and all can be exacerbated by local sea level rise (Zervas, 2011).
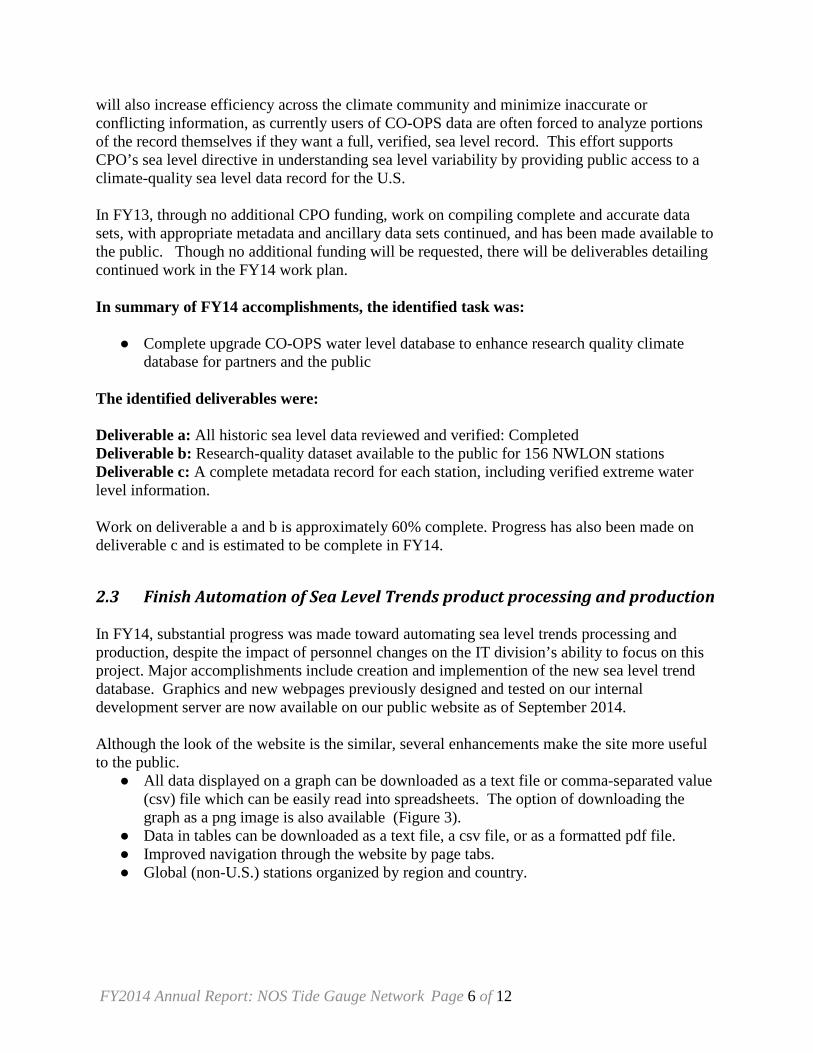
Figure 4. (a) Northeast U.S. coastal topography at or below nuisance flood level elevations (image from “Flood Frequency” tab of NOAA Sea Level Viewer with NOAA gauges (green) used in this study). Shown in (b) are days per year (color bar not the same scale as “Days per Year” axis) with nuisance flooding at 23 gauges from Massachusetts to Virginia and (c) specifically at Atlantic City, New Jersey (gauge 10) plotted with annual average MSL. In (d) is a scatter plot of nuisance flood days at Atlantic City, New Jersey fitted with a quadratic curve starting in year 1950. From Sweet et al. (2014)
Efforts have begun to develop a dashboard website calibrated to societal-important elevation thresholds (e.g., Inundation Landmarks, NWS empirically calibrated flood level threshold) that
FY2014 Annual Report: NOS Tide Gauge Network Page 9 of 12
CO-OPS could use to showcase relevant water level and meteorological products. The dashboard concept, which was presented at the MTS TechSurge workshop in Norfolk, VA in June 2014 (Sweet, 2014), would consist of these major features:
1. The aggregation of relevant products into an integrated place-based view. This portion of the dashboard would provide the user with a visualization of many products at a specific location (e.g., Hampton Roads) rather than users having to visit many different parts of the website and drilling down to the location of interest.
2. From this aggregation of local data, new products could be developed that will tell a story of inundation for the area, for example, scorekeeping for the number of inundation events in a set time, climatologies of water levels, storm and Gulf Stream anomaly information, and local sea level rise projections.
3. Continue the story of the place-based view of data with connecting existing statistics and static plots that provide a historical view of the location as well as an outlook.
This work has been in collaboration with both the NOAA SSP and NOAA’s Oceanic and Atmospheric Research Office of Climate Observations, because of the impacts related to climate change. Encouraged by this work, the NOAA SSP supported some prototyping of this dashboard, which aligns well with a NOAA SSP goal outlined in the requirements document, “Software Requirements Specification: Sentinel Site Program Portal Development.” This prototype will serve as a proof-of-concept for developing the behind the scenes algorithms for the dashboard, as conceptualized above. This effort will kickstart a future project to evolve this prototype into a published product. The prototype website is expected to be deployed in a beta state in early 2015. CO-OPS has committed to build upon this effort in a multiyear project that will expand on the audience and scope of this product.
In summary of FY13 accomplishments, the identified task was:
● Develop East Coast inundation and anomaly climatologies for long term stations continuing product development
The identified deliverables were: Deliverable 4a: Complete prototype East Coast Sea Level Alert/ Seasonal Outlook Deliverable 4b: Develop Standard Operating Procedure for completing inundation and anomaly climatology for long term stations Deliverable 4c: Begin completing inundation and anomaly climatologies for all CO-OPS’ long term stations Deliverable 4a is complete; Deliverable 4b is complete; Deliverable 4c prototye has been developed in a pilot area. In addition, partnering with NCDC Pacific RCS and NOAA SSP will facilitate prototype feedback and dissemination for other regions in FY14 and beyond.
FY2014 Annual Report: NOS Tide Gauge Network Page 10 of 12
2.5 National Water Level Observation Network Data Availability All CO-OPS real-time and long-term water level data and sea level trends are available through several channels. Real-time water level data are available for all CO-OPS tide gauges via the internet, web services, and the Global Telecommunications System. All raw and verified data and products, standards and procedures, and data analysis reports can be accessed through http://tidesandcurrents.noaa.gov. Data can also be accessed through the IOOS web portal at http://opendap.co-ops.nos.noaa.gov/content/. Sea level products are also available online, through the CO-OPS Sea Levels Trends web site for U.S. (http://tidesandcurrents.noaa.gov/sltrends/sltrends.shtml) and global (http://tidesandcurrents.noaa.gov/sltrends/sltrends_global.shtml) stations, as well as through the NOAA National Oceanic Data Center and others, which provide links to the CO-OPS website. Real time data are also available through the IOC Sea Level Station Monitoring Facility (http://www.ioc-sealevelmonitoring.org/) and CO-OPS works routinely with Vlaams Instituut voor de Zee to ensure data continuity and availability. Data are archived regularly in-house, and sea level data sets are provided to all GLOSS archive centers for U.S. GLOSS stations. One-minute water level data are archived weekly at the NOAA National Geophysical Data Center in Boulder, CO. CO-OPS personnel routinely verify access to the data through these channels to ensure availability. In 2013, data availability from the National Water Level Observation Network was over 96%.
2.6 Summary of Accomplishments In FY14, Sea Level Trends were recalculated with data collected from NWLON tide gauges through 2013. Significant progress was made toward enhancing CO-OPS water level database with review and verification of thousands of data records. Further progress was made towards automating the resource intense process of updating Sea Level Trends, which when complete, will allow freed resources to work on further product development. Significant effort has been put forth to publish science on changes to water level based on sea level rise and prototype ways to visualize and track those incidents. A prototype East Coast Sea Level Alert/ Seasonal Outlook has been develop and Standard Operating Procedure for completing inundation and anomaly climatology for long term stations have been completed. We have also begun completing inundation and anomaly climatologies fo all CO-OPS’ long term stations If that funding support is decreased in the future, all of the work above will be at risk. Without the information and tools that CO-OPS provides, climate researchers would not have the raw data they need to understand changes in sea level, and coastal decision makers would not have that translated information available for management decisions that protect life and property.
3. Outreach and Education NOS/CO-OPS routinely engages in education and outreach to multiple stakeholders. In particular, there is a growing need to translate technical climate data and products (especially sea level trends) into understandable and actionable information. CO-OPS personnel work closely
FY2014 Annual Report: NOS Tide Gauge Network Page 11 of 12
with coastal managers, through training and one-on-one technical guidance, to explain and provide recommendations on incorporating sea level information into policy and planning. Additionally, CO-OPS is very involved in activities through NOAA’s Coastal Resilience Objective, as defined in the Next Generation Strategic Plan. Through this objective, CO-OPS has been working with other NOS offices to document protocols necessary for establishing NOAA Trust Resources as “sentinel sites for climate change impacts,” one component of NOAA’s emerging Sentinel Sites Program. This includes determining which areas require additional sea level monitoring, and how to tie sea level stations to geodetic infrastructure, to establish a complete picture of local land/sea interactions and local coastal processes in the face of climate change. Through this cross-NOAA effort, we have also been working with the National Estuarine Research Reserve’s Coastal Training Program and NOAA’s Coastal Services Center (CSC) to inform sea level training and education activities. We worked with CSC and partner agencies on a new sea level rise visualization tool for the Gulf Coast, and are working with CSC and the National Weather Service to improve protocols for coastal flood warnings by integrating CO-OPS’ statistical inundation analysis with CO-OPS sea level trends. We have also worked with a number of internal and external partners to provide guidance on utilization of CO-OPS sea level trends in conjunction with sea level projections for various coastal applications, including habitat restoration, coastal engineering, and land acquisition and planning. We have specifically been supporting the U.S. Army Corps of Engineers with their development of formal engineering guidance for including sea level change in project planning and design. There have been 50+ news stories highlighting the issues of increased nuisance coastal flooding from the Sweet et al. (2014) study with a few listed below: NOAA Newsroom http://www.noaanews.noaa.gov/stories2014/20140728_nuisanceflooding.html Climate Change Worsens Coastal Flooding From ... - NPR www.npr.org › News › Science NPR (http://www.npr.org/2014/10/08/354166982/climate-change-worsens-coastal-flooding-from-high-tides) Annoying minor floods are increasing on US coasts Washington Post US coastal flooding on the rise, government study finds Reuters-Jul 28, 2014 “We stress that in many areas, the frequency of nuisance flooding is ... William Sweet, a NOAA oceanographer and lead author of the study. Study: Sea levels drive up flooding The News Journal-12 hours ago Among 45 locations that NOAA studied on all coasts and Hawaii, Annapolis, ... “It's those nuisance flooding issues that will really drive the ...
FY2014 Annual Report: NOS Tide Gauge Network Page 12 of 12
Minor floods are increasing on US coasts The Virginian-Pilot - 14 hours ago The National Oceanic and Atmospheric Administration studied coastal trends in what it calls nuisance flooding, where no one is hurt but people have to deal with flooded roads and buildings. While scientists and the public spend a lot of time dealing with giant events, such as a hurricane, it is minor floods that people feel more often, though not as severely, said NOAA's Margaret Davidson. "It's the stuff that keeps you from conducting your business or picking up your kids from school," Davidson said. "It is clear that ... 4. Publications and Reports 4.1. Publications by Principal Investigators The following publications were completed in the last Fiscal Year. Park, J., R. Heitsenrether, and W. Sweet, (2014). Water Level and Wave Height Estimates at
NOAA Tide Stations from Acoustic and Microwave Sensors. J. Atmos. Oceanic Technol., 31, 2294–2308. doi: http://dx.doi.org/10.1175/JTECH-D-14-00021.1
Sweet, W.V., C. Zervas, S. Gill, J. Park (2013). Hurricane Sandy Inundation Probabilities
Today and Tomorrow [In “Explaining Extreme Events of 2012 from a Climatic Perspective”], Bull Amer. Meteor. Soc., 94 (9), S17-20.
Sweet, W.V., J. Park, J. J. Marra, C. Zervas, S. Gill (2014), Sea Level Rise and Nuisance Flood
Frequency Changes around the United States, NOAA Technical Report NOS COOPS 73, 53 pp.
Zervas, C., S. Gill, W. Sweet (2013). Estimating vertical land motion from long-term tide gauge
records. NOAA Technical Report, NOS CO-OPS 65, Silver Spring, Maryland.