Embed Size (px)
Citation preview
The Centre for Australian Weather and Climate Research A partnership between CSIRO and the Bureau of Meteorology
Australian fire weather as represented by the McArthur Forest Fire Danger Index and the Canadian Forest Fire Weather Index Andrew J. Dowdy, Graham A. Mills, Klara Finkele and William de Groot CAWCR Technical Report No. 10 June 2009
Australian fire weather as represented by the McArthur Forest Fire Danger Index and the
Canadian Forest Fire Weather Index
Andrew J. Dowdy1,2, Graham A. Mills1,2, Klara Finkele1,2 and William de Groot3
1Centre for Australian Weather and Climate Research 2Bushfire Cooperative Research Centre
3Canadian Forest Service
CAWCR Technical Report No. 10
June 2009
ISSN: 1836-019X
National Library of Australia Cataloguing-in-Publication entry
Title: Australian fire weather as represented by the McArthur Forest Fire Danger Index and the Canadian Forest Fire Weather Index [electronic resource] / Andrew J. Dowdy ... [et al.]. ISBN: 9781921605185 (pdf) Series: CAWCR technical report ; 10. Notes: Bibliography. Subjects: Fire weather--Australia--Forecasting. Other Authors/Contributors: Dowdy, Andrew J. (Andrew James), 1975- Centre for Australian Weather and Climate Research. Australia. Bureau of Meteorology. CSIRO. Dewey Number: 551.630994
Enquiries should be addressed to: Dr Andrew J. Dowdy Centre for Australian Weather and Climate Research: A partnership between the Bureau of Meteorology and CSIRO GPO Box 1289, Melbourne Victoria 3001, Australia [email protected]
Copyright and Disclaimer
© 2009 CSIRO and the Bureau of Meteorology. To the extent permitted by law, all rights are reserved and no part of this publication covered by copyright may be reproduced or copied in any form or by any means except with the written permission of CSIRO and the Bureau of Meteorology.
CSIRO and the Bureau of Meteorology advise that the information contained in this publication comprises general statements based on scientific research. The reader is advised and needs to be aware that such information may be incomplete or unable to be used in any specific situation. No reliance or actions must therefore be made on that information without seeking prior expert professional, scientific and technical advice. To the extent permitted by law, CSIRO and the Bureau of Meteorology (including each of its employees and consultants) excludes all liability to any person for any consequences, including but not limited to all losses, damages, costs, expenses and any other compensation, arising directly or indirectly from using this publication (in part or in whole) and any information or material contained in it.
i
Contents
Abstract..........................................................................................................................1
Introduction ...................................................................................................................3 1.1 Overview of the FFDI................................................................................................ 4 1.2 Overview of the FWI System .................................................................................... 5
1.2.1 Fire Weather Observations ................................................................................... 5 1.2.2 Fuel Moisture Codes............................................................................................. 5 1.2.3 Fire Behaviour Indices .......................................................................................... 6
2. Data processing...................................................................................................7 2.1 Observational rainfall analyses................................................................................. 7 2.2 MESOLAPS forecast data ........................................................................................ 7 2.3 Historical data considerations................................................................................... 9
3. Variability of fire weather in Australia................................................................9 3.1 Spatial variability....................................................................................................... 9 3.2 Seasonal cycle........................................................................................................ 11
4. The relationship between the FFDI and FWI ...................................................14 4.1 The national median relationship............................................................................ 15 4.2 Scatter plots............................................................................................................ 17 4.3 Detailed examination of differences ....................................................................... 22
5. Sensitivity to input parameters ........................................................................29 5.1 Index derivatives..................................................................................................... 29
5.1.1 Derivatives of the FFDI ....................................................................................... 29 5.1.2 Derivatives of the FWI......................................................................................... 31 5.1.3 Sensitivity differences based on derivatives........................................................ 33
5.2 The relative sensitivities of the input parameters ................................................... 34 5.3 Equilibrium values................................................................................................... 36
5.3.1 Sensitivity to long-term changes ......................................................................... 36 5.3.2 Scatter plots of equilibrium values ...................................................................... 37
6. Case studies.......................................................................................................40 6.1 Overview................................................................................................................. 40 6.2 Individual events ..................................................................................................... 41
6.2.1 The Warragamba fire of December 2001............................................................ 41 6.2.2 The Canberra fire of January 2003 ..................................................................... 46 6.2.3 The Wangary fire of January 2005...................................................................... 50 6.2.4 The Bridgetown fire of March 2005 ..................................................................... 54 6.2.5 The Wilsons Promontory fire of April 2005.......................................................... 58 6.2.6 The Scamander fire of December 2006 .............................................................. 63
6.3 Summary of the case studies ................................................................................. 68
Australian fire weather as represented by the McArthur Forest Fire Danger Index and the Canadian Forest Fire Weather Index
ii
7. Summary and discussion................................................................................. 69
Acknowledgements.................................................................................................... 71
References .................................................................................................................. 71
Appendix A: Documentation of the Australian implementation of the Canadian FWI System........................................................................................................ 74 A.1 Fine Fuel Moisture Code ............................................................................................74
A.1.1 The influence of rainfall............................................................................................... 74 A.1.2 The influence of atmospheric drying or wetting........................................................... 75 A.1.3 New moisture content ................................................................................................. 76
A.2 Duff Moisture Code.....................................................................................................76 A.2.1 Rainfall phase ............................................................................................................. 76 A.2.2 Drying phase............................................................................................................... 77 A.2.3 New Duff Moisture Code............................................................................................. 78
A.3 Drought Code .............................................................................................................78 A.3.1 Rainfall phase ............................................................................................................. 78 A.3.2 Drying phase............................................................................................................... 79 A.3.3 New Drought Code ..................................................................................................... 79
A.4 Initial Spread Index .....................................................................................................80 A.5 Buildup Index ..............................................................................................................81 A.6 Fire Weather Index .....................................................................................................82 A.7 Hourly Fire Weather Index..........................................................................................84
1
ABSTRACT
The characteristics of the McArthur Forest Fire Danger Index and the Canadian Fire Weather Index are investigated for Australian conditions using eight years of gridded data. The spatial and temporal variability of fire weather in Australia is examined using these indices. The formulations of the indices are examined using a number of novel model evaluation methodologies. The indices are found to be similar to each other on a broad scale in that they are both most sensitive to wind speed, then secondly to relative humidity and thirdly to temperature. On a finer scale, derivatives of the indices show that the McArthur Forest Fire Danger Index is relatively more sensitive to temperature and relative humidity, and less sensitive to wind speed and rainfall, than the Canadian Fire Weather Index. These sensitivity differences mean that the indices are complementary to each other, in that they each respond to a somewhat different set of conditions, as is shown by examining a number of recent fire events. The fire events also reveal that index values associated with dangerous fire behaviour can vary greatly between different climatic regions. Methods to reduce the consequences of this variation are examined, including the use of index percentiles.
Australian fire weather as represented by the McArthur Forest Fire Danger Index and the Canadian Forest Fire Weather Index
2
3
INTRODUCTION
Fire danger indices are used in many parts of the world to integrate meteorological and fuel information into a single or small number of measures. These measures can then be applied to regions for the issuing of warnings, or more locally to estimate the suppression difficulty of a single fire or fire complex.
In Australia the McArthur Forest Fire Danger Index (FFDI) (McArthur 1967) is widely used to forecast the influence of weather on fire behaviour, and the Australian Bureau of Meteorology routinely issues forecasts of Grassland and Forest Fire Danger Index (GFDI and FFDI) for use by fire authorities. Perhaps the two other most widely used fire weather indices are the Canadian Forest Fire Weather Index (FWI) System (Van Wagner 1987) and the US National Fire Danger Ratings System (NFDRS) (Deeming et al. 1978). A study comparing five different indices in six different regions of France, Italy and Portugal (of which the FFDI and NFDRS were not included) found that the FWI System showed the best performance (Viegas et al. 1999). A recent study by Cruz and Plucinski (2007) for Radiata Pine plantations in Australia showed that the Canadian System provided a better indication of extreme fire behaviour than the McArthur system. The FWI System is adaptable enough to have been implemented in countries with very different climates to Canada, including countries close to Australia such as New Zealand, Indonesia and Malaysia (Dudfield 2004, de Groot et al. 2006), as well as many other countries (see Taylor and Alexander 2006).
This report describes an implementation of the FWI System over Australia using gridded numerical weather prediction model fields and an 8-year data set of daily values. The FWI fields are compared with an equivalent set of FFDI fields (calculated from the same set of meteorological inputs). The study is predominantly based on numerical weather prediction (NWP) data, in contrast to station based data, since NWP data more readily allow for a consistent spatial distribution of data throughout Australia.
The FFDI has an associated set of classification thresholds ranging from low to extreme as shown in Table 1. The Australia-wide threshold for a fire weather warning to be issued was originally set at a value of the FFDI equal to 50. In Tasmania, this threshold has been lowered to 24 because significant fire activity was happening at these levels. To support the use of this lower threshold, two further arguments were used. First, the warning is a public message and if the level were set at 50, the warning would be issued too infrequently to be effective. Second, implicit in the FFDI is an assumption of a standard fuel load which is significantly exceeded in the densely forested parts of Tasmania.
The use of a different threshold for Tasmania than for mainland Australia suggests that the significance of an index value can vary between different regions, yet the currently used warning system is based on applying the same thresholds across a wide range of different climatic regions. Accordingly, the variability and significance (where significance is assessed in terms of the ranking of the magnitude of the index relative to its climate at that location) of FFDI and FWI index values throughout Australia are examined in this report, and enhancements to warning systems based purely on index thresholds are discussed.
Australian fire weather as represented by the McArthur Forest Fire Danger Index and the Canadian Forest Fire Weather Index
4
The data sets and processing techniques used to generate the FFDI and FWI for this report are described in Chapter 2. Chapter 3 presents the spatial variability and seasonal cycles of the indices, providing a general overview of the characteristics of the indices throughout Australia. A detailed comparison of the FWI and FFDI is presented in Chapter 4, including the determination of a relationship between the two indices. Chapter 5 investigates the sensitivity of the indices to their input parameters, including an examination of the derivatives of the indices. Chapter 6 applies the results of the previous chapters to examine six recent fire events. The results of the entire report are then summarised and discussed in Chapter 7.
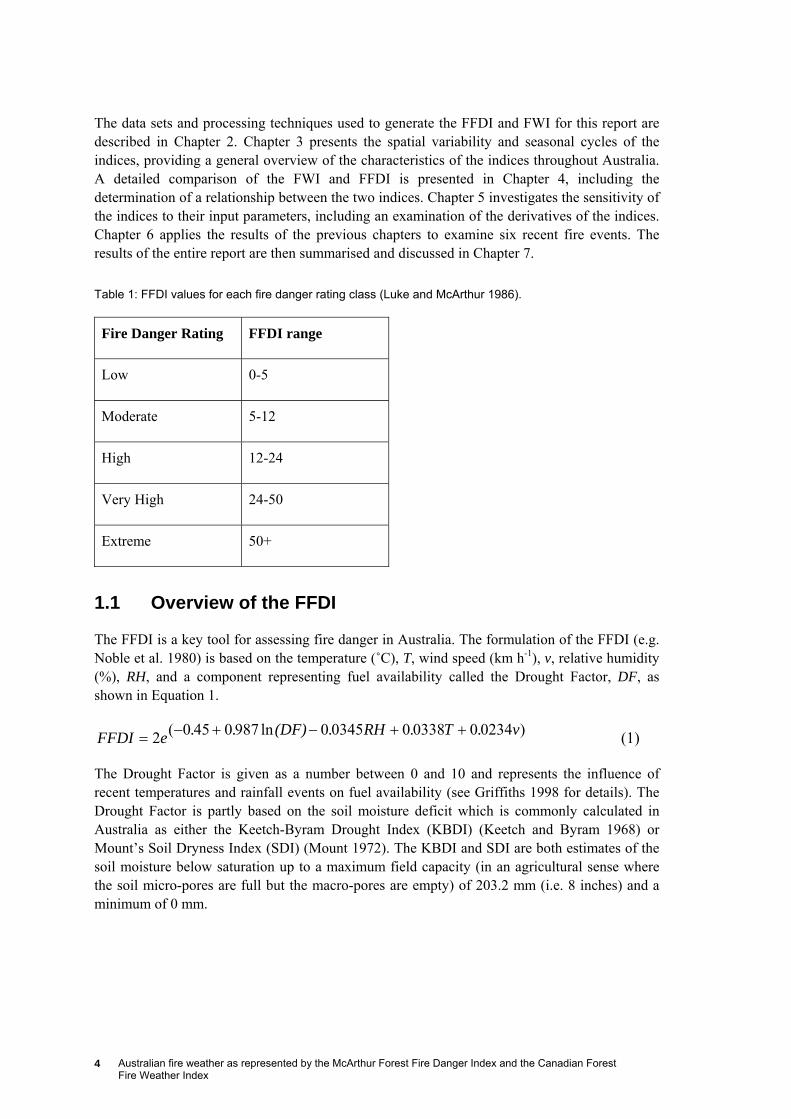
Table 1: FFDI values for each fire danger rating class (Luke and McArthur 1986).
Fire Danger Rating FFDI range
Low 0-5
Moderate 5-12
High 12-24
Very High 24-50
Extreme 50+
1.1 Overview of the FFDI
The FFDI is a key tool for assessing fire danger in Australia. The formulation of the FFDI (e.g. Noble et al. 1980) is based on the temperature (˚C), T, wind speed (km h-1), v, relative humidity (%), RH, and a component representing fuel availability called the Drought Factor, DF, as shown in Equation 1.
)023400338003450ln9870450(2 v.T.RH.(DF)..eFFDI ++−+−= (1)
The Drought Factor is given as a number between 0 and 10 and represents the influence of recent temperatures and rainfall events on fuel availability (see Griffiths 1998 for details). The Drought Factor is partly based on the soil moisture deficit which is commonly calculated in Australia as either the Keetch-Byram Drought Index (KBDI) (Keetch and Byram 1968) or Mount’s Soil Dryness Index (SDI) (Mount 1972). The KBDI and SDI are both estimates of the soil moisture below saturation up to a maximum field capacity (in an agricultural sense where the soil micro-pores are full but the macro-pores are empty) of 203.2 mm (i.e. 8 inches) and a minimum of 0 mm.
5
1.2 Overview of the FWI System
The Canadian Forest Fire Weather Index (FWI) System was developed in 1970, with revised versions issued in 1976, 1984 and 1987. The Australian implementation is based on the 1987 version (Van Wagner 1987), with modifications to its day length dependency to make it a continuous function in both latitude and time of year, potentially allowing it to be applied globally (as described in Appendix A). An hourly version of the FWI System has also been developed (as described in Section A.7 of Appendix A).
The FWI System is based on the effects of weather parameters on forest floor fuel moisture conditions and generalised fire behaviour in a standard jack pine stand (Van Wagner 1974). It requires calibration of its classification thresholds to suit local climatic conditions which is usually accomplished through an analysis of historical fire weather data (e.g. de Groot et al. 2005). In this report, fire danger classification thresholds for the FWI have been proposed based on the classification thresholds of the FFDI, using a statistical approach to convert between the two systems.
The FWI System is one of the primary inputs to the Canadian Forest Fire Behaviour Prediction (FBP) System (Forestry Canada Fire Danger Group 1992). The FBP System also uses fuel type and topography information to estimate fire behaviour. The primary outputs of the FBP System include the rate of fire spread and fuel consumption. The secondary outputs of the FBP System include the rate of perimeter growth and the head, flank and back fire spread distances.
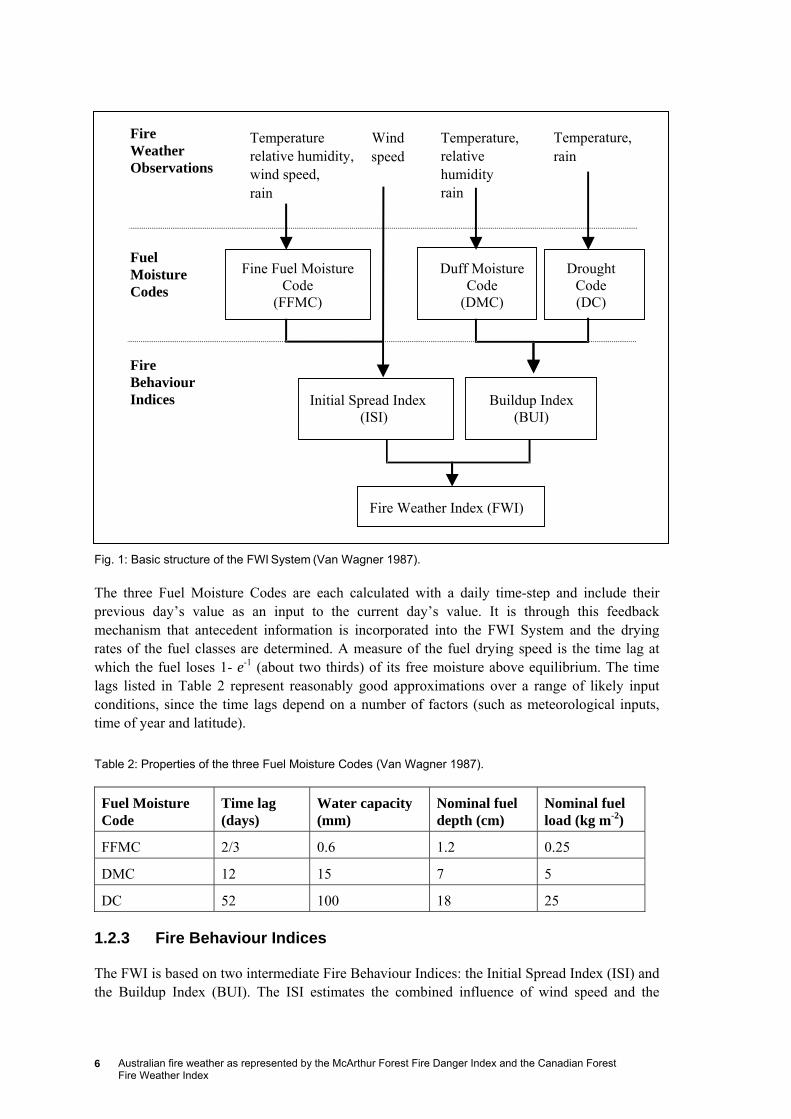
The FWI System consists of several components as shown in Fig. 1. An understanding of the relationships between these individual components aids interpretation of the output indices. A summary of the components is presented in the following subsections (for further details see Van Wagner 1987).
1.2.1 Fire Weather Observations
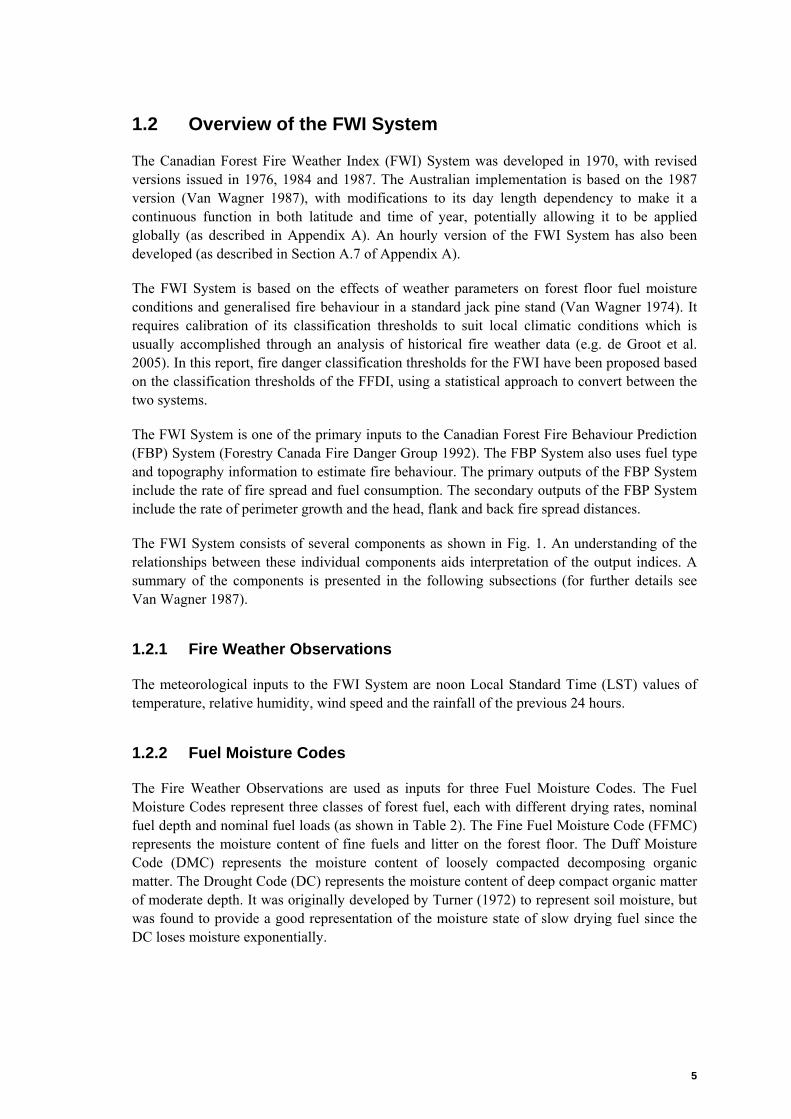
The meteorological inputs to the FWI System are noon Local Standard Time (LST) values of temperature, relative humidity, wind speed and the rainfall of the previous 24 hours.
1.2.2 Fuel Moisture Codes
The Fire Weather Observations are used as inputs for three Fuel Moisture Codes. The Fuel Moisture Codes represent three classes of forest fuel, each with different drying rates, nominal fuel depth and nominal fuel loads (as shown in Table 2). The Fine Fuel Moisture Code (FFMC) represents the moisture content of fine fuels and litter on the forest floor. The Duff Moisture Code (DMC) represents the moisture content of loosely compacted decomposing organic matter. The Drought Code (DC) represents the moisture content of deep compact organic matter of moderate depth. It was originally developed by Turner (1972) to represent soil moisture, but was found to provide a good representation of the moisture state of slow drying fuel since the DC loses moisture exponentially.
Australian fire weather as represented by the McArthur Forest Fire Danger Index and the Canadian Forest Fire Weather Index
6
Fig. 1: Basic structure of the FWI System (Van Wagner 1987).
The three Fuel Moisture Codes are each calculated with a daily time-step and include their previous day’s value as an input to the current day’s value. It is through this feedback mechanism that antecedent information is incorporated into the FWI System and the drying rates of the fuel classes are determined. A measure of the fuel drying speed is the time lag at which the fuel loses 1- e-1 (about two thirds) of its free moisture above equilibrium. The time lags listed in Table 2 represent reasonably good approximations over a range of likely input conditions, since the time lags depend on a number of factors (such as meteorological inputs, time of year and latitude).
Table 2: Properties of the three Fuel Moisture Codes (Van Wagner 1987).
Fuel Moisture Code
Time lag (days)
Water capacity (mm)
Nominal fuel depth (cm)
Nominal fuel load (kg m-2)
FFMC 2/3 0.6 1.2 0.25
DMC 12 15 7 5
DC 52 100 18 25
1.2.3 Fire Behaviour Indices
The FWI is based on two intermediate Fire Behaviour Indices: the Initial Spread Index (ISI) and the Buildup Index (BUI). The ISI estimates the combined influence of wind speed and the
Fire
Weather Observations
Fuel Moisture Codes
Temperature relative humidity, wind speed, rain
Temperature, relative humidity rain
Temperature, rain
Wind speed
Fine Fuel Moisture Code
(FFMC)
Drought Code (DC)
Duff Moisture Code
(DMC)
Initial Spread Index (ISI)
Buildup Index (BUI)
Fire Weather Index (FWI)
Fire Behaviour Indices
7
FFMC on fire spread. It is a simple exponential function which doubles the FWI for increases in wind speed of about 20 km h-1. The BUI is a combination of the DMC and the DC, representing the availability of the deeper or larger-sized fuel. The ISI and the BUI are combined to determine the value of the FWI, representing the peak daily intensity of the spreading fire as the energy output rate per unit length of fire front (Van Wagner 1987).
2. DATA PROCESSING
The FFDI and FWI systems are both based on the current day’s temperature, relative humidity and wind speed, as well as the rainfall of the past 24 hours. To allow comparisons to be made between the two indices they have both been calculated to represent the daily peak fire conditions. The FWI System was originally formulated by correlating noon values of temperature, relative humidity and wind speed with the daily maximum fire behaviour (Van Wagner 1987). This means that although noon values of these parameters are used, the FWI System is actually indicative of the most severe fire conditions on a given day (which usually occur mid-afternoon). In contrast, the FFDI uses the daily maximum temperature to indicate the most severe fire conditions on a given day. For this report, temperature, wind speed and relative humidity data have been obtained from NWP analyses at noon for the FWI System, and generally mid-afternoon for the FFDI, while rainfall data have been acquired from an observational data set.
2.1 Observational rainfall analyses
A gridded analysis of daily rainfall observations is currently available at a resolution of 0.25 degrees in both latitude and longitude across Australia (Weymouth et al. 1999). This gridded rainfall dataset has been used to calculate both the FFDI and FWI systems. The daily rainfall analysis is valid for 9 a.m. local time and is produced in real-time with some 1200 reports potentially available nationally. In non-real-time, about 5000-6000 reports are received, and the Bureau of Meteorology National Climate Centre produces a “final” rainfall analysis about two or three months after the event utilising this larger amount of data. This larger data set has been used to produce the indices presented in this report, whereas for forecasting purposes the indices are produced using the real-time rainfall analysis.
In some parts of the country, mainly the central desert regions (e.g. the Gibson Desert, the Great Victorian Desert and the Simpson Desert), the rainfall observation network is very sparse. These areas are therefore not used for the analyses presented in this report. Since these regions are sparsely vegetated, their omission does not significantly limit the aims of this report.
2.2 MESOLAPS forecast data
Due to a lack of available gridded observations of temperature, relative humidity and wind speed, short range forecasts have been used for these parameters from MESOLAPS (see Puri et
Australian fire weather as represented by the McArthur Forest Fire Danger Index and the Canadian Forest Fire Weather Index
8
al. 1998 for details). The MESOLAPS forecasts have a resolution of 0.125 degrees in both latitude and longitude, but have been resampled (compressed) for the purposes of this report to match the 0.25 degree resolution of the observed rainfall data. Consequently, the indices used in this report have a resolution of 0.25 degrees in both latitude and longitude throughout Australia (which is approximately a grid of about 25 km by 25 km).
The Bureau of Meteorology archive of MESOLAPS forecasts is available from 10 October 1999 onwards. Two sets of forecasts are produced each day. Prior to 19 February 2002 the analysis times of the forecasts were 1100 UTC and 2300 UTC, after which they changed to 1200 UTC and 0000 UTC. From each analysis time, forecasts are available at multiple terrain-following vertical sigma (pressure scaled by surface pressure) levels for three hourly intervals out to 48 hours past the analysis time.
The FWI System requires data valid at noon Local Standard Time (LST) to estimate the daily peak fire conditions. Noon LST corresponds to about 0200 UTC in eastern Australia and 0400 UTC in Western Australia (daylight saving time has not been used for this report). The three-hour forecast from the 0000 UTC analyses (or the 2300 UTC analyses prior to 19 February 2002) has been used to represent the noon values required by the FWI System since it is the closest available forecast to noon throughout Australia.
The FFDI uses the maximum daily temperature to calculate the daily peak fire conditions. The six-hour forecast from the 0000 UTC analyses (or the 2300 UTC analyses prior to 19 February 2002) has been used for the FFDI, except in cases where the 0300 UTC temperature is greater than the 0600 UTC temperature in which case the 0300 UTC forecast has been used.
A known issue with the MESOLAPS forecasts is that they tend to underestimate wind speeds as compared with observations. To reduce this bias, wind speed is calculated here as the average of the 10 m wind speed and the gust speed (calculated as the peak wind speed in the mixed layer). This wind speed has been used in daily forecasts of FFDI based on MESOLAPS forecasts since the summer of 2006-7 following the analysis of meteograms such as those described in Mills (2005).
The MESOLAPS forecasts have occasionally not been archived due to technical reasons. In these cases, the missing forecasts have been replaced by the nearest available previous forecasts as listed in Table 3.
9
Table 3: Missing MESOLAPS forecasts and replacements used.
Missing Forecasts Replacement Forecasts
2300 UTC 19/10/1999 1100 UTC 19/10/1999
1100 UTC and 2300 UTC 26/2/2000 2300 UTC 25/2/2000
2300 UTC 16/4/2000 1100 UTC 16/4/2000
2300 UTC 15/7/2000 1100 UTC 15/7/2000
2300 UTC 19/8/2000 1100 UTC 19/8/2000
0000 UTC 1/1/2003 1200 UTC 31/12/2002
0000 UTC 15/5/2006 1200 UTC 14/5/2006
2.3 Historical data considerations
Complete sets of input data are available from 1 October 1999 onwards. However, it is necessary to initialise the indices with a significant amount of historical input data. It is for this reason that the first three months of data (i.e. from October to December 1999) have been used to allow the indices to ‘spin-up’, which means that the indices have only been used for this report from 1 January 2000 onwards. A spin-up period of three months is expected to be sufficient given that the longest time lag listed in Table 2 is about 50 days.
A historical record of the FFDI and FWI systems is therefore available from 1 January 2000 onwards. The calculation of the indices is an ongoing process, although this report is only based on data up to 31 December 2007, resulting in an eight year data set being available for this report.
3. VARIABILITY OF FIRE WEATHER IN AUSTRALIA
The spatial variability and seasonal cycle of fire weather as represented by the FFDI and FWI are demonstrated in this chapter. This provides a general overview of the characteristics of the indices throughout Australia for use as a reference by the following chapters of this report.
3.1 Spatial variability
Percentiles have been used throughout this report instead of averages since the FFDI and FWI represent somewhat different quantities to each other. Although both indices have been calculated to represent the peak daily fire conditions of a given day, the FWI represents the intensity of the spreading fire as energy output rate per unit length of fire front, while the FFDI provides a relative measure of the difficulty of suppressing a fire. Comparing the percentiles of the indices overcomes this difference to some degree, since comparisons are made between the relative occurrence of the index values rather than the indices themselves. The percentiles have been calculated from daily values for the years 2000 to 2007.
Australian fire weather as represented by the McArthur Forest Fire Danger Index and the Canadian Forest Fire Weather Index
10
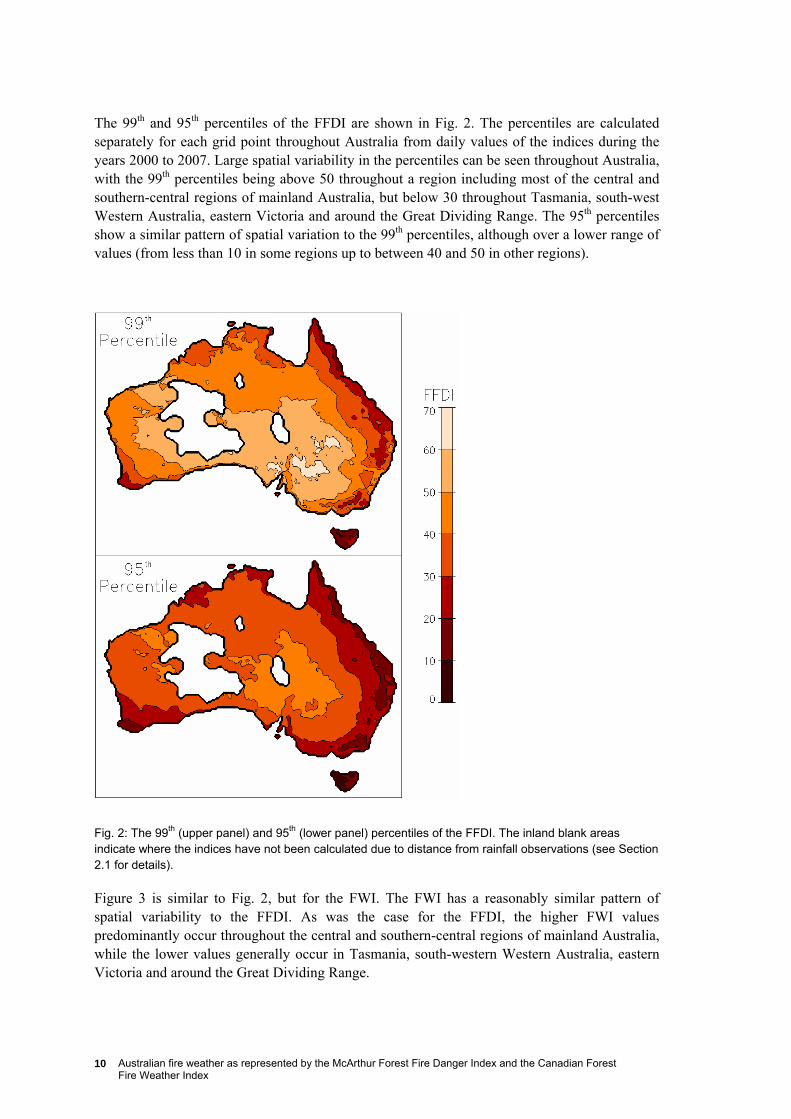
The 99th and 95th percentiles of the FFDI are shown in Fig. 2. The percentiles are calculated separately for each grid point throughout Australia from daily values of the indices during the years 2000 to 2007. Large spatial variability in the percentiles can be seen throughout Australia, with the 99th percentiles being above 50 throughout a region including most of the central and southern-central regions of mainland Australia, but below 30 throughout Tasmania, south-west Western Australia, eastern Victoria and around the Great Dividing Range. The 95th percentiles show a similar pattern of spatial variation to the 99th percentiles, although over a lower range of values (from less than 10 in some regions up to between 40 and 50 in other regions).
Fig. 2: The 99th (upper panel) and 95th (lower panel) percentiles of the FFDI. The inland blank areas indicate where the indices have not been calculated due to distance from rainfall observations (see Section 2.1 for details).
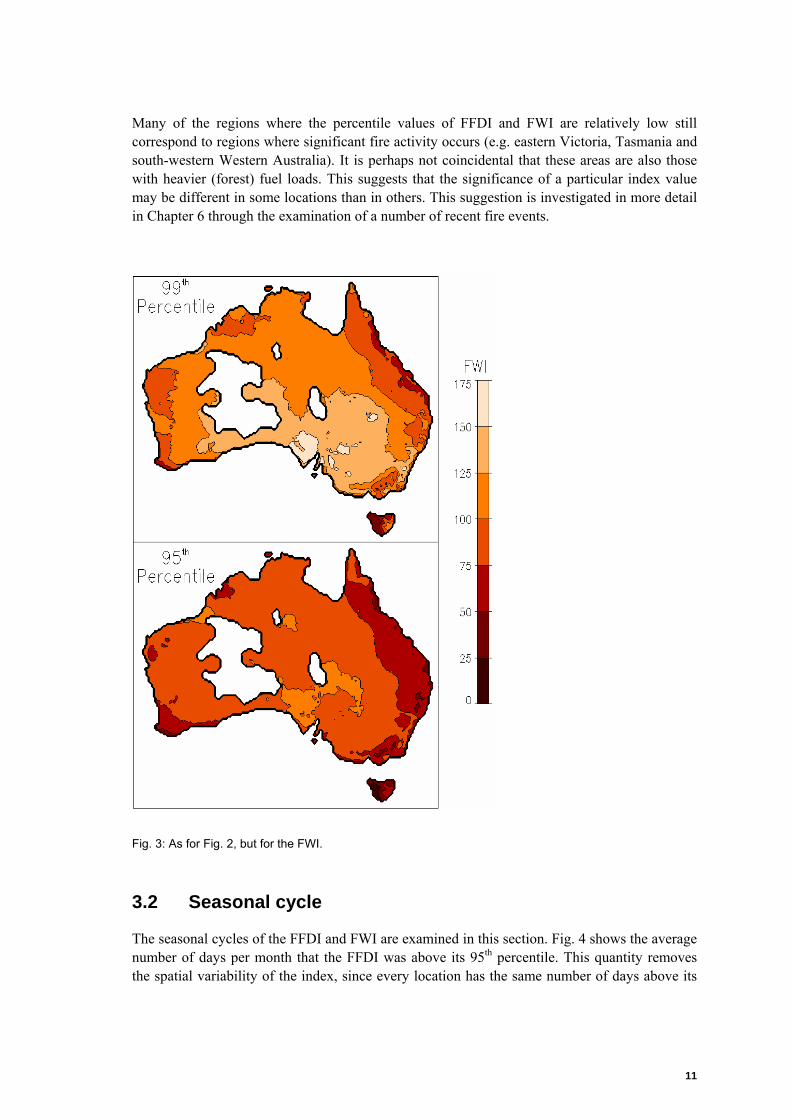
Figure 3 is similar to Fig. 2, but for the FWI. The FWI has a reasonably similar pattern of spatial variability to the FFDI. As was the case for the FFDI, the higher FWI values predominantly occur throughout the central and southern-central regions of mainland Australia, while the lower values generally occur in Tasmania, south-western Western Australia, eastern Victoria and around the Great Dividing Range.
11
Many of the regions where the percentile values of FFDI and FWI are relatively low still correspond to regions where significant fire activity occurs (e.g. eastern Victoria, Tasmania and south-western Western Australia). It is perhaps not coincidental that these areas are also those with heavier (forest) fuel loads. This suggests that the significance of a particular index value may be different in some locations than in others. This suggestion is investigated in more detail in Chapter 6 through the examination of a number of recent fire events.
Fig. 3: As for Fig. 2, but for the FWI.
3.2 Seasonal cycle
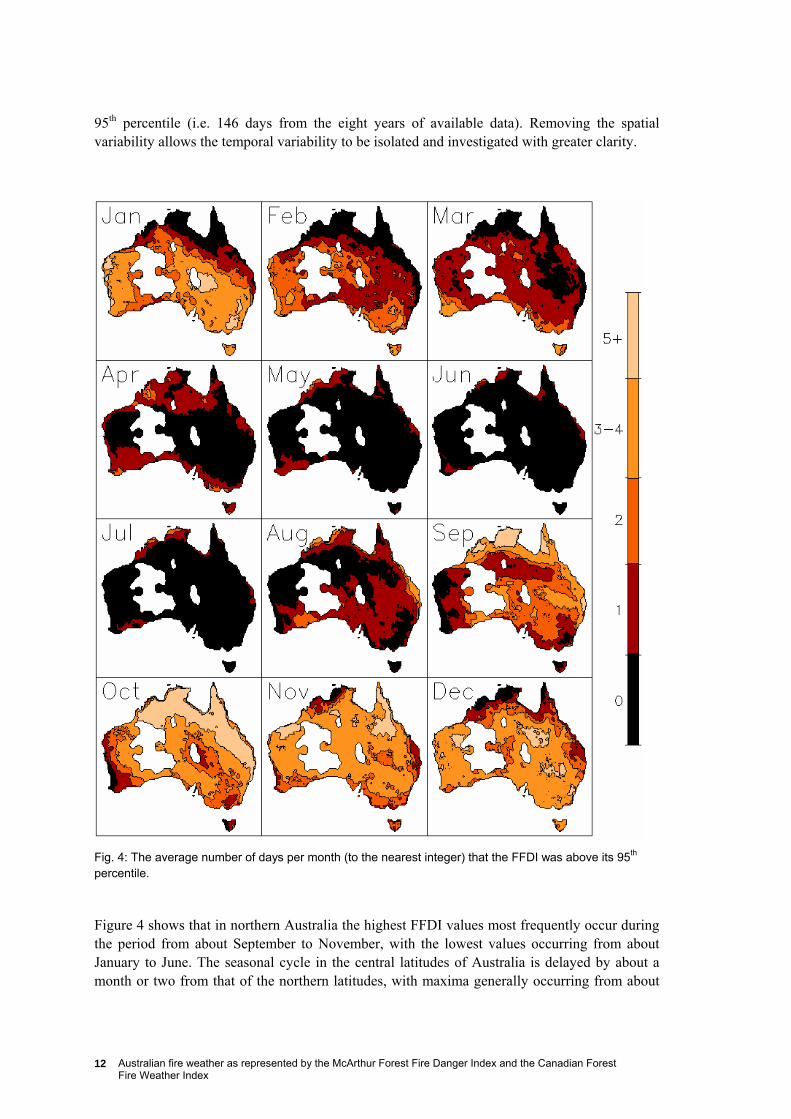
The seasonal cycles of the FFDI and FWI are examined in this section. Fig. 4 shows the average number of days per month that the FFDI was above its 95th percentile. This quantity removes the spatial variability of the index, since every location has the same number of days above its
Australian fire weather as represented by the McArthur Forest Fire Danger Index and the Canadian Forest Fire Weather Index
12
95th percentile (i.e. 146 days from the eight years of available data). Removing the spatial variability allows the temporal variability to be isolated and investigated with greater clarity.
Fig. 4: The average number of days per month (to the nearest integer) that the FFDI was above its 95th percentile.
Figure 4 shows that in northern Australia the highest FFDI values most frequently occur during the period from about September to November, with the lowest values occurring from about January to June. The seasonal cycle in the central latitudes of Australia is delayed by about a month or two from that of the northern latitudes, with maxima generally occurring from about
13
October to January and minima from about April to July. The central east coast region is an exception to this where the seasonal cycle is more similar to that of the northern regions of Australia. The southern parts of Australia show a seasonal cycle that is delayed from that of the central latitudes by a further month of two, with maxima generally occurring from about December to February and minima from about June to August. The overall seasonal cycle of the FFDI described here is reasonably consistent with a map of seasonal fire occurrence shown in Luke and McArthur (1986).
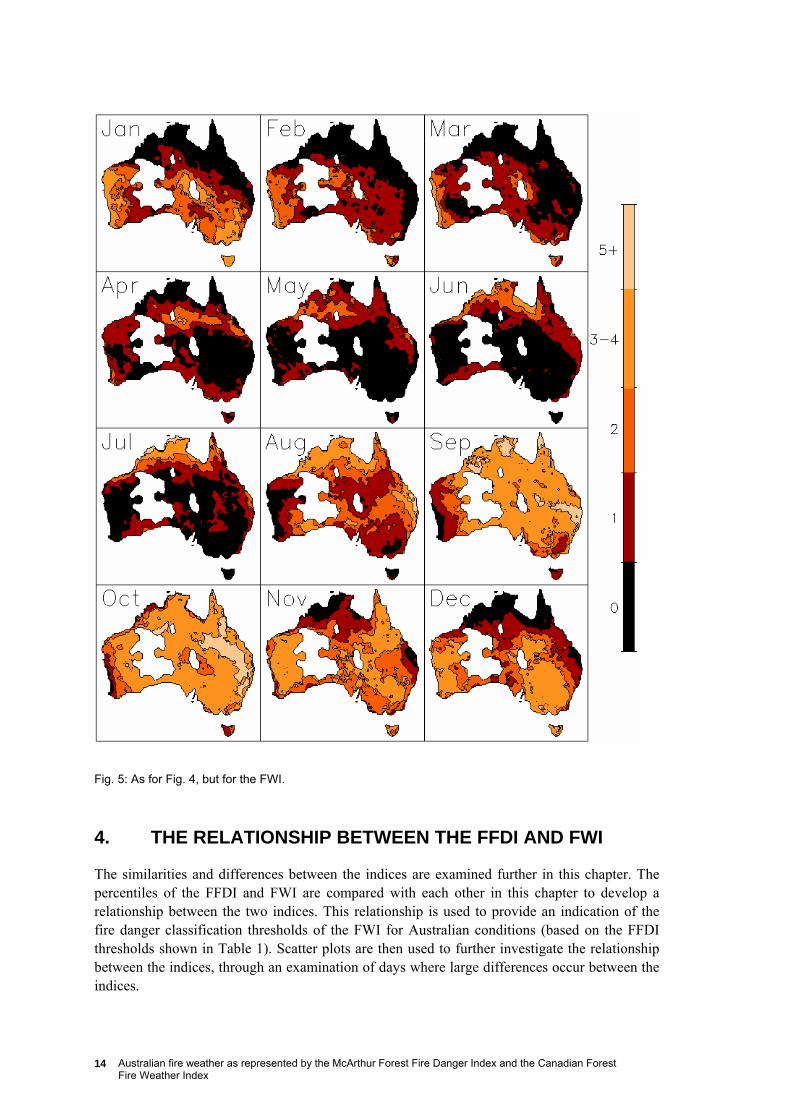
Figure 5 is similar to Fig. 4, but for the FWI. In the northern parts of Australia, the highest FWI values tend to occur from about August to October, with minima from about December to April. For the more central latitudes of Australia, the maxima occur from about September to December, with minima from about April to July. The exception to this is the central east coast region which has a seasonal cycle that is more similar to the northern regions (as was also the case for the FFDI). In the southern parts of Australia the FWI maxima predominantly occur during December and January, with minima during June and July.
The seasonal cycle of the FWI is similar to that of the FFDI in that features such as maxima and minima tend to occur later at the more southerly latitudes and earlier at the more northerly latitudes. The predominant difference between the FWI and FFDI is that the seasonal increase of the FWI generally appears to occur about a month earlier than for the FFDI.
Australian fire weather as represented by the McArthur Forest Fire Danger Index and the Canadian Forest Fire Weather Index
14
Fig. 5: As for Fig. 4, but for the FWI.
4. THE RELATIONSHIP BETWEEN THE FFDI AND FWI
The similarities and differences between the indices are examined further in this chapter. The percentiles of the FFDI and FWI are compared with each other in this chapter to develop a relationship between the two indices. This relationship is used to provide an indication of the fire danger classification thresholds of the FWI for Australian conditions (based on the FFDI thresholds shown in Table 1). Scatter plots are then used to further investigate the relationship between the indices, through an examination of days where large differences occur between the indices.
15
4.1 The national median relationship
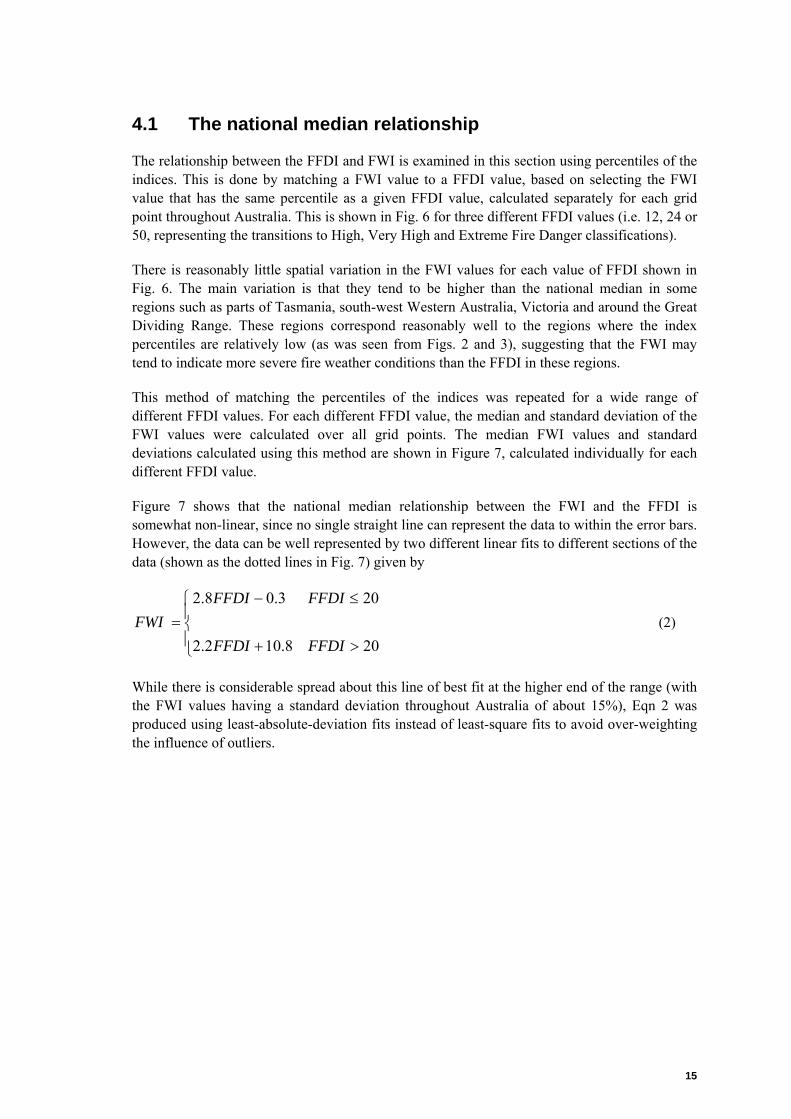
The relationship between the FFDI and FWI is examined in this section using percentiles of the indices. This is done by matching a FWI value to a FFDI value, based on selecting the FWI value that has the same percentile as a given FFDI value, calculated separately for each grid point throughout Australia. This is shown in Fig. 6 for three different FFDI values (i.e. 12, 24 or 50, representing the transitions to High, Very High and Extreme Fire Danger classifications).
There is reasonably little spatial variation in the FWI values for each value of FFDI shown in Fig. 6. The main variation is that they tend to be higher than the national median in some regions such as parts of Tasmania, south-west Western Australia, Victoria and around the Great Dividing Range. These regions correspond reasonably well to the regions where the index percentiles are relatively low (as was seen from Figs. 2 and 3), suggesting that the FWI may tend to indicate more severe fire weather conditions than the FFDI in these regions.
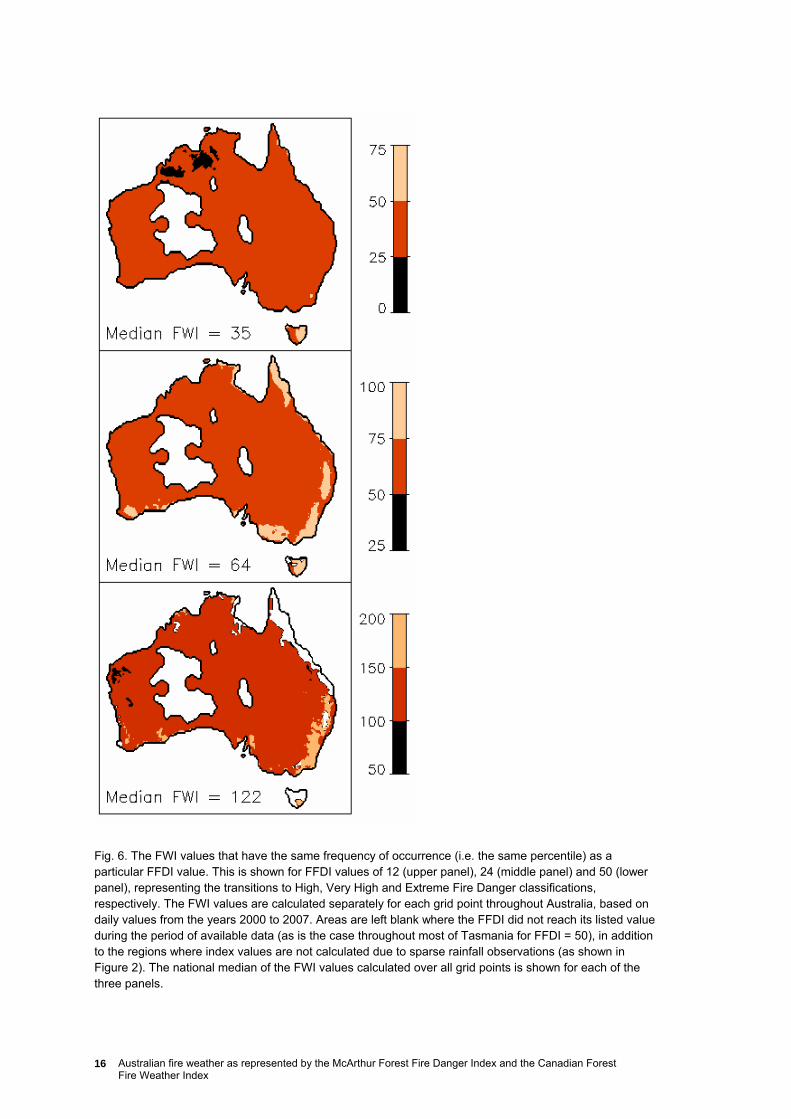
This method of matching the percentiles of the indices was repeated for a wide range of different FFDI values. For each different FFDI value, the median and standard deviation of the FWI values were calculated over all grid points. The median FWI values and standard deviations calculated using this method are shown in Figure 7, calculated individually for each different FFDI value.
Figure 7 shows that the national median relationship between the FWI and the FFDI is somewhat non-linear, since no single straight line can represent the data to within the error bars. However, the data can be well represented by two different linear fits to different sections of the data (shown as the dotted lines in Fig. 7) given by
⎪⎩
⎪⎨
⎧
>+
≤−=
208.102.2
203.08.2
FFDIFFDI
FFDIFFDIFWI (2)
While there is considerable spread about this line of best fit at the higher end of the range (with the FWI values having a standard deviation throughout Australia of about 15%), Eqn 2 was produced using least-absolute-deviation fits instead of least-square fits to avoid over-weighting the influence of outliers.
Australian fire weather as represented by the McArthur Forest Fire Danger Index and the Canadian Forest Fire Weather Index
16
Fig. 6. The FWI values that have the same frequency of occurrence (i.e. the same percentile) as a particular FFDI value. This is shown for FFDI values of 12 (upper panel), 24 (middle panel) and 50 (lower panel), representing the transitions to High, Very High and Extreme Fire Danger classifications, respectively. The FWI values are calculated separately for each grid point throughout Australia, based on daily values from the years 2000 to 2007. Areas are left blank where the FFDI did not reach its listed value during the period of available data (as is the case throughout most of Tasmania for FFDI = 50), in addition to the regions where index values are not calculated due to sparse rainfall observations (as shown in Figure 2). The national median of the FWI values calculated over all grid points is shown for each of the three panels.
17
Fig. 7: The national median relationship between the FWI and FFDI. The relationship was produced by matching the percentiles of the indices at each individual grid point throughout Australia, then calculating the national median FWI value corresponding to each FFDI value. The error bars of the FWI values represent the standard deviations of the FWI values throughout Australia. The dotted line represents a combination of two linear fits to the data, one for FFDI ≤ 20 and one for FFDI > 20, as described by Eqn 2.
4.2 Scatter plots
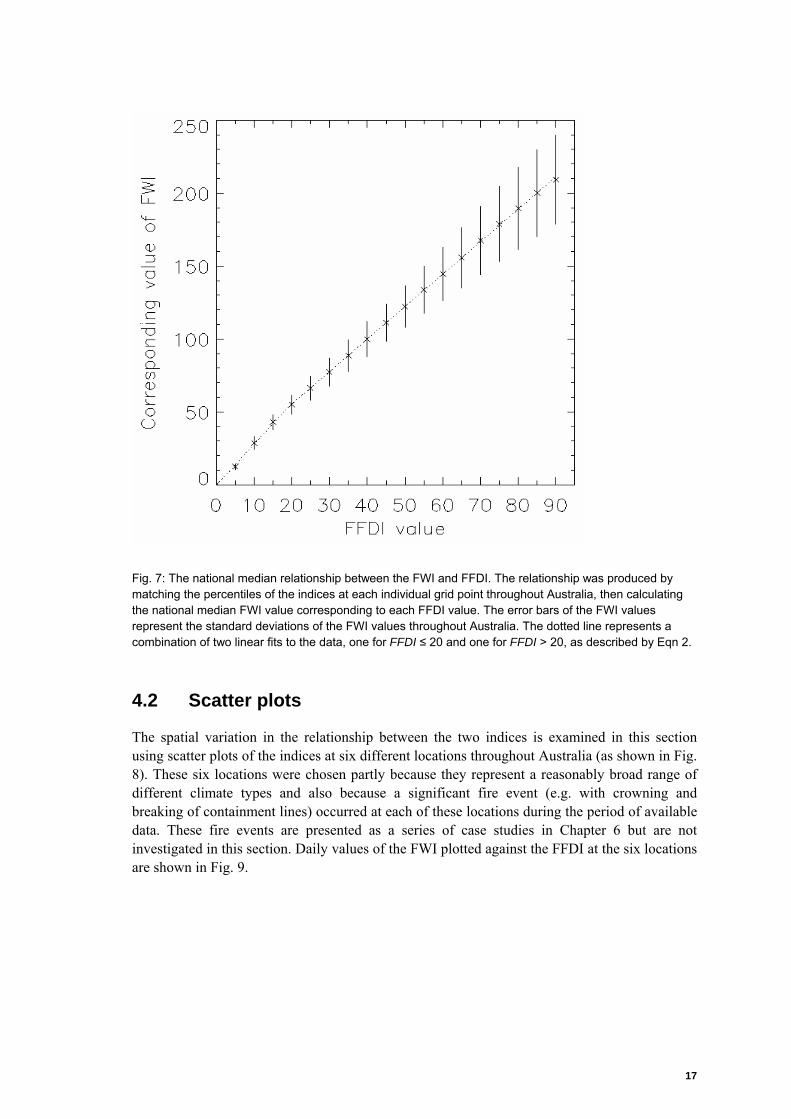
The spatial variation in the relationship between the two indices is examined in this section using scatter plots of the indices at six different locations throughout Australia (as shown in Fig. 8). These six locations were chosen partly because they represent a reasonably broad range of different climate types and also because a significant fire event (e.g. with crowning and breaking of containment lines) occurred at each of these locations during the period of available data. These fire events are presented as a series of case studies in Chapter 6 but are not investigated in this section. Daily values of the FWI plotted against the FFDI at the six locations are shown in Fig. 9.
Australian fire weather as represented by the McArthur Forest Fire Danger Index and the Canadian Forest Fire Weather Index
18
Fig. 8: The positions of Bridgetown in Western Australia (34.0˚S, 116.0˚E), Wangary in South Australia (34.5˚S, 135.5˚E), Wilsons Promontory in Victoria (38.75˚S, 146.25˚E), Scamander in Tasmania (41.5˚S, 148.25˚E), Canberra in the Australian Capital Territory (35.25˚S, 149.25˚E) and Warragamba in New South Wales (33.75˚S, 150.5˚E).
Considerable variation between the six locations is evident from the scatter plots shown in Fig. 9. For example, the 95th and 99th percentiles of both indices (shown as dotted lines in Fig. 9) are about twice as large at Wangary than at Bridgetown.
There is an obvious correlation between the FWI and FFDI values at each of the six locations. This correlation is reasonably consistent with the national median relationship between the two indices given by Eqn 2, although some variation between the locations is apparent (which is to be expected based on the spatial variability that was seen in the FWI values shown in Fig. 6). To examine this more quantitatively, Tables 4 and 5 show linear fits to the portions of the data corresponding to FFDI ≤ 20 and FFDI > 20, respectively.
19
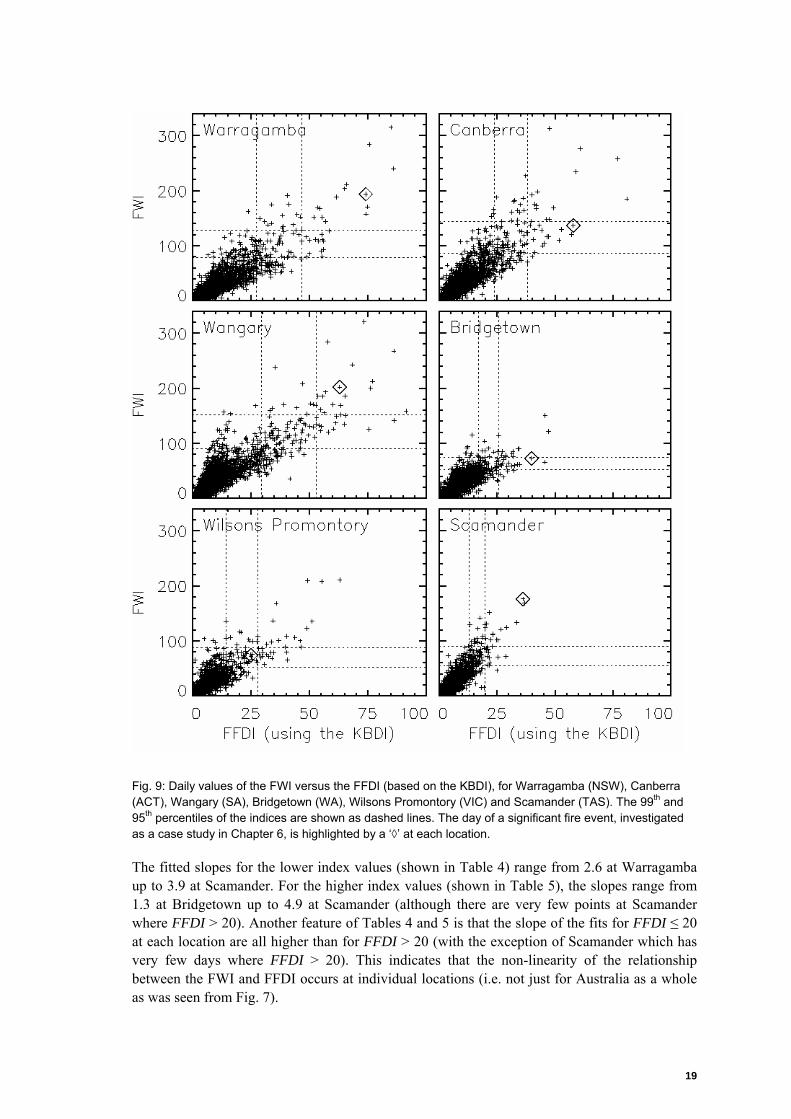
Fig. 9: Daily values of the FWI versus the FFDI (based on the KBDI), for Warragamba (NSW), Canberra (ACT), Wangary (SA), Bridgetown (WA), Wilsons Promontory (VIC) and Scamander (TAS). The 99th and 95th percentiles of the indices are shown as dashed lines. The day of a significant fire event, investigated as a case study in Chapter 6, is highlighted by a ‘◊’ at each location.
The fitted slopes for the lower index values (shown in Table 4) range from 2.6 at Warragamba up to 3.9 at Scamander. For the higher index values (shown in Table 5), the slopes range from 1.3 at Bridgetown up to 4.9 at Scamander (although there are very few points at Scamander where FFDI > 20). Another feature of Tables 4 and 5 is that the slope of the fits for FFDI ≤ 20 at each location are all higher than for FFDI > 20 (with the exception of Scamander which has very few days where FFDI > 20). This indicates that the non-linearity of the relationship between the FWI and FFDI occurs at individual locations (i.e. not just for Australia as a whole as was seen from Fig. 7).
Australian fire weather as represented by the McArthur Forest Fire Danger Index and the Canadian Forest Fire Weather Index
20
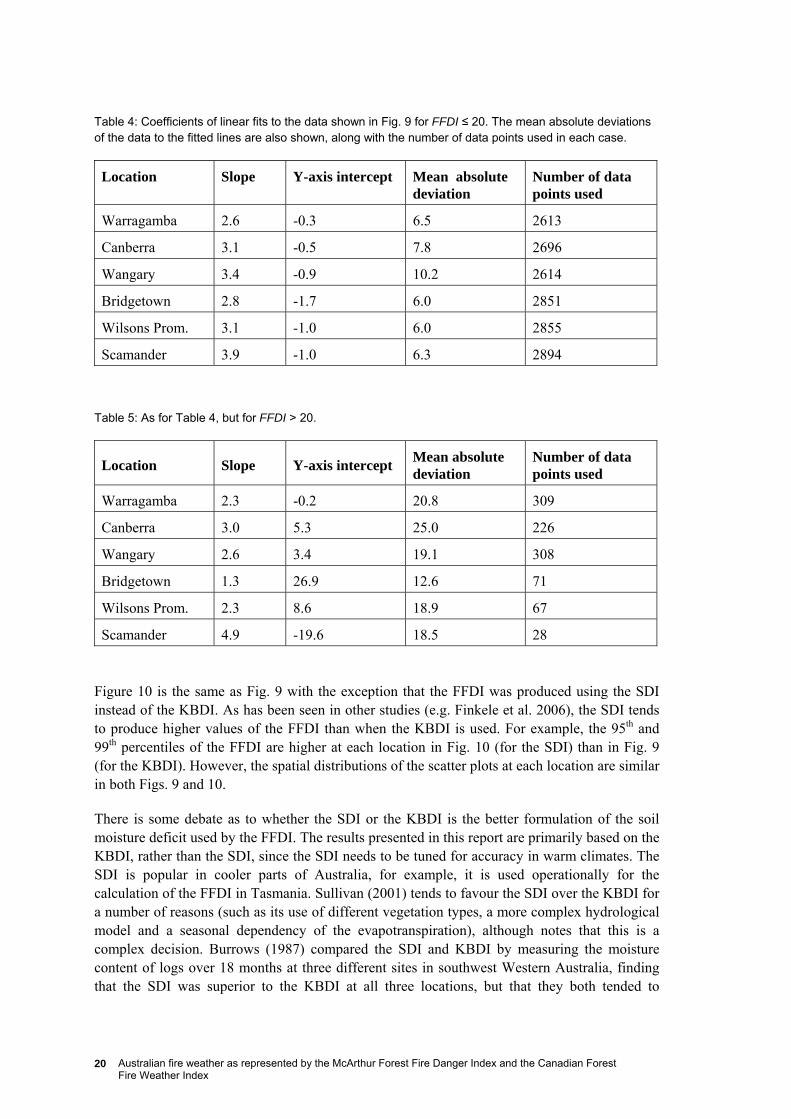
Table 4: Coefficients of linear fits to the data shown in Fig. 9 for FFDI ≤ 20. The mean absolute deviations of the data to the fitted lines are also shown, along with the number of data points used in each case.
Location Slope Y-axis intercept Mean absolute deviation
Number of data points used
Warragamba 2.6 -0.3 6.5 2613
Canberra 3.1 -0.5 7.8 2696
Wangary 3.4 -0.9 10.2 2614
Bridgetown 2.8 -1.7 6.0 2851
Wilsons Prom. 3.1 -1.0 6.0 2855
Scamander 3.9 -1.0 6.3 2894
Table 5: As for Table 4, but for FFDI > 20.
Location Slope Y-axis intercept Mean absolute deviation
Number of data points used
Warragamba 2.3 -0.2 20.8 309
Canberra 3.0 5.3 25.0 226
Wangary 2.6 3.4 19.1 308
Bridgetown 1.3 26.9 12.6 71
Wilsons Prom. 2.3 8.6 18.9 67
Scamander 4.9 -19.6 18.5 28
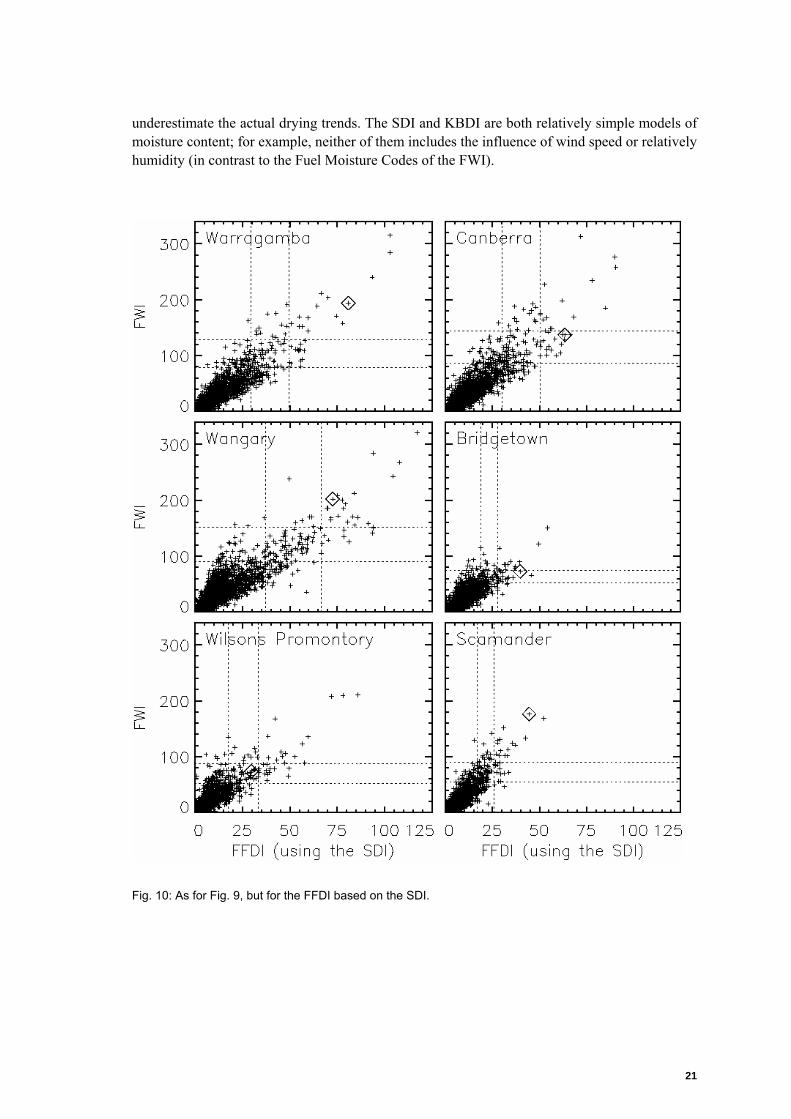
Figure 10 is the same as Fig. 9 with the exception that the FFDI was produced using the SDI instead of the KBDI. As has been seen in other studies (e.g. Finkele et al. 2006), the SDI tends to produce higher values of the FFDI than when the KBDI is used. For example, the 95th and 99th percentiles of the FFDI are higher at each location in Fig. 10 (for the SDI) than in Fig. 9 (for the KBDI). However, the spatial distributions of the scatter plots at each location are similar in both Figs. 9 and 10.
There is some debate as to whether the SDI or the KBDI is the better formulation of the soil moisture deficit used by the FFDI. The results presented in this report are primarily based on the KBDI, rather than the SDI, since the SDI needs to be tuned for accuracy in warm climates. The SDI is popular in cooler parts of Australia, for example, it is used operationally for the calculation of the FFDI in Tasmania. Sullivan (2001) tends to favour the SDI over the KBDI for a number of reasons (such as its use of different vegetation types, a more complex hydrological model and a seasonal dependency of the evapotranspiration), although notes that this is a complex decision. Burrows (1987) compared the SDI and KBDI by measuring the moisture content of logs over 18 months at three different sites in southwest Western Australia, finding that the SDI was superior to the KBDI at all three locations, but that they both tended to
21
underestimate the actual drying trends. The SDI and KBDI are both relatively simple models of moisture content; for example, neither of them includes the influence of wind speed or relatively humidity (in contrast to the Fuel Moisture Codes of the FWI).
Fig. 10: As for Fig. 9, but for the FFDI based on the SDI.
Australian fire weather as represented by the McArthur Forest Fire Danger Index and the Canadian Forest Fire Weather Index
22
4.3 Detailed examination of differences
It was seen in the previous section that the FWI and FFDI generally show a positive correlation, but that there are a number of occasions when they show significant differences to each other. For example, there are some cases at each of the six locations shown in Fig. 9 where one index is above its 99th percentile while the other index is below its 95th percentile. This poses the question of whether or not there are circumstances where one index or the other may provide different information to a fire weather forecaster. The cause of such large differences between the indices in investigated in this section.
There are some fundamental differences between the formulations of the two indices which could explain some of the scatter shown in Fig. 9. For example, some input parameters are used by one index but not by the other:
• the FFDI uses either mean annual rainfall (if using the KBDI) or vegetation class (if using the SDI), neither of which are used by the FWI System,
• the FWI System includes the influence of wind speed and humidity information on fuel drying, whereas the FFDI does not,
• the FWI System also considers the increase in fuel moisture through the absorption of atmospheric moisture (see Eqn A8 in Appendix A), whereas the FFDI does not,
• the FWI System considers the influence of latitude on the drying rate (through the use of a variable day length) whereas the FFDI does not, and
• the time of the year is used by the FWI System but only by the FFDI when the SDI is used and not when the KBDI is used.
The input parameters which are common between the indices are temperature, wind speed, relative humidity and rainfall. If the indices differ in their sensitivities to these parameters, it could explain some of the scatter seen in Fig. 9. In this section, the outlying points of the scatter plots shown in Fig. 9 are examined to see if they correspond to extreme values of the input parameters of the indices. This is examined firstly for temperature, then for wind speed and then finally for relative humidity.
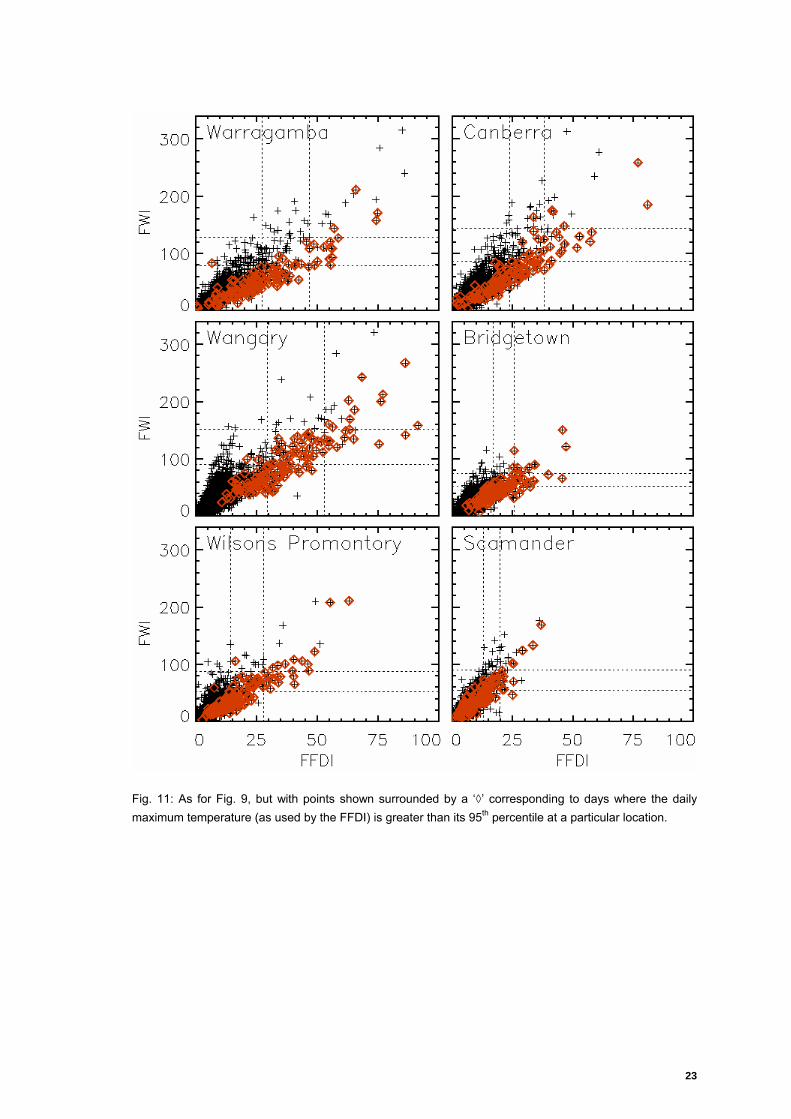
Figure 11 is the same as Fig. 9, but with values highlighted to show where the daily maximum temperature (as used by the FFDI) is higher than its 95th percentile at each individual location. The high temperatures correspond to the vast majority of the outlying points where the FFDI is disproportionately large (and very few where the FWI is disproportionately large). This is not simply an artefact of the different temperatures used by the FWI (noon temperature) and FFDI (maximum temperature), as it is seen in Fig. 12 that high noon temperatures also tend to correspond to disproportionately high FFDI values and low FWI values.
23
Fig. 11: As for Fig. 9, but with points shown surrounded by a ‘◊’ corresponding to days where the daily maximum temperature (as used by the FFDI) is greater than its 95th percentile at a particular location.
Australian fire weather as represented by the McArthur Forest Fire Danger Index and the Canadian Forest Fire Weather Index
24
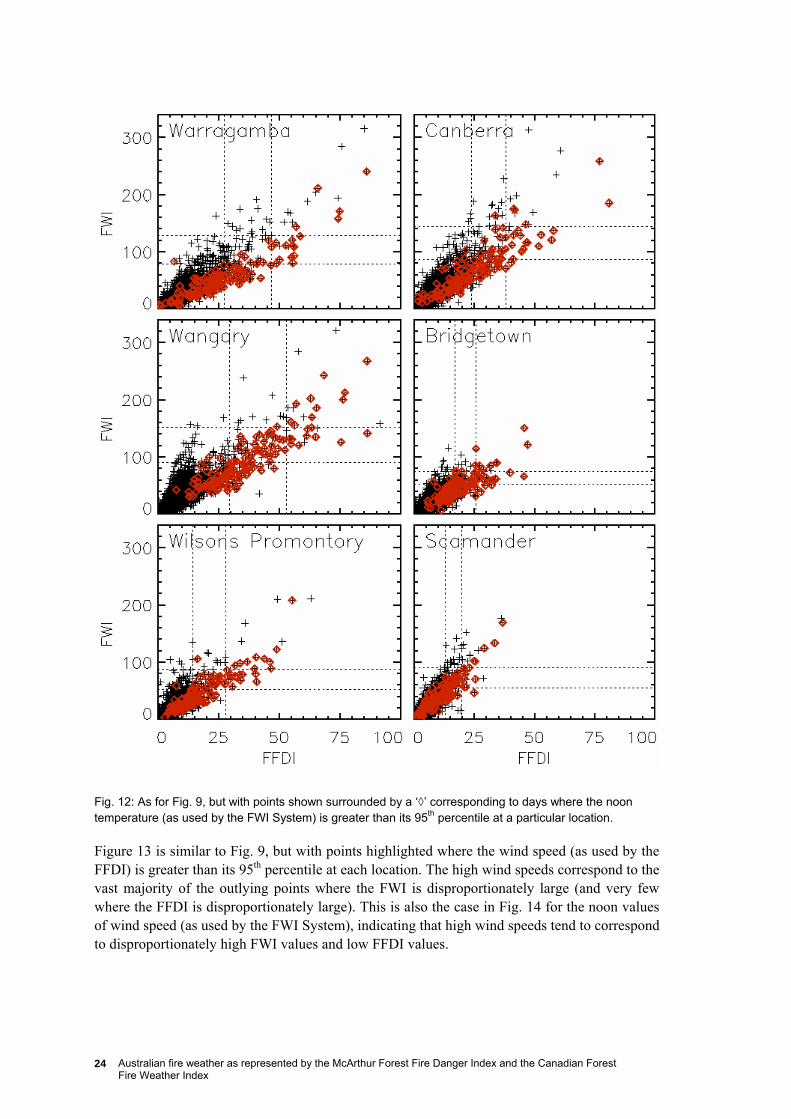
Fig. 12: As for Fig. 9, but with points shown surrounded by a ‘◊’ corresponding to days where the noon temperature (as used by the FWI System) is greater than its 95th percentile at a particular location.
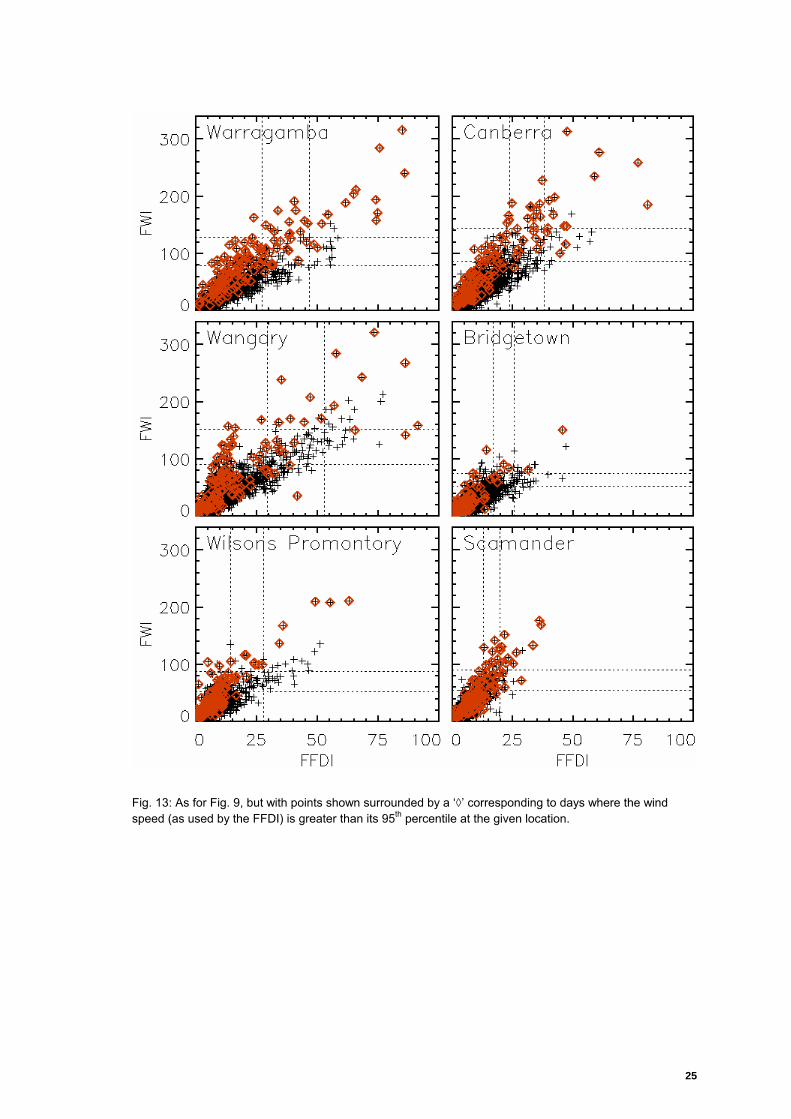
Figure 13 is similar to Fig. 9, but with points highlighted where the wind speed (as used by the FFDI) is greater than its 95th percentile at each location. The high wind speeds correspond to the vast majority of the outlying points where the FWI is disproportionately large (and very few where the FFDI is disproportionately large). This is also the case in Fig. 14 for the noon values of wind speed (as used by the FWI System), indicating that high wind speeds tend to correspond to disproportionately high FWI values and low FFDI values.
25
Fig. 13: As for Fig. 9, but with points shown surrounded by a ‘◊’ corresponding to days where the wind speed (as used by the FFDI) is greater than its 95th percentile at the given location.
Australian fire weather as represented by the McArthur Forest Fire Danger Index and the Canadian Forest Fire Weather Index
26
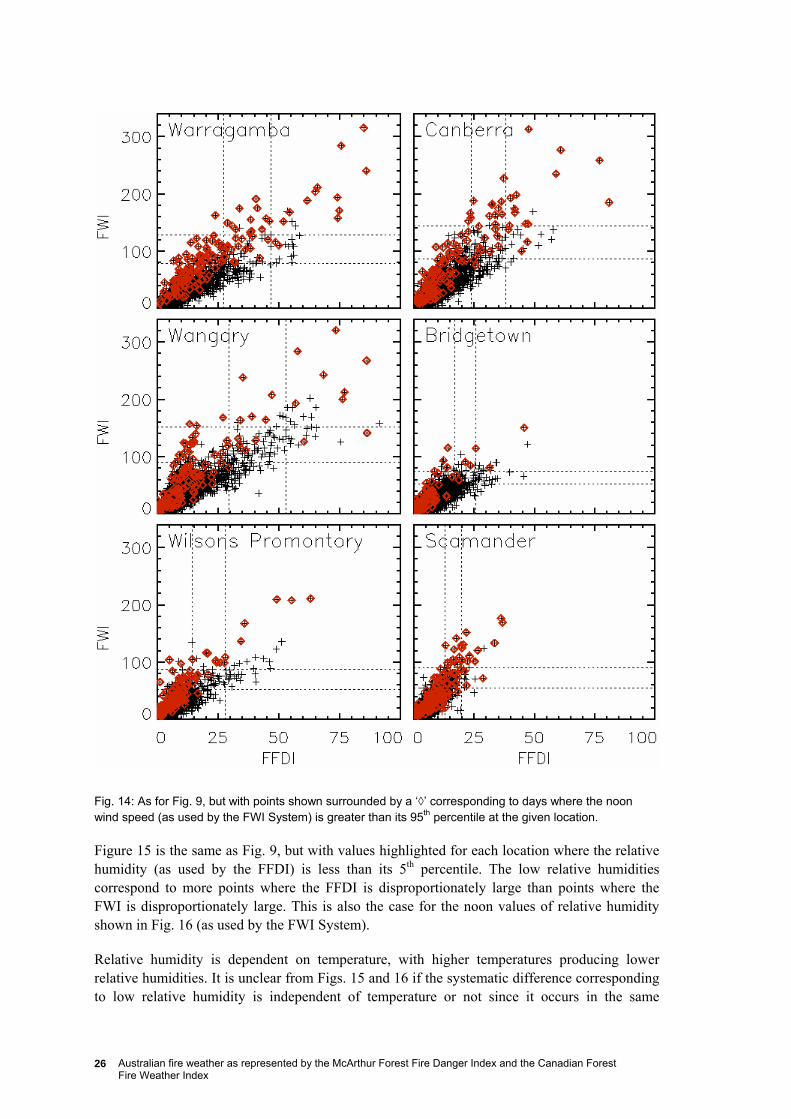
Fig. 14: As for Fig. 9, but with points shown surrounded by a ‘◊’ corresponding to days where the noon wind speed (as used by the FWI System) is greater than its 95th percentile at the given location.
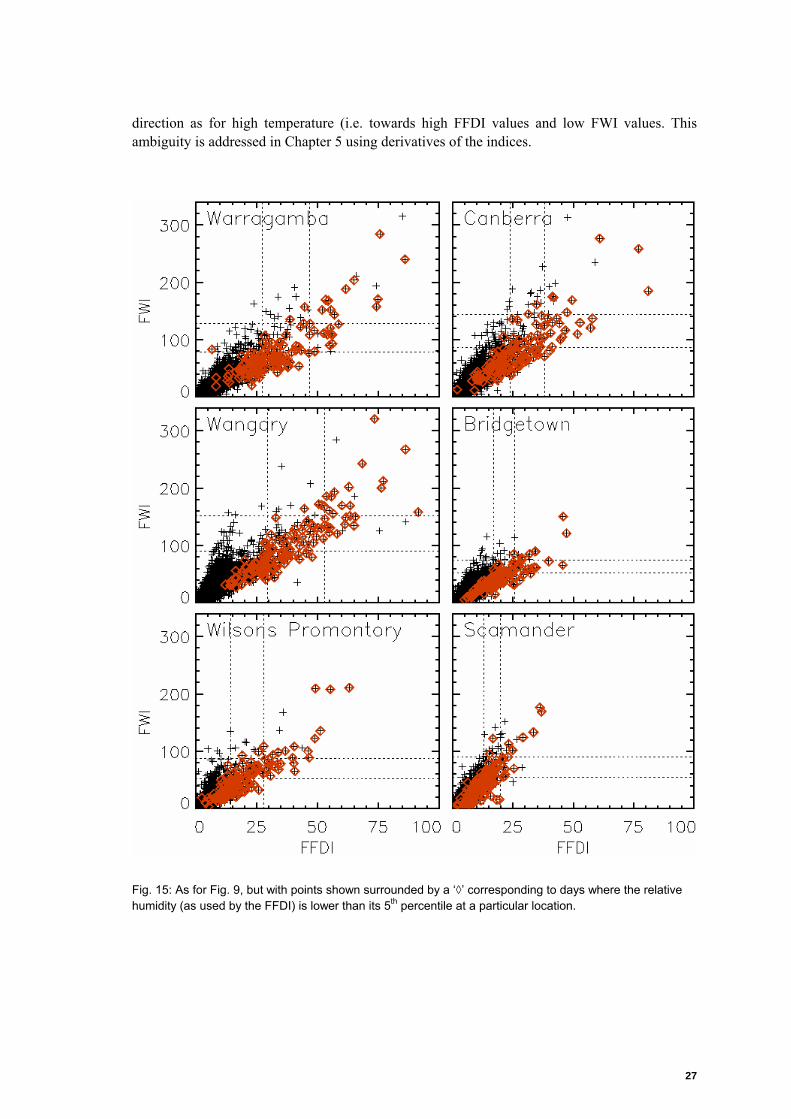
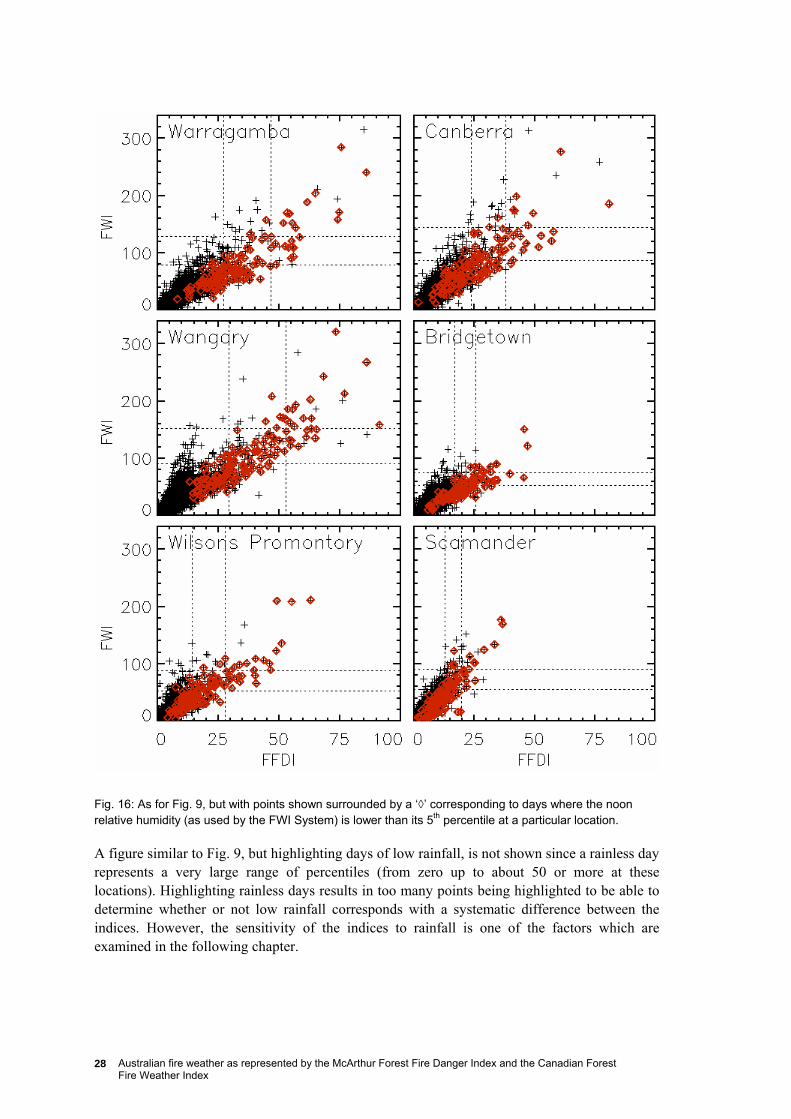
Figure 15 is the same as Fig. 9, but with values highlighted for each location where the relative humidity (as used by the FFDI) is less than its 5th percentile. The low relative humidities correspond to more points where the FFDI is disproportionately large than points where the FWI is disproportionately large. This is also the case for the noon values of relative humidity shown in Fig. 16 (as used by the FWI System).
Relative humidity is dependent on temperature, with higher temperatures producing lower relative humidities. It is unclear from Figs. 15 and 16 if the systematic difference corresponding to low relative humidity is independent of temperature or not since it occurs in the same
27
direction as for high temperature (i.e. towards high FFDI values and low FWI values. This ambiguity is addressed in Chapter 5 using derivatives of the indices.
Fig. 15: As for Fig. 9, but with points shown surrounded by a ‘◊’ corresponding to days where the relative humidity (as used by the FFDI) is lower than its 5th percentile at a particular location.
Australian fire weather as represented by the McArthur Forest Fire Danger Index and the Canadian Forest Fire Weather Index
28
Fig. 16: As for Fig. 9, but with points shown surrounded by a ‘◊’ corresponding to days where the noon relative humidity (as used by the FWI System) is lower than its 5th percentile at a particular location.
A figure similar to Fig. 9, but highlighting days of low rainfall, is not shown since a rainless day represents a very large range of percentiles (from zero up to about 50 or more at these locations). Highlighting rainless days results in too many points being highlighted to be able to determine whether or not low rainfall corresponds with a systematic difference between the indices. However, the sensitivity of the indices to rainfall is one of the factors which are examined in the following chapter.
29
When the SDI is used to produce the FFDI (as was shown previously in Fig. 10), the outlying points indicate similar differences between the FWI and FFDI to when the KBDI is used (i.e. high values of wind speed correspond to disproportionately high values of the FWI, while high temperatures and low relative humidities correspond to disproportionately high values of the FFDI).
5. SENSITIVITY TO INPUT PARAMETERS
The sensitivity of the indices to their input parameters is investigated in this section using three different methodologies. Firstly, derivatives of the indices are examined with respect to their input parameters. Secondly, the relative importance of each input parameter is investigated. Thirdly, the sensitivities of the indices to long term changes in their input parameters are calculated using equilibrium values of the indices.
5.1 Index derivatives
5.1.1 Derivatives of the FFDI
The derivative of an index with respect to a single input parameter (i.e. the partial derivative) is a measure of the sensitivity of the index to that input parameter. The partial derivatives of the FFDI (calculated from Eqn 1) are
FFDIT
FFDIDFRH
0338.0,
=⎟⎠⎞
⎜⎝⎛
∂∂
(3)
FFDIv
FFDI 0234.0=∂
∂ (4)
FFDIRH
FFDI
T
0345.0−=⎟⎠⎞
⎜⎝⎛∂∂
(5)
DFFFDI
DFFFDI
T
987.0=⎟⎠⎞
⎜⎝⎛∂∂
(6)
where the subscripts indicate the variables that are held constant when calculating the partial derivatives (which is necessary since the Drought Factor and relative humidity both depend on temperature).
Examples of the derivatives of the FFDI (calculated from Eqns 3-6) are shown in Table 7, based on the 95th percentiles of the input parameters (as shown in Table 6). These values of the derivatives vary by up to a factor of three between the six locations, being smallest at Scamander and largest at Wangary. This variation is caused by the derivatives all being directly proportional to the value of the FFDI (as can be seen from Eqns 3-6), combined with the fact that the 95th percentile of the FFDI is about three times larger at Wangary than at Scamander
Australian fire weather as represented by the McArthur Forest Fire Danger Index and the Canadian Forest Fire Weather Index
30
(see Table 6). Other studies have also noted the increased sensitivity of the FFDI with increasing values of FFDI. For example, Sullivan (2001) found that the FFDI was more sensitive to changes in the Drought Factor under severe conditions than it was under average conditions. Equations 3-6 show that this will also be the case for the other input parameters, with higher FFDI values corresponding to higher sensitivities to temperature, wind speed and relative humidity).
The partial derivative of the FFDI with respect to rainfall is not shown in Table 7 since the complexities of how rainfall is formulated in the Drought Factor mean that mathematically calculating the derivative of the FFDI with respect to rainfall is not a straightforward matter. The derivative of the FFDI with respect to rainfall is calculated using an alternative method in the following section.
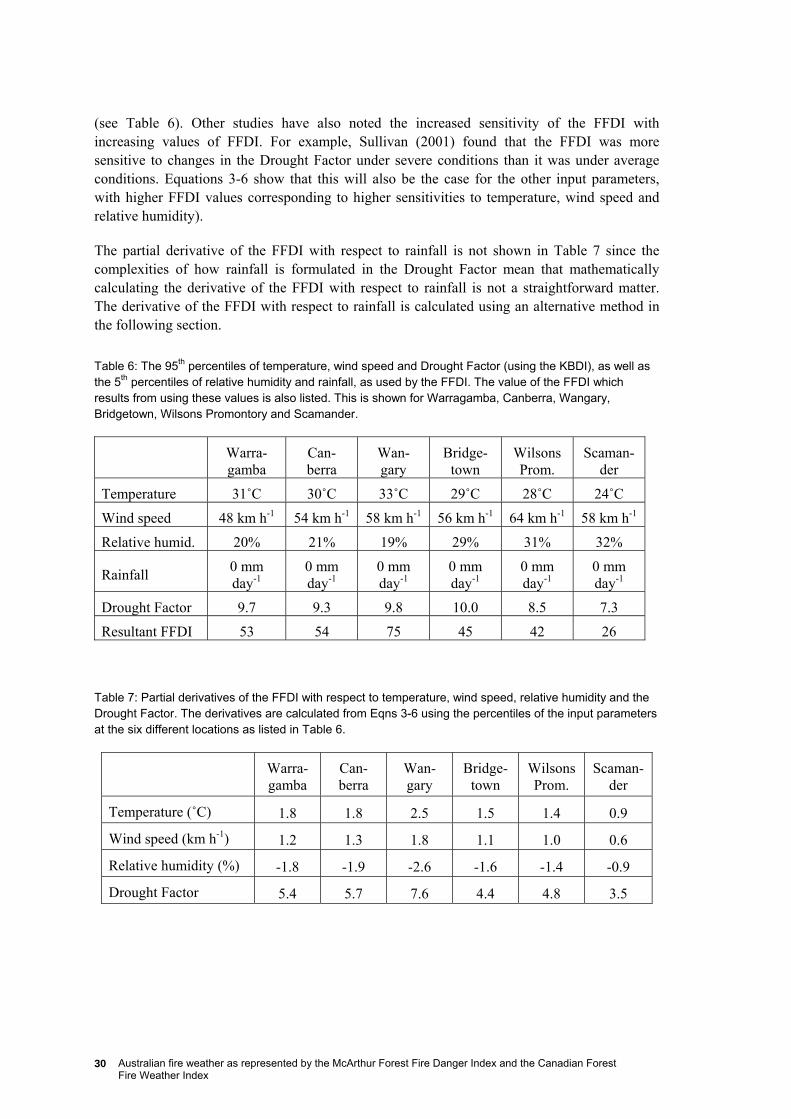
Table 6: The 95th percentiles of temperature, wind speed and Drought Factor (using the KBDI), as well as the 5th percentiles of relative humidity and rainfall, as used by the FFDI. The value of the FFDI which results from using these values is also listed. This is shown for Warragamba, Canberra, Wangary, Bridgetown, Wilsons Promontory and Scamander.
Warra-gamba
Can-berra
Wan-gary
Bridge-town
Wilsons Prom.
Scaman-der
Temperature 31˚C 30˚C 33˚C 29˚C 28˚C 24˚C
Wind speed 48 km h-1 54 km h-1 58 km h-1 56 km h-1 64 km h-1 58 km h-1
Relative humid. 20% 21% 19% 29% 31% 32%
Rainfall 0 mm day-1
0 mm day-1
0 mm day-1
0 mm day-1
0 mm day-1
0 mm day-1
Drought Factor 9.7 9.3 9.8 10.0 8.5 7.3
Resultant FFDI 53 54 75 45 42 26
Table 7: Partial derivatives of the FFDI with respect to temperature, wind speed, relative humidity and the Drought Factor. The derivatives are calculated from Eqns 3-6 using the percentiles of the input parameters at the six different locations as listed in Table 6.
Warra-gamba
Can-berra
Wan-gary
Bridge-town
Wilsons Prom.
Scaman-der
Temperature (˚C) 1.8 1.8 2.5 1.5 1.4 0.9
Wind speed (km h-1) 1.2 1.3 1.8 1.1 1.0 0.6
Relative humidity (%) -1.8 -1.9 -2.6 -1.6 -1.4 -0.9
Drought Factor 5.4 5.7 7.6 4.4 4.8 3.5
31
5.1.2 Derivatives of the FWI
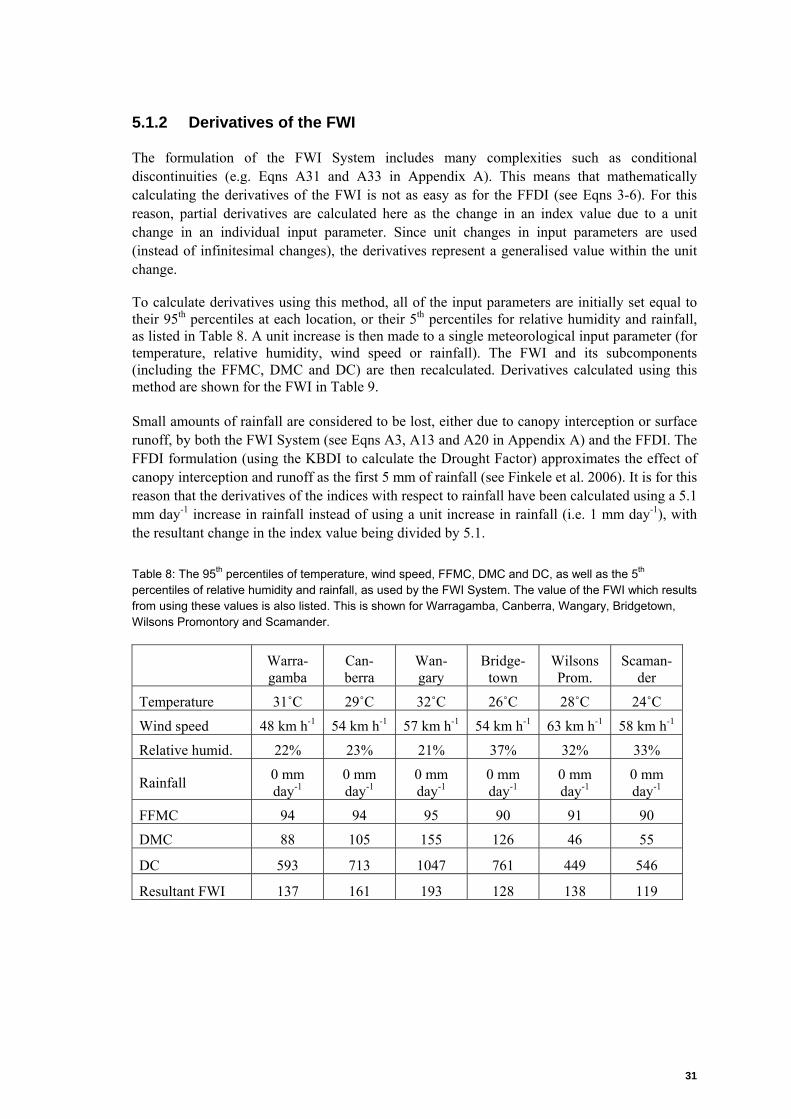
The formulation of the FWI System includes many complexities such as conditional discontinuities (e.g. Eqns A31 and A33 in Appendix A). This means that mathematically calculating the derivatives of the FWI is not as easy as for the FFDI (see Eqns 3-6). For this reason, partial derivatives are calculated here as the change in an index value due to a unit change in an individual input parameter. Since unit changes in input parameters are used (instead of infinitesimal changes), the derivatives represent a generalised value within the unit change.
To calculate derivatives using this method, all of the input parameters are initially set equal to their 95th percentiles at each location, or their 5th percentiles for relative humidity and rainfall, as listed in Table 8. A unit increase is then made to a single meteorological input parameter (for temperature, relative humidity, wind speed or rainfall). The FWI and its subcomponents (including the FFMC, DMC and DC) are then recalculated. Derivatives calculated using this method are shown for the FWI in Table 9.
Small amounts of rainfall are considered to be lost, either due to canopy interception or surface runoff, by both the FWI System (see Eqns A3, A13 and A20 in Appendix A) and the FFDI. The FFDI formulation (using the KBDI to calculate the Drought Factor) approximates the effect of canopy interception and runoff as the first 5 mm of rainfall (see Finkele et al. 2006). It is for this reason that the derivatives of the indices with respect to rainfall have been calculated using a 5.1 mm day-1 increase in rainfall instead of using a unit increase in rainfall (i.e. 1 mm day-1), with the resultant change in the index value being divided by 5.1.
Table 8: The 95th percentiles of temperature, wind speed, FFMC, DMC and DC, as well as the 5th percentiles of relative humidity and rainfall, as used by the FWI System. The value of the FWI which results from using these values is also listed. This is shown for Warragamba, Canberra, Wangary, Bridgetown, Wilsons Promontory and Scamander.
Warra-gamba
Can-berra
Wan-gary
Bridge-town
Wilsons Prom.
Scaman-der
Temperature 31˚C 29˚C 32˚C 26˚C 28˚C 24˚C
Wind speed 48 km h-1 54 km h-1 57 km h-1 54 km h-1 63 km h-1 58 km h-1
Relative humid. 22% 23% 21% 37% 32% 33%
Rainfall 0 mm day-1
0 mm day-1
0 mm day-1
0 mm day-1
0 mm day-1
0 mm day-1
FFMC 94 94 95 90 91 90
DMC 88 105 155 126 46 55
DC 593 713 1047 761 449 546
Resultant FWI 137 161 193 128 138 119
Australian fire weather as represented by the McArthur Forest Fire Danger Index and the Canadian Forest Fire Weather Index
32
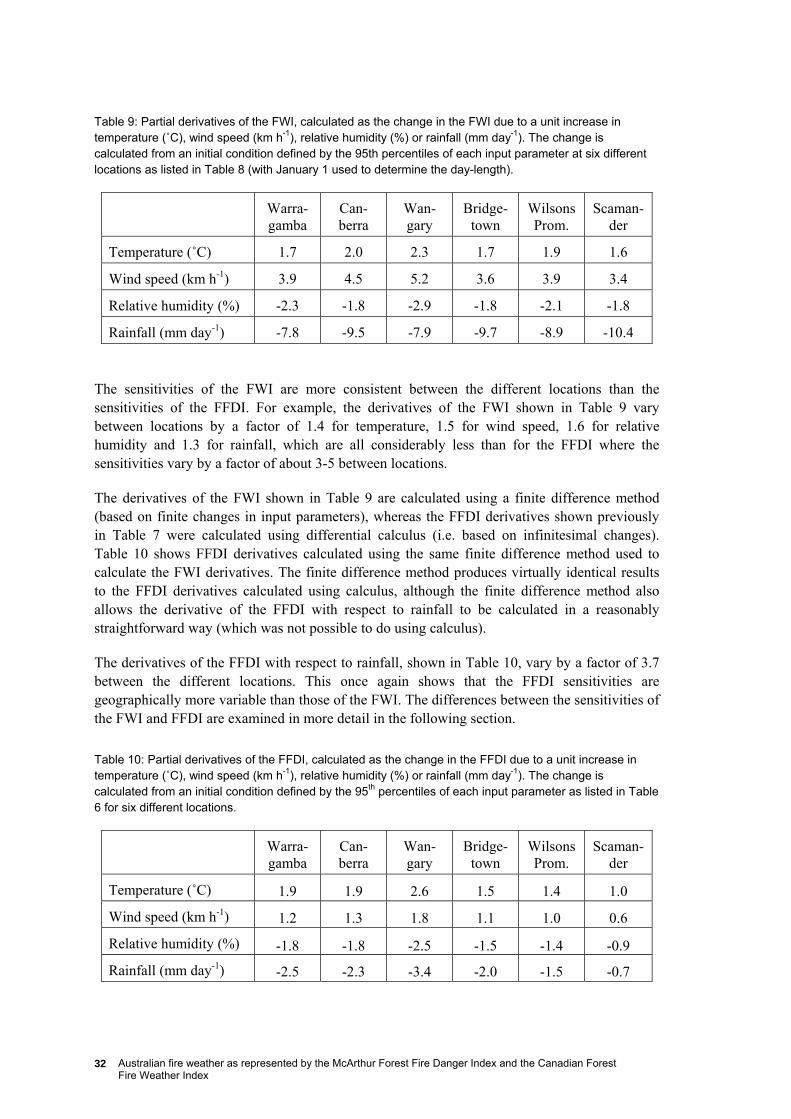
Table 9: Partial derivatives of the FWI, calculated as the change in the FWI due to a unit increase in temperature (˚C), wind speed (km h-1), relative humidity (%) or rainfall (mm day-1). The change is calculated from an initial condition defined by the 95th percentiles of each input parameter at six different locations as listed in Table 8 (with January 1 used to determine the day-length).
Warra-gamba
Can-berra
Wan-gary
Bridge-town
Wilsons Prom.
Scaman-der
Temperature (˚C) 1.7 2.0 2.3 1.7 1.9 1.6
Wind speed (km h-1) 3.9 4.5 5.2 3.6 3.9 3.4
Relative humidity (%) -2.3 -1.8 -2.9 -1.8 -2.1 -1.8
Rainfall (mm day-1) -7.8 -9.5 -7.9 -9.7 -8.9 -10.4
The sensitivities of the FWI are more consistent between the different locations than the sensitivities of the FFDI. For example, the derivatives of the FWI shown in Table 9 vary between locations by a factor of 1.4 for temperature, 1.5 for wind speed, 1.6 for relative humidity and 1.3 for rainfall, which are all considerably less than for the FFDI where the sensitivities vary by a factor of about 3-5 between locations.
The derivatives of the FWI shown in Table 9 are calculated using a finite difference method (based on finite changes in input parameters), whereas the FFDI derivatives shown previously in Table 7 were calculated using differential calculus (i.e. based on infinitesimal changes). Table 10 shows FFDI derivatives calculated using the same finite difference method used to calculate the FWI derivatives. The finite difference method produces virtually identical results to the FFDI derivatives calculated using calculus, although the finite difference method also allows the derivative of the FFDI with respect to rainfall to be calculated in a reasonably straightforward way (which was not possible to do using calculus).
The derivatives of the FFDI with respect to rainfall, shown in Table 10, vary by a factor of 3.7 between the different locations. This once again shows that the FFDI sensitivities are geographically more variable than those of the FWI. The differences between the sensitivities of the FWI and FFDI are examined in more detail in the following section.
Table 10: Partial derivatives of the FFDI, calculated as the change in the FFDI due to a unit increase in temperature (˚C), wind speed (km h-1), relative humidity (%) or rainfall (mm day-1). The change is calculated from an initial condition defined by the 95th percentiles of each input parameter as listed in Table 6 for six different locations.
Warra-gamba
Can-berra
Wan-gary
Bridge-town
Wilsons Prom.
Scaman-der
Temperature (˚C) 1.9 1.9 2.6 1.5 1.4 1.0
Wind speed (km h-1) 1.2 1.3 1.8 1.1 1.0 0.6
Relative humidity (%) -1.8 -1.8 -2.5 -1.5 -1.4 -0.9
Rainfall (mm day-1) -2.5 -2.3 -3.4 -2.0 -1.5 -0.7
33
5.1.3 Sensitivity differences based on derivatives
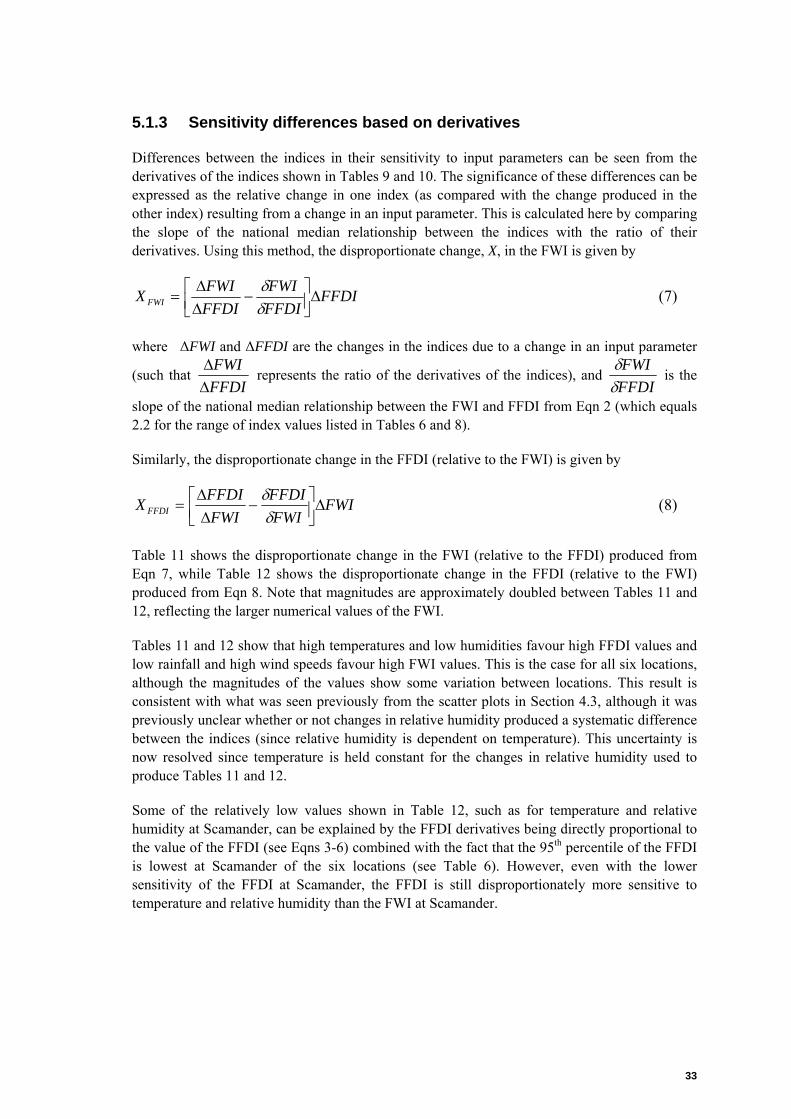
Differences between the indices in their sensitivity to input parameters can be seen from the derivatives of the indices shown in Tables 9 and 10. The significance of these differences can be expressed as the relative change in one index (as compared with the change produced in the other index) resulting from a change in an input parameter. This is calculated here by comparing the slope of the national median relationship between the indices with the ratio of their derivatives. Using this method, the disproportionate change, X, in the FWI is given by
FFDIFFDIFWI
FFDIFWIX FWI Δ⎥⎦
⎤⎢⎣⎡ −ΔΔ
=δδ
(7)
where ΔFWI and ΔFFDI are the changes in the indices due to a change in an input parameter
(such that FFDIFWI
ΔΔ
represents the ratio of the derivatives of the indices), and FFDIFWI
δδ
is the
slope of the national median relationship between the FWI and FFDI from Eqn 2 (which equals 2.2 for the range of index values listed in Tables 6 and 8).
Similarly, the disproportionate change in the FFDI (relative to the FWI) is given by
FWIFWIFFDI
FWIFFDIX FFDI Δ⎥⎦
⎤⎢⎣⎡ −ΔΔ
=δδ
(8)
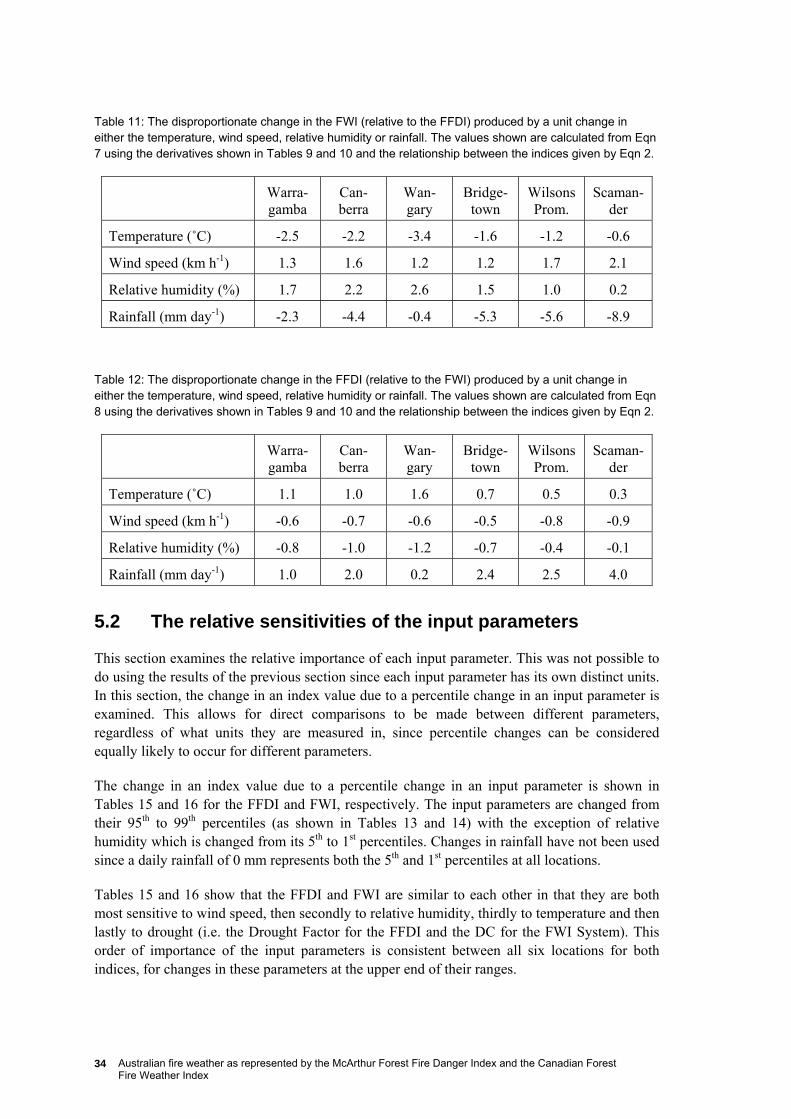
Table 11 shows the disproportionate change in the FWI (relative to the FFDI) produced from Eqn 7, while Table 12 shows the disproportionate change in the FFDI (relative to the FWI) produced from Eqn 8. Note that magnitudes are approximately doubled between Tables 11 and 12, reflecting the larger numerical values of the FWI.
Tables 11 and 12 show that high temperatures and low humidities favour high FFDI values and low rainfall and high wind speeds favour high FWI values. This is the case for all six locations, although the magnitudes of the values show some variation between locations. This result is consistent with what was seen previously from the scatter plots in Section 4.3, although it was previously unclear whether or not changes in relative humidity produced a systematic difference between the indices (since relative humidity is dependent on temperature). This uncertainty is now resolved since temperature is held constant for the changes in relative humidity used to produce Tables 11 and 12.
Some of the relatively low values shown in Table 12, such as for temperature and relative humidity at Scamander, can be explained by the FFDI derivatives being directly proportional to the value of the FFDI (see Eqns 3-6) combined with the fact that the 95th percentile of the FFDI is lowest at Scamander of the six locations (see Table 6). However, even with the lower sensitivity of the FFDI at Scamander, the FFDI is still disproportionately more sensitive to temperature and relative humidity than the FWI at Scamander.
Australian fire weather as represented by the McArthur Forest Fire Danger Index and the Canadian Forest Fire Weather Index
34
Table 11: The disproportionate change in the FWI (relative to the FFDI) produced by a unit change in either the temperature, wind speed, relative humidity or rainfall. The values shown are calculated from Eqn 7 using the derivatives shown in Tables 9 and 10 and the relationship between the indices given by Eqn 2.
Warra-gamba
Can-berra
Wan-gary
Bridge-town
Wilsons Prom.
Scaman-der
Temperature (˚C) -2.5 -2.2 -3.4 -1.6 -1.2 -0.6
Wind speed (km h-1) 1.3 1.6 1.2 1.2 1.7 2.1
Relative humidity (%) 1.7 2.2 2.6 1.5 1.0 0.2
Rainfall (mm day-1) -2.3 -4.4 -0.4 -5.3 -5.6 -8.9
Table 12: The disproportionate change in the FFDI (relative to the FWI) produced by a unit change in either the temperature, wind speed, relative humidity or rainfall. The values shown are calculated from Eqn 8 using the derivatives shown in Tables 9 and 10 and the relationship between the indices given by Eqn 2.
Warra-gamba
Can-berra
Wan-gary
Bridge-town
Wilsons Prom.
Scaman-der
Temperature (˚C) 1.1 1.0 1.6 0.7 0.5 0.3
Wind speed (km h-1) -0.6 -0.7 -0.6 -0.5 -0.8 -0.9
Relative humidity (%) -0.8 -1.0 -1.2 -0.7 -0.4 -0.1
Rainfall (mm day-1) 1.0 2.0 0.2 2.4 2.5 4.0
5.2 The relative sensitivities of the input parameters
This section examines the relative importance of each input parameter. This was not possible to do using the results of the previous section since each input parameter has its own distinct units. In this section, the change in an index value due to a percentile change in an input parameter is examined. This allows for direct comparisons to be made between different parameters, regardless of what units they are measured in, since percentile changes can be considered equally likely to occur for different parameters.
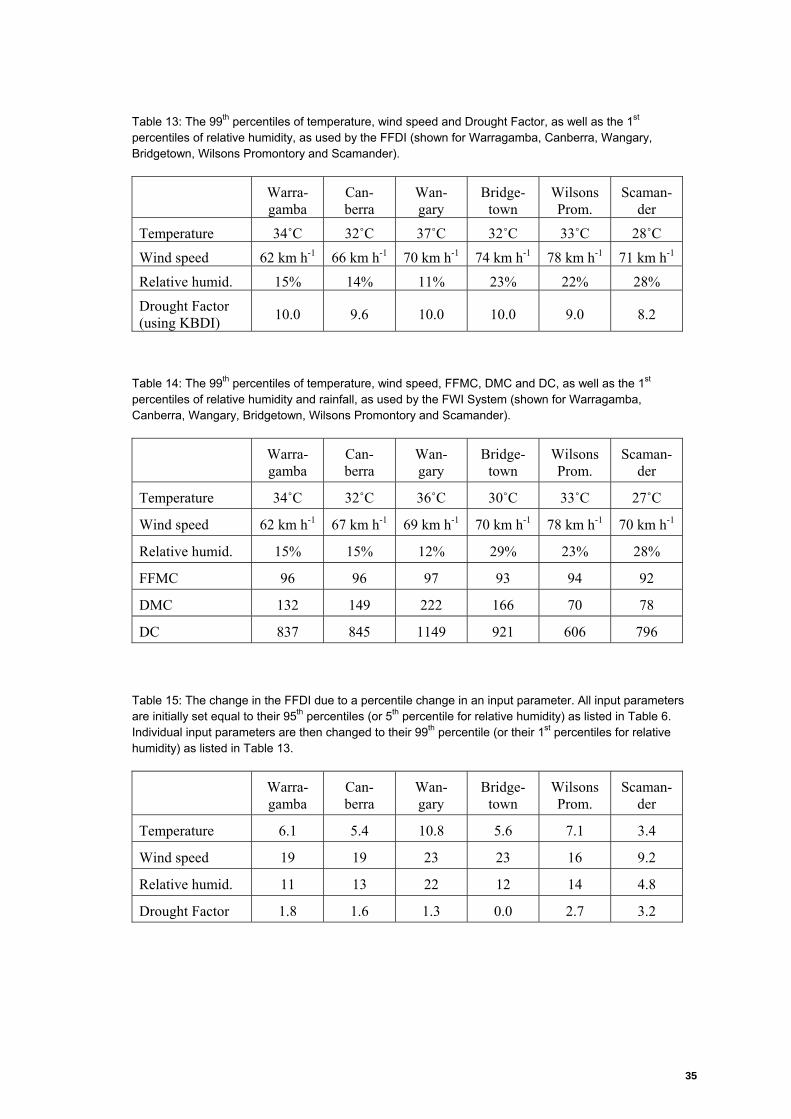
The change in an index value due to a percentile change in an input parameter is shown in Tables 15 and 16 for the FFDI and FWI, respectively. The input parameters are changed from their 95th to 99th percentiles (as shown in Tables 13 and 14) with the exception of relative humidity which is changed from its 5th to 1st percentiles. Changes in rainfall have not been used since a daily rainfall of 0 mm represents both the 5th and 1st percentiles at all locations.
Tables 15 and 16 show that the FFDI and FWI are similar to each other in that they are both most sensitive to wind speed, then secondly to relative humidity, thirdly to temperature and then lastly to drought (i.e. the Drought Factor for the FFDI and the DC for the FWI System). This order of importance of the input parameters is consistent between all six locations for both indices, for changes in these parameters at the upper end of their ranges.
35
Table 13: The 99th percentiles of temperature, wind speed and Drought Factor, as well as the 1st percentiles of relative humidity, as used by the FFDI (shown for Warragamba, Canberra, Wangary, Bridgetown, Wilsons Promontory and Scamander).
Warra-gamba
Can-berra
Wan-gary
Bridge-town
Wilsons Prom.
Scaman-der
Temperature 34˚C 32˚C 37˚C 32˚C 33˚C 28˚C
Wind speed 62 km h-1 66 km h-1 70 km h-1 74 km h-1 78 km h-1 71 km h-1
Relative humid. 15% 14% 11% 23% 22% 28%
Drought Factor (using KBDI) 10.0 9.6 10.0 10.0 9.0 8.2
Table 14: The 99th percentiles of temperature, wind speed, FFMC, DMC and DC, as well as the 1st percentiles of relative humidity and rainfall, as used by the FWI System (shown for Warragamba, Canberra, Wangary, Bridgetown, Wilsons Promontory and Scamander).
Warra-gamba
Can-berra
Wan-gary
Bridge-town
Wilsons Prom.
Scaman-der
Temperature 34˚C 32˚C 36˚C 30˚C 33˚C 27˚C
Wind speed 62 km h-1 67 km h-1 69 km h-1 70 km h-1 78 km h-1 70 km h-1
Relative humid. 15% 15% 12% 29% 23% 28%
FFMC 96 96 97 93 94 92
DMC 132 149 222 166 70 78
DC 837 845 1149 921 606 796
Table 15: The change in the FFDI due to a percentile change in an input parameter. All input parameters are initially set equal to their 95th percentiles (or 5th percentile for relative humidity) as listed in Table 6. Individual input parameters are then changed to their 99th percentile (or their 1st percentiles for relative humidity) as listed in Table 13.
Warra-gamba
Can-berra
Wan-gary
Bridge-town
Wilsons Prom.
Scaman-der
Temperature 6.1 5.4 10.8 5.6 7.1 3.4
Wind speed 19 19 23 23 16 9.2
Relative humid. 11 13 22 12 14 4.8
Drought Factor 1.8 1.6 1.3 0.0 2.7 3.2
Australian fire weather as represented by the McArthur Forest Fire Danger Index and the Canadian Forest Fire Weather Index
36
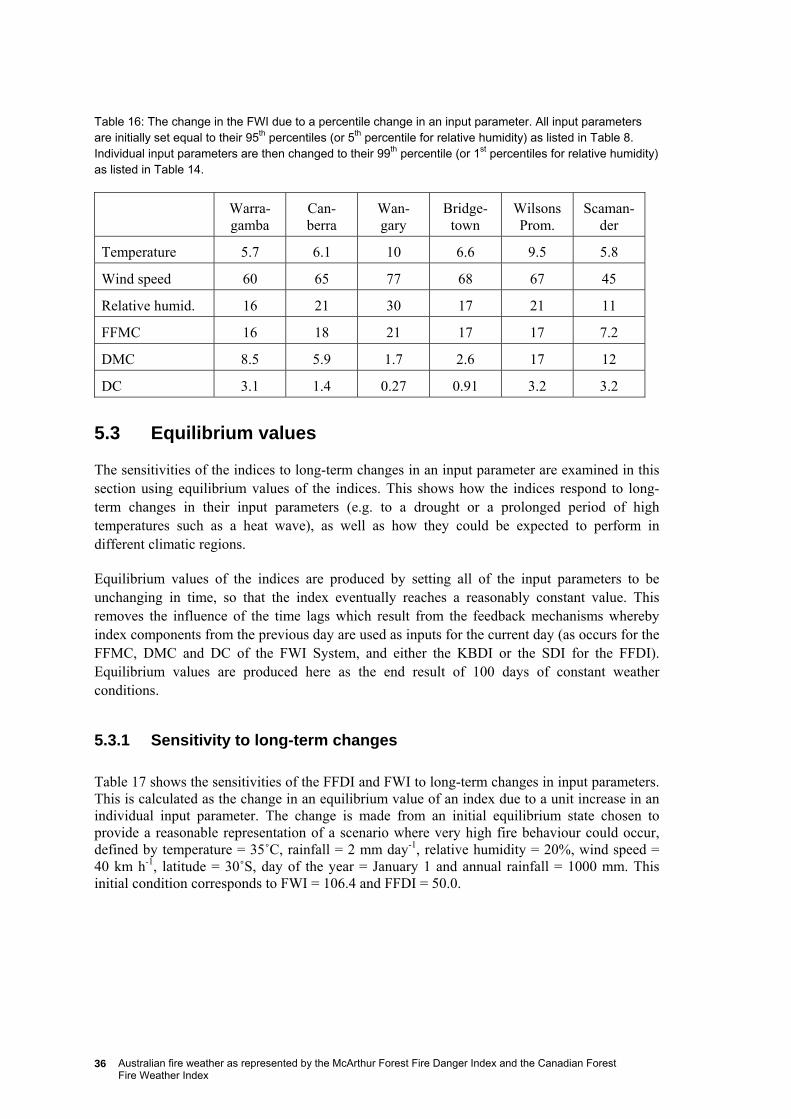
Table 16: The change in the FWI due to a percentile change in an input parameter. All input parameters are initially set equal to their 95th percentiles (or 5th percentile for relative humidity) as listed in Table 8. Individual input parameters are then changed to their 99th percentile (or 1st percentiles for relative humidity) as listed in Table 14.
Warra-gamba
Can-berra
Wan-gary
Bridge-town
Wilsons Prom.
Scaman-der
Temperature 5.7 6.1 10 6.6 9.5 5.8
Wind speed 60 65 77 68 67 45
Relative humid. 16 21 30 17 21 11
FFMC 16 18 21 17 17 7.2
DMC 8.5 5.9 1.7 2.6 17 12
DC 3.1 1.4 0.27 0.91 3.2 3.2
5.3 Equilibrium values
The sensitivities of the indices to long-term changes in an input parameter are examined in this section using equilibrium values of the indices. This shows how the indices respond to long-term changes in their input parameters (e.g. to a drought or a prolonged period of high temperatures such as a heat wave), as well as how they could be expected to perform in different climatic regions.
Equilibrium values of the indices are produced by setting all of the input parameters to be unchanging in time, so that the index eventually reaches a reasonably constant value. This removes the influence of the time lags which result from the feedback mechanisms whereby index components from the previous day are used as inputs for the current day (as occurs for the FFMC, DMC and DC of the FWI System, and either the KBDI or the SDI for the FFDI). Equilibrium values are produced here as the end result of 100 days of constant weather conditions.
5.3.1 Sensitivity to long-term changes
Table 17 shows the sensitivities of the FFDI and FWI to long-term changes in input parameters. This is calculated as the change in an equilibrium value of an index due to a unit increase in an individual input parameter. The change is made from an initial equilibrium state chosen to provide a reasonable representation of a scenario where very high fire behaviour could occur, defined by temperature = 35˚C, rainfall = 2 mm day-1, relative humidity = 20%, wind speed = 40 km h-1, latitude = 30˚S, day of the year = January 1 and annual rainfall = 1000 mm. This initial condition corresponds to FWI = 106.4 and FFDI = 50.0.
37
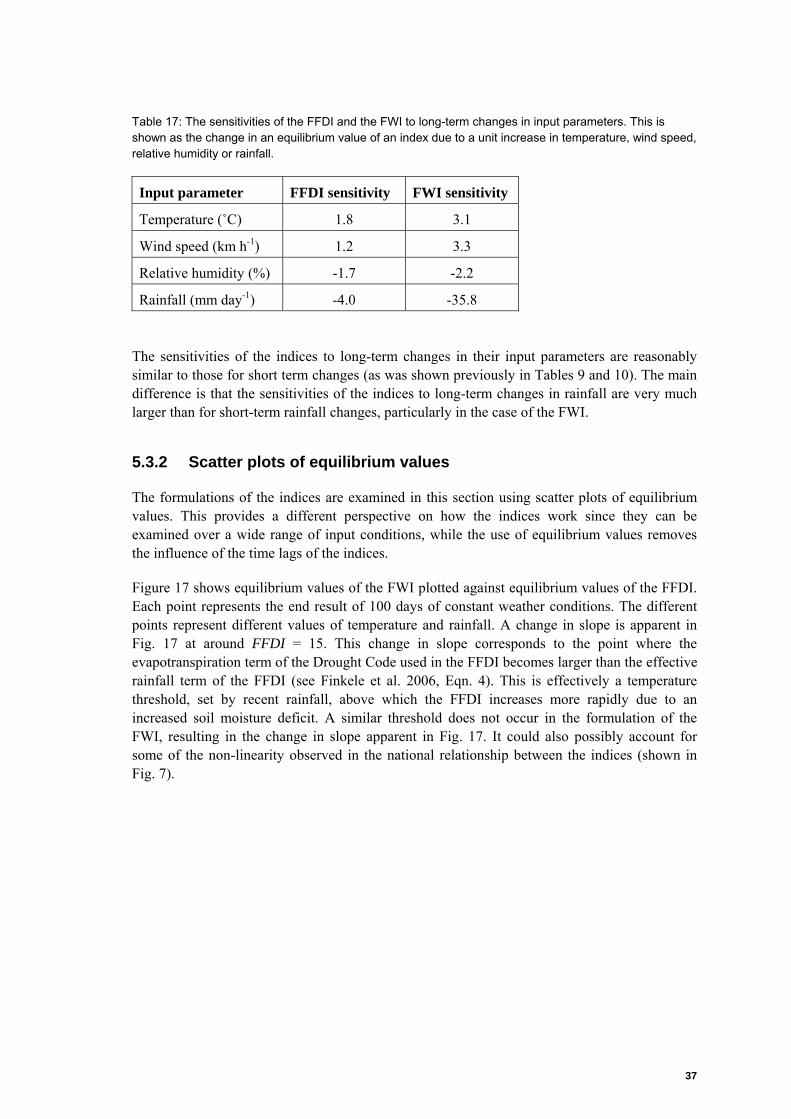
Table 17: The sensitivities of the FFDI and the FWI to long-term changes in input parameters. This is shown as the change in an equilibrium value of an index due to a unit increase in temperature, wind speed, relative humidity or rainfall.
Input parameter FFDI sensitivity FWI sensitivity
Temperature (˚C) 1.8 3.1
Wind speed (km h-1) 1.2 3.3
Relative humidity (%) -1.7 -2.2
Rainfall (mm day-1) -4.0 -35.8
The sensitivities of the indices to long-term changes in their input parameters are reasonably similar to those for short term changes (as was shown previously in Tables 9 and 10). The main difference is that the sensitivities of the indices to long-term changes in rainfall are very much larger than for short-term rainfall changes, particularly in the case of the FWI.
5.3.2 Scatter plots of equilibrium values
The formulations of the indices are examined in this section using scatter plots of equilibrium values. This provides a different perspective on how the indices work since they can be examined over a wide range of input conditions, while the use of equilibrium values removes the influence of the time lags of the indices.
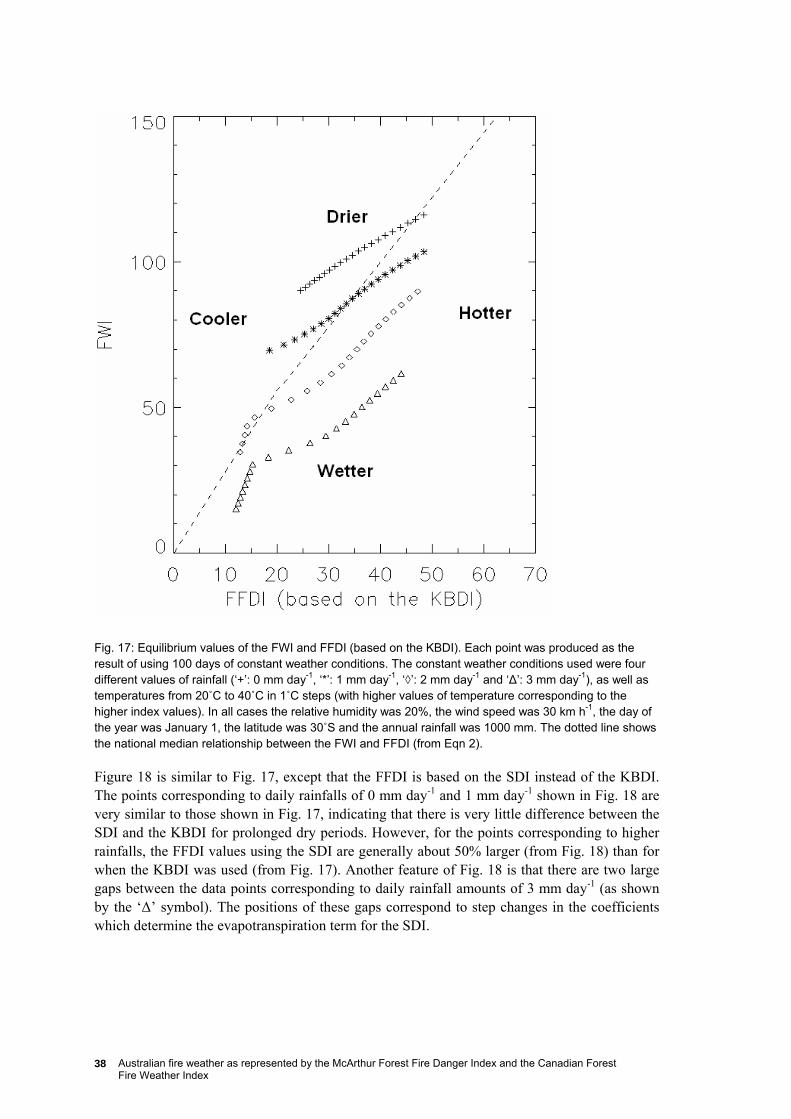
Figure 17 shows equilibrium values of the FWI plotted against equilibrium values of the FFDI. Each point represents the end result of 100 days of constant weather conditions. The different points represent different values of temperature and rainfall. A change in slope is apparent in Fig. 17 at around FFDI = 15. This change in slope corresponds to the point where the evapotranspiration term of the Drought Code used in the FFDI becomes larger than the effective rainfall term of the FFDI (see Finkele et al. 2006, Eqn. 4). This is effectively a temperature threshold, set by recent rainfall, above which the FFDI increases more rapidly due to an increased soil moisture deficit. A similar threshold does not occur in the formulation of the FWI, resulting in the change in slope apparent in Fig. 17. It could also possibly account for some of the non-linearity observed in the national relationship between the indices (shown in Fig. 7).
Australian fire weather as represented by the McArthur Forest Fire Danger Index and the Canadian Forest Fire Weather Index
38
Fig. 17: Equilibrium values of the FWI and FFDI (based on the KBDI). Each point was produced as the result of using 100 days of constant weather conditions. The constant weather conditions used were four different values of rainfall (‘+’: 0 mm day-1, ‘*’: 1 mm day-1, ‘◊’: 2 mm day-1 and ‘Δ’: 3 mm day-1), as well as temperatures from 20˚C to 40˚C in 1˚C steps (with higher values of temperature corresponding to the higher index values). In all cases the relative humidity was 20%, the wind speed was 30 km h-1, the day of the year was January 1, the latitude was 30˚S and the annual rainfall was 1000 mm. The dotted line shows the national median relationship between the FWI and FFDI (from Eqn 2).
Figure 18 is similar to Fig. 17, except that the FFDI is based on the SDI instead of the KBDI. The points corresponding to daily rainfalls of 0 mm day-1 and 1 mm day-1 shown in Fig. 18 are very similar to those shown in Fig. 17, indicating that there is very little difference between the SDI and the KBDI for prolonged dry periods. However, for the points corresponding to higher rainfalls, the FFDI values using the SDI are generally about 50% larger (from Fig. 18) than for when the KBDI was used (from Fig. 17). Another feature of Fig. 18 is that there are two large gaps between the data points corresponding to daily rainfall amounts of 3 mm day-1 (as shown by the ‘Δ’ symbol). The positions of these gaps correspond to step changes in the coefficients which determine the evapotranspiration term for the SDI.
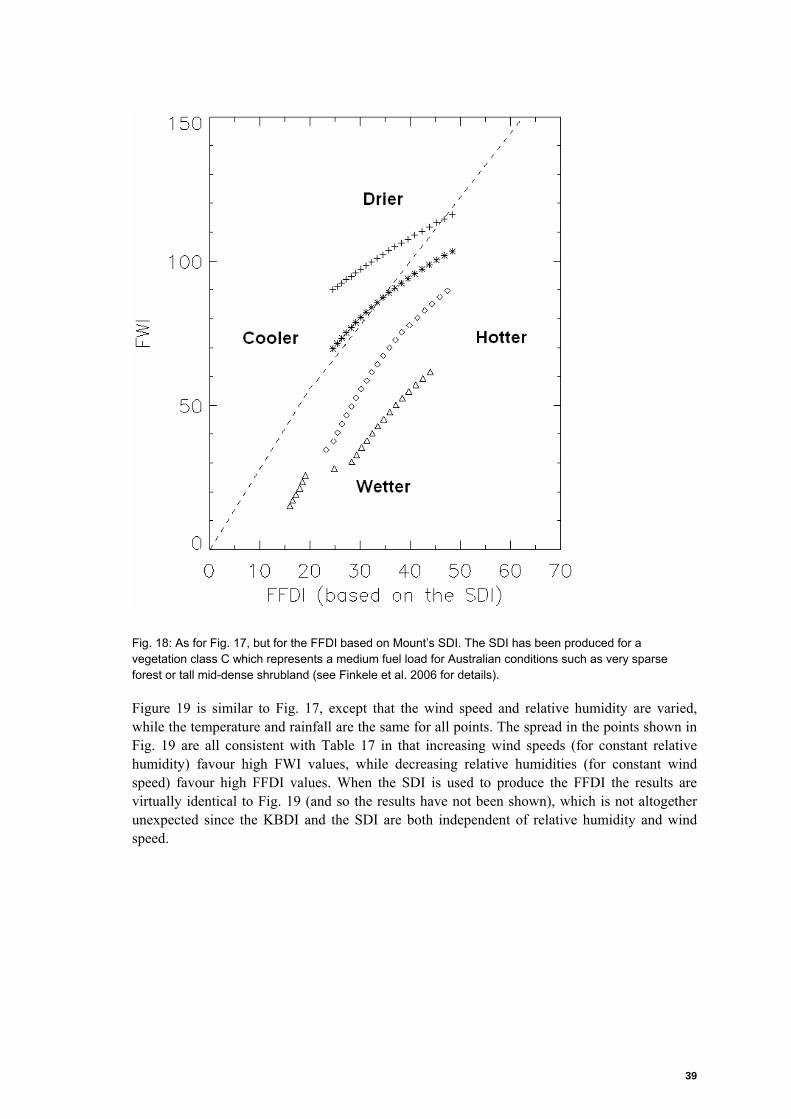
39
Fig. 18: As for Fig. 17, but for the FFDI based on Mount’s SDI. The SDI has been produced for a vegetation class C which represents a medium fuel load for Australian conditions such as very sparse forest or tall mid-dense shrubland (see Finkele et al. 2006 for details).
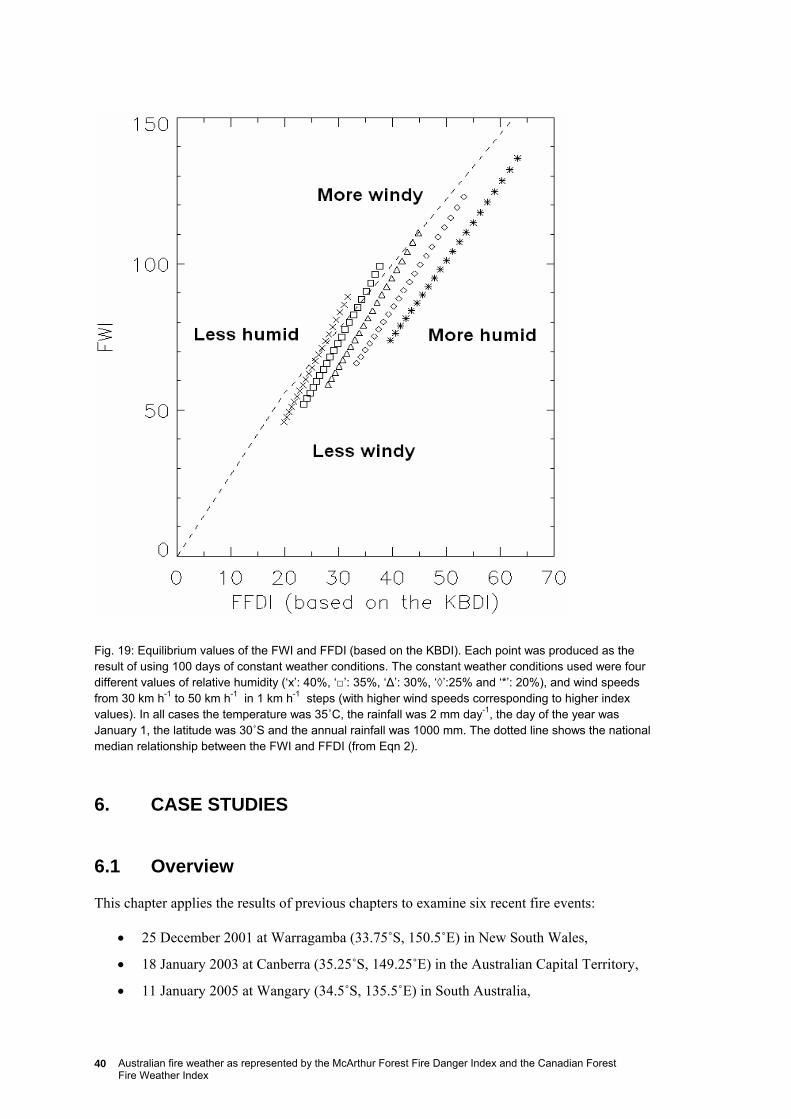
Figure 19 is similar to Fig. 17, except that the wind speed and relative humidity are varied, while the temperature and rainfall are the same for all points. The spread in the points shown in Fig. 19 are all consistent with Table 17 in that increasing wind speeds (for constant relative humidity) favour high FWI values, while decreasing relative humidities (for constant wind speed) favour high FFDI values. When the SDI is used to produce the FFDI the results are virtually identical to Fig. 19 (and so the results have not been shown), which is not altogether unexpected since the KBDI and the SDI are both independent of relative humidity and wind speed.
Australian fire weather as represented by the McArthur Forest Fire Danger Index and the Canadian Forest Fire Weather Index
40
Fig. 19: Equilibrium values of the FWI and FFDI (based on the KBDI). Each point was produced as the result of using 100 days of constant weather conditions. The constant weather conditions used were four different values of relative humidity (‘x’: 40%, ‘□’: 35%, ‘Δ’: 30%, ‘◊’:25% and ‘*’: 20%), and wind speeds from 30 km h-1 to 50 km h-1 in 1 km h-1 steps (with higher wind speeds corresponding to higher index values). In all cases the temperature was 35˚C, the rainfall was 2 mm day-1, the day of the year was January 1, the latitude was 30˚S and the annual rainfall was 1000 mm. The dotted line shows the national median relationship between the FWI and FFDI (from Eqn 2).
6. CASE STUDIES
6.1 Overview
This chapter applies the results of previous chapters to examine six recent fire events:
• 25 December 2001 at Warragamba (33.75˚S, 150.5˚E) in New South Wales,
• 18 January 2003 at Canberra (35.25˚S, 149.25˚E) in the Australian Capital Territory,
• 11 January 2005 at Wangary (34.5˚S, 135.5˚E) in South Australia,
41
• 23 March 2005 at Bridgetown (34˚S, 116˚E) in Western Australia,
• 2 April 2005 at Wilsons Promontory (38.75˚S, 146.25˚E) in Victoria, and
• 11 December 2006 at Scamander (41.5˚S, 148.25˚E) in Tasmania.
These events were selected partly because of the severity of the fire behaviour which was observed in each case and also because their locations cover a wide range of different geographical regions (Fig. 8) and climatic conditions. The first three events are similar in that they occur in regions where index values are normally quite high, while the last three occur in regions where index values are normally relatively low (see Figs. 2 and 3). The locations of the case studies are concentrated in Australia’s temperate zone since this is where the vast majority of devastating bushfires occur (e.g. those associated with loss of life). Scatter plots of the FWI versus the FFDI were previously shown in Fig. 9 for each of the six case study locations, with the day of the case study event highlighted for each location.
These events are examined in terms of the FFDI and FWI values, together with their percentiles. The differences between the indices in how they represent the case studies are discussed in terms of the sensitivity differences between the indices. The individual subcomponents of the indices are also examined to provide insight into which ingredients contribute to the higher values of the two indices for the individual events.
It was seen in Chapter 3 that some regions where index values are relatively low correspond to regions where significant fire activity occurs (e.g. eastern Victoria, Tasmania and southwest Western Australia), suggesting that there may be some variation in the significance of an index value between different regions. One of the goals of this chapter is to investigate the level of variation between the magnitude of the value of each index, and also in the percentile value of that index (which might be considered a measure of the significance of a particular index value at that location) for some major fires that occurred in different climatic and geographic regions. It must also be noted that these fire weather/danger indices only include meteorological factors – there is no allowance for fuel load/type variations between regions, or for differences in fire management or resource variations.
It should be kept in mind that the results presented here will not necessarily match what would be obtained from single station data since the data used in this report are derived from gridded analysis or forecast fields with data from the nearest grid point to each location being used. Weymouth et al. (1999) and Finkele et al. (2006) discuss the differences to be expected between gridded analyses and station observations.
6.2 Individual events
6.2.1 The Warragamba fire of December 2001
The longest official continuous bushfire emergency in New South Wales history occurred between 21 December 2001 and 13 January 2002 (Emergency Management Australia 2008). Well over 5000 livestock died, as well as large numbers of native animals. A total of about 121 homes were destroyed and about 10,000 people were evacuated. Some of the most extreme fires
Australian fire weather as represented by the McArthur Forest Fire Danger Index and the Canadian Forest Fire Weather Index
42
occurred in the Blue Mountains and the outer Western Sydney regions, with the majority of property damage occurring between Christmas Eve and Boxing Day. The town of Warragamba in this region was particularly badly hit by the fires on Christmas Day, leaving about 30 homes destroyed.
The FFDI and FWI are shown for 25 December 2001 throughout Australia in Fig. 2. Percentiles of the index values on this day are also shown, calculated individually for each grid point. Percentiles are shown based on daily data from the entire data set (from 1 January 2000 to 31 December 2007), as well as based on daily data from December only (for all of the years 2000 to 2007). The monthly percentiles are only derived from about 240 days of data and therefore have a larger uncertainty than the percentiles based on the entire data set. The uncertainty in the percentile values could be reduced if a longer period of data was available. Figure 21 is similar to Fig. 20, but enlarged for the area around Warragamba.
In this case both the FFDI and the FWI forecasts indicate extreme values for Warragamba in terms of their absolute magnitudes and in terms of their percentile values. The indices are also reasonably similar to each other in other regions, although the FWI does indicate that the extreme conditions extend further south and west of Warragamba than does the FFDI.
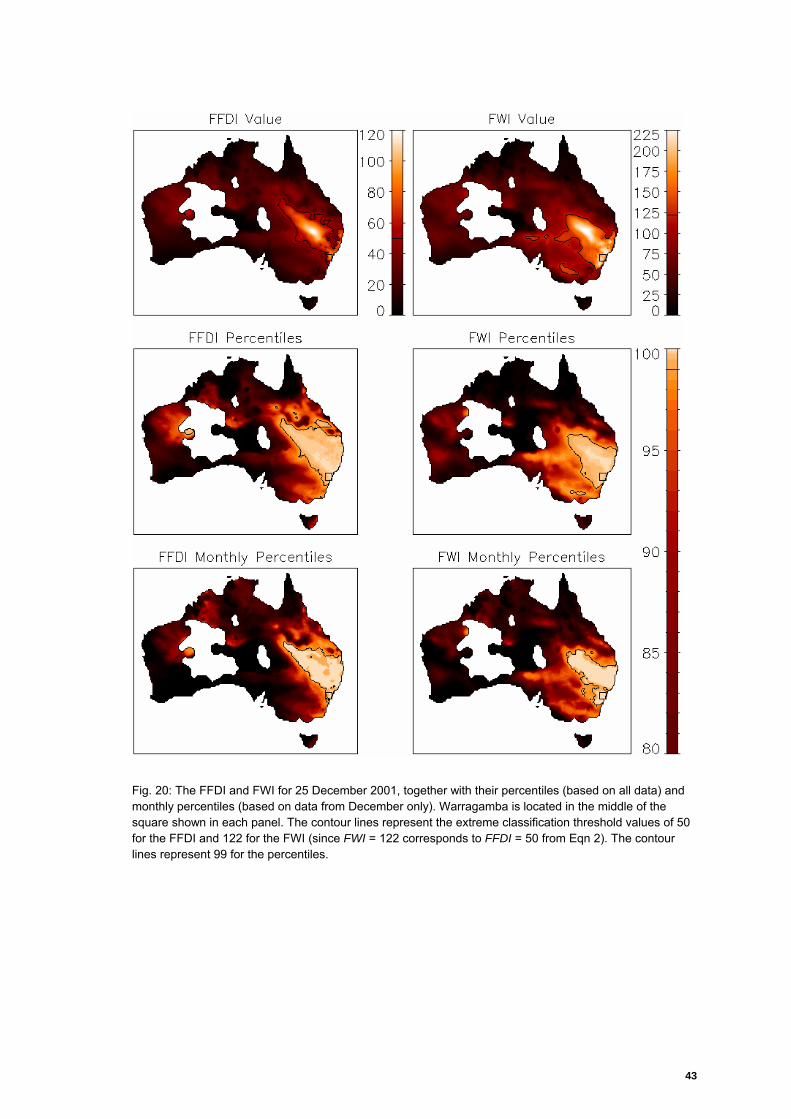
43
Fig. 20: The FFDI and FWI for 25 December 2001, together with their percentiles (based on all data) and monthly percentiles (based on data from December only). Warragamba is located in the middle of the square shown in each panel. The contour lines represent the extreme classification threshold values of 50 for the FFDI and 122 for the FWI (since FWI = 122 corresponds to FFDI = 50 from Eqn 2). The contour lines represent 99 for the percentiles.
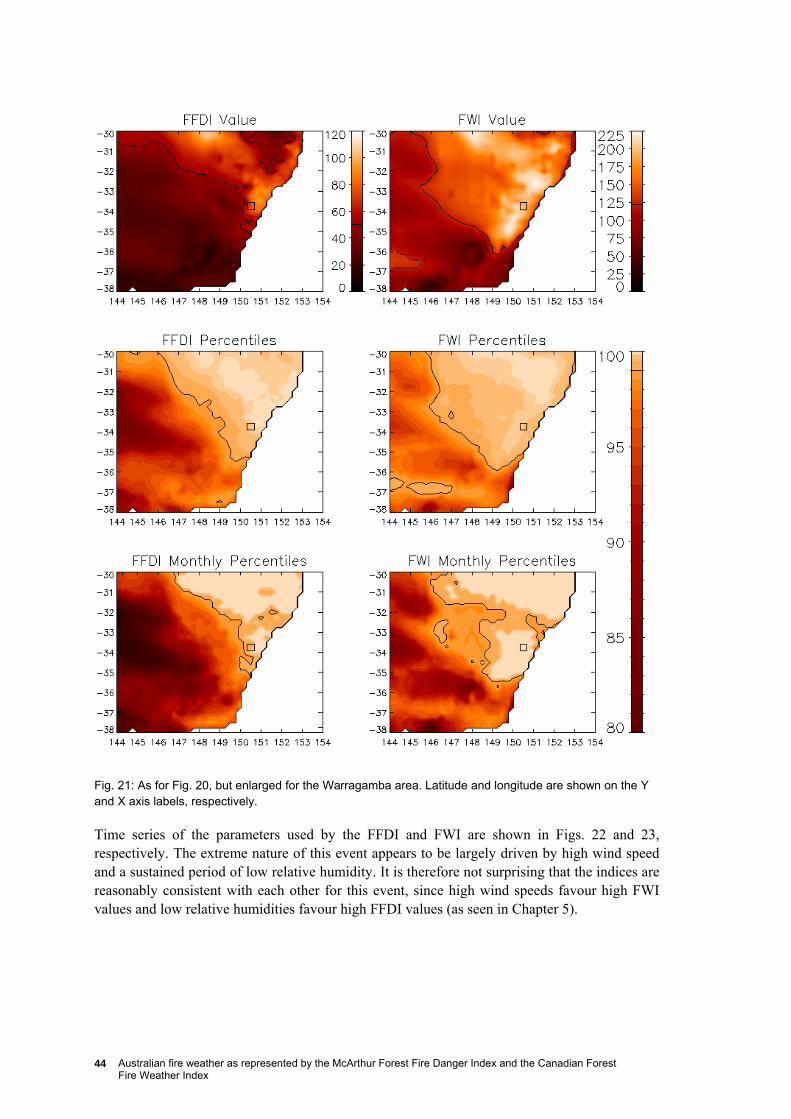
Australian fire weather as represented by the McArthur Forest Fire Danger Index and the Canadian Forest Fire Weather Index
44
Fig. 21: As for Fig. 20, but enlarged for the Warragamba area. Latitude and longitude are shown on the Y and X axis labels, respectively.
Time series of the parameters used by the FFDI and FWI are shown in Figs. 22 and 23, respectively. The extreme nature of this event appears to be largely driven by high wind speed and a sustained period of low relative humidity. It is therefore not surprising that the indices are reasonably consistent with each other for this event, since high wind speeds favour high FWI values and low relative humidities favour high FFDI values (as seen in Chapter 5).
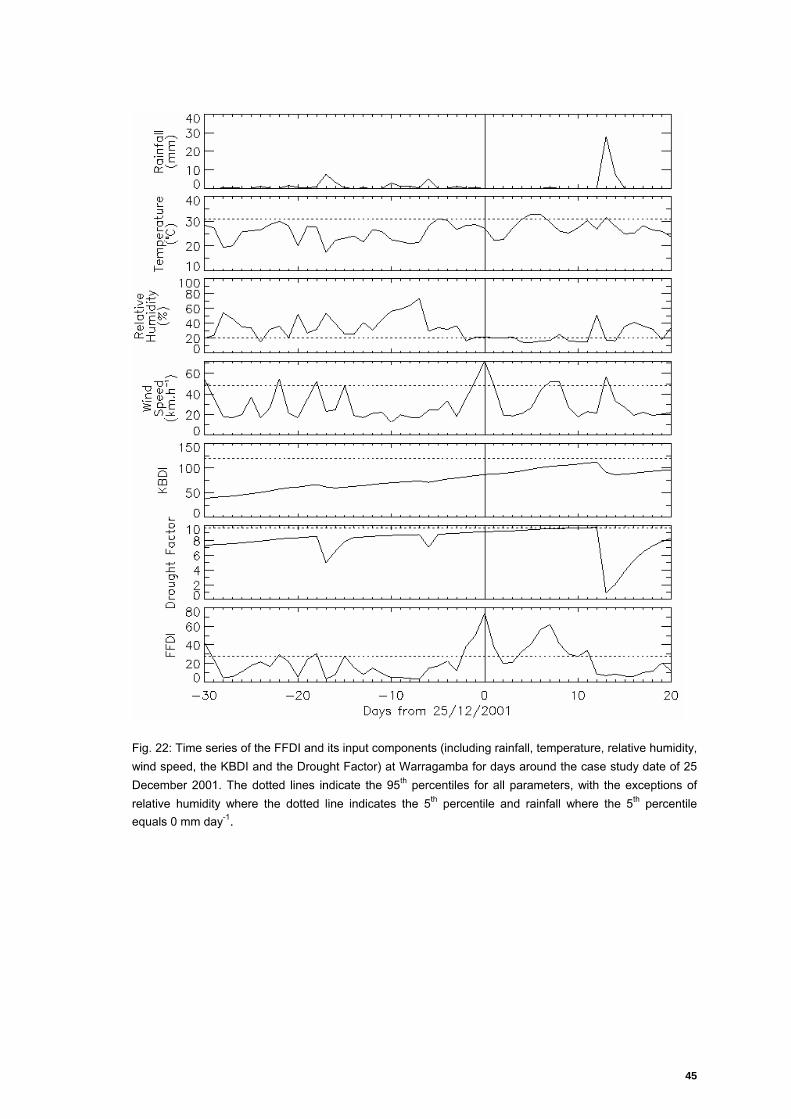
45
Fig. 22: Time series of the FFDI and its input components (including rainfall, temperature, relative humidity, wind speed, the KBDI and the Drought Factor) at Warragamba for days around the case study date of 25 December 2001. The dotted lines indicate the 95th percentiles for all parameters, with the exceptions of relative humidity where the dotted line indicates the 5th percentile and rainfall where the 5th percentile equals 0 mm day-1.
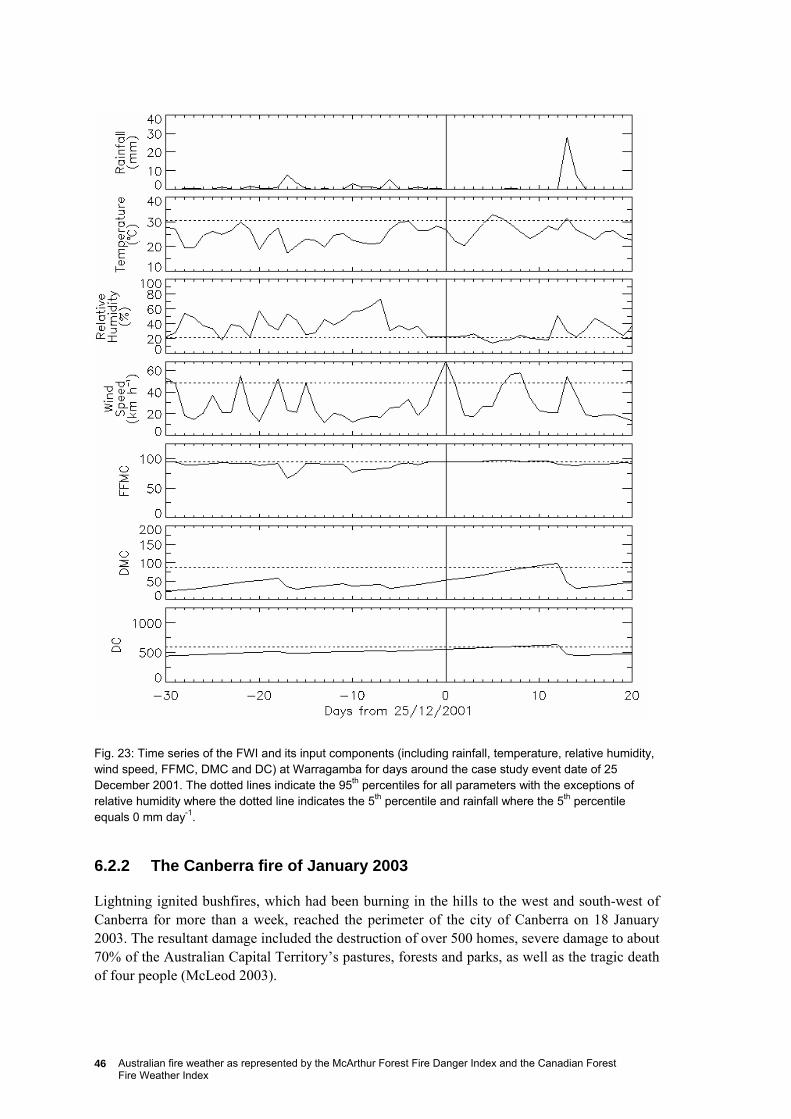
Australian fire weather as represented by the McArthur Forest Fire Danger Index and the Canadian Forest Fire Weather Index
46
Fig. 23: Time series of the FWI and its input components (including rainfall, temperature, relative humidity, wind speed, FFMC, DMC and DC) at Warragamba for days around the case study event date of 25 December 2001. The dotted lines indicate the 95th percentiles for all parameters with the exceptions of relative humidity where the dotted line indicates the 5th percentile and rainfall where the 5th percentile equals 0 mm day-1.
6.2.2 The Canberra fire of January 2003
Lightning ignited bushfires, which had been burning in the hills to the west and south-west of Canberra for more than a week, reached the perimeter of the city of Canberra on 18 January 2003. The resultant damage included the destruction of over 500 homes, severe damage to about 70% of the Australian Capital Territory’s pastures, forests and parks, as well as the tragic death of four people (McLeod 2003).
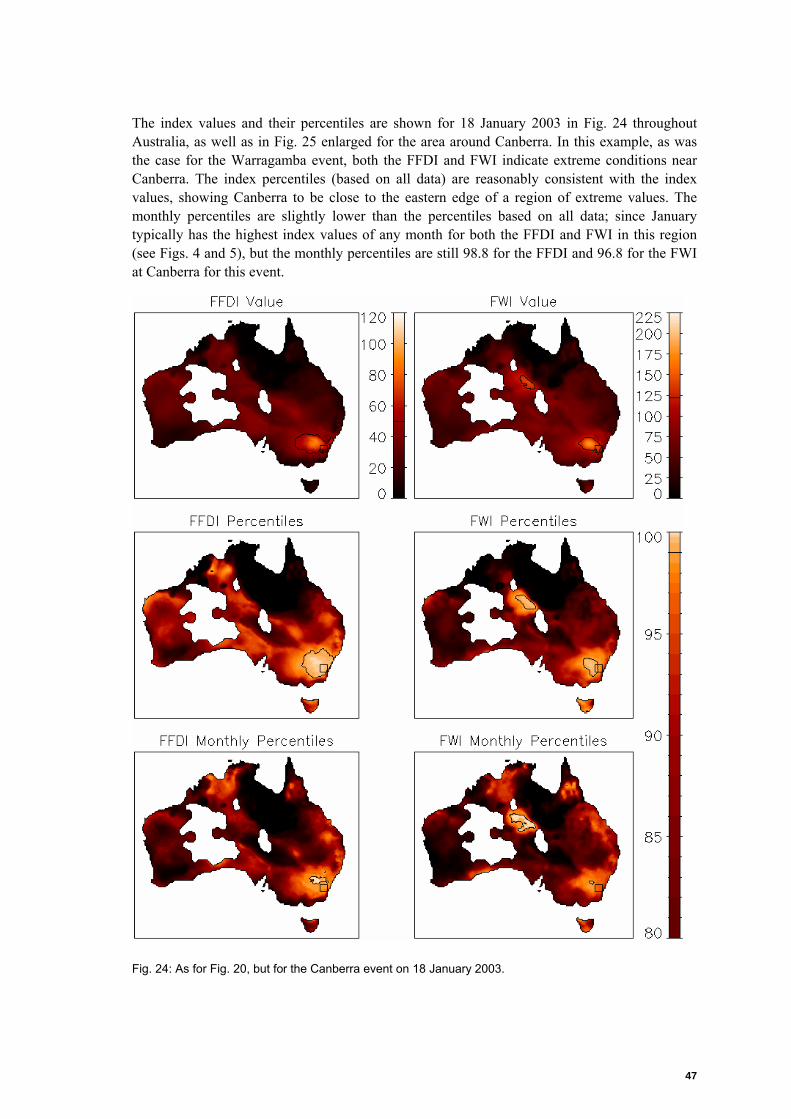
47
The index values and their percentiles are shown for 18 January 2003 in Fig. 24 throughout Australia, as well as in Fig. 25 enlarged for the area around Canberra. In this example, as was the case for the Warragamba event, both the FFDI and FWI indicate extreme conditions near Canberra. The index percentiles (based on all data) are reasonably consistent with the index values, showing Canberra to be close to the eastern edge of a region of extreme values. The monthly percentiles are slightly lower than the percentiles based on all data; since January typically has the highest index values of any month for both the FFDI and FWI in this region (see Figs. 4 and 5), but the monthly percentiles are still 98.8 for the FFDI and 96.8 for the FWI at Canberra for this event.
Fig. 24: As for Fig. 20, but for the Canberra event on 18 January 2003.
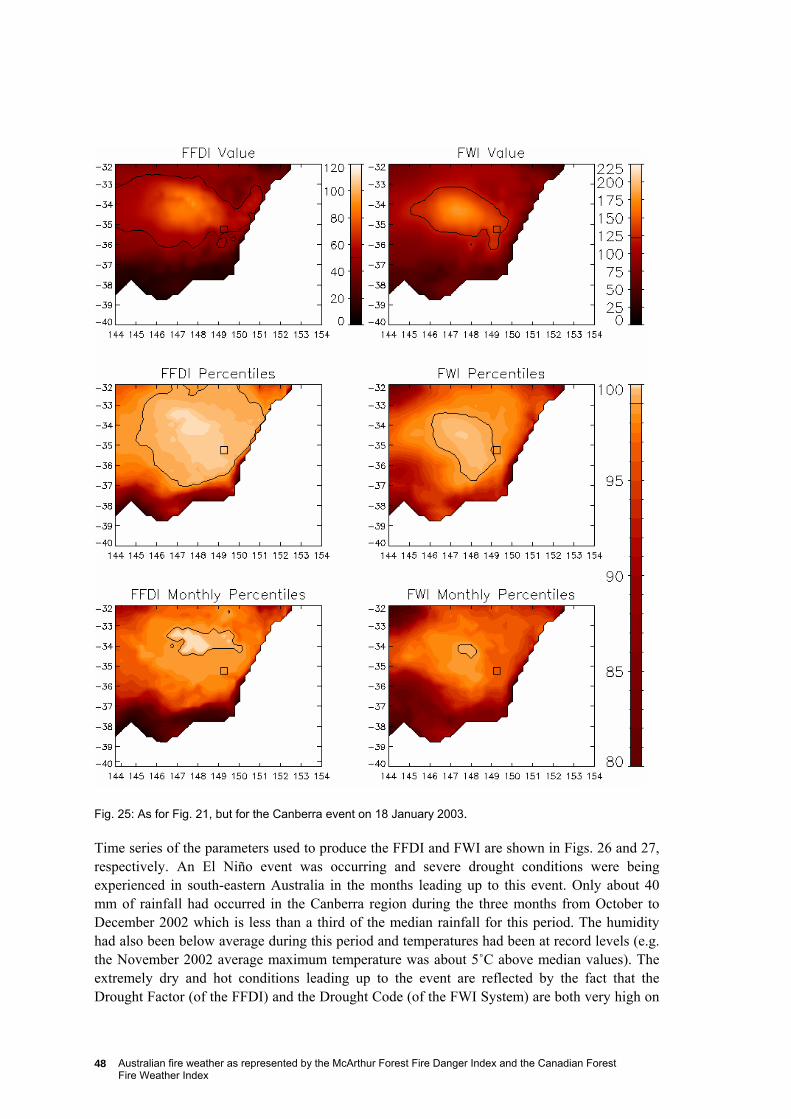
Australian fire weather as represented by the McArthur Forest Fire Danger Index and the Canadian Forest Fire Weather Index
48
Fig. 25: As for Fig. 21, but for the Canberra event on 18 January 2003.
Time series of the parameters used to produce the FFDI and FWI are shown in Figs. 26 and 27, respectively. An El Niño event was occurring and severe drought conditions were being experienced in south-eastern Australia in the months leading up to this event. Only about 40 mm of rainfall had occurred in the Canberra region during the three months from October to December 2002 which is less than a third of the median rainfall for this period. The humidity had also been below average during this period and temperatures had been at record levels (e.g. the November 2002 average maximum temperature was about 5˚C above median values). The extremely dry and hot conditions leading up to the event are reflected by the fact that the Drought Factor (of the FFDI) and the Drought Code (of the FWI System) are both very high on
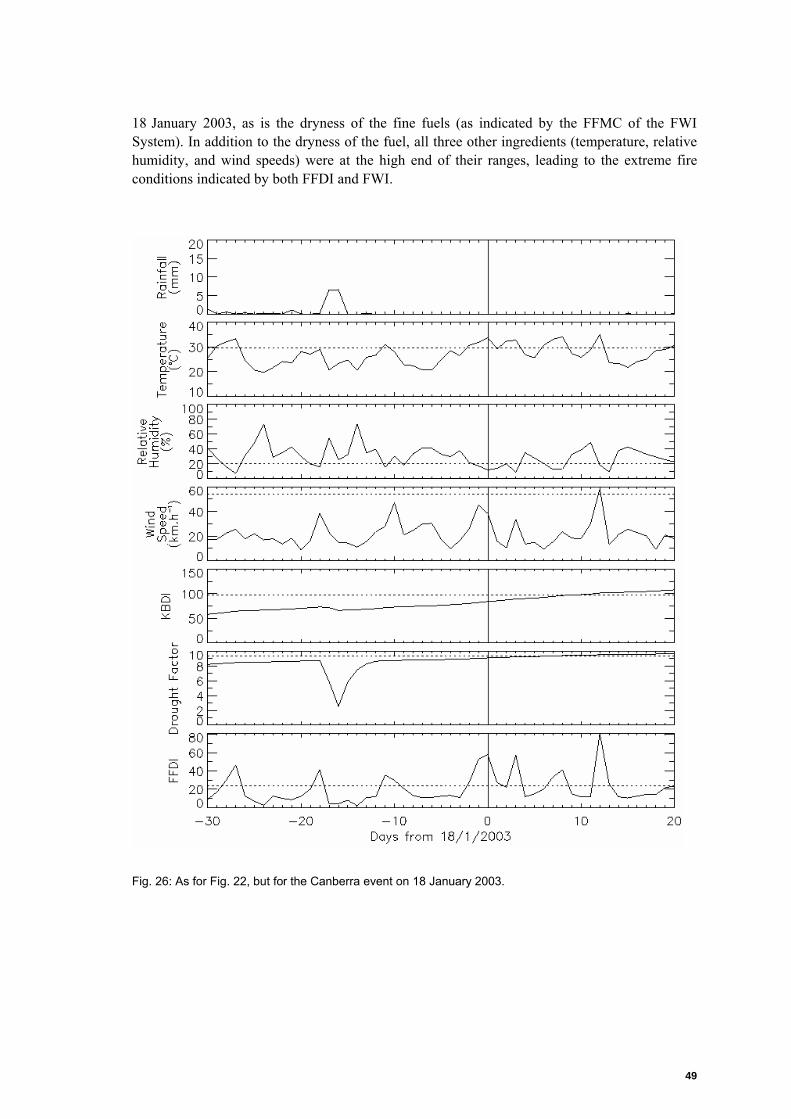
49
18 January 2003, as is the dryness of the fine fuels (as indicated by the FFMC of the FWI System). In addition to the dryness of the fuel, all three other ingredients (temperature, relative humidity, and wind speeds) were at the high end of their ranges, leading to the extreme fire conditions indicated by both FFDI and FWI.
Fig. 26: As for Fig. 22, but for the Canberra event on 18 January 2003.
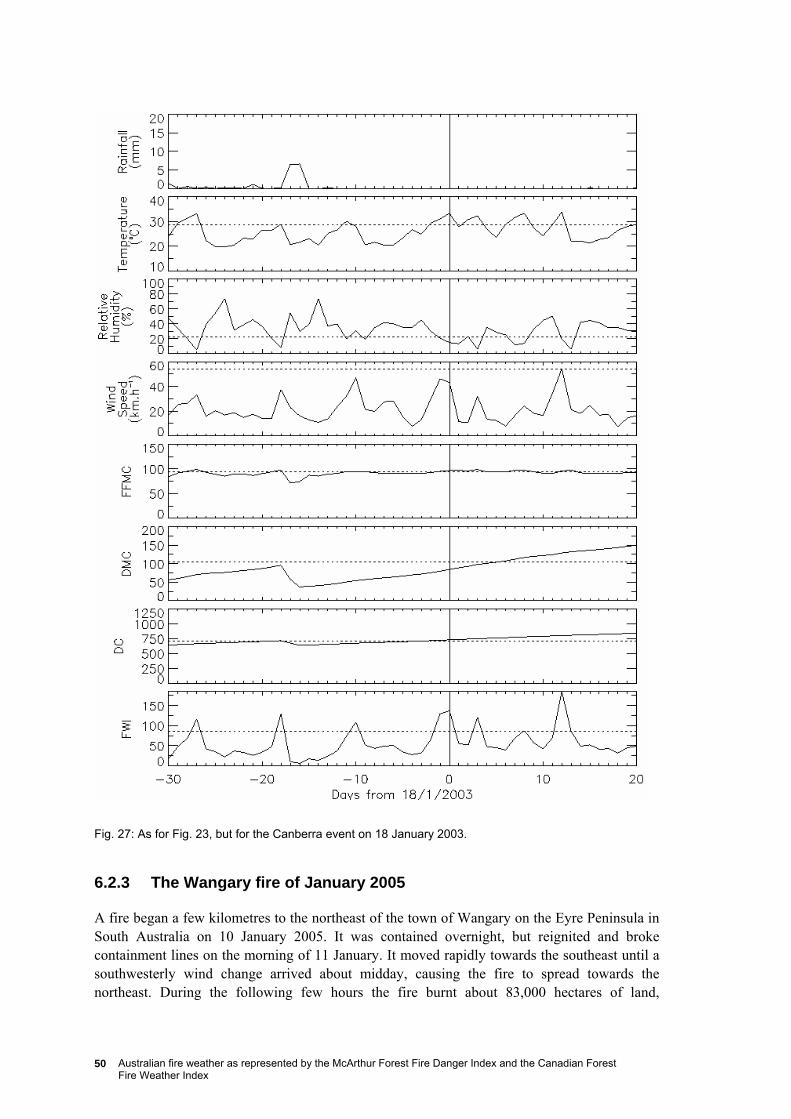
Australian fire weather as represented by the McArthur Forest Fire Danger Index and the Canadian Forest Fire Weather Index
50
Fig. 27: As for Fig. 23, but for the Canberra event on 18 January 2003.
6.2.3 The Wangary fire of January 2005
A fire began a few kilometres to the northeast of the town of Wangary on the Eyre Peninsula in South Australia on 10 January 2005. It was contained overnight, but reignited and broke containment lines on the morning of 11 January. It moved rapidly towards the southeast until a southwesterly wind change arrived about midday, causing the fire to spread towards the northeast. During the following few hours the fire burnt about 83,000 hectares of land,
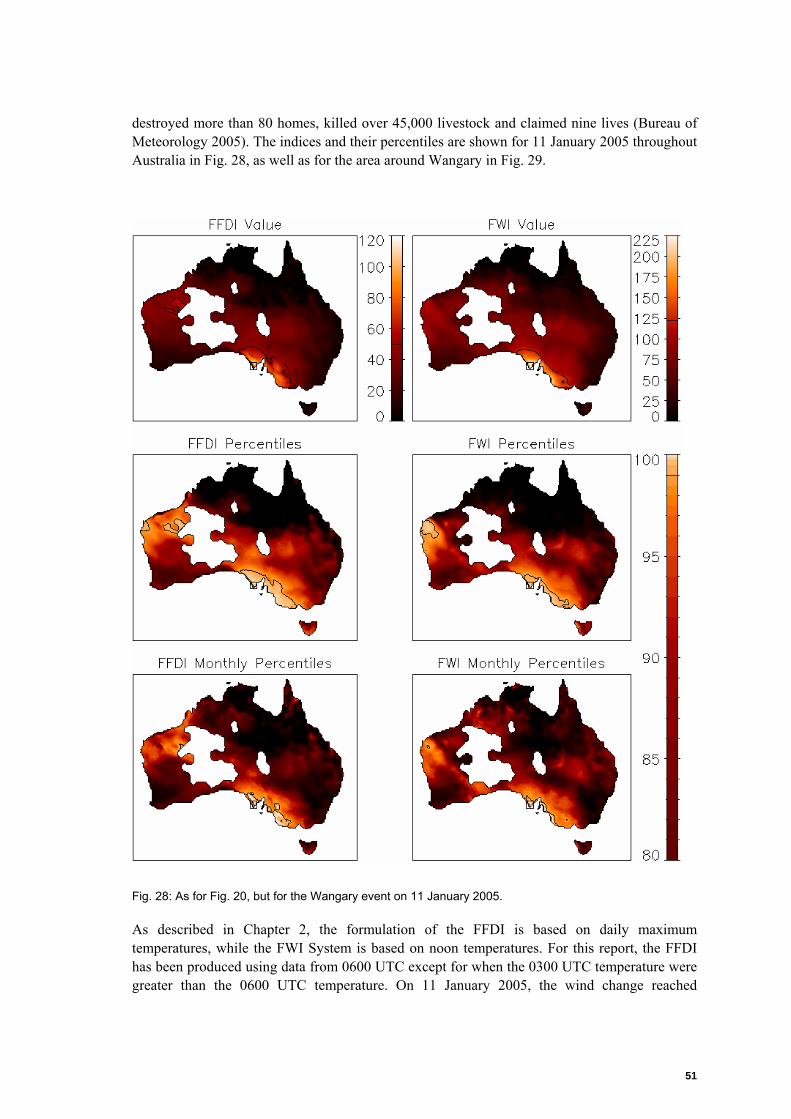
51
destroyed more than 80 homes, killed over 45,000 livestock and claimed nine lives (Bureau of Meteorology 2005). The indices and their percentiles are shown for 11 January 2005 throughout Australia in Fig. 28, as well as for the area around Wangary in Fig. 29.
Fig. 28: As for Fig. 20, but for the Wangary event on 11 January 2005.
As described in Chapter 2, the formulation of the FFDI is based on daily maximum temperatures, while the FWI System is based on noon temperatures. For this report, the FFDI has been produced using data from 0600 UTC except for when the 0300 UTC temperature were greater than the 0600 UTC temperature. On 11 January 2005, the wind change reached
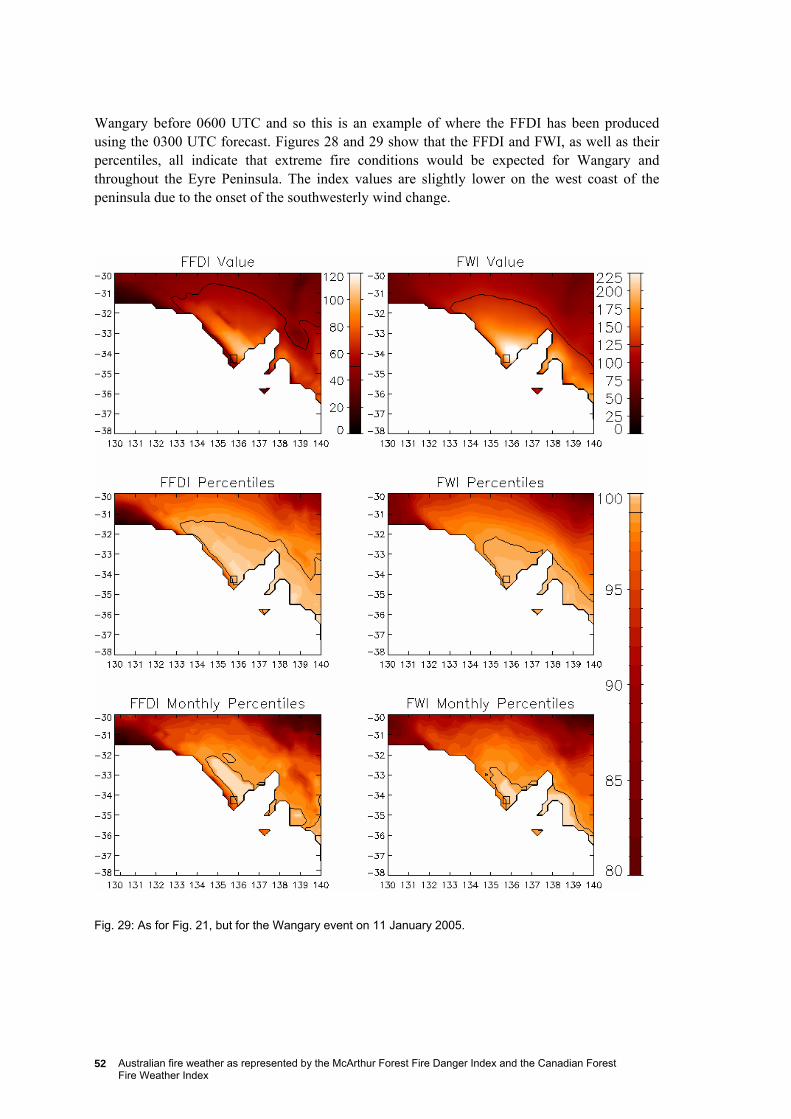
Australian fire weather as represented by the McArthur Forest Fire Danger Index and the Canadian Forest Fire Weather Index
52
Wangary before 0600 UTC and so this is an example of where the FFDI has been produced using the 0300 UTC forecast. Figures 28 and 29 show that the FFDI and FWI, as well as their percentiles, all indicate that extreme fire conditions would be expected for Wangary and throughout the Eyre Peninsula. The index values are slightly lower on the west coast of the peninsula due to the onset of the southwesterly wind change.
Fig. 29: As for Fig. 21, but for the Wangary event on 11 January 2005.
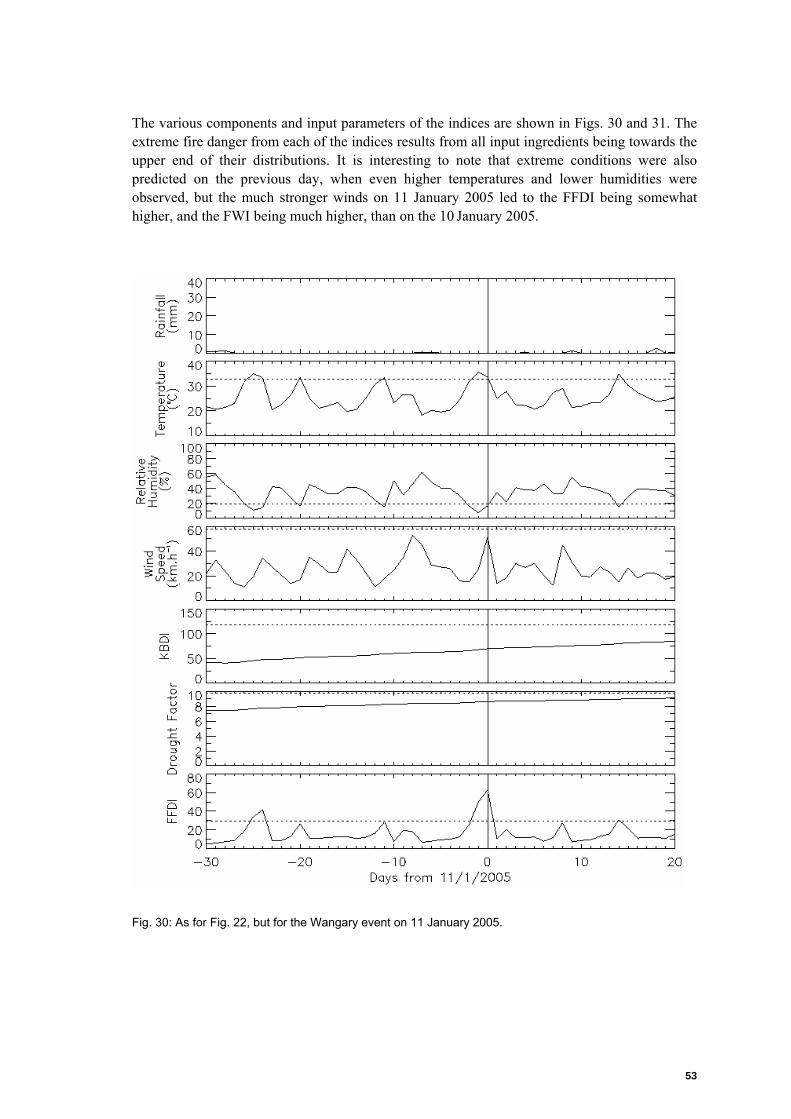
53
The various components and input parameters of the indices are shown in Figs. 30 and 31. The extreme fire danger from each of the indices results from all input ingredients being towards the upper end of their distributions. It is interesting to note that extreme conditions were also predicted on the previous day, when even higher temperatures and lower humidities were observed, but the much stronger winds on 11 January 2005 led to the FFDI being somewhat higher, and the FWI being much higher, than on the 10 January 2005.
Fig. 30: As for Fig. 22, but for the Wangary event on 11 January 2005.
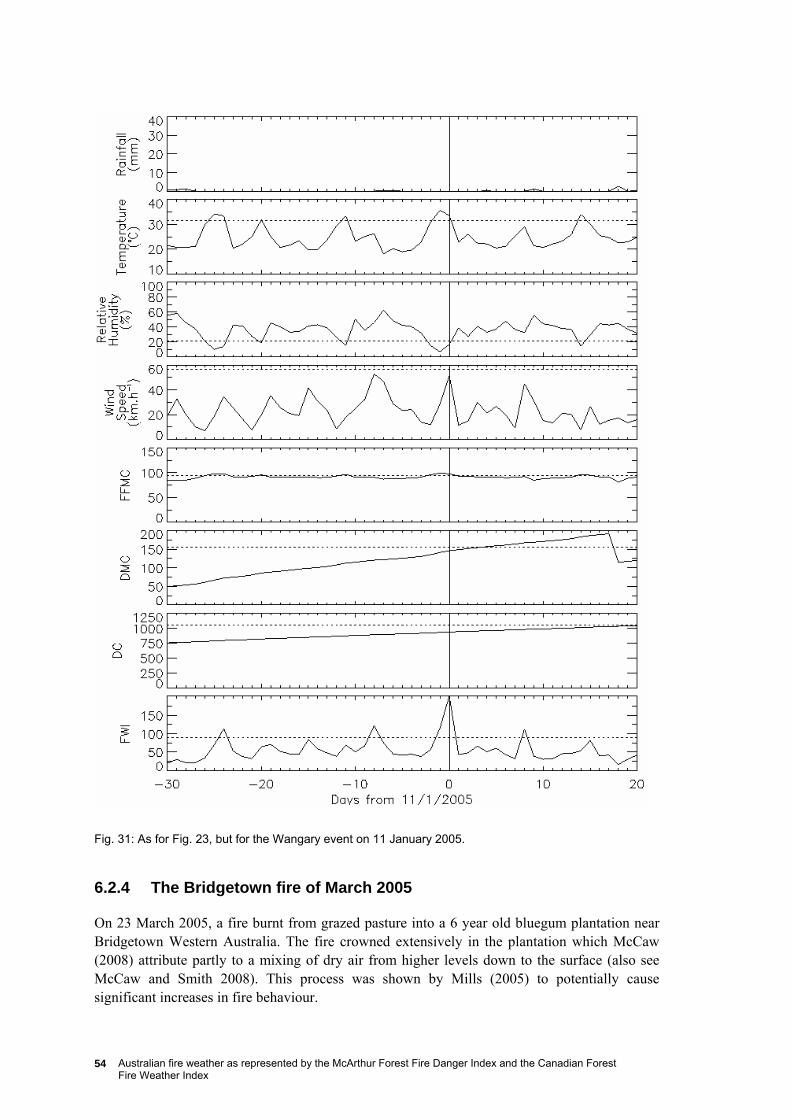
Australian fire weather as represented by the McArthur Forest Fire Danger Index and the Canadian Forest Fire Weather Index
54
Fig. 31: As for Fig. 23, but for the Wangary event on 11 January 2005.
6.2.4 The Bridgetown fire of March 2005
On 23 March 2005, a fire burnt from grazed pasture into a 6 year old bluegum plantation near Bridgetown Western Australia. The fire crowned extensively in the plantation which McCaw (2008) attribute partly to a mixing of dry air from higher levels down to the surface (also see McCaw and Smith 2008). This process was shown by Mills (2005) to potentially cause significant increases in fire behaviour.
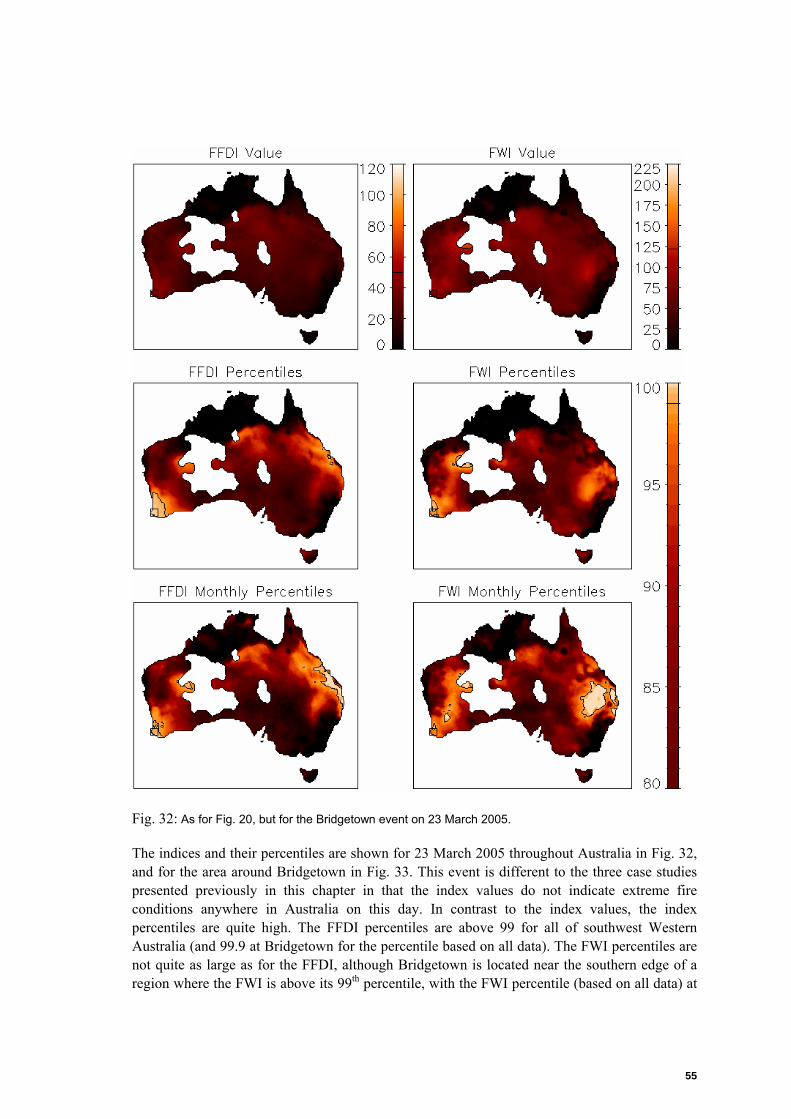
55
Fig. 32: As for Fig. 20, but for the Bridgetown event on 23 March 2005.
The indices and their percentiles are shown for 23 March 2005 throughout Australia in Fig. 32, and for the area around Bridgetown in Fig. 33. This event is different to the three case studies presented previously in this chapter in that the index values do not indicate extreme fire conditions anywhere in Australia on this day. In contrast to the index values, the index percentiles are quite high. The FFDI percentiles are above 99 for all of southwest Western Australia (and 99.9 at Bridgetown for the percentile based on all data). The FWI percentiles are not quite as large as for the FFDI, although Bridgetown is located near the southern edge of a region where the FWI is above its 99th percentile, with the FWI percentile (based on all data) at
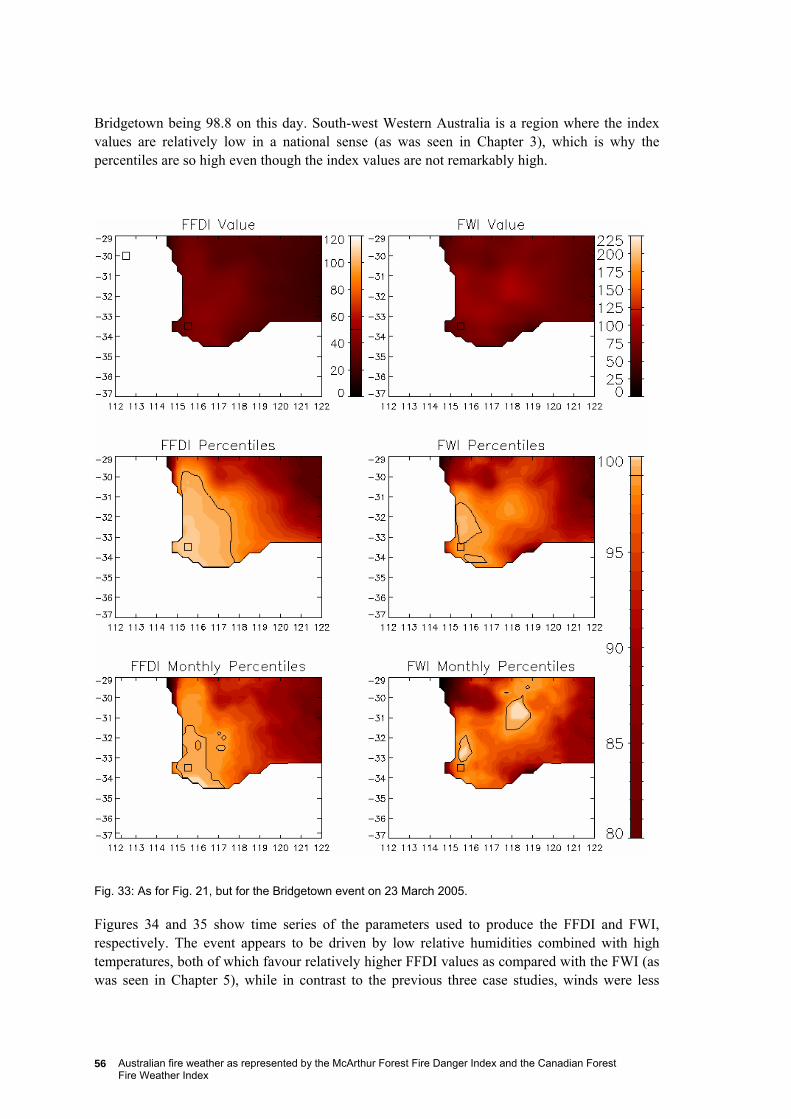
Australian fire weather as represented by the McArthur Forest Fire Danger Index and the Canadian Forest Fire Weather Index
56
Bridgetown being 98.8 on this day. South-west Western Australia is a region where the index values are relatively low in a national sense (as was seen in Chapter 3), which is why the percentiles are so high even though the index values are not remarkably high.
Fig. 33: As for Fig. 21, but for the Bridgetown event on 23 March 2005.
Figures 34 and 35 show time series of the parameters used to produce the FFDI and FWI, respectively. The event appears to be driven by low relative humidities combined with high temperatures, both of which favour relatively higher FFDI values as compared with the FWI (as was seen in Chapter 5), while in contrast to the previous three case studies, winds were less
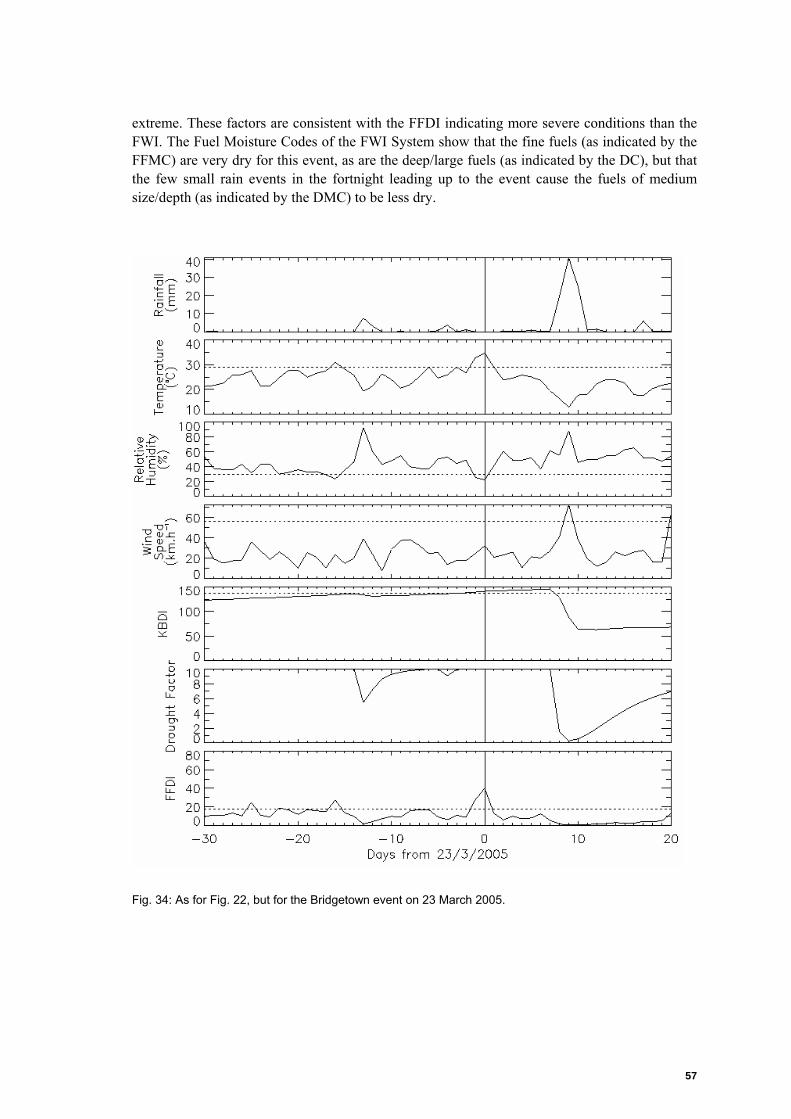
57
extreme. These factors are consistent with the FFDI indicating more severe conditions than the FWI. The Fuel Moisture Codes of the FWI System show that the fine fuels (as indicated by the FFMC) are very dry for this event, as are the deep/large fuels (as indicated by the DC), but that the few small rain events in the fortnight leading up to the event cause the fuels of medium size/depth (as indicated by the DMC) to be less dry.
Fig. 34: As for Fig. 22, but for the Bridgetown event on 23 March 2005.
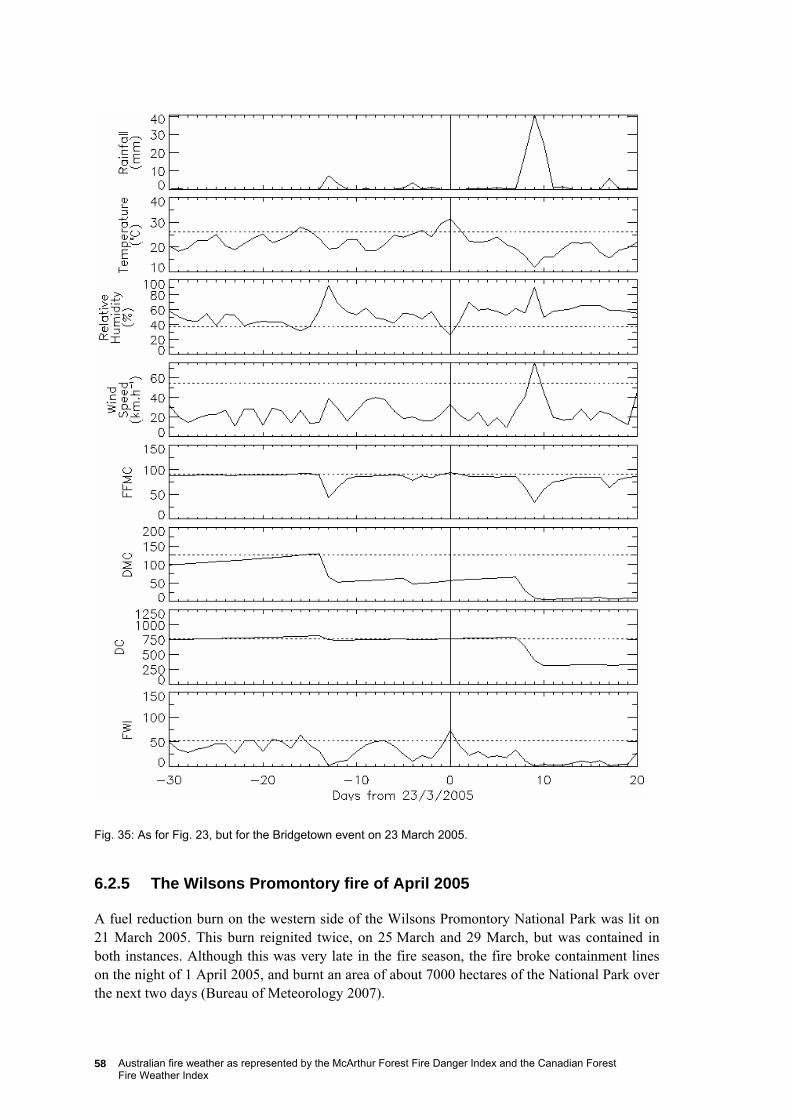
Australian fire weather as represented by the McArthur Forest Fire Danger Index and the Canadian Forest Fire Weather Index
58
Fig. 35: As for Fig. 23, but for the Bridgetown event on 23 March 2005.
6.2.5 The Wilsons Promontory fire of April 2005
A fuel reduction burn on the western side of the Wilsons Promontory National Park was lit on 21 March 2005. This burn reignited twice, on 25 March and 29 March, but was contained in both instances. Although this was very late in the fire season, the fire broke containment lines on the night of 1 April 2005, and burnt an area of about 7000 hectares of the National Park over the next two days (Bureau of Meteorology 2007).
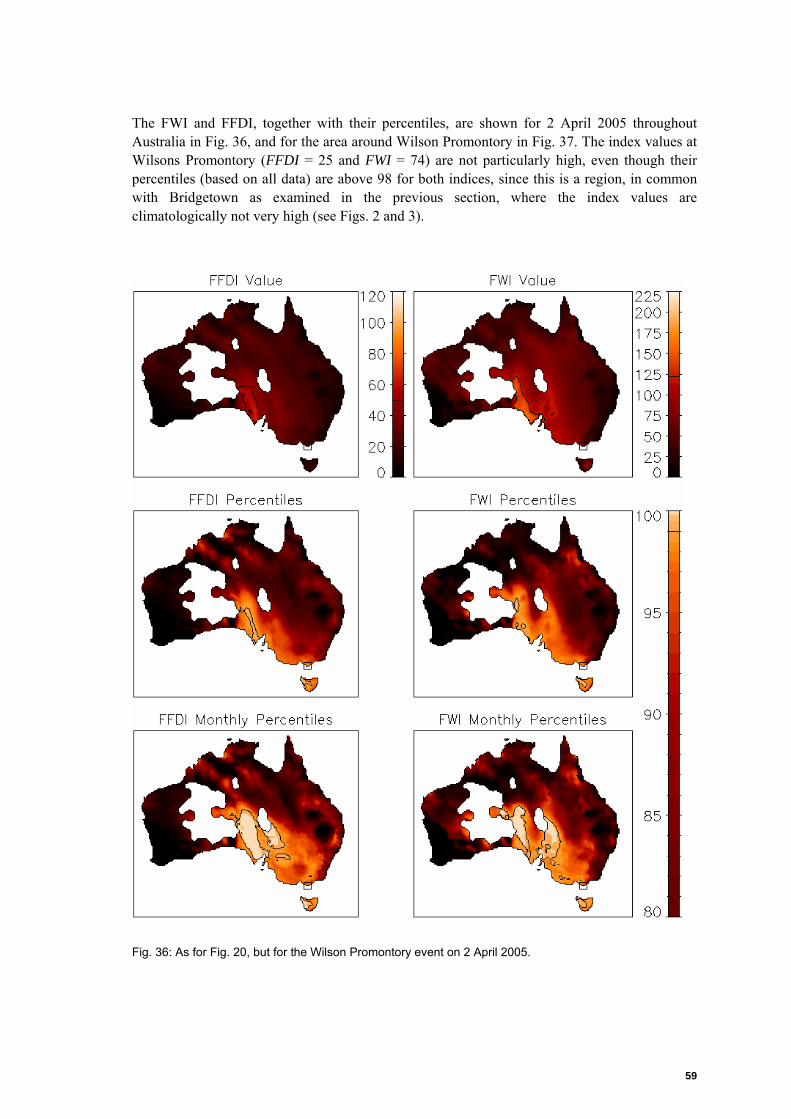
59
The FWI and FFDI, together with their percentiles, are shown for 2 April 2005 throughout Australia in Fig. 36, and for the area around Wilson Promontory in Fig. 37. The index values at Wilsons Promontory (FFDI = 25 and FWI = 74) are not particularly high, even though their percentiles (based on all data) are above 98 for both indices, since this is a region, in common with Bridgetown as examined in the previous section, where the index values are climatologically not very high (see Figs. 2 and 3).
Fig. 36: As for Fig. 20, but for the Wilson Promontory event on 2 April 2005.
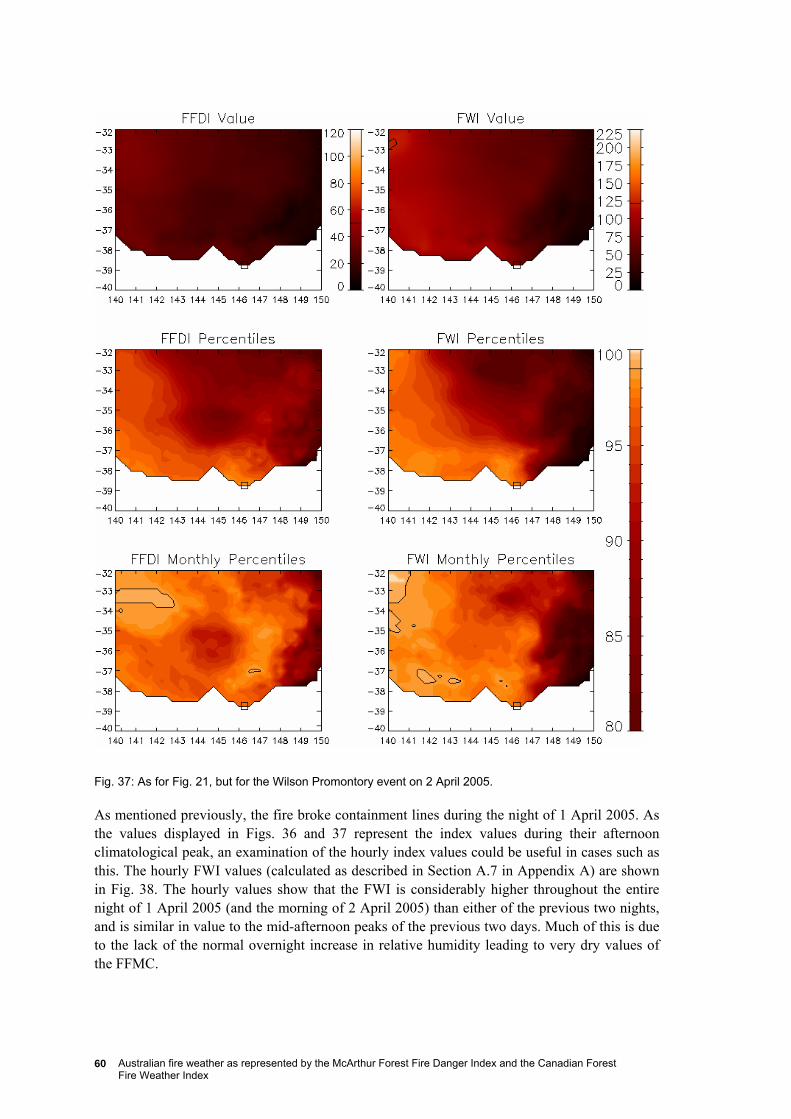
Australian fire weather as represented by the McArthur Forest Fire Danger Index and the Canadian Forest Fire Weather Index
60
Fig. 37: As for Fig. 21, but for the Wilson Promontory event on 2 April 2005.
As mentioned previously, the fire broke containment lines during the night of 1 April 2005. As the values displayed in Figs. 36 and 37 represent the index values during their afternoon climatological peak, an examination of the hourly index values could be useful in cases such as this. The hourly FWI values (calculated as described in Section A.7 in Appendix A) are shown in Fig. 38. The hourly values show that the FWI is considerably higher throughout the entire night of 1 April 2005 (and the morning of 2 April 2005) than either of the previous two nights, and is similar in value to the mid-afternoon peaks of the previous two days. Much of this is due to the lack of the normal overnight increase in relative humidity leading to very dry values of the FFMC.
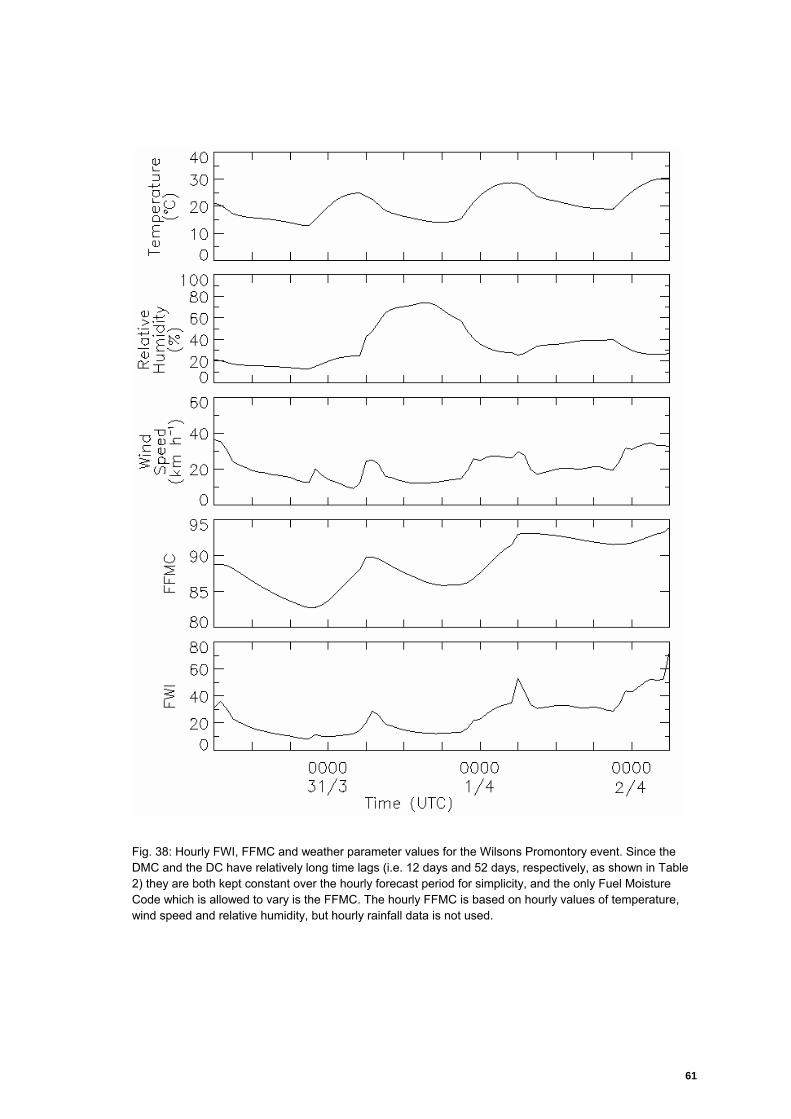
61
Fig. 38: Hourly FWI, FFMC and weather parameter values for the Wilsons Promontory event. Since the DMC and the DC have relatively long time lags (i.e. 12 days and 52 days, respectively, as shown in Table 2) they are both kept constant over the hourly forecast period for simplicity, and the only Fuel Moisture Code which is allowed to vary is the FFMC. The hourly FFMC is based on hourly values of temperature, wind speed and relative humidity, but hourly rainfall data is not used.
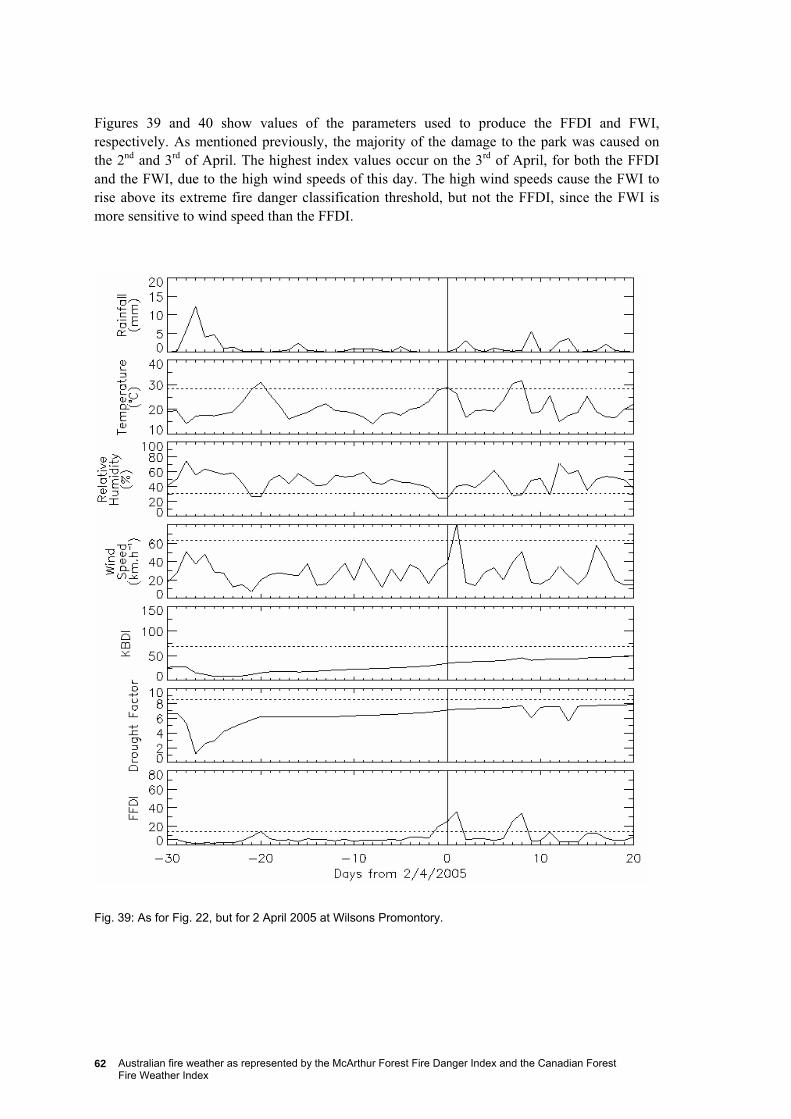
Australian fire weather as represented by the McArthur Forest Fire Danger Index and the Canadian Forest Fire Weather Index
62
Figures 39 and 40 show values of the parameters used to produce the FFDI and FWI, respectively. As mentioned previously, the majority of the damage to the park was caused on the 2nd and 3rd of April. The highest index values occur on the 3rd of April, for both the FFDI and the FWI, due to the high wind speeds of this day. The high wind speeds cause the FWI to rise above its extreme fire danger classification threshold, but not the FFDI, since the FWI is more sensitive to wind speed than the FFDI.
Fig. 39: As for Fig. 22, but for 2 April 2005 at Wilsons Promontory.
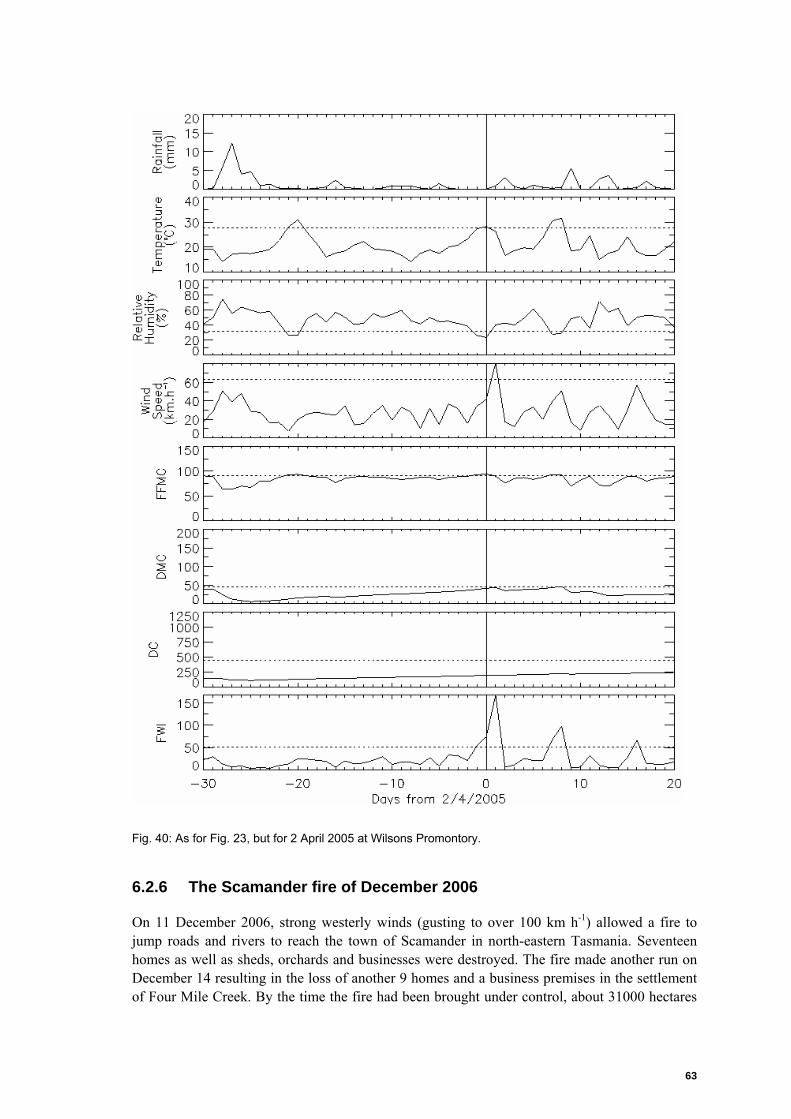
63
Fig. 40: As for Fig. 23, but for 2 April 2005 at Wilsons Promontory.
6.2.6 The Scamander fire of December 2006
On 11 December 2006, strong westerly winds (gusting to over 100 km h-1) allowed a fire to jump roads and rivers to reach the town of Scamander in north-eastern Tasmania. Seventeen homes as well as sheds, orchards and businesses were destroyed. The fire made another run on December 14 resulting in the loss of another 9 homes and a business premises in the settlement of Four Mile Creek. By the time the fire had been brought under control, about 31000 hectares
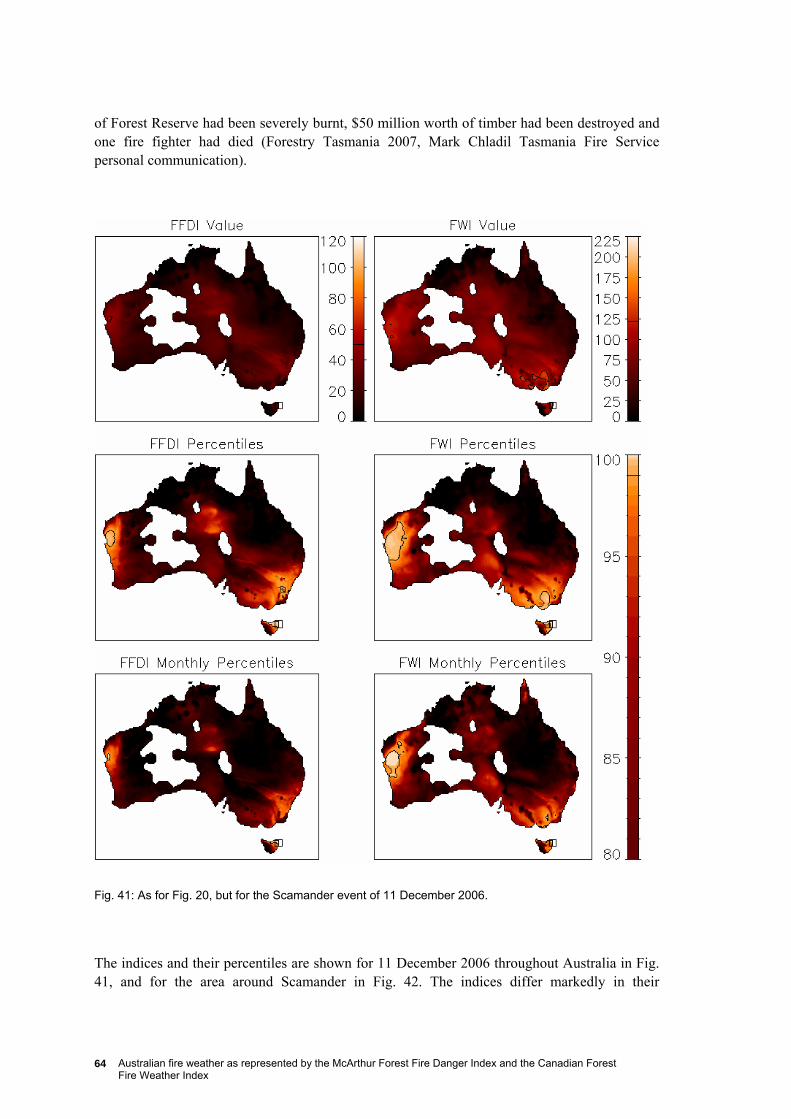
Australian fire weather as represented by the McArthur Forest Fire Danger Index and the Canadian Forest Fire Weather Index
64
of Forest Reserve had been severely burnt, $50 million worth of timber had been destroyed and one fire fighter had died (Forestry Tasmania 2007, Mark Chladil Tasmania Fire Service personal communication).
Fig. 41: As for Fig. 20, but for the Scamander event of 11 December 2006.
The indices and their percentiles are shown for 11 December 2006 throughout Australia in Fig. 41, and for the area around Scamander in Fig. 42. The indices differ markedly in their
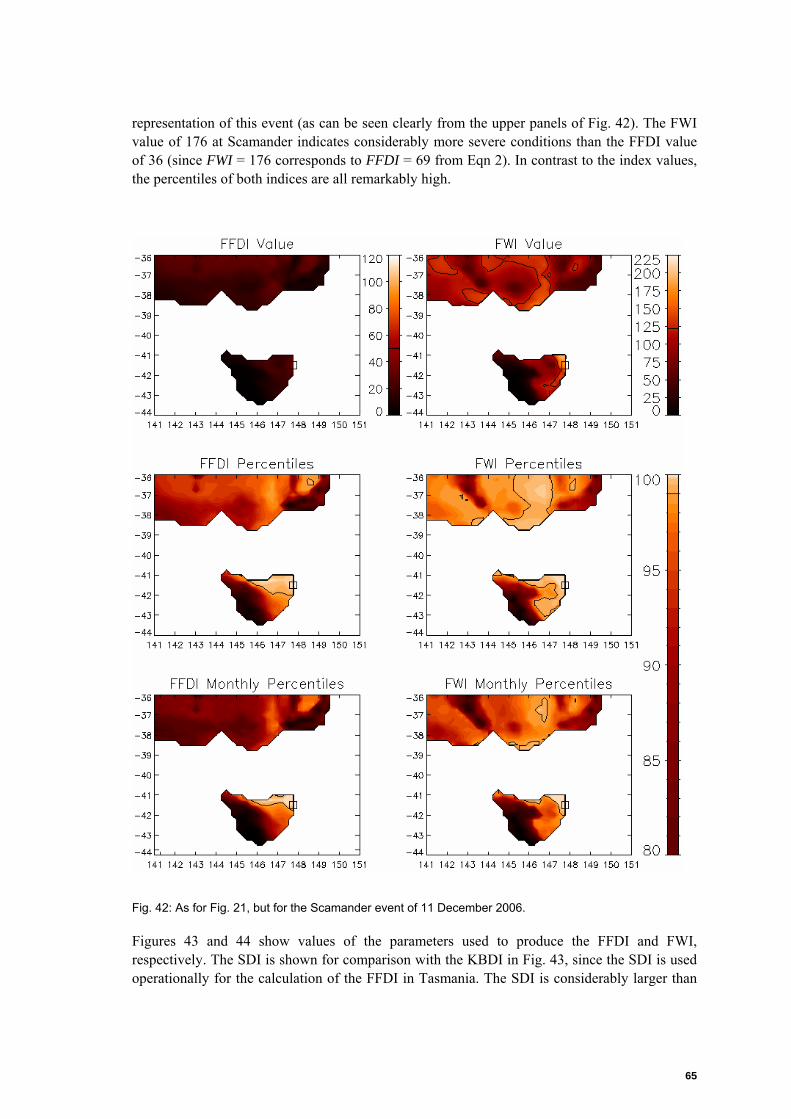
65
representation of this event (as can be seen clearly from the upper panels of Fig. 42). The FWI value of 176 at Scamander indicates considerably more severe conditions than the FFDI value of 36 (since FWI = 176 corresponds to FFDI = 69 from Eqn 2). In contrast to the index values, the percentiles of both indices are all remarkably high.
Fig. 42: As for Fig. 21, but for the Scamander event of 11 December 2006.
Figures 43 and 44 show values of the parameters used to produce the FFDI and FWI, respectively. The SDI is shown for comparison with the KBDI in Fig. 43, since the SDI is used operationally for the calculation of the FFDI in Tasmania. The SDI is considerably larger than
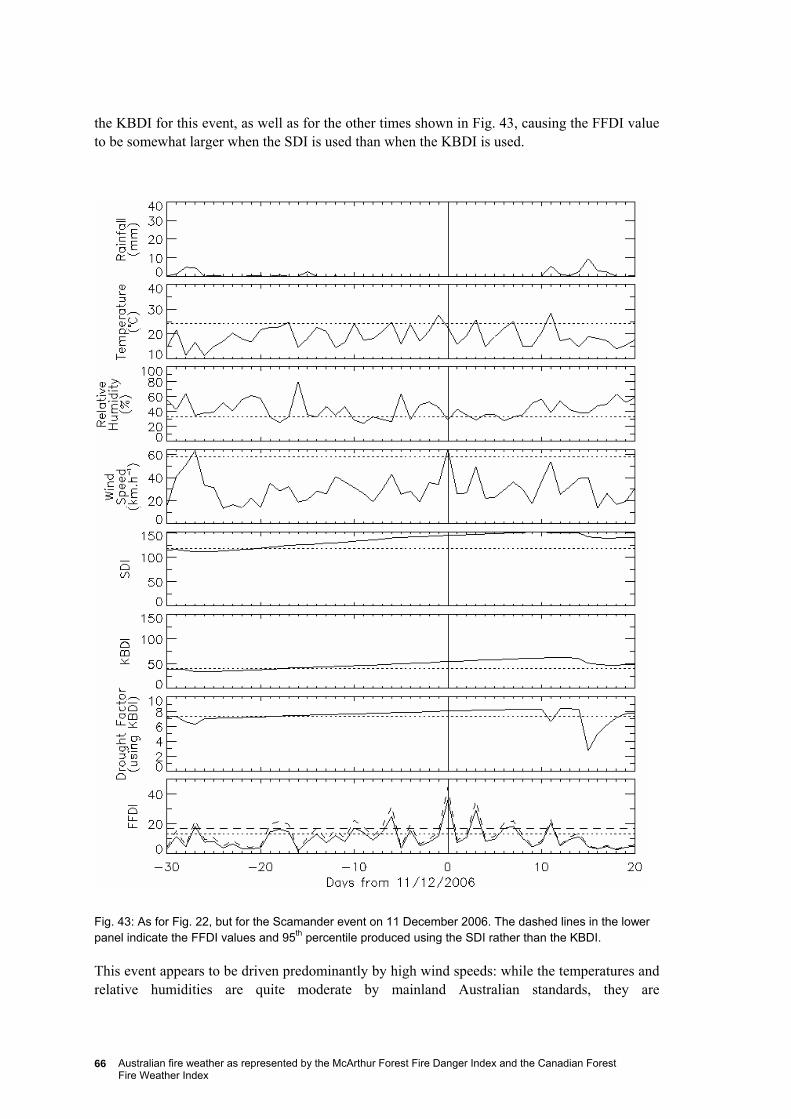
Australian fire weather as represented by the McArthur Forest Fire Danger Index and the Canadian Forest Fire Weather Index
66
the KBDI for this event, as well as for the other times shown in Fig. 43, causing the FFDI value to be somewhat larger when the SDI is used than when the KBDI is used.
Fig. 43: As for Fig. 22, but for the Scamander event on 11 December 2006. The dashed lines in the lower panel indicate the FFDI values and 95th percentile produced using the SDI rather than the KBDI.
This event appears to be driven predominantly by high wind speeds: while the temperatures and relative humidities are quite moderate by mainland Australian standards, they are
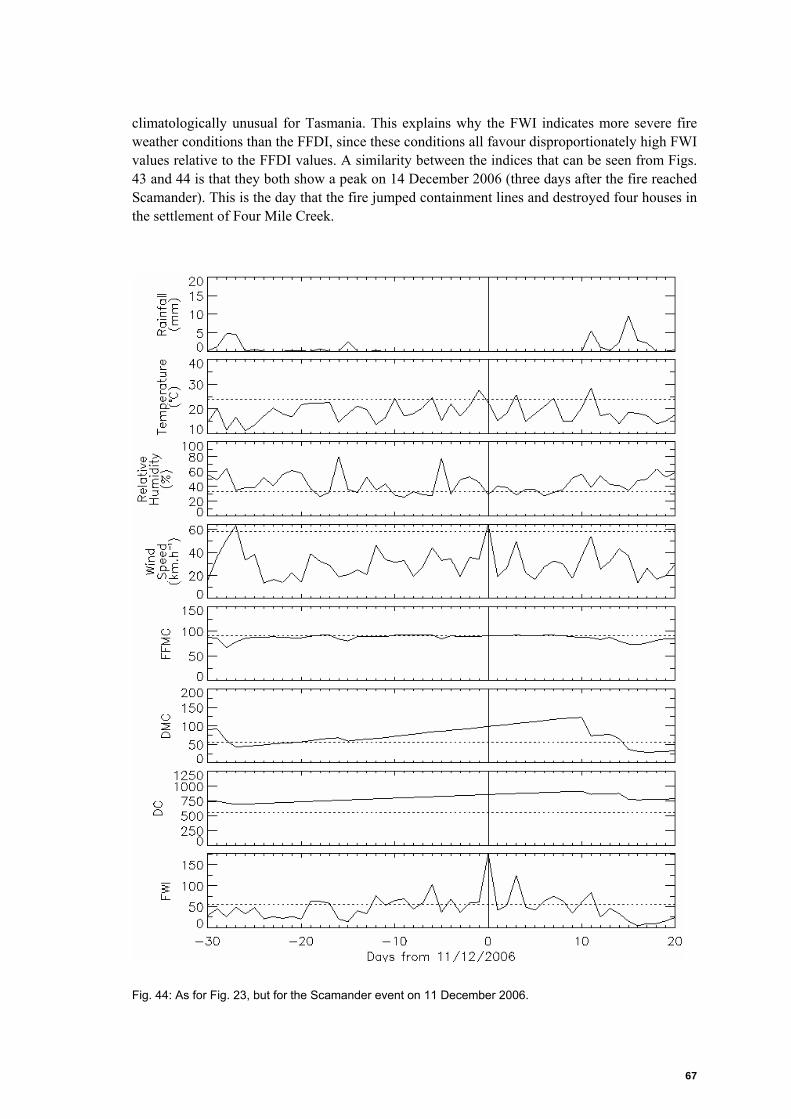
67
climatologically unusual for Tasmania. This explains why the FWI indicates more severe fire weather conditions than the FFDI, since these conditions all favour disproportionately high FWI values relative to the FFDI values. A similarity between the indices that can be seen from Figs. 43 and 44 is that they both show a peak on 14 December 2006 (three days after the fire reached Scamander). This is the day that the fire jumped containment lines and destroyed four houses in the settlement of Four Mile Creek.
Fig. 44: As for Fig. 23, but for the Scamander event on 11 December 2006.
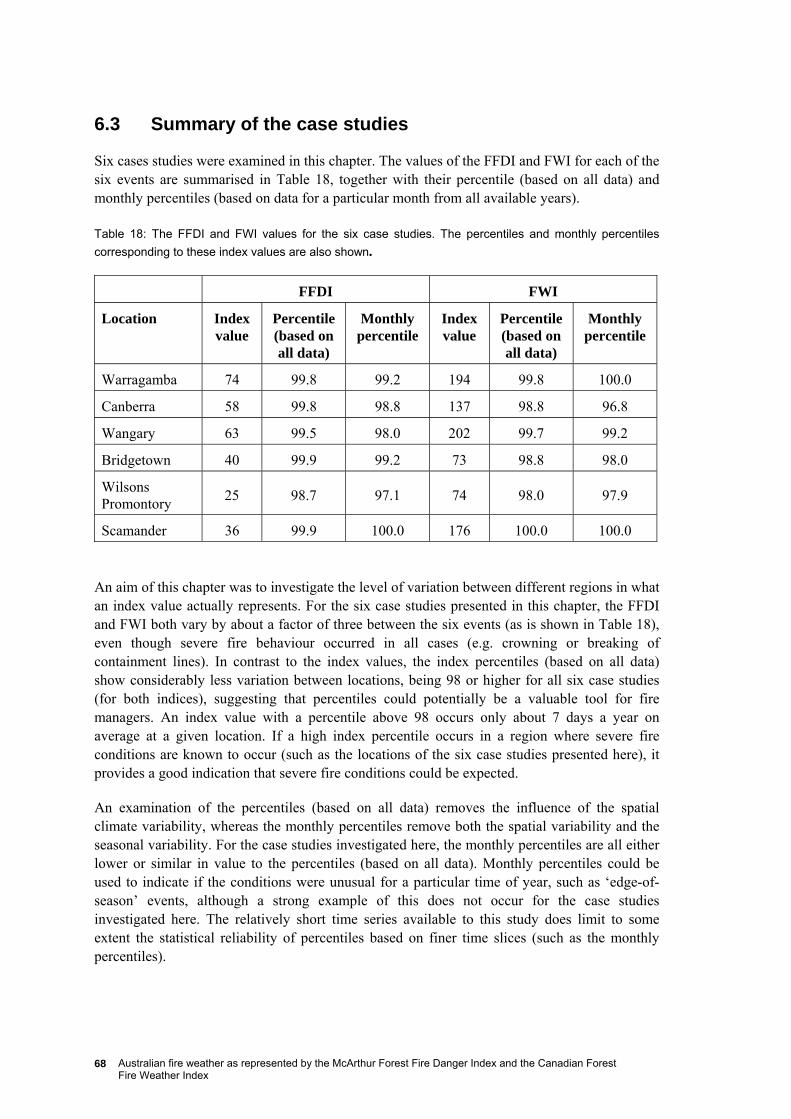
Australian fire weather as represented by the McArthur Forest Fire Danger Index and the Canadian Forest Fire Weather Index
68
6.3 Summary of the case studies
Six cases studies were examined in this chapter. The values of the FFDI and FWI for each of the six events are summarised in Table 18, together with their percentile (based on all data) and monthly percentiles (based on data for a particular month from all available years).
Table 18: The FFDI and FWI values for the six case studies. The percentiles and monthly percentiles corresponding to these index values are also shown.
FFDI FWI
Location Index value
Percentile (based on all data)
Monthly percentile
Index value
Percentile (based on all data)
Monthly percentile
Warragamba 74 99.8 99.2 194 99.8 100.0
Canberra 58 99.8 98.8 137 98.8 96.8
Wangary 63 99.5 98.0 202 99.7 99.2
Bridgetown 40 99.9 99.2 73 98.8 98.0
Wilsons Promontory 25 98.7 97.1 74 98.0 97.9
Scamander 36 99.9 100.0 176 100.0 100.0
An aim of this chapter was to investigate the level of variation between different regions in what an index value actually represents. For the six case studies presented in this chapter, the FFDI and FWI both vary by about a factor of three between the six events (as is shown in Table 18), even though severe fire behaviour occurred in all cases (e.g. crowning or breaking of containment lines). In contrast to the index values, the index percentiles (based on all data) show considerably less variation between locations, being 98 or higher for all six case studies (for both indices), suggesting that percentiles could potentially be a valuable tool for fire managers. An index value with a percentile above 98 occurs only about 7 days a year on average at a given location. If a high index percentile occurs in a region where severe fire conditions are known to occur (such as the locations of the six case studies presented here), it provides a good indication that severe fire conditions could be expected.
An examination of the percentiles (based on all data) removes the influence of the spatial climate variability, whereas the monthly percentiles remove both the spatial variability and the seasonal variability. For the case studies investigated here, the monthly percentiles are all either lower or similar in value to the percentiles (based on all data). Monthly percentiles could be used to indicate if the conditions were unusual for a particular time of year, such as ‘edge-of-season’ events, although a strong example of this does not occur for the case studies investigated here. The relatively short time series available to this study does limit to some extent the statistical reliability of percentiles based on finer time slices (such as the monthly percentiles).
69
The case studies presented in this chapter show that significant differences can occur between the indices due to their sensitivity differences. For example, the high wind speeds (accompanied by relatively moderate temperatures and relative humidities) of the Scamander case study cause the FWI to indicate more severe conditions than the FFDI for this event. The sensitivity differences between the indices suggest that the FWI and FFDI are complementary to each other in that they respond to different combinations of conditions. An examination of both indices might therefore be of some value to fire managers. The case studies also show that an examination of the subcomponents of the indices (such as the three different Fuel Moisture Codes of the FWI System) can provide valuable insight for individual events.
7. SUMMARY AND DISCUSSION
This report investigated the influence of weather on fire conditions in Australia, as represented by the McArthur Forest Fire Danger Index (FFDI) and the Fire Weather Index (FWI) component of the Canadian Forest Fire Weather Index System. The FWI System was adapted for use in Australia, as well as globally (as detailed in Appendix A). The key findings of each chapter of this report are summarised here.
Chapter 3: Variability of fire weather in Australia.
• The FFDI and FWI are similar in that their highest values tend to occur throughout the central and southern-central regions of mainland Australia, and their lowest values tend to occur throughout Tasmania, southwest Western Australia, eastern Victoria and around the Great Dividing Range.
• The seasonal cycles of the indices are similar to each other in that they both show that the fire season generally occurs later at more southerly latitudes (and earlier at more northerly latitudes) in Australia. The patterns seen are broadly similar to those shown in Luke and McArthur (1986). The predominant difference between the FWI and the FFDI is that the seasonal cycle appears to occur about 1 month earlier for the FWI than the FFDI.
Chapter 4: The relationship between the FFDI and FWI.
• The relationship between the indices is somewhat nonlinear and varies throughout Australia with a standard deviation of about 15% of the FWI value.
• The main variation in this relationship tends to occur in regions where index values are typically low, where the FFDI generally indicates less severe conditions than the FWI.
• Fire danger classification thresholds for the FWI were estimated for Australia, based on the classification thresholds of the FFDI, using the national median relationship between the indices.
Chapter 5: Sensitivity to input parameters.
• The indices are similar to each other in that they are both most sensitive to wind speed, then secondly to relative humidity and then thirdly to temperature.
Australian fire weather as represented by the McArthur Forest Fire Danger Index and the Canadian Forest Fire Weather Index
70
• On a finer scale the indices show some differences to each other, with the FFDI being more sensitive to temperature and relative humidity, and less sensitive to wind speed and rainfall, than the FWI.
• The derivatives of the FFDI are all directly proportional to the value of the FFDI, causing the sensitivities of the FFDI to be quite variable (more variable that the sensitivities of the FWI), which results in the FFDI generally indicating less severe conditions than the FWI in regions where index values are relatively low.
• Equilibrium values of the indices show that the FFDI has a temperature threshold set by recent rainfall above which its sensitivity increases. This threshold is likely to explain some of the non-linearity observed in the relationship between the indices).
Chapter 6: Case studies
• Index values associated with severe fire behaviour (e.g. crowning or breaking containment lines) vary by a factor of about three between the six case studies.
• In contrast to the index values, the index percentiles provide a more consistent representation of the severe conditions, being 98 or higher in all 6 case studies.
• Significant differences occur between the FFDI and FWI values in their representation of some of the events due to the sensitivity differences between the indices. The sensitivity differences between the FWI and the FFDI tend to make them complementary to each other in that they respond differently to different sets of conditions.
The FFDI and FWI systems provide an indication of fire danger based predominantly on meteorological ingredients (rather than other risk factors such as values at stake and response capabilities) and can be used as a basis for issuing district-wide warnings and fire bans through the use of fixed thresholds to indicate fire danger classes. While they can also be used as indicators of fire behaviour, there are many factors other than meteorology which influence fire behaviour (such as topography, fuel load, fuel structure, cloud cover, atmospheric stability etc.).
Since the indices do not provide a direct physical relationship with any specific aspect of fire danger or fire behaviour, it is to be expected that the significance of an index value will show some degree of variation between different locations. This study has shown that there is a wide variety of FFDI and FWI climates across Australia, and even across relatively small regions of states. Significant fire activity regularly occurs in regions such as Tasmania, eastern Victoria and south-western WA. While Tasmania has reduced the numerical value of the FFDI threshold at which fire bans are issued due to the less extreme fire danger index climate of that state, such an approach is more problematic in states with a larger variation in their fire danger index climatology. It has been shown in this study that the assessment of a fire danger index in terms of its local climatology (using percentile values) reduces this regional variation and highlights areas where conditions are extreme relative to the local climatology.
Luke and McArthur (1986) write in relation to the FFDI and GFDI that “because of their simplicity the incorporation of modifications designed to improve their precision presents no problem when additional data come to hand and periodic revisions are carried out every two or three years”. In practice, any improvements (e.g. in the Drought Factor code, or the
71
incorporation of fuel data) would require substantial validation against known fire activity, and possible recalibration of the index thresholds. Such changes are beyond the scope of this report, although they are very desirable from a scientific perspective.
This report showed that the differing sensitivities of the FFDI and FWI do, in some circumstances, provide complementary information for a particular event. It was also shown that the hourly FWI values and the subcomponents of the FWI System (such as the three separate fuel moisture codes) can add valuable insight into fire conditions. To enable user assessment of the products presented in this report, it is intended to trial real-time presentation of the gridded FWI and its percentiles throughout Australia using a web-based delivery system.
ACKNOWLEDGEMENTS
We would like to thank John Bally and Tony Bannister (CAWCR), Kevin Parkyn (VIC Regional Office), Paul Fox-Hughes (TAS Regional Office), Mark Chladil (Tasmania Fire Service) and Alen Slijepcevic (DSE) for their assistance and contributions.
REFERENCES
Beck, J. A. and Armitage, O. B. 2004: Diurnal fine fuel moisture and FFMC characteristics at northern latitudes. Proceedings of the 22nd Tall Timbers Fire Ecology Conference: Fire in temperate, boreal, and montane ecosystems (RT Engstrom, KEM Galley, and WJ de Groot, eds.), Tall Timbers Research Station, Tallahassee, FL, pp211-221.
Bureau of Meteorology 2005: Meteorological Report on the Wangary and Black Tuesday fires Lower Eyre Peninsula, 10-11 January 2005. Bureau of Meteorology, South Australian Region, October 2005 (available from Bureau of Meteorology, PO Box 421, Kent Town, 5071, South Australia).
Bureau of Meteorology 2007: Report on the April 2005 Wilsons Promontory Fire. Bureau of Meteorology, Victorian Region, June 2007.
Burrows, N. D. 1987: The Soil Dryness Index for use in fire control in the south-west of Western Australia. Department of Conservation and Land Management, WA, Technical Report No. 17.
Cruz, M. G. and Plucinski, M. P. 2007: Billo road fire: report on fire behaviour and suppression activity. Bushfire Cooperative Research Centre, Melbourne, Victoria, Australia. Report no. A.07.02.
de Groot, W. J., Wardati, B. and Wang, Y. 2005: Calibrating the Fine Fuel Moisture Code for grass ignition potential in Sumatra, Indonesia. Int. J. Wildland Fire, 14, 161-168pp.
de Groot, W. J., Field, R. D., Brady, M. A., Roswintiarti, O., Mohamad, M., 2006: Development of the Indonesian and Malaysian Fire Danger Rating Systems. Mitig. Adapt. Strat. Glob. Change, doi: 10.1007/s11027-006-9043-8.
Australian fire weather as represented by the McArthur Forest Fire Danger Index and the Canadian Forest Fire Weather Index
72
Deeming, J. E., Burgan, R. E. and Cohen, J. E., 1978: The National Fire-Danger Rating System, Dept. of Agriculture, Forest Service, Intermountain Forest and Range Experiment Station Ogden, Utah, Doc. No. A 13.88:INT-39.
Dudfield. M., 2004: Art and Science of Forest and Rural Fire Management. Proceedings, AFAC/Bushfire CRC Annual Conference, Perth, October 2004, 183-185pp.
Emergency Management Australia, 2008: Disasters database. Attorney General’s Department – Commonwealth of Australia, http://www.ema.gov.au.
Finkele, K., Mills, G. A., Beard, G. and Jones, D. A., 2006: National Daily Gridded Soil Moisture Deficit and Drought Factors for Use in Prediction of Forest Fire Danger Index in Australia. Bureau of Meteorology Research Centre, Research Report No 119.
Forestry Canada Fire Danger Group, 1992: Development and Structure of the Canadian Forest Fire Behaviour Prediction System. Forestry Canada, Ottawa, ON, Information Report ST-X-3.
Forestry Tasmania, 2007: 2006/2007 Annual Report. Forestry Tasmania.
Griffiths, D. 1998: Improved Formulae for the McArthur Forest Fire Danger Meter. Bureau of Meteorology, Meteorological Note 214.
Keetch, J. J. and Byram, G. M., 1968: A drought index for forest fire control. USDA Forest Service, Research Paper SE-38.
Luke, R. H. and McArthur, A. G., 1986: Bushfires in Australia. Australian Government Publishing Service, Canberra.
McArthur, A. G., 1967: Fire Behaviour in Eucalypt Forests. Department of National Development Forestry and Timber Bureau, Canberra, Leaflet 107.
McCaw, L., 2008: Fire in the bluegums. Fire Australia, Winter 2008.
McCaw, L. and Smith, B., 2008: Fire behaviour in a 6 year old Eucalyptus globulus plantation during conditions of extreme fire danger – a case study from south-western Australia. Bushfire Cooperative Research Centre, Melbourne, Australia, http://www.bushfirecrc.com/publications/downloads/Bluegum-plantation-fire-23-March-2005.pdf.
McLeod, R., 2003: Inquiry into the operational response to the January 2003 bushfires in the ACT. ACT Government, Chief Minister’s Department, Canberra, Report No. 03/0537.
Mills, G. A., 2005: On the subsynoptic-scale meteorology of two extreme fire weather days during the Eastern Australian fires of January 2003. Australian Meteorological Magazine, 54, 265-290pp.
Mount, A. B. 1972: The Derivation and Testing of a Soil Dryness Index using Run-off Data. Tasmanian Forestry Commission Bulletin, No 4.
73
Noble, I. R, Bary, G. A. V. and Gill, A. M., 1980: McArthur’s fire-danger meters expressed as equations. Australian Journal of Ecology, 5, 201-203pp.
Puri, K., Dietachmayer, G. D., Mills, G. A., Davidson, N. E., Bowen, R. A. and Logan, L. W., 1998: The new BMRC Limited Area Prediction System (LAPS). Australian Meteorological Magazine, 47, 203-223pp.
Sullivan, A., 2001: Review of the Operational Calculation of McArthur’s Drought Factor. CSIRO Forestry and Forest Products Client Report, No. 921.
Taylor, S. W. and Alexander, M. E., 2006: Science, technology, and human factors in fire danger rating: the Canadian experience. International Journal of Wildland Fire, 15, 121–135pp.
Turner, J. A., 1972: The Drought Code component of the Canadian Forest Fire Behavior System. Canadian Forestry Service, Publication 1316.
Van Wagner, C. E., 1974: Structure of the Canadian Forest Fire Weather Index. Canadian Forestry Service, Ottawa, ON, Publication No. 1333.
Van Wagner, C. E. 1977: A method of computing fine fuel moisture content throughout the diurnal cycle. Canadian Forestry Service, Petawawa For. Exp. Sta., Chalk River, Ont. Inf. Rep. PS-X-69.
Van Wagner, C. E. and Pickett, T. L., 1985: Equations and FORTRAN program for the Canadian Forest Fire Weather Index System. Canadian Forestry Service, Ottawa, Ont., 1985.
Van Wagner, C. E., 1987: Development and Structure of the Canadian Forest Fire Weather Index System. Canadian Forestry Service, Ottawa, ON, Technical Report 35.
Viegas, D. X., Bovio, G., Ferreira, A., Nosenzo, A. and Sol, B., 1999: Comparative study of various methods of fire danger evaluation in southern Europe. International Journal of Wildland Fire, 9(4), 235–246pp.
Weymouth, G., Mills, G. A., Jones, D., Ebert, E. E. and Manton, M. J., 1999: A Continental-Scale Daily Rainfall Analysis System. Australian Meteorological Magazine, 48, 169-179pp.
Australian fire weather as represented by the McArthur Forest Fire Danger Index and the Canadian Forest Fire Weather Index
74
APPENDIX A: DOCUMENTATION OF THE AUSTRALIAN IMPLEMENTATION OF THE CANADIAN FWI SYSTEM
A.1 Fine Fuel Moisture Code
The FFMC represents the moisture content of the fine fuel. It is calculated by modifying its previous value by an amount which represents any useful rainfall or atmospheric wetting/drying that has occurred. The FFMC was originally developed as a two digit code (from 00 up to 99) but was recently modified to range from a maximum moisture content of 0 to a minimum moisture content of 101.
The moisture content, m, of the fine fuel ranges from 0 (dry) to 250 (wet) and is used to calculate the FFMC:
m m FFMC
+−
=2.147
2505.59 (A1)
The moisture content, m, is calculated by first estimating the previous day’s value of m, mo, from the previous day’s value of FFMC (using Eqn A1), and then applying corrections for the influence of rainfall, atmospheric wetting, and atmospheric drying.
A.1.1 The influence of rainfall
The initial moisture content, m0, is calculated as
0
00 5.59
1012.147
FFMCFFMC
m+−
= (A2)
where FFMC0 is the previous day’s FFMC (or the previous hour’s FFMC for hourly calculations as detailed in Section A.2.7).
The first 0.5 mm of rainfall, R, is assumed to be intercepted by the canopy overhead. If the rainfall is less than 0.5 mm then the effective rainfall, Reff, will be zero, otherwise it is equal to the rainfall less 0.5 mm:
5.0−= RReff (A3)
The initial moisture content is modified by the effective rainfall to yield the rain modified moisture content, mr. When m0 ≤ 150, the rain modified moisture content is given by
)e(eR m m eff/R.-)m-/(-effr
9362511000 15.42 0 −+= (A4)
For large initial moisture contents (m0 > 150), the rain modified moisture content, mr, is
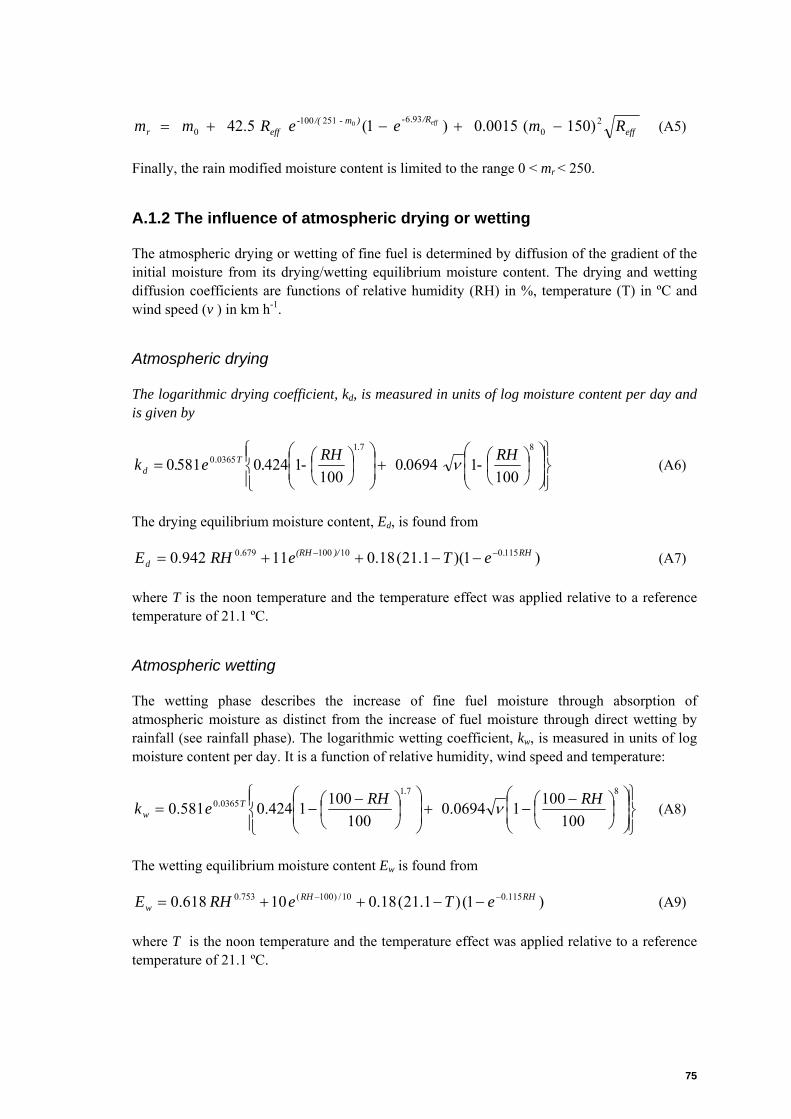
75
eff/R.-)m-/(-
effr Rm eeR mm eff 20
9362511000 )150(0015.0)1(5.42 0 −+−+= (A5)
Finally, the rain modified moisture content is limited to the range 0 < mr < 250.
A.1.2 The influence of atmospheric drying or wetting
The atmospheric drying or wetting of fine fuel is determined by diffusion of the gradient of the initial moisture from its drying/wetting equilibrium moisture content. The drying and wetting diffusion coefficients are functions of relative humidity (RH) in %, temperature (T) in ºC and wind speed (v ) in km h-1.
Atmospheric drying
The logarithmic drying coefficient, kd, is measured in units of log moisture content per day and is given by
⎪⎭
⎪⎬⎫
⎪⎩
⎪⎨⎧
⎟⎟⎠
⎞⎜⎜⎝
⎛⎟⎠⎞
⎜⎝⎛+⎟
⎟⎠
⎞⎜⎜⎝
⎛⎟⎠⎞
⎜⎝⎛=
87103650
100106940
100142405810 RH- . RH- .e.k
.T.
d ν (A6)
The drying equilibrium moisture content, Ed, is found from
)1)(1.21(18.011942.0 1150101006790 RH.)/(RH.d eTe RHE −− −−++= (A7)
where T is the noon temperature and the temperature effect was applied relative to a reference temperature of 21.1 ºC.
Atmospheric wetting
The wetting phase describes the increase of fine fuel moisture through absorption of atmospheric moisture as distinct from the increase of fuel moisture through direct wetting by rainfall (see rainfall phase). The logarithmic wetting coefficient, kw, is measured in units of log moisture content per day. It is a function of relative humidity, wind speed and temperature:
⎪⎭
⎪⎬⎫
⎪⎩
⎪⎨⎧
⎟⎟⎠
⎞⎜⎜⎝
⎛⎟⎠⎞
⎜⎝⎛ −
−+⎟⎟⎠
⎞⎜⎜⎝
⎛⎟⎠⎞
⎜⎝⎛ −
−=871
03650
10010010694.0
1001001424.0581.0 RH RHek
.T.
w ν (A8)
The wetting equilibrium moisture content Ew is found from
)1()1.21(18.010 0.618 115.010/)100(0.753 RHRHw eTeRHE −− −−++= (A9)
where T is the noon temperature and the temperature effect was applied relative to a reference temperature of 21.1 ºC.
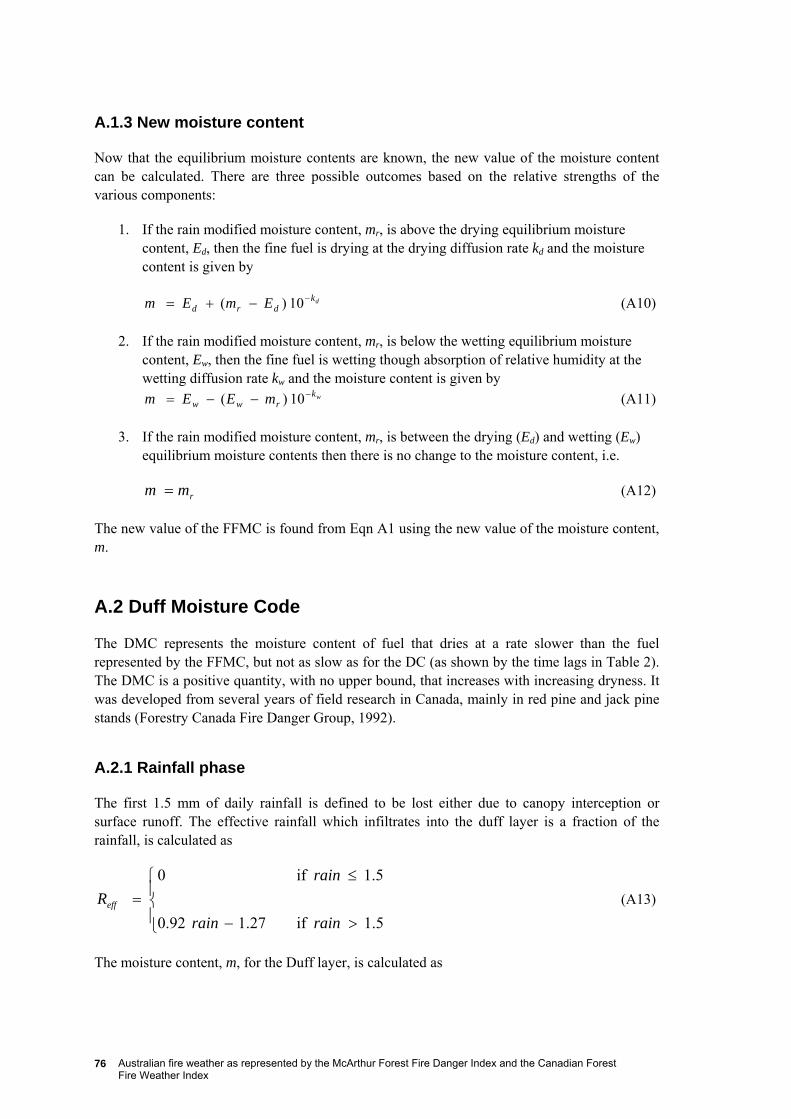
Australian fire weather as represented by the McArthur Forest Fire Danger Index and the Canadian Forest Fire Weather Index
76
A.1.3 New moisture content
Now that the equilibrium moisture contents are known, the new value of the moisture content can be calculated. There are three possible outcomes based on the relative strengths of the various components:
1. If the rain modified moisture content, mr, is above the drying equilibrium moisture content, Ed, then the fine fuel is drying at the drying diffusion rate kd and the moisture content is given by
dkdrd EmEm −−+= 10)( (A10)
2. If the rain modified moisture content, mr, is below the wetting equilibrium moisture content, Ew, then the fine fuel is wetting though absorption of relative humidity at the wetting diffusion rate kw and the moisture content is given by
wkrww mEEm −−−= 10)( (A11)
3. If the rain modified moisture content, mr, is between the drying (Ed) and wetting (Ew) equilibrium moisture contents then there is no change to the moisture content, i.e.
rmm = (A12)
The new value of the FFMC is found from Eqn A1 using the new value of the moisture content, m.
A.2 Duff Moisture Code
The DMC represents the moisture content of fuel that dries at a rate slower than the fuel represented by the FFMC, but not as slow as for the DC (as shown by the time lags in Table 2). The DMC is a positive quantity, with no upper bound, that increases with increasing dryness. It was developed from several years of field research in Canada, mainly in red pine and jack pine stands (Forestry Canada Fire Danger Group, 1992).
A.2.1 Rainfall phase
The first 1.5 mm of daily rainfall is defined to be lost either due to canopy interception or surface runoff. The effective rainfall which infiltrates into the duff layer is a fraction of the rainfall, is calculated as
⎪⎩
⎪⎨
⎧
>−
≤=
5.1if27.192.0
5.1if0
rainrain
rain Reff (A13)
The moisture content, m, for the Duff layer, is calculated as
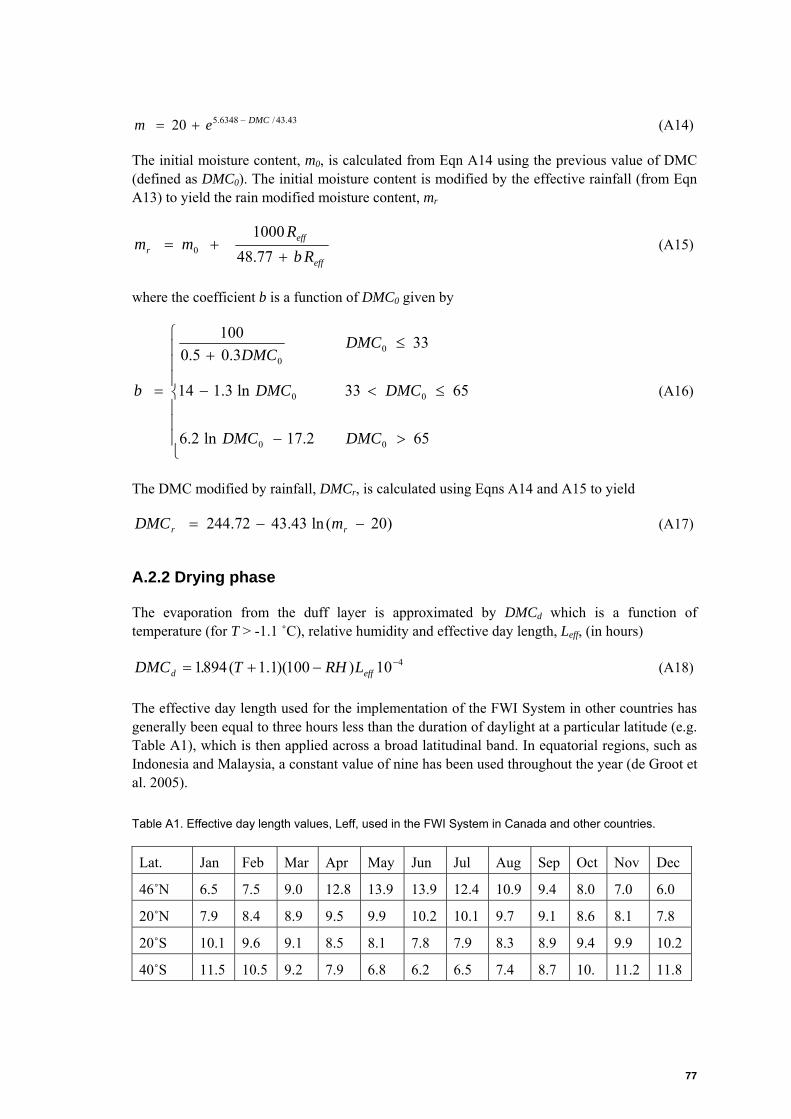
77
em DMC 43.43/6348.520 −+= (A14)
The initial moisture content, m0, is calculated from Eqn A14 using the previous value of DMC (defined as DMC0). The initial moisture content is modified by the effective rainfall (from Eqn A13) to yield the rain modified moisture content, mr
eff
effr Rb
R m m
++=
77.481000
0 (A15)
where the coefficient b is a function of DMC0 given by
⎪⎪⎪
⎩
⎪⎪⎪
⎨
⎧
>−
≤<−
≤+
=
652.17ln2.6
6533ln3.114
333.05.0
100
00
00
00
DMCDMC
DMCDMC
DMCDMC
b (A16)
The DMC modified by rainfall, DMCr, is calculated using Eqns A14 and A15 to yield
)20(ln43.4372.244 −−= rr m DMC (A17)
A.2.2 Drying phase
The evaporation from the duff layer is approximated by DMCd which is a function of temperature (for T > -1.1 ˚C), relative humidity and effective day length, Leff, (in hours)
410)100)(1.1(8941 −−+= effd LRHT.DMC (A18)
The effective day length used for the implementation of the FWI System in other countries has generally been equal to three hours less than the duration of daylight at a particular latitude (e.g. Table A1), which is then applied across a broad latitudinal band. In equatorial regions, such as Indonesia and Malaysia, a constant value of nine has been used throughout the year (de Groot et al. 2005).
Table A1. Effective day length values, Leff, used in the FWI System in Canada and other countries.
Lat. Jan Feb Mar Apr May Jun Jul Aug Sep Oct Nov Dec
46˚N 6.5 7.5 9.0 12.8 13.9 13.9 12.4 10.9 9.4 8.0 7.0 6.0
20˚N 7.9 8.4 8.9 9.5 9.9 10.2 10.1 9.7 9.1 8.6 8.1 7.8
20˚S 10.1 9.6 9.1 8.5 8.1 7.8 7.9 8.3 8.9 9.4 9.9 10.2
40˚S 11.5 10.5 9.2 7.9 6.8 6.2 6.5 7.4 8.7 10. 11.2 11.8
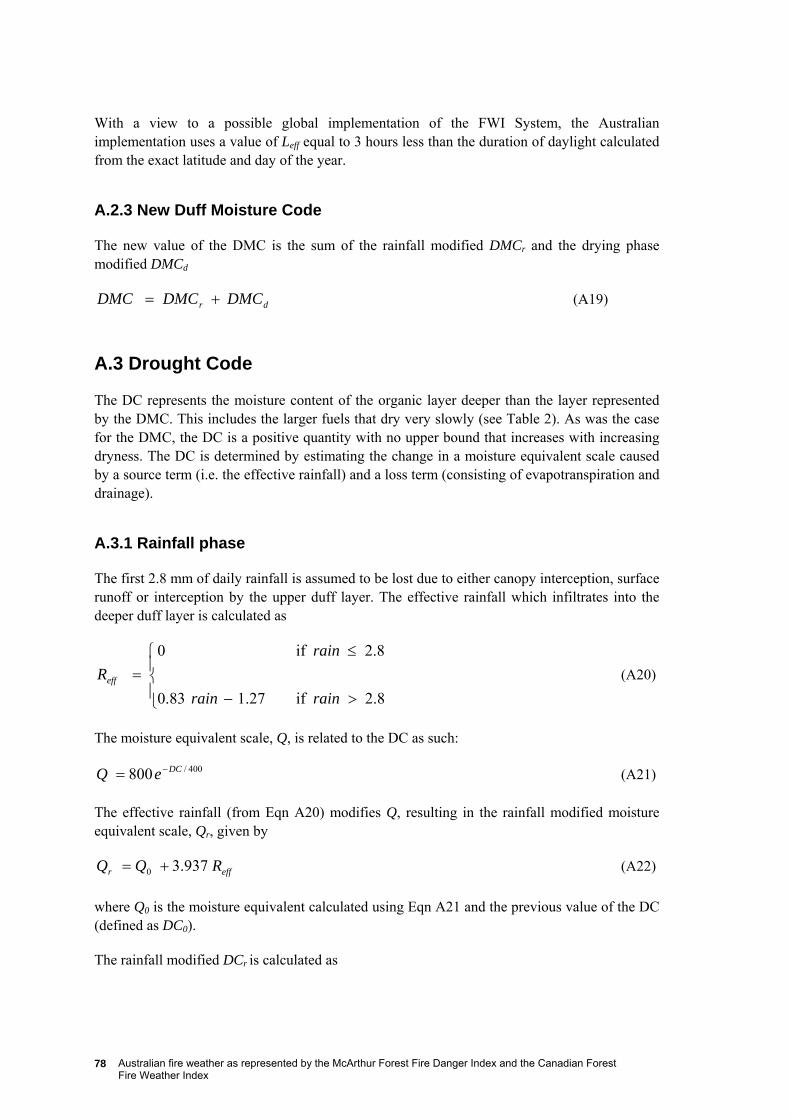
Australian fire weather as represented by the McArthur Forest Fire Danger Index and the Canadian Forest Fire Weather Index
78
With a view to a possible global implementation of the FWI System, the Australian implementation uses a value of Leff equal to 3 hours less than the duration of daylight calculated from the exact latitude and day of the year.
A.2.3 New Duff Moisture Code
The new value of the DMC is the sum of the rainfall modified DMCr and the drying phase modified DMCd
dr DMCDMCDMC += (A19)
A.3 Drought Code
The DC represents the moisture content of the organic layer deeper than the layer represented by the DMC. This includes the larger fuels that dry very slowly (see Table 2). As was the case for the DMC, the DC is a positive quantity with no upper bound that increases with increasing dryness. The DC is determined by estimating the change in a moisture equivalent scale caused by a source term (i.e. the effective rainfall) and a loss term (consisting of evapotranspiration and drainage).
A.3.1 Rainfall phase
The first 2.8 mm of daily rainfall is assumed to be lost due to either canopy interception, surface runoff or interception by the upper duff layer. The effective rainfall which infiltrates into the deeper duff layer is calculated as
⎪⎩
⎪⎨
⎧
>−
≤=
8.2if27.183.0
8.2if0
rainrain
rain Reff (A20)
The moisture equivalent scale, Q, is related to the DC as such:
eQ DC 400/800 −= (A21)
The effective rainfall (from Eqn A20) modifies Q, resulting in the rainfall modified moisture equivalent scale, Qr, given by
R Q Q effr 937.30 += (A22)
where Q0 is the moisture equivalent calculated using Eqn A21 and the previous value of the DC (defined as DC0).
The rainfall modified DCr is calculated as
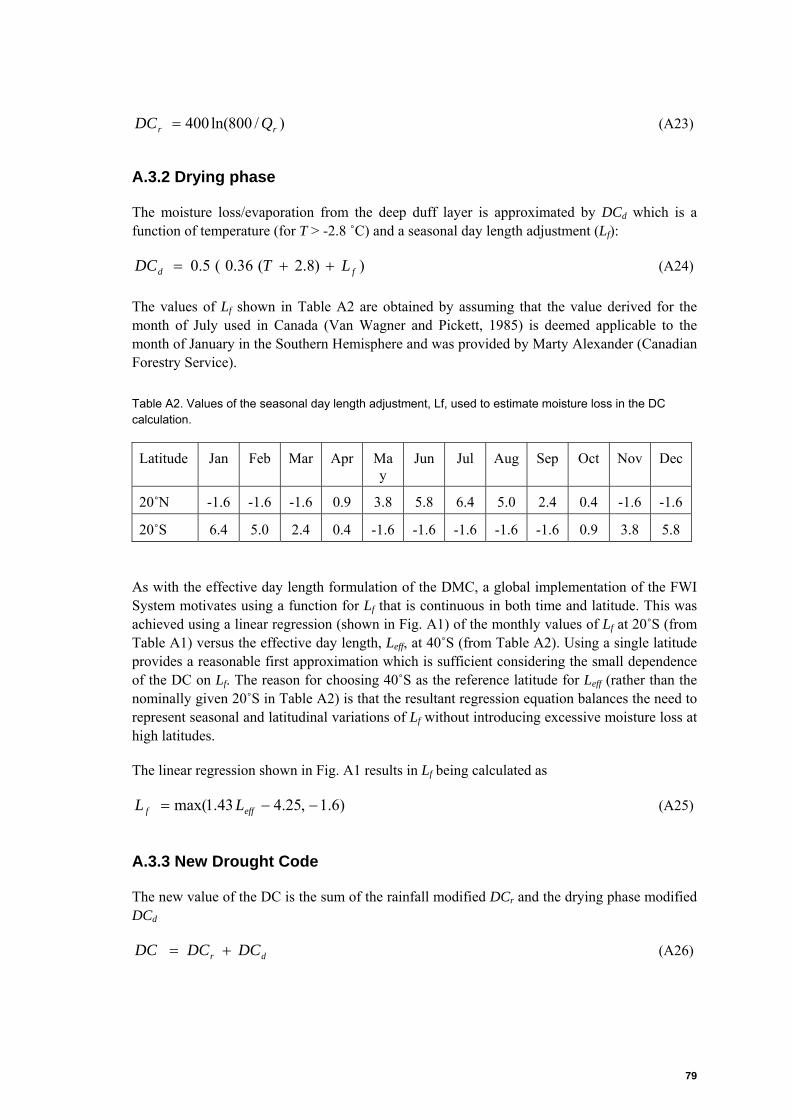
79
)/800ln(400 rr Q DC = (A23)
A.3.2 Drying phase
The moisture loss/evaporation from the deep duff layer is approximated by DCd which is a function of temperature (for T > -2.8 ˚C) and a seasonal day length adjustment (Lf):
))8.2(36.0(5.0 fd LTDC ++= (A24)
The values of Lf shown in Table A2 are obtained by assuming that the value derived for the month of July used in Canada (Van Wagner and Pickett, 1985) is deemed applicable to the month of January in the Southern Hemisphere and was provided by Marty Alexander (Canadian Forestry Service).
Table A2. Values of the seasonal day length adjustment, Lf, used to estimate moisture loss in the DC calculation.
Latitude Jan Feb Mar Apr May
Jun Jul Aug Sep Oct Nov Dec
20˚N -1.6 -1.6 -1.6 0.9 3.8 5.8 6.4 5.0 2.4 0.4 -1.6 -1.6
20˚S 6.4 5.0 2.4 0.4 -1.6 -1.6 -1.6 -1.6 -1.6 0.9 3.8 5.8
As with the effective day length formulation of the DMC, a global implementation of the FWI System motivates using a function for Lf that is continuous in both time and latitude. This was achieved using a linear regression (shown in Fig. A1) of the monthly values of Lf at 20˚S (from Table A1) versus the effective day length, Leff, at 40˚S (from Table A2). Using a single latitude provides a reasonable first approximation which is sufficient considering the small dependence of the DC on Lf. The reason for choosing 40˚S as the reference latitude for Leff (rather than the nominally given 20˚S in Table A2) is that the resultant regression equation balances the need to represent seasonal and latitudinal variations of Lf without introducing excessive moisture loss at high latitudes.
The linear regression shown in Fig. A1 results in Lf being calculated as
)6.1,25.443.1max( −−= efff L L (A25)
A.3.3 New Drought Code
The new value of the DC is the sum of the rainfall modified DCr and the drying phase modified DCd
dr DCDCDC += (A26)
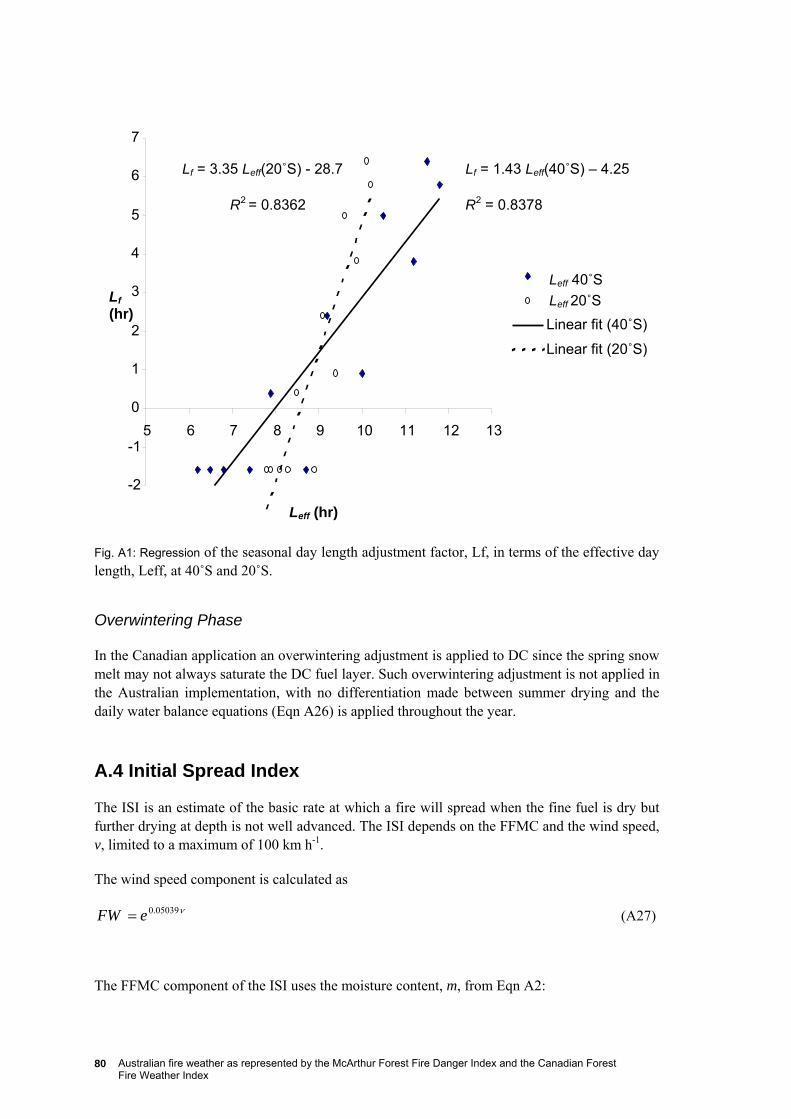
Australian fire weather as represented by the McArthur Forest Fire Danger Index and the Canadian Forest Fire Weather Index
80
Fig. A1: Regression of the seasonal day length adjustment factor, Lf, in terms of the effective day length, Leff, at 40˚S and 20˚S.
Overwintering Phase
In the Canadian application an overwintering adjustment is applied to DC since the spring snow melt may not always saturate the DC fuel layer. Such overwintering adjustment is not applied in the Australian implementation, with no differentiation made between summer drying and the daily water balance equations (Eqn A26) is applied throughout the year.
A.4 Initial Spread Index
The ISI is an estimate of the basic rate at which a fire will spread when the fine fuel is dry but further drying at depth is not well advanced. The ISI depends on the FFMC and the wind speed, v, limited to a maximum of 100 km h-1.
The wind speed component is calculated as
ν05039.0eFW = (A27)
The FFMC component of the ISI uses the moisture content, m, from Eqn A2:
Lf = 1.43 Leff(40˚S) – 4.25
R2 = 0.8378
Lf = 3.35 Leff(20˚S) - 28.7
R2 = 0.8362
-2
-1
0
1
2
3
4
5
6
7
5 6 7 8 9 10 11 12 13
Leff (hr)
Lf (hr)
Leff 40˚S Leff 20˚S Linear fit (40˚S)
Linear fit (20˚S)
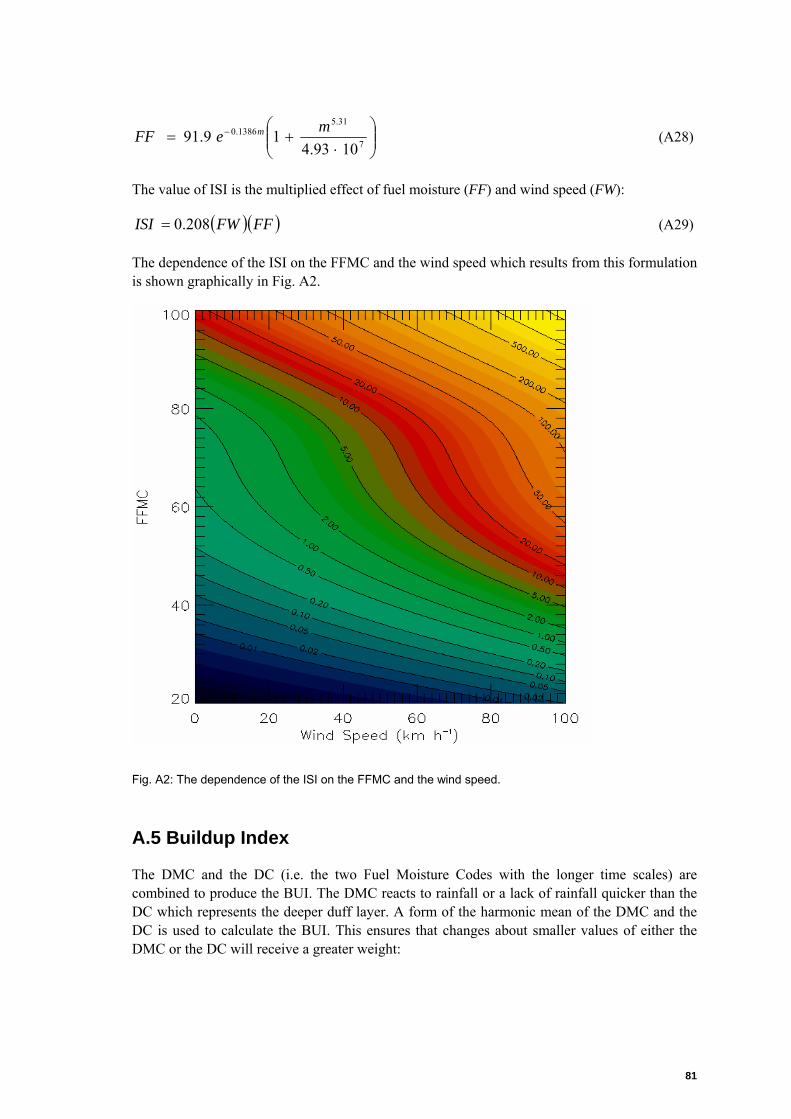
81
⎟⎟⎠
⎞⎜⎜⎝
⎛⋅
+= −7
31.51386.0
1093.419.91 meFF m (A28)
The value of ISI is the multiplied effect of fuel moisture (FF) and wind speed (FW):
( )( )FFFWISI 208.0= (A29)
The dependence of the ISI on the FFMC and the wind speed which results from this formulation is shown graphically in Fig. A2.
Fig. A2: The dependence of the ISI on the FFMC and the wind speed.
A.5 Buildup Index
The DMC and the DC (i.e. the two Fuel Moisture Codes with the longer time scales) are combined to produce the BUI. The DMC reacts to rainfall or a lack of rainfall quicker than the DC which represents the deeper duff layer. A form of the harmonic mean of the DMC and the DC is used to calculate the BUI. This ensures that changes about smaller values of either the DMC or the DC will receive a greater weight:
Australian fire weather as represented by the McArthur Forest Fire Danger Index and the Canadian Forest Fire Weather Index
82
[ ]
⎪⎪⎩
⎪⎪⎨
⎧
>+⎟⎠⎞
⎜⎝⎛
+−−
≤+=
DCDMCDMCDCDMC
DCDMC
DCDMCDCDMC
DCDMC
BUI4.0)0114.0(92.0
4.08.01
4.04.0
8.0
7.1 (A30)
Equation A30 is the same as given in Van Wagner (1987) for DMC ≤ 0.4DC. The second part (i.e. for DMC > 0.4DC) differs somewhat from the literature, but is currently being implemented in the Canadian operational FWI System calculations (Van Wagner and Pickett 1985).
The dependence of the BUI on the DMC and the DC which results from this formulation is shown graphically in Fig. A3.
Fig. A3: The BUI shown for various values of the DMC and the DC.
A.6 Fire Weather Index
The FWI is a positive number, with low values indicating low fire danger weather conditions and higher values indicating higher fire danger weather conditions. The FWI is a function of the BUI and the ISI, and is calculated as
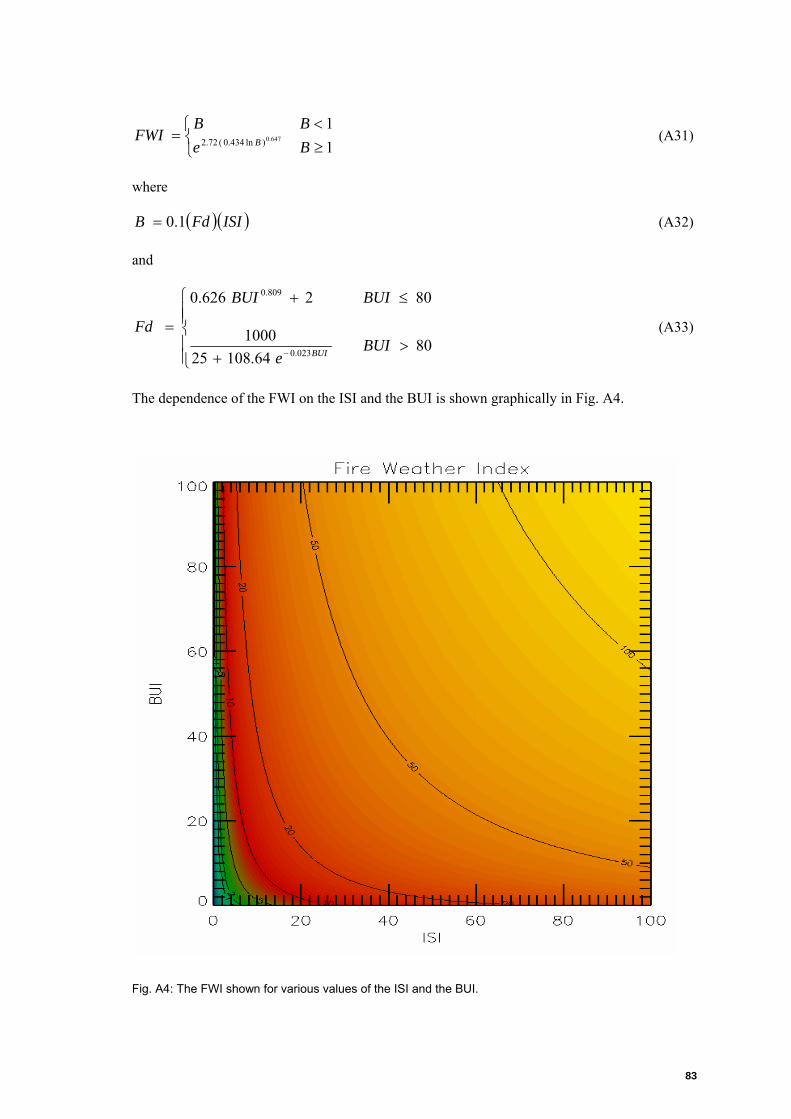
83
⎩⎨⎧
≥<
=11
647.0)ln434.0(72.2 BeBB
FWI B (A31)
where
( )( )ISIFdB 1.0= (A32)
and
⎪⎪⎩
⎪⎪⎨
⎧
>+
≤+
=− 80
64.108251000
802626.0
023.0
809.0
BUIe
BUIBUI
Fd BUI
(A33)
The dependence of the FWI on the ISI and the BUI is shown graphically in Fig. A4.
Fig. A4: The FWI shown for various values of the ISI and the BUI.
Australian fire weather as represented by the McArthur Forest Fire Danger Index and the Canadian Forest Fire Weather Index
84
A.7 Hourly Fire Weather Index
An hourly version of the FWI System was developed for use in Australia. The hourly FWI System uses the daily version as its 0600 UTC forecast (representative of the peak daily fire behaviour) and then uses the hourly MESOLAPS forecast data from single levels forecasts to produce the subsequent hourly forecasts (from 0700 UTC onwards) of FWI System components. Details of the hourly version can be found in Van Wagner (1977) and Beck and Armitage (2004).
The main difference between the daily and hourly formulations is in the FFMC, since this represents the shortest time scale variations of the fuel moisture. The hourly FFMC is calculated using hourly forecasts of temperature, wind speed and relative humidity. Hourly rainfall forecasts are not considered in the current Australian implementation of the FWI System, but may be considered in future work depending on data quality. The calculated moisture content for a particular hour is used as the initial value for the next hour’s calculations, with the initial daily value of the FFMC used for the first hour’s initial moisture content (i.e. for the 0600 UTC value).
Hourly MESOLAPS data are available for single levels only. For the daily FWI System, wind speeds are calculated using data from multiple levels (as described in Section 2.2) and so the single level wind speeds used for the hourly FWI System have been scaled up by a factor of 1.2 (based on typical values of this difference).
Hourly forecasts of the FWI System are produced up to 48 hours starting from the midafternoon (0300 UTC) values. The hourly FWI System uses the latest available MESOLAPS data, with the hourly forecast from the 0000 UTC analyses being replaced by the newer 1200 UTC analysis when available. The 1200 UTC analysis updates the forecasted input data and also extends the hourly FWI System forecasts for another 12 hours.
The calculations for the hourly FFMC are largely based on the daily FFMC (see Section A.2.1) but with some modifications to the coefficients as described below (as per Van Wagner, 1977). The temperature effect on the diffusion coefficients kd and kw in Eqns A6 and A8, respectively, has been modified from 0.581 for daily calculations to 0.0579 for hourly calculations. In Eqns A10 and A11 the 10-k terms have been replaced with e-2.303k. An example of the diurnal variations of the hourly FFMC is shown in Fig. 38 for the Wilsons Promontory case study.
Since the DMC and the DC have very long time lags (12 days and 52 days, respectively as shown in Table 2) they are both kept constant over the hourly forecast period for simplicity. The BUI only depends on the DMC and the DC and so it is also constant in value over the hourly forecast period.
The hourly ISI uses the hourly FFMC predictions together with hourly forecasts of wind speed. The hourly FWI is then calculated using the hourly ISI but the daily unaltered BUI. It should be noted that the hourly FFMC is not used to influence the daily FFMC.