Embed Size (px)
Citation preview

The Centre for Australian Weather and Climate Research A partnership between CSIRO and the Bureau of Meteorology
Studying fire weather with ACCESS
Robert Fawcett
CAWCR High Impact Weather Research
14 May 2013
www.cawcr.gov.au

The Centre for Australian Weather and Climate Research
A partnership between CSIRO and the Bureau of Meteorology
Acknowledgements
• Co-authors
• Will Thurston, Jeff Kepert and Kevin Tory
High Impact Weather Research
Weather and Environmental Prediction
The Centre for Australian Weather and Climate Research
Docklands, Victoria
• The Earth System Modelling group in CAWCR

The Centre for Australian Weather and Climate Research
A partnership between CSIRO and the Bureau of Meteorology
What are we trying to accomplish?
• to model the meteorology of days of significant fires (e.g., the Eyre Peninsula on 11 January 2005)
• using the Australian Community Climate and Earth-System Simulator (ACCESS), including the UK Met Office atmospheric model
• at high resolution (0.012° latitude/longitude spacing = 1.2 km approx.)
• and very high resolution (0.004° latitude/longitude spacing = 400 metres approx.)
• EP is the second of 10 cases simulated so far
• to see which aspects of the modelled meteorology might be important for fire behaviour and to see if aspects of the observed fire behaviour can be “explained” by the meteorology
• to see which aspects of the very-high-resolution meteorology are also seen in the lower-resolution simulations
• lower resolution simulations are cheaper and faster to run, and therefore closer to operational implementation
• outputs
• meteorological grids have been provided to project partners (FIRE-DST)
• accompanying documentation (technical reports; conference presentations, posters and papers; journal papers)

The Centre for Australian Weather and Climate Research
A partnership between CSIRO and the Bureau of Meteorology
Cases simulated so far …
• [4] Melbourne Dust Storm (Victoria) 8 February 1983
• [1] Blue Mountains (NSW) 25 December 2001
• Canberra (ACT) 18 January 2003
• [1] Eyre Peninsula (SA) 11 January 2005
• Boorabbin (WA) 30 December 2007
• [1,3] Black Saturday (Victoria) 7 February 2009
• [2] Margaret River (WA) 23 November 2011
• Dunalley/Tasman Peninsula (Tasmania) 4 January 2013
• Coonabarabran (NSW) 13 January 2013
• Dereel (Victoria) 28 March 2013
Some of these simulations have already been looked at in detail, others represent future work.
[1] “Official” case studies providing grids to project partners [2] Project deliverables from this case study [3] Results from this case study presented at Hobart RAF last year [4] Ash Wednesday (Victoria) 16 February 1983 being simulated by Uni. Melb. team

The Centre for Australian Weather and Climate Research
A partnership between CSIRO and the Bureau of Meteorology
How do we validate the simulations?
• By comparing the simulations against
• surface observations
• one-minute and thirty-minute automatic weather station (AWS) observations as
available in the computational domains
• upper-air observations
• radiosonde and wind-profile balloon flight observations as available in the
computational domains
• radar data
• where available (minimal for EP, partial for BS)
• satellite observations
• visual, infra-red imagery
• None of these observational data are assimilated into the model
simulations, so the simulation can be validated against completely
independent data.

The Centre for Australian Weather and Climate Research
A partnership between CSIRO and the Bureau of Meteorology
What aspects of the modelling can we verify?
• timing of the main wind change on 11 January 2005
• forecast maximum temperature
• forecast maximum wind speeds
• upper-level temperature and moisture
• features observed in the radar and satellite imagery if available
Source: Coroner’s report Source: NASA Earth Observatory

The Centre for Australian Weather and Climate Research
A partnership between CSIRO and the Bureau of Meteorology
Primary wind change on 11 January 2005
134 135 136 137 138
-36.0
-35.0
-34.0
-33.0
Longitude
Latitu
de
Wind change isochrones every half-
hour as analysed (BoM 2005) and
simulated using at 0.012°-resolution
from 11:00 to 14:00 EDT on 11 January
2005.
Bureau of Meteorology
2005: Meteorological
report on the Wangary
and Black Tuesday Fires:
Lower Eyre Peninsula,
10-11 January 2005

The Centre for Australian Weather and Climate Research
A partnership between CSIRO and the Bureau of Meteorology
Animations
Temperature (°C)
10 15 20 25 30 35 40 45
1600 UTC 10 Jan to 0900 UTC 11 Jan
0230 EDT 10 Jan to 1930 EDT 11 Jan
Wind direction
N E S W N
0.004°-resolution simulation
EP EP

The Centre for Australian Weather and Climate Research
A partnership between CSIRO and the Bureau of Meteorology
What have we learnt studying these wind changes?
• They come in many different flavours – e.g., rippled over water and
simpler over land – and can interact with each other
Wind direction
N E S W N
Wind direction
N E S W N
EP EP (1230 EDT) (0900 EDT)

The Centre for Australian Weather and Climate Research
A partnership between CSIRO and the Bureau of Meteorology
• In fact, they can change from one type into another
What have we learnt studying these wind changes?
132 134 136 138 140
-38
-36
-34
-32
-30
Longitude (°)
La
titu
de
(°)
Cross-section moving
along the orange
arrow. Sea-level to
6,000 metres. Colours
show potential
temperature in Kelvin.
Black (grey) contours
show positive
(negative) vertical
velocity in 1.5 m/s
intervals. From the
0.012°-resolution
simulation.
(K)
EP
Longitude (°)
Ele
va
tio
n (
me
tre
s)
133°E 138°E

The Centre for Australian Weather and Climate Research
A partnership between CSIRO and the Bureau of Meteorology
What have we learnt studying these wind changes?
• The wind change is not always a straight line and can have embedded
substructures and secondary wind changes
Wind direction
N E S W N
Forest Fire Danger Index
0 20 40 60 80 100 120 140
BS BS 20090207 0800 UTC (1900 EDT) 20090207 0840 UTC (1940 EDT)
NSW
Vic NSW
Vic
Echuca
Echuca
embedded
vortices

The Centre for Australian Weather and Climate Research
A partnership between CSIRO and the Bureau of Meteorology
What have we learnt studying these wind changes?
• The wind change can stall and generate an undular bore, with significant
consequences for fires underneath it (including nocturnal intensification of the
fire)
Wind direction
N E S W N
BS
Yarrawonga radar
Radar reflectivity
and modelled
wind direction
around the
Yarrawonga (Vic)
radar. Animation
starts at 1000
UTC (2100
EDT).
Beechworth-
Mudgegonga
fire
NSW
Vic
Echuca

The Centre for Australian Weather and Climate Research
A partnership between CSIRO and the Bureau of Meteorology
What have we learnt studying these wind changes?
• Their interactions with topography and coastlines can be complicated
Wind direction
N E S W N
DU
142 144 146 148 150 152
-46
-44
-42
-40
Longitude
La
titu
de
The Centre for Australian Weather and Climate Research
A partnership between CSIRO and the Bureau of Meteorology
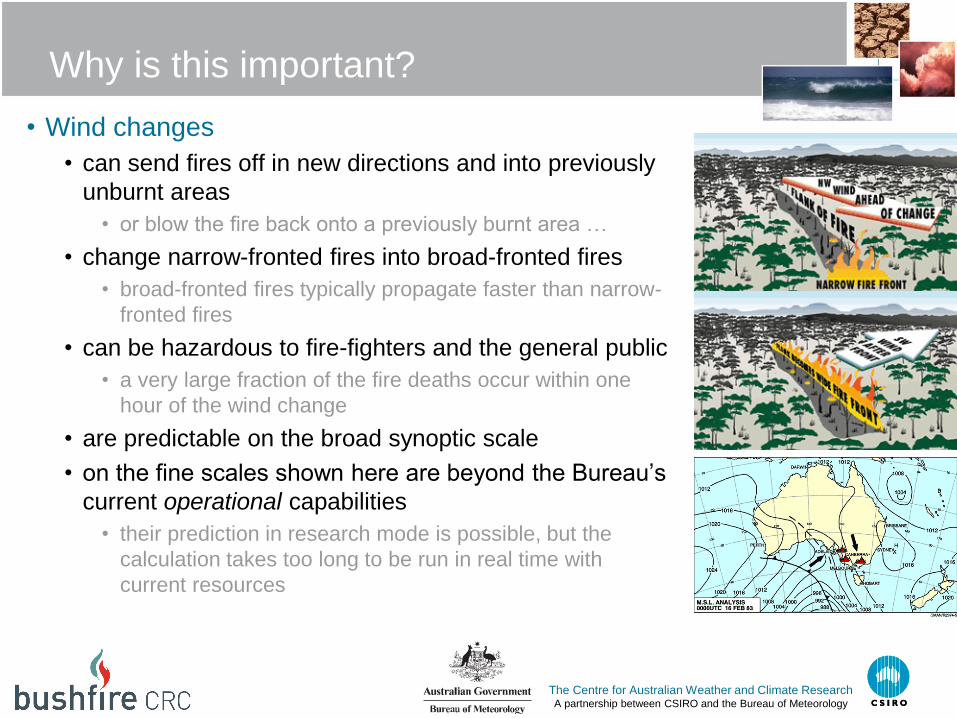
Why is this important?
• Wind changes
• can send fires off in new directions and into previously
unburnt areas
• or blow the fire back onto a previously burnt area …
• change narrow-fronted fires into broad-fronted fires
• broad-fronted fires typically propagate faster than narrow-
fronted fires
• can be hazardous to fire-fighters and the general public
• a very large fraction of the fire deaths occur within one
hour of the wind change
• are predictable on the broad synoptic scale
• on the fine scales shown here are beyond the Bureau’s
current operational capabilities
• their prediction in research mode is possible, but the
calculation takes too long to be run in real time with
current resources

The Centre for Australian Weather and Climate Research A partnership between CSIRO and the Bureau of Meteorology
Robert Fawcett
High Impact Weather Research
Phone: 03 9669 4296
Email: [email protected]
Web: www.cawcr.gov.au
Thank you www.cawcr.gov.au

The Centre for Australian Weather and Climate Research
A partnership between CSIRO and the Bureau of Meteorology
Nesting details
• The modelling begins with a
global model run. The second level
is at 0.11° resolution covering all of
Australia and surrounding waters.
Further levels of nesting
increasingly focus on the area of
interest.
• Boundaries of the third (red),
fourth (green) and fifth (blue)
nesting levels for the Black
Saturday model runs.
• Model boundaries are chosen, as
far as is possible, to avoid areas of
elevated topography.
• Comparison test runs also done
at 0.0075° (fifth level).
132 134 136 138 140
-38
-36
-34
-32
-30
Longitude (°)
La
titu
de
(°)
0.036°
0.012°
0.004°
0.0075°
approximate fire location

The Centre for Australian Weather and Climate Research
A partnership between CSIRO and the Bureau of Meteorology
-20 0 20 40 601
00
05
00
20
01
00
Temperature (°C), Wind speed (m/s)
Pre
ssu
re (
hP
a)
-140 °C -120 °C -100 °C -80 °C -60 °C -40 °C -20 °C
-20 0 20 40 60
10
00
50
02
00
10
0
Temperature (°C), Wind speed (m/s)
Pre
ssu
re (
hP
a)
-140 °C -120 °C -100 °C -80 °C -60 °C -40 °C -20 °C
Above-surface data
Vertical temperature traces for Adelaide Airport at 09:30 EDT (left) and 21:30 EDT
(right) UTC (right) on 11 January 2005, from the 3600-metre resolution model runs.
Temperatures are skewed.
air
temperature
dewpoint
temperature incre
asin
g h
eig
ht
model
obs. wind
speed
09:30 EDT 21:30 EDT

The Centre for Australian Weather and Climate Research
A partnership between CSIRO and the Bureau of Meteorology
0.0 0.5 1.0 1.5 2.0 2.5 3.0
010
20
30
40
50
018012 (1200m) CEDUNAAMO (-32.13,133.698)
Days since midnight on 20050110 (LCT)
Tem
pera
ture
(°C
), W
indspeed (
m/s
)
Tmax bias: 1.75
Dewpoint temperature
Wind speed
Air temperature
Wind direction
00:00 12:00 00:00 12:00 00:00 12:00 00:00 CDT
10 Jan 10 Jan 11 Jan 11 Jan 12 Jan 12 Jan 13 Jan
Surface data – Ceduna Airport T
em
pe
ratu
re (
°C),
Win
d s
pe
ed
(m
/s)
0 1
0 2
0
3
0
4
0
5
0
model
obs
obs
model
0.012°-resolution
simulation