Embed Size (px)
Citation preview

Australian Agricultural and Resource Economics Society (AARES)
55th Annual Conference
Melbourne, Australia, February 8 – 11, 2011
FARMER-TRADER RELATIONSHIPS IN THE INDONESIAN CHILLI
MARKETS: THE ROLE OF RELATIONSHIP QUALITY IN MODERN
AND TRADITIONAL SUPPLY CHAINS
Sahara*, Amos Gyau, Randy Stringer and Wendy Umberger
*Contact Author Sahara
PhD Student
School of Agriculture, Food and Wine,
University of Adelaide, Australia
Amos Gyau, PhD
Marketing Specialist
World Agroforestry Centre (ICRAF-CGIAR)
Yaoundé, Cameroon
Randy Stringer, PhD
Professor, Food Chain Economics School of Agriculture, Food and Wine,
University of Adelaide, , Australia
Wendy J. Umberger, PhD
Senior Lecturer, Food Chain Economics School of Agriculture, Food and Wine,
University of Adelaide, , Australia
** This is a draft copy – please email [email protected] for an updated
version prior to citing.
2
Farmer-trader relationships in the Indonesian chilli markets: the role of
relationship quality in modern and traditional supply chains
by
Saharaa, Amos Gyau
b, Randy Stringer
a and Wendy Umberger
a
aSchool of Agriculture, Food and Wine, University of Adelaide, Australia
bWorld Agroforestry Centre (ICRAF-CGIAR), Yaoundé, Cameroon
Abstract
A decade of strong economic growth, rapid urbanization and liberalization of foreign
direct investment (FDI) are transforming Indonesia’s food retail sector. Modern retail
markets are reorganizing how food chains operate: requiring product homogeneity,
grading, sorting, packaging, and supply consistency. Current literature suggests that
improving relationship quality among food chain actors enhances efficiency. In
Indonesia, chillies are a priority crop commonly produced by small holders and like
many other cash crops several farmer-trader issues emerging in chilli supply chains.
This paper attempts to segment chilli farmers according to their perception of the
relationship quality with their buyers. Data was collected through a survey of 602 chilli
farmers selling to the traditional market channel or supermarket channel in West Java,
Indonesia. The segments/clusters are developed based on the perceptions of chilli
farmers to three variables in relationship quality: trust, satisfaction and commitment.
Price satisfaction and socioeconomic attributes are analyzed to provide further insights.
Four distinct clusters are identified. The largest cluster (45% of respondents) considers
they have a high level of relationship quality with their buyers/traders.
Keywords: farmer-trader relationships, relationship quality, cluster analysis
1. Introduction
Strong economic growth, rapid urbanization and liberalization of foreign direct
investment (FDI) are driving Indonesia‟s food retail sector transformation (Natawidjaya,
et al., 2007). In particular, modern retail markets are reorganizing how food chains
operate: requiring product homogeneity; specific standards in sorting, grading and
packaging; and consistency in supply (Neven and Reardon 2004; Reardon, et al., 2003;
Reardon, et al.,2009). This transformation changes market conditions facing small
farmers since modern markets have higher product specifications compared to
3
traditional markets (Hernández, et al., 2007; Reardon, et al.,2009). Small farmers have
an opportunity to participate in modern markets as price incentives and may be higher
relative to traditional markets (Reardon, et.al., 2009). However, they also face several
constrains (i.e. capital constrains, time constrain and knowledge constrains) to meet‟
product specifications and requirements posed by modern markets (Dries, et.al., 2009;
Boselie, et at., 2003; Kaganzi, et al., 2009; Weatherspoon and Reardon, 2003).
Current literature suggests that improving relationship quality among food chain actors
enhances efficiency (Ellram and Hendrick, 1995; Kalwani and Narayandas, 1995).
Since modern markets face high transaction costs of exchange with a lot of small
farmers and difficulty in monitoring quality, modern markets tend to deal with a few
bigger suppliers or directly with larger farmers (Dries, et.al., 2009; Reardon and
Timmer, 2007). However, some studies confirm that small farmers may participate in
supermarket supply chains via intermediaries, i.e. specialized wholesalers/agents, large
wholesalers or farmer organizations (Kaganzi, et al., 2009; Moustier, et al., 2010;
Natawidjaya, et al., 2007; Reardon and Timmer, 2007). Through a closer relationship
between small farmers and their buyers may enable them to coordinate supply and
demand in the markets, exchange information with respect to price information; and
specific requirements in modern markets. This will reduce transaction costs and increase
opportunity of small farmers to compete in markets.
In Indonesia, chillies are a priority crop commonly produced by small farmers. Chillies
are an important cash flow income for small scale producers and an essential ingredient
in the Indonesian daily diet. The rise of modern market chains allows chilli farmers to
4
sell their produce not only to traditional market channels but also to modern market
channels via modern markets‟ agents. Like many others cash crops1, among the farmer-
trader issues emerging in chilli supply chains include weak bargaining position of
farmers; limited commitment of farmers to provide consistent supply due to price
volatility; and payment delays (White, et al., 2007).
An extensive literature pioneered by Reardon et al. focused on restructuring and the
implications of modern retail chains in developing and transition economies. However,
it did not consider the quality of relationship between farmer-trader under the rapid rise
of modern market penetrations. Many studies measure determinant factors and the level
of farmer-trader relationships, but perceive that the perceptions of farmers on the
relationship quality variables are identical. In fact, previous studies which focus on the
farmers‟ marketing behavior find the differences of attitude among farmers (McLeay, et
al., 1996; Poole, 2000). Hence, different perceptions of individual farmers with respect
to the level of relationship quality with their buyers may exist. A number of farmers
may perceive high level relationships for the period of transaction with their buyers, but
others possibly are still in the low or moderate levels. In these situations, different
policies and strategies are needed in order to serve different types of farmers, thereby
enhancing their efficiency and their ability to compete in modern markets.
This paper contributes to this literature. We attempts to understand how chilli farmers
differ in their perception of relationship quality with their buyers. Cluster analysis is
used to develop the perceptions of chilli farmers to three variables in relationship
1 For example the studies by Batt (2003); Coronado, et. al., (2010); Fabella (1992); Kaganzi, et al.,
(2009); Kottila, and Rönni (2006); and Lyon (2000) cite regarding to some issues in relationships
between farmers and traders.
5
quality: trust, satisfaction and commitment. To provide further insights, we also
incorporate price satisfaction dimensions and socioeconomic attributes in the analysis.
The paper then is organized as follows. The second section describes the current market
situations of chilli in Indonesia. Section 3 reviews the literature of relationship quality
and its dimensions. Section 4 discusses the methodology used in this research. Section 5
discusses the results of the while section 6 contains conclusions and implications for
future research.
2. Current markets of chilli in Indonesia
Indonesia produces more than one million tons of chillies per year since 20032, making
it as the fourth largest chilli producer after China, Mexico and Turkey3. On average
between 2003-2009 chilli production in Indonesia increased annually by about 4.7
percent. As an essential ingredient in the Indonesian daily diet, it is expected that the
production of chilli will continue to increase.
Chillies are mainly sold in domestic markets to wholesale markets; retail wet markets;
food processors and supermarkets. The wholesale markets and retail wet markets are
categorized as traditional marketing channels while the two later markets are considered
modern marketing channels. The traditional marketing channels still dominate since
95% of chillies are marketed through traditional channels (White, et al., 2007). Only
around five percent of chillies are supplied to consumers through modern markets
2 http://www.bps.go.id/tab_sub/view.php?tabel=1&daftar=1&id_subyek=55¬ab=15.
Viewed 17 August 2009 3 http://faostat.fao.org/site/339/default.aspx. Viewed 17 August 2010
6
(generally supermarkets). This is still small number but it likely to grow in parallel with
the estimated raise in supermarket penetrations.
In traditional channels chillies are collected by small traders before being distributed to
wholesale markets, wet markets or middlemen. Modern marketing channels obtain
chillies from wholesale markets or their agents, i.e. specialized wholesalers or preferred
suppliers (White, et al., 2007). Because of high transaction costs, the agents prefer to
build contracts (including oral or written contracts) with other trader/s rather than
buying chillies directly from farmers. For example, in West Java Province, the
management of Carrefour (one of the big supermarket channels operating in Indonesia)
has a contract with “Bimandiri Company”. This company has a role as a specialized
wholesaler delivering fresh vegetables (including chilli) to Carrefour. Bimandiri
Company then makes contract with local trader/s or farmer groups who then purchase
directly from farmers. In such situations the role of trader/s is important since they link
chilli farmers to either traditional or modern markets. However, as has been explained
previously, issues in respect to the relationship quality between farmers and their traders
appear. Therefore, it is important to evaluate farmers‟ perceptions on their relationship
with their buyers in order to improve their long-term relationship performance in
traditional and modern marketing channels.
Chilli commodity exhibits large price fluctuations with limited knowledge of selling
prices since chilli prices are determined by demand and supply interactions in the major
wholesale markets. This price volatility creates more risk for farmers. The traders in the
major wholesale markets set chilli prices based on daily situation of demand and supply
7
of chilli in these markets. Similar situations happen in modern marketing channels
where price information in the wholesale markets is utilized as a baseline for
determination of chilli price. Chilli prices increase significant coincidentally with major
Indonesian celebration, but reduce significantly when there is an over supply. Farmers
or buyers can do nothing in respect to the absolute price of chilli in the markets.
However, by building a good relationship between farmers and traders, farmers will
accept correct price information, price transparency and good price quality ratio for
their chillies from their buyers.
3. The literature review
Relationship quality refers to joint cognitive evaluation of business interactions by
significant individuals in both firms in the dyad (Holmlund, 2008). The quality of a
relationship is a critical point in the achievement of long-term success for their business
(Morgan & Hunt, 1994; Claassen, et al.; 2008; Kwon and Suh, 2004). Building closer
relationship between trading partners will increase efficiencies (Ellram and Hendrick,
1995; Kalwani and Narayandas, 1995), reduce transaction costs (Kwon and Suh, 2004)
and raise competitive advantage (Bejou, et al., 1996). Through better relationship
quality, trading partners will consider maintaining ongoing transactions (Caceres and
Paparoidamis, 2007; Bejou, et al., 1996; Garbarino and Johnson, 1999; Easton, 1994).
Current literature indicates that there is no common consensus in measuring the level of
relationship quality between exchange partners. However it seems that commitment,
trust and satisfaction are the most common variables to quantitatively measure
relationship quality together with one or several antecedents or consequences
8
(Holmlund, 2008; Morgan and Hunt, 1994; Kwon and Suh, 2004; Wong and Sohal,
2002; Sergeant and Lee, 2004) utilize two variables i.e. commitment and trust in
modeling relational quality. Bejou, et al., (1996); Ashnai et al. (2009); and Parsons
(2002) propose relational quality as a composite measure of trust and satisfaction.
However, some authors (e.g. Caceres and Paparoidamis, 2007; Smith, 1998; Lang and
Colgate 2003) combine the three variables – satisfaction, trust and commitment- in
evaluating the level of relationship quality. In those studies, the variable of commitment
is the highest construct in the relational quality model. It is followed by trust and
satisfaction.
Trust is an important variable since it can reduce the risk that the trading partner will act
opportunistically (Bradach and Eccles, 1989). In a relationship with a high level of trust,
the trading partners feel confidence in sharing information and in believing information
which they receive. Trust exists when the participants feel confidence with the
reliability and integrity of their exchange partner (Morgan and Hunt, 1994). Formally,
Moorman, et al. (1986) and Sargeant and Lee (2004) divided the definition of trust into
two categories, i.e. (1) a belief or expectation related to trustworthiness of a partner
resulting from expertise, reliability, or intentionally and (2) a behavioral intention that
reflects a reliance on a partner and involves vulnerability and uncertainty.
When a participant in the relationship feels satisfied with the past performance of his
partner, he will approach the future transactions with trust so the quality of their
relationship will improve. Bejou, et al. (1996); and Geyskens, et al. (1999. p.224) divide
the concept of satisfaction into two categories (1) economic satisfaction which refers to
9
„a channel member's positive affective response to the economic rewards that flow from
the relationship with its partner, such as sales volume and margins and (2) non
economic satisfaction which is defined as „a channel member's positive affective
response to the non economic, psychosocial aspects of its relationship‟.
Morgan and Hunt (1994) define commitment as „an exchange partner believing that an
ongoing relationship with another is so important as to warrant maximum efforts at
maintaining it; that is, the committed party believes the relationship is worth working on
to ensure that it endures indefinitely‟ (p.23). This definition has its parallels in the
definition of commitment from Hennig-Thurau and Klee (1997) which defines
commitment as „a customer‟s long-term ongoing orientation toward a relationship
grounded on both an emotional bond to the relationship and on the conviction that
remaining in the relationship will yield higher net benefits than terminating it‟ (p.752).
Once commitment exists, loyalty in the business relationship will increase (Caceres and
Paparoidamis, 2007).
In the agricultural economics and business literature many studies have been conducted
mainly to analyze antecedents of relationship quality variables. The studies by Batt
(2003) conclude there is a positive relationship between satisfaction and trust. Gyau and
Spiller (2007) divide the satisfaction into two constructs, i.e. non economic satisfaction
and price satisfaction and both constructs have positive impact on trust. Other studies,
for instance, by Batt and Rexha (1999) report the positive relationship between
satisfaction and trust; and between trust and commitment in the seed potato industry in
Asia. Schulze, et al., (2006) describe relationship quality as a higher-order construct
10
containing of all three variables, i.e. satisfaction, trust and commitment to evaluate the
level of relationship quality in the German pork and dairy sectors.
A few studies have been reviewed the role of relationship quality variables between
farmers and their buyers in a certain chain and confirmed the differentiation perceptions
among the farmers. Kottila and Rönni (2006) report a strong mistrust between farmers
and the milling factory in muesli chain while in the case of yogurt chain the level of
trust between organic farmers and the brand owner is varied. Ȍsterberg and Nilsson
(2009) find differences in farmers‟ commitment and their trust with the agricultural
cooperatives in Sweden. This study also concludes that older farmers have lower trust
than younger farmers. Batt (2003) finds that on overall potato farmers feel satisfied and
trust with their buyers.
4. Methodology
Study design and operation of the relationship constructs
The data was collected through a survey of 602 chilli farmers selling to the traditional
market or supermarket channels in West Java Province, Indonesia. This province
represents the largest chilli production zone in Indonesia with numerous supermarkets
and food processors active buying, processing and marketing chillies. The sample
consists of 489 chilli farmers as a representative sample of chilli producers (traditional
channel) and 113 chilli farmers as a representative sample of those supplying through
the supermarket channel. However, it must be noted that it was necessary to exclude
two respondents in the traditional channel and one respondent in the supermarket
channel due to inadequate data.
11
A multistage procedure was conducted prior to conducting the formal survey
particularly to determine the efficacy of the traditional channel sample. Three districts
in West Java, i.e. Ciamis, Garut and Tasikmalaya were selected based on reasoned
judgments: Garut represents the major production zone in West Java while Ciamis and
Taskimalaya are new emerging areas with substantial modern sector activities. Then
eight sub-districts in Garut and three sub-districts in each the new emerging area were
chosen following the accepted procedures in systemic random sampling (based on the
data of average chilli production in 2004-2008) in the three districts. This procedure
allows us to select every kth
element after we generated a random start (Churcill, et.al.,
2005, p.439):
(1) The average production of chilli from 2004 to 2008 in each sub-district was
calculated and sorted from the highest to the lowest. Then the cumulative of average
production was calculated as a basis for sub district selection.
(2) The interval of the average production was determined by dividing the total average
production and the number of sub-districts to be selected in the district.
(3) A “random starting point” was generated to determine initial level production of first
sub-district to be selected. The second sub-district was selected by adding that starting
point plus one interval and the third selected sub-district is chosen on the basis of the
starting point plus two intervals. In each of these sub-districts, three villages were
selected randomly and in each of these villages, 12 (plus an additional eight for backup)
chilli producers were drawn randomly from a list provided by the Extension Office and
the Land Tax Office.

12
In respect to the supermarket channel sample, a list of chilli producers whose chillies
end up in supermarket was collected from various sources, i.e. supermarket suppliers,
local agricultural staffs and other contact persons in the field. The 113 farmer supplying
to supermarkets were identified and it was discovered that, without exception, they all
live in Ciamis District. All farmers were interviewed during the field survey.
A structured questionnaire provided information on household characteristics, assets,
agricultural land, chilli production, input costs, chilli marketing, changes in chilli
production and marketing arrangement over the previous five years. Perceptions of and
experience with modern channels, cash income activities and perception on relationship
and price satisfaction with their buyers were also sought. A-five-point Likert scale from
one (strongly disagree) to five (strongly agree) was utilized to rate the level of
relationship and price satisfaction.
The study utilizes variables of trust, satisfaction and commitment as the main construct
in the relationship quality. We sought to explore “commitment” through three items by
following those used by Kwon, I. G (2004) and (Morgan, 1994). “Trust” is explored
through three items based on study by Batt (2003) and Gyau and Spiller (2007). Four
items related to “satisfaction” consist of two items related to general price satisfaction
and two items directed towards non-economic satisfaction. They are adapted from
Geyskens, et al (1999), Batt (2003) and Gyau and Spiller (2007). Major modifications
were, however, required to adapt those statements to the context of farmer-buyer
relationship in chilli commodity. The three variables-commitment, satisfaction and
trust- were employed as the basis of the group in cluster analysis.
13
In addition, five price satisfaction dimensions were incorporated in the analysis in order
to provide further description of the clusters. We adapted five dimensions of price
satisfactions i.e. relative price, price transparency, price quality ratio, price fairness and
price reliability based on the work of Matzler, et al. (2006) and Matzler, et al. (2007).
We referred to definition of each dimension in those studies by Matzler but, of
necessity, modified each definition with respect to the farmer-buyer relationships in the
chilli commodity.
“Relative price” provides a clear, comprehensive, current and effortless overview of
buyers quoted prices and it was assessed through two items. “Price-quality ratio” is a
ratio between chilli qualities and price paid by the buyers and it was explored through
two items. “Price fairness” is defined as the farmer‟s perception of whether the
difference between the socially accepted prices is reasonable, acceptable or justifiable
and it was evaluated through two items. “Price reliability”, defined as awareness of
price changes, is assessed through a single item. Finally, still based on Matzler (2007)
“relative price” is that price which farmers receive from their buyers when compared to
that price which was offered by other buyers: it was explored through two items.
Statistical procedures
Multiple stages were involved in segmentation analysis as outlined in Gloy & Akridge,
(1999); Gyau, et al., (2009); Onyango, et al., (2006). The analysis is conducted by using
“Stata” statistical software version 10.

14
Initially principal component analysis with varimax rotation was used in relationship
quality constructs. The reliability of the measurement scale of the relationship quality
variables was tested using Cronbach Alpha. Next, a two stage cluster analysis was
applied to identify clusters of chilli farmers which express similar views on their
relationship with buyers. We used hierarchical procedure to find the number of clusters
utilizing “Ward‟s hierarchical clustering” method. By examining the dendogram, we
identified four of cluster numbers. We combined the dendogram result with Calinski
and Harabasz pseudo F value. This computation indicated that the four-group solution is
the most distinctive from other group solutions (appendix 1). Next, the four-group of
clusters was set into k-means cluster analysis in order to obtain the final cluster solution.
The Euclidian distances were employed in “Ward‟s” and” k-means” clustering in
measuring the similarity. Besides relationship quality variables, we evaluated price
satisfaction dimensions and socioeconomic attributes in the analysis. The ANOVA and
chi-square tests were applied to investigate the heterogeneity among the four-group
clusters. Following those tests, a “Tukey‟s honestly significant differences (HSD)” test
was utilized to examine further significant differences across the clusters.
5. Results and discussion
Description of sample characteristics
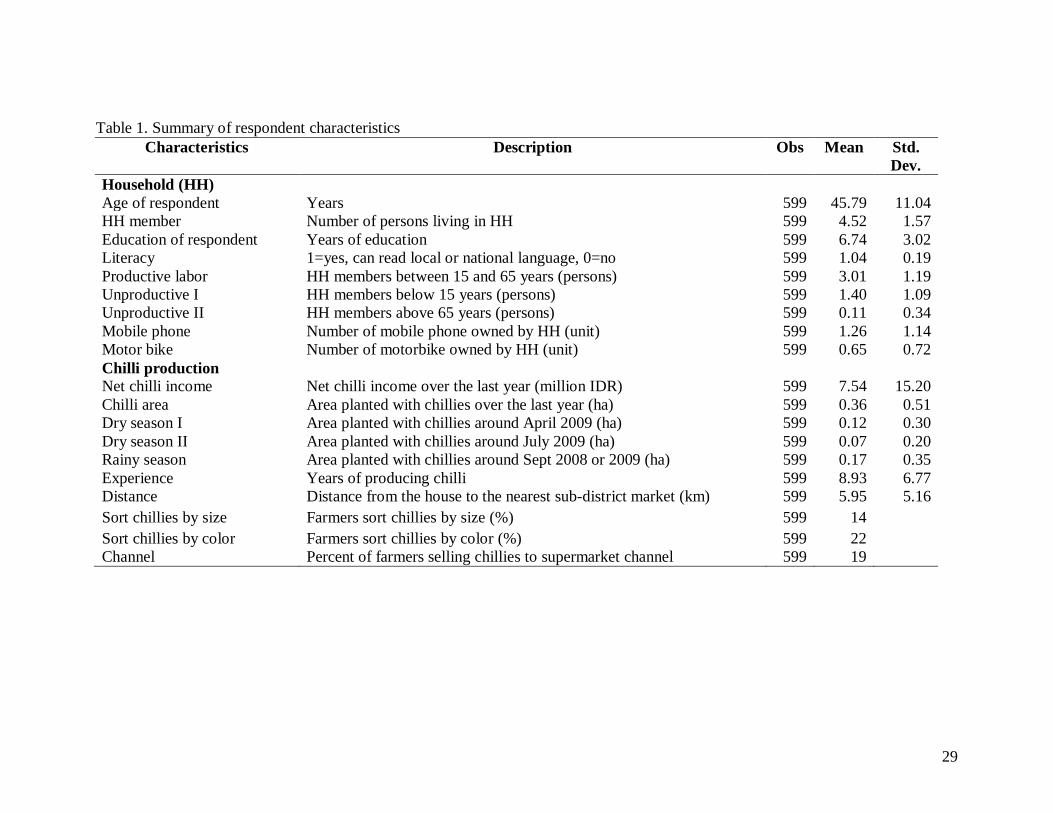
The assimilated data of respondents with respect to household and chilli production
characteristics are shown in Table 1. The average age of the respondents is 46 years,
and the average amount of schooling of the respondents was 7 years. With this level of
education, the respondents not face serious literacy problems. Typically the household
15
has 5 members, with average of 3 persons as productive laborers. Mobile phone
ownership appears more common than motor bike ownership amongst respondents.
Over survey period, only a small area was dedicated to chilli production (0.36 ha);
therefore it is not surprising that the farmers only obtained a small income from chilli
(7.54 million IDR). About 0.17 ha of household‟s land is allocated to chilli production
in the rainy season since it is easier for households to manage irrigation issues. The
average of years spent by the respondents in chilli production is about 9 years. The
respondents seem not pay enough attention on sorting activities during transactions.
Only 14% and 22% of respondents sort the chillies on the basis of size and color,
respectively, before being delivered to traders. About 19% of respondents are selling
their production through supermarket channels.
Table 1 here
Dimensions of relationship quality: factor analysis results
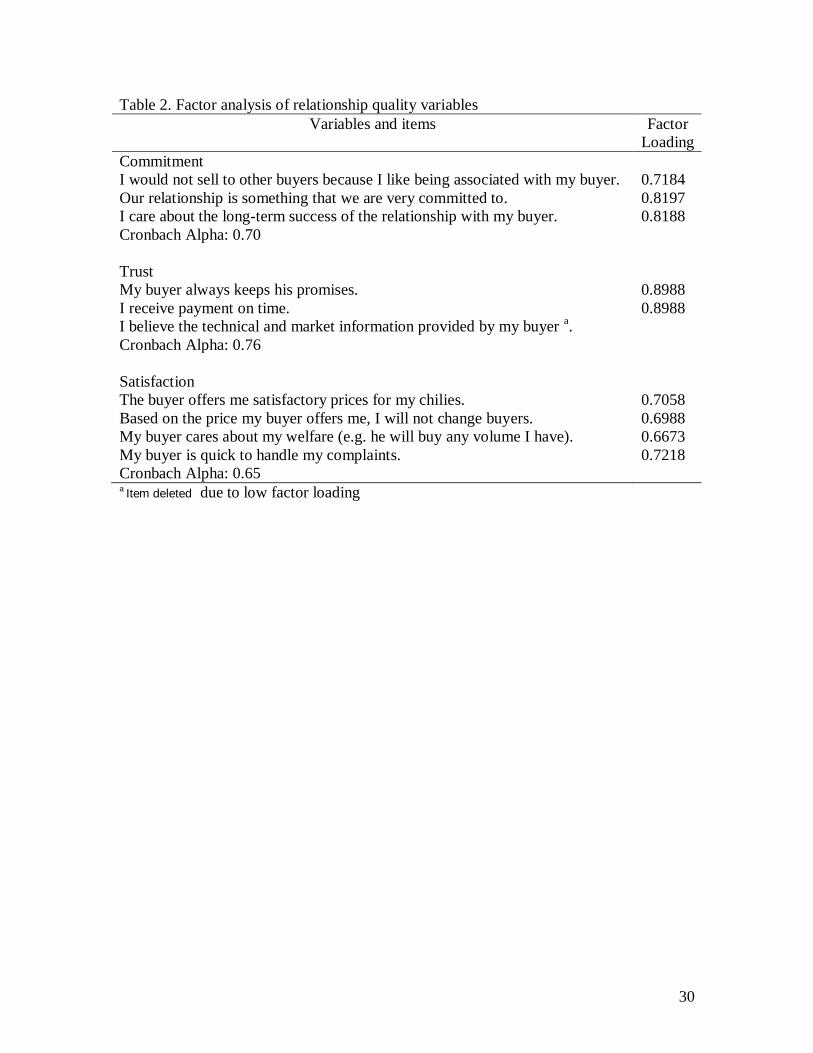
Table 2 presents the factor loading from the principal component factor analysis to the
three-variables of relationship quality, i.e. commitment, trust and satisfaction. The
factor loading for all items in each variable is above 0.5 except one item on trust;
therefore we exclude this item in our analysis (Nunnaly, 1978). With Cronbach‟s alpha
on commitment and trust equal to and above 0.7 respectively, the variables were on the
recommended threshold (Nunnally, 1978). However, satisfaction which was explored
through four items has a Conbach‟s alpha result of 0.65, which is below the minimum
adequate value of 0.7 (Nunnally, 1978). However, following the example of Batt (2003)
16
in which he permits a variable of goal compatibility with a Cronbach‟s alpha result of
0.659, the satisfaction variable in our study was considered acceptable. Moreover, some
studies consider the any resultant value which yields a Cronbach‟s alpha values above
0.6 as acceptable and sufficient for further analysis (Garbarino, 1999; Smith, 1998;
Gyau, 2009).
Table 2 here
Cluster analysis results
Four groups were identified with respect to chilli farmers‟ opinions in respect to their
relationships with traders. The data in Table 3 demonstrates the mean, standard
deviation and the number of the sample in each group. The results of the “Anova” and
the “Tukey HSD” tests show strong and significant heterogeneity at 5% between these
three variables of relationship quality across the clusters.
Cluster 1: This cluster is comprised of 14% of respondents. It is characterized by lack
of satisfaction and commitment. Farmers in this cluster report that they believe that they
do not receive reasonable prices from their buyers. Further the respondents indicate that
their buyers do not care about farmers‟ welfare: in that sense that if buyers believe that
they have already purchased sufficient quantities of chillies any given time, then the
buyers will not purchase any further supply from farmers. Moreover if farmers have
complaints (e.g. regarding chilli prices, grading systems etc) the buyers give a slow
response in respect to these grievances. In this cluster, such low levels of satisfaction
seem to lead to low levels of commitment: i.e. if chilli farmers can find alternative

17
buyers, they exhibit little hesitation in selling their chilli to the new buyer. Although
they have a low level of satisfaction and commitment, the farmers in this group partly
agree with two items in the trust variable.
Cluster 2: This is the smallest group in this study and constitute only 11% of total
respondents. Relative to the three other relationships, chilli farmers in this group have
the lowest levels of agreement on trust, but relatively moderate in respect in the areas of
commitment and satisfaction. The response of chilli farmers in this group suggests that
buyers are less likely to keep promises and seem less willing to provide timely payment.
Similarly to cluster 1, they are concerned about the issue of the buyers‟ tardiness in
handling farmers‟ complaints. Regarding general price satisfaction, chilli farmers in this
cluster would consider abandoning their relationships if they could obtain a higher price
from alternative buyers.
Cluster 3: There are 272 respondents (45%) in this cluster, making it the largest of the
groups. It is characterized by the highest levels of satisfaction, trust and commitment
relative to the other clusters. Respondents are very satisfied with their buyers and
believe that their buyer can be trusted. Consequently, the farmers wish to maintain their
relationships with their buyers.
Cluster 4: This group, the second largest in this study, comprises 29% of respondents.
The farmers indicate that they experience high levels of trust with the exchange since
the buyers always keep their promise and provide payment in a timely fashion.
Although farmers indicate that feel reasonably satisfied with the prices offered by their
18
buyers, they would still consider choosing other buyers if they could find others who
were offering higher prices. It is perhaps not surprisingly that these farmers have only
moderate levels of commitment. Again, in similarity with other clusters, price
satisfaction is the primary factor in the relationship between farmers and their buyers.
Table 3 here
Characterizing the clusters
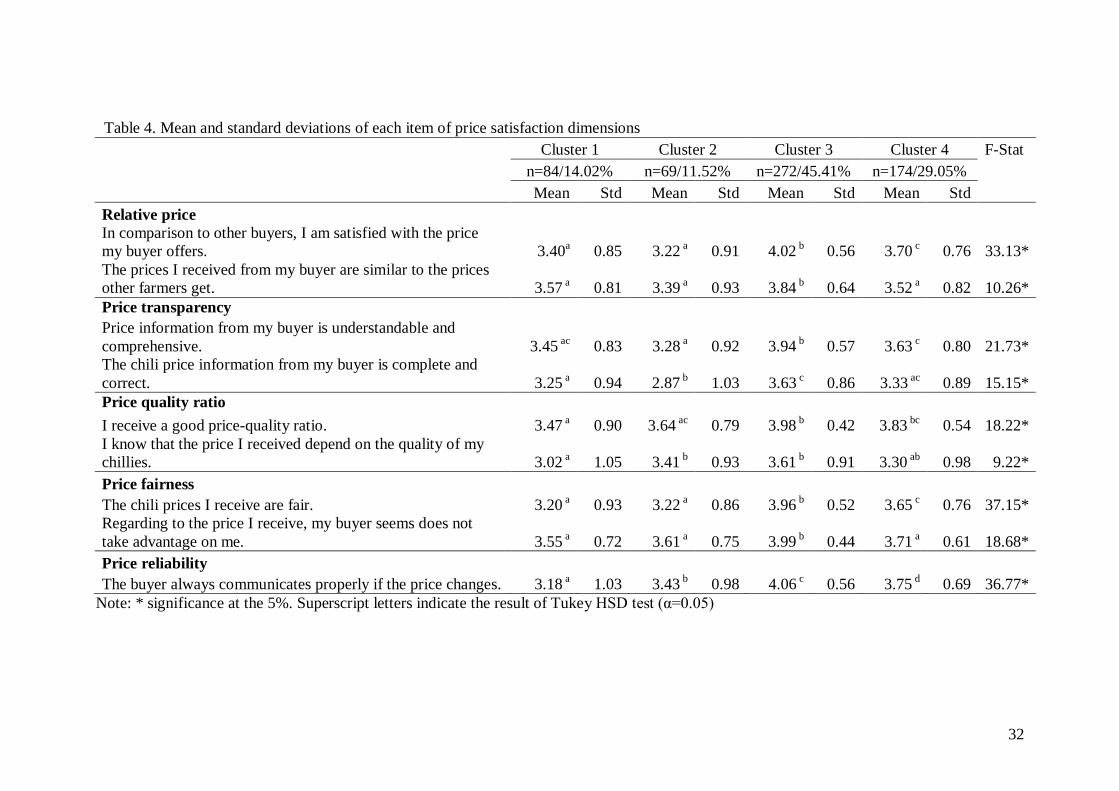
Perception of respondents on price satisfaction dimensions
The clustering results indicate that majority of farmers are dissatisfied with price offered
by buyers. In this study we attempt to explore further which the price dimensions might
either reduce or improve general price satisfaction and hence overall satisfaction. Table
4 presents the mean and standard deviation in each of the price dimension statements.
The “Anova” tests indicate that there are significant differences among all clusters with
respect to all price satisfaction dimensions.
The perception of relative price differed across the clusters. Respondents in cluster 3
agree that their buyers offer a satisfactory price than other buyers; cluster 4 tends to
agree moderately with this item whereas cluster 1 and cluster 2 show moderate
agreement with this item. In general, all clusters (except for cluster 3) have a moderate
agreement with a comparison of prices received among the farmers from similar buyers.
As would be expected, cluster 3 tends to agree to all items in price transparency whereas
cluster 2 shows the least agreement. Members in cluster 2 perceive that their buyers
provide inaccurate price information.
19
Moreover, respondents in the cluster 1 and 2 show the least agreement with regards to
the price quality ratio, price fairness and price reliability items. For the members of
those two clusters, they believe that there is an imbalance between the price provided by
their buyers and the quality of chillies offered by farmers. Moreover, buyers are
perceived to have a tendency to take advantage of farmers through offering unfair
prices, e.g. the buyers sometimes hide components such as transportation costs, which
results the real price received by the farmer being lower than the price which he
believed he had negotiated and on which he had agreed. In turn, farmers in cluster 1 and
2 are less willing to believe in the willingness of buyers to inform them of price
escalation.
Due to low or moderate levels in most price satisfaction dimensions, respondents in
cluster 1 and 2 demonstrate low levels of relationship with their buyers. In general,
respondents in cluster 4 report moderate agreement within the price satisfaction
dimensions. Even cluster 3 which is characterized by a “good relationships”, farmers
asses price satisfaction items a lower level than relationship statements.
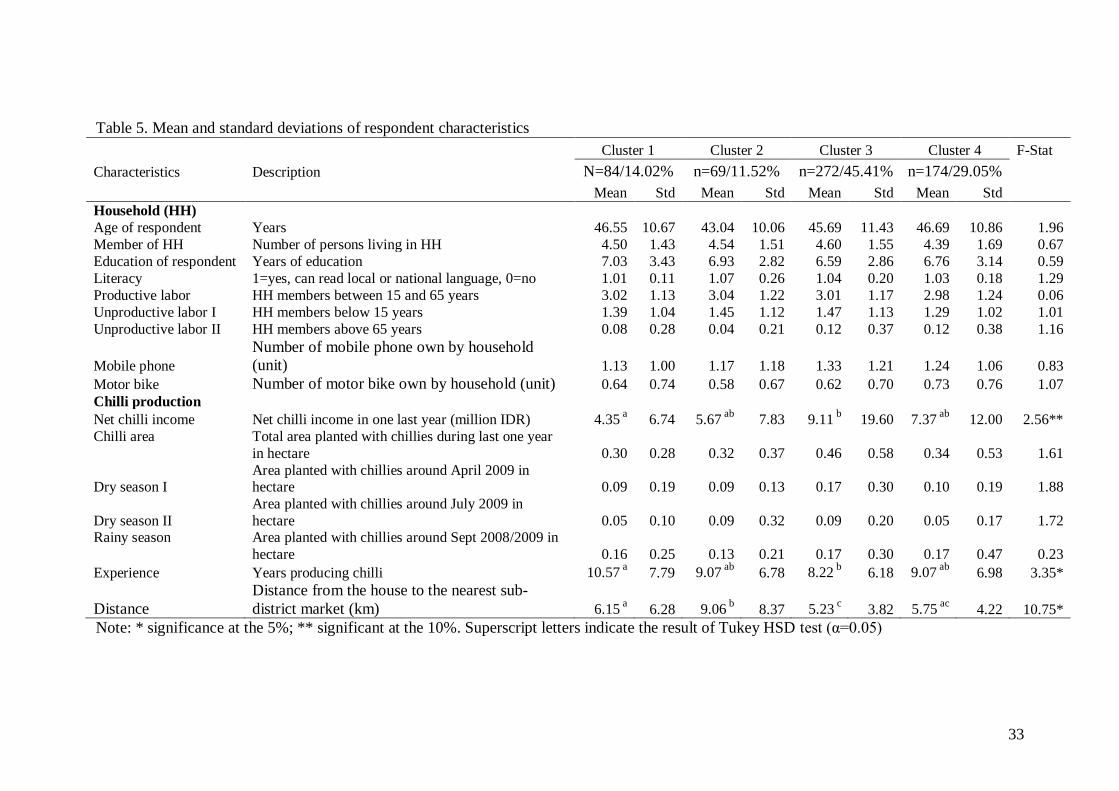
Socioeconomic characteristic
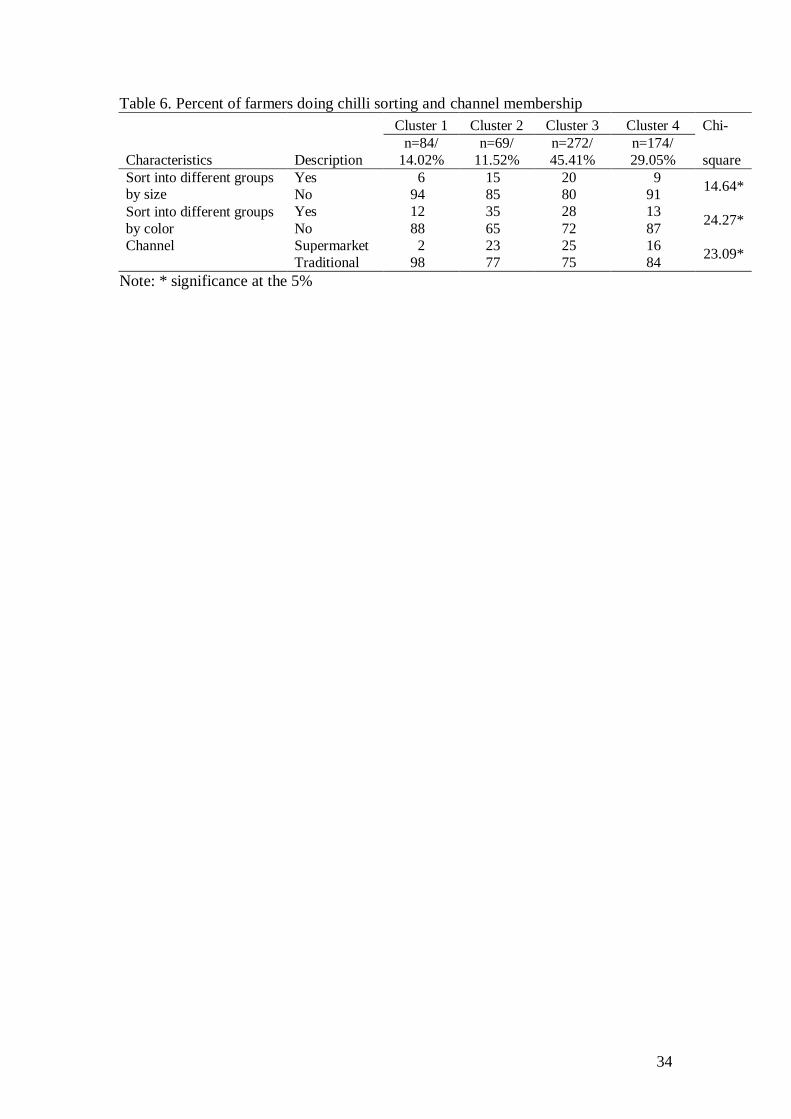
Table 5 and Table 6 contain the characteristics of households and chilli production
synthesising all clusters. It is clearly demonstrated that household characteristics do not
differ between the clusters. In turn, this implies that good or poor relationship quality is
not determined by the household characteristics.
20
However, chilli production characteristics can, it seems, be used to characterize the
clusters identified. There are some differences among the clusters that are significant (at
5% and 10% levels). Respondents in cluster 3 have the highest net chilli income (Table
5) probably because some members (25%) are selling to supermarket channels.
Therefore, the members in this cluster concern to sorting activities. In contrast, by about
98% of respondents in cluster 1, which is characterized by the lowest net chilli income,
are selling to traditional channel. They are somewhat the least concern to the sorting
activities (Table 6).
Interestingly, respondents in cluster 3 have the least experience in chilli farming while
cluster 1 which characterised by low level of relationship quality is the most experience.
This finding is similar to Batt (2003) who indicates that the longer the duration of
relationship with the buyers, the lower the farmer‟s trust level with the buyers
examined. In such situation when the farmers become increasingly familiar with their
buyers, the farmer‟s experience suggested that at the some point in time, the buyers
would take advantage on them. Moreover, members in cluster 3 are living close to the
sub-district market allow them to get more access to market information and
communication.
Table 5 and 6 here
6. Conclusions and Implications
We segment the nature of relationship quality between chilli farmers and their buyers
from the farmers‟ perspective. Similar to the studies in the area of farmer‟s strategic
behavior (McLeay, et al., 1996; Poole, 2000); there are some important differences
21
among farmers regarding to relationship quality issues. In this study, chilli farmers are
categorized into four clusters; each with differing perceptions on relationship quality,
price satisfaction and chilli production characteristics. The differences across the
clusters suggest that targeted strategies are required to optimize farmer-trader
relationships.
Cluster 1 is characterized by a low level of satisfaction, commitment and a moderate
level of price satisfaction dimensions. Cluster 1 farmers have the most experience in
chilli production; however they are much less interested in sorting values than other
clusters. This cluster has the least net chilli income compared to other groups.
Considering these situations, respondents in cluster 1 are typically satisfied by selling at
current market prices and price transparency. Traders may encourage farmers to sort
and grade their chillies by providing price incentives based on chilli quality. Moreover,
traders might consider providing quick responses in handling farmers‟ complaints and
concerns to improve long-term relationship with the farmers.
Farmers in cluster 2 have low levels of trust; satisfaction and price transparency. This
cluster also has moderate levels of commitment with their buyers. Farmers in this
cluster are relatively more interested in sorting activities, probably because a number of
this cluster are already involved in supermarket channels. To improve relations, traders
should provide timely payment; follow through with their promises; provide correct
price information; and offer quick responses in handling farmers‟ complaints.
22
Unlike the three other clusters, farmers in cluster 3 have a relatively high level in their
relationship with their buyers. It is similar to study by Batt (2003) that finds a very
positive relationship between potato farmers and traders in the Red River Delta,
Vietnam. Although respondents in this cluster have the least experience in chilli
farming, they obtain the highest net chilli income among all clusters. Similar to cluster
2, a number of respondents in cluster 3 are selling their chillies to supermarket channels.
However, the perceptions of farmers related to the correctness of price information and
to the comparison between chilli qualities and price offered by traders are as not high as
with the perception on other items in price satisfaction dimensions. Therefore, when
dealing with cluster 3, traders should provide more accurate price information; offer
prices based on chilli quality; and spend maintaining their relationship.
Respondents in cluster 4 perceive high levels of trust, but moderate levels of
commitment, satisfaction and price satisfaction dimensions. Similar to cluster 1, farmers
in cluster 4 are not as interested in sorting activities. With respect to this cluster, traders
should encourage farmers to sort and grade their chilli and provide price transparency.
This study only examines farmer-buyer relationship from the farmers‟ perspective.
Future study should consider incorporating methods to measure the same perceptions
from the buyers‟ perspective. Moreover, we also exclude a number of factors that have a
significant influence on trust, commitment, satisfaction and the question as to what
extent price satisfaction dimensions impact on satisfaction. Therefore, future research
should incorporate those issues in order to provide more holistic information concerning
the farmer-buyer relationship in chilli supply chain.
23
7. Acknowledgements
The research was funded by the Australian Centre for International Agricultural
Research (ACIAR). The support and assistance in survey development and design from
Dr. Nick Minot are gratefully acknowledged.
24
8. References
Ashnai, B., Smirnova, M., Kouchtch, S., Yu, Q., Barnes, B.R., & Naude´, P. (2009).
Assessing relationship quality in four business-to-business markets. Marketing
Intelligence & Planning, 27(1), 86-102.
Batt, P.J. (2003). Building trust between growers and market agents. Supply Chain
Management: An International Journal, 8(1), 65-78.
Batt, P.J. (2003). Examining the performance of the supply chain for potatoes in the Red
River Delta using a pluralistic approach. Supply Chain Management: An
International Journal, 8(5), 442-454.
Batt, P.J., & Rexha, N. (1999). Building Trust in Agribusiness Supply Chains. Journal
of International Food & Agribusiness Marketing, 11(1), 1-17.
Bejou, D., Wray, B., & Ingram, T.N. (1996). Determinants of relationship quality: an
artificial neural network analysis. Journal of Business Research, 36, 137-143.
Boselie, D., Henson, S., & Weatherspoon, D. (2003). Supermarket procurement
practices in developing countries: redefining the roles of the public and private
sectors. American Journal Agricultural Economics, 85(5), 1155–1161.
Bradach, J.I., & Eccles, R.G. (1989). Price, authority, and trust: from ideal types to
plural forms. Annual Review of Sociology, 15, 97-118.
Caceres, R.C., & Paparoidamis, N.G. (2007). Service quality, relationship satisfaction,
trust, commitment and business-to-business loyalty. European Journal of
Marketing, 41(7/8).
Churchill, Girlbert A., & Iacobucci, Dawn. 2005. Marketing Research:Methodological
Foundations, Ninth Edition. Thomson, South-Western.
Claassen, M.J.T., van Weele, A.J., & van Raaij, E.M. (2008). Performance outcomes
and success factors of vendor managed inventory (VMI). Supply Chain
Management : An International Journal, 13(6), 406-414.
Coronado, J.J.A., Bijman, J., Omta, O., & Lansink, A.O. (2010). Relationship
characteristics and performance in fresh produce supply chains: the case of the
Mexican avocado industry. Journal on Chain and Network Science, 10(1), 1-15.
Dries, L., Germenji, E., Noev, N., & Swinnen, J.F.M. (2009). Farmers, vertical
coordination, and the restructuring of dairy supply chains in Central and Eastern
Europe. World Development, 37(11), 1742-1758.
Easton, G., & Araujo, L. (1994). Market exchange, social structures and time. European
Journal of Marketing, 28(3), 72-84.
25
Ellram, L.M., & Hendrick, T.E. (1995). Partnering characteristics: A dyadic
perspective. Journal of Business Logistics, 16(1), 41-64.
Fabella, R.V. (1992). Price uncertainty and trader-farmer linkage. Journal of Public
Economic, 47, 391-399.
Garbarino, E., & Johnson, M.S. (1999). The different roles of satisfaction, trust, and
commitment in customer relationships. Journal of Marketing, 63(April), 70-87.
Geyskens, I., Steenkamp, J.E.M., & Kumar, N. (1999). A meta-analysis of satisfaction
in marketing channel relationships. Journal of Marketing Research, 36(May),
223-238.
Gloy, B.A., & Akridge, J.T. (1999). Segmenting the commercial producer marketplace
for agricultural inputs. International Food and Agribusiness Management
Review, 2(2), 145-163.
Gyau, A., Voss, J., A, S., & Enneking, U. (2009). Farmer acceptance of genetically
modified seeds in Germany: Results of a cluster analysis. International Food and
Agribusinee Management Review, 12(4), 61-80.
Gyau, A., & Spiller, A. (2007). Determinants of trust in the international fresh produce
business between Ghana and Europe. International Business Management, 1(4),
104-111.
Hennig-Thurau, T., & Klee, A. (1997). The Impact of customer satisfaction and
relationship quality on customer retention: a critical reassessment and model
development. Psychology & Marketing, 14(8), 737-764.
Hernández, R., Reardon, T., & Berdegu´e, J. (2007). Supermarkets, wholesalers, and
tomato growers in Guatemala. Agricultural Economics, 36, 281-290.
Holmlund, M. (2008). A definition, model, and empirical analysis of business-to-
business relationship quality International Journal of Service Industry
Management, 19(1), 32-62.
Kaganzi, E., Ferris, S., Barham, J., Abenakyo, A., Sanginga, P., & Njuki, J. (2009).
Sustaining linkages to high value markets through collective action in Uganda.
Food Policy, 34, 23-30.
Kalwani, M.U., & Narayandas, S. (1995). Long-term manufacture-supplier
relationships: do they pay off for supplier firm? Journal of Marketing, 59(1-16).
Kottila, M.R., & Rönni, P. (2006). Collaboration and trust in two organic food chains.
British Food Journal, 110(4/5,), 376-394.
26
Kwon, I.G., & Suh, T. (2004). Factors affecting the level of trust and commitment in
supply chain relationships. The Journal of Supply Chain Management, Spring,
4-14.
Lang, B., & Colgate, M. (2003). Relationship quality, on-line banking and the
information technology gap. International Journal of Bank Marketing, 21, 29-37.
Matzler, K., Renzl, B., & Faullant, R. (2007). Dimensions of price satisfaction: a
replication and extension. The International Journal of Bank Marketing, 25(6),
394-405.
Matzler, K., Würtele, A., & Renzl, B. (2006). Dimensions of price satisfaction: a study
in the retail banking industry. International Journal of Bank Marketing, 24(4),
216-231.
McLeay, F., Martin, S., & Zwart, T. (1996). Farm business marketing behavior and
strategic groups in agriculture. Agribusiness, 12(4), 339-351.
Moorman, C., Deshpande, R., & Zaitnnan, G. (1986). Factors affecting trust in market
research relationships. Journal of Marketing, 57(January), 81-101.
Morgan, R.M., & Hunt, S.D. (1994). The Commitment-Trust Theory of Relationship
Marketing Journal of Marketing, 58(3), 20-38.
Moustier, P., Tam, P.T.G., Anh, D.T., Binh, V.T., & Loc, N.T.T. (2010). The role of
farmer organizations in supplying supermarkets with quality food in Vietnam.
Food Policy, 34, 2010.
Natawidjaya, R., Reardon, T., Shetty, S., Noor, T.I., Perdana, T., & Rasmikayati, E.
(2007). Horticultural producer and supermarket development in Indonesia.
World Bank report no.38543. Jakarta: World Bank.
Neven, D., & Reardon, T. (2004). The Rise of Kenyan supermarkets and the evolution
of their horticulture product procurement systems. Development Policy Review,
22(6), 669-699.
Nunnally. (1978). Psychometric Theory, 2nd
Edition. McGraw-Hill New York.
Onyango, B., Govindasamy, R., Hallman, W., Jang, H., & Puduri, V.S. (2006).
Consumer acceptance of genetically modified foods in South Korea: Factor and
cluster analysis. Journal of Agribusiness, 24(1), 61-78.
Ȍsterberg , P., & Nilsson, J. (2009). Member's perception on their participation in the
governance of cooperatives: the key to trust and commitment in agricultrual
cooperatives. Agribusiness, 25(2), 181-197.
27
Parsons, A.L. (2002). What determines buyer-seller relationship quality? An
investigation from the buyer‟s perspective. The Journal of Supply Chain
Management, Spring, 4-12.
Reardon, T., Barrett, C.B., Berdegué, J.A., & Swinnen, J.F.M. (2009). Agrifood
industry transformation and small farmers in developing countries. World
Development, 37(11), 1717-1727.
Reardon, T., & Timmer, C.P. (2007). Transformation of markets for agricultural output
in developing countries since 1950: How has thingking changed? In R. Evenson
& P. Pingali (Eds.), Handbook of Agricultural Economics, (Vol. 3, pp. 2807-
2855). Amsterdan: Elsevier.
Reardon, T., Timmer, C.P., Barrett, C.B., & Berdegué, J. (2003). The Rise of
Supermarkets in Africa, Asia, and Latin America. American Journal of
Agricultural Economics, 85(5), 1140-1146.
Poole, N.D. (2000). Production and marketing strategies of Spanish citrus farmers.
Journal of Agricultural Economics, 51(2), 210-223.
Sargeant, A., & Lee, S. (2004). Trust and relationship commitment in the United
Kingdom voluntary sector: determinants of donor behavior. Psychology &
Marketing, 21(8), 613-635.
Schulze, B., Spiller, A., & Wocken, C. (2006). Supplier relationship quality in the
German pork and dairy sector: theoretical considerations and empirical
evidence, 16th Annual World Forum and Symposium “Agribusiness, Food,
Health, and Nutrition”, IAMA Conference, June 10 – 13. Buenos Aires,
Argentina.
Smith, J.B. (1998). Buyer–seller relationships: similarity, relationship management, and
quality. Psychology & Marketing, 15(1), 3-21.
StataCorp. 2005. Stata Statistical Software: Release 9. College Station, TX: StataCorp
LP.
White, B., Morey, P., Natawidjaja, R., and Morgan, W. (2007). Vegetable value chains
in Eastern Indonesia-a focus on chili. Australian Centre for International
Agricultural Research, Canberra.
Wang, H., Dong, X., Rozelle, S., & Huang, J. (2009). Producing and procuring
horticultural crops with Chinese characteristics: The case of Northern China.
World Development, 37(11), 1791-1801.
Weatherspoon, D.D., & Reardon, T. (2003). The Rise of Supermarkets in Africa:
Implications for Agrifood Systems and the Rural Poor. Development Policy
Review, 21(3), 333-355.
28
Wong, A., & Sohal, A. (2002). An examination of the relationship between trust,
commitment and relationship quality. International Journal of Retail and
Distribution Management, 30, 34-50.
29
Table 1. Summary of respondent characteristics
Characteristics Description Obs Mean Std.
Dev.
Household (HH)
Age of respondent Years 599 45.79 11.04
HH member Number of persons living in HH 599 4.52 1.57
Education of respondent Years of education 599 6.74 3.02
Literacy 1=yes, can read local or national language, 0=no 599 1.04 0.19
Productive labor HH members between 15 and 65 years (persons) 599 3.01 1.19
Unproductive I HH members below 15 years (persons) 599 1.40 1.09
Unproductive II HH members above 65 years (persons) 599 0.11 0.34
Mobile phone Number of mobile phone owned by HH (unit) 599 1.26 1.14
Motor bike Number of motorbike owned by HH (unit) 599 0.65 0.72
Chilli production
Net chilli income Net chilli income over the last year (million IDR) 599 7.54 15.20
Chilli area Area planted with chillies over the last year (ha) 599 0.36 0.51
Dry season I Area planted with chillies around April 2009 (ha) 599 0.12 0.30
Dry season II Area planted with chillies around July 2009 (ha) 599 0.07 0.20
Rainy season Area planted with chillies around Sept 2008 or 2009 (ha) 599 0.17 0.35
Experience Years of producing chilli 599 8.93 6.77
Distance Distance from the house to the nearest sub-district market (km) 599 5.95 5.16
Sort chillies by size Farmers sort chillies by size (%) 599 14
Sort chillies by color Farmers sort chillies by color (%) 599 22
Channel Percent of farmers selling chillies to supermarket channel 599 19
30
Table 2. Factor analysis of relationship quality variables
Variables and items Factor
Loading
Commitment
I would not sell to other buyers because I like being associated with my buyer. 0.7184
Our relationship is something that we are very committed to. 0.8197
I care about the long-term success of the relationship with my buyer. 0.8188
Cronbach Alpha: 0.70
Trust
My buyer always keeps his promises. 0.8988
I receive payment on time. 0.8988
I believe the technical and market information provided by my buyer a.
Cronbach Alpha: 0.76
Satisfaction
The buyer offers me satisfactory prices for my chilies. 0.7058
Based on the price my buyer offers me, I will not change buyers. 0.6988
My buyer cares about my welfare (e.g. he will buy any volume I have). 0.6673
My buyer is quick to handle my complaints. 0.7218
Cronbach Alpha: 0.65 a Item deleted due to low factor loading

31
Table 3. Mean and standard deviations of each item of the relationship quality variables
Cluster 1 Cluster 2 Cluster 3 Cluster 4
n=84/14.02% n=69/11.52% n=272/45.41% n=174/29.05% F-Stat
Mean Std Mean Std Mean Std Mean Std
Commitment
I would not sell to other buyers because I like being associated with
my buyer. 2.45a 0.83 3.09
b 0.97 4.03
c 0.50 3.28
b 0.91 112.03*
Our relationship is something that we are very committed to. 2.79 a 0.81 3.72
b 0.71 4.08
c 0.38 3.88
b 0.47 131.79*
I care about the long-term success of the relationship with my buyer. 2.48 a 0.67 3.45
b 0.81 4.13
c 0.38 3.50
b 0.78 162.02*
Trust
My buyer always keeps his promises. 3.88 a 0.50 2.57
b 0.78 4.15
c 0.38 3.98
a 0.25 250.82*
I receive payment on time. 3.88 a 0.50 2.41
b 0.77 4.07
c 0.44 4.01
ac 0.28 252.08*
Satisfaction
The buyer offers me satisfactory prices for my chilies. 2.90 a 0.82 3.12
b 0.85 4.06
c 0.44 3.61
d 0.69 93.06*
Based on the price my buyer offers me, I will not change buyers. 2.09 a 0.43 2.88
b 0.93 3.96
c 0.48 2.87
b 0.92 197.22*
My buyer cares about my welfare (e.g. he will buy any volume I
have). 2.81 a 0.90 3.58
b 0.86 4.12
c 0.46 3.58
b 0.76 84.85*
My buyer is quick to handle my complaints. 2.71 a 0.78 2.93
b 0.81 3.96
c 0.43 3.29
d 0.84 102.35*
Note: * significance at the 5%. Superscript letters indicate the result of Tukey HSD test (α=0.05)
32
Table 4. Mean and standard deviations of each item of price satisfaction dimensions
Cluster 1 Cluster 2 Cluster 3 Cluster 4 F-Stat
n=84/14.02% n=69/11.52% n=272/45.41% n=174/29.05%
Mean Std Mean Std Mean Std Mean Std
Relative price
In comparison to other buyers, I am satisfied with the price
my buyer offers. 3.40a 0.85 3.22
a 0.91 4.02
b 0.56 3.70
c 0.76 33.13*
The prices I received from my buyer are similar to the prices
other farmers get. 3.57 a 0.81 3.39
a 0.93 3.84
b 0.64 3.52
a 0.82 10.26*
Price transparency
Price information from my buyer is understandable and
comprehensive. 3.45 ac
0.83 3.28 a 0.92 3.94
b 0.57 3.63
c 0.80 21.73*
The chili price information from my buyer is complete and
correct. 3.25 a 0.94 2.87
b 1.03 3.63
c 0.86 3.33
ac 0.89 15.15*
Price quality ratio
I receive a good price-quality ratio. 3.47 a 0.90 3.64
ac 0.79 3.98
b 0.42 3.83
bc 0.54 18.22*
I know that the price I received depend on the quality of my
chillies. 3.02 a 1.05 3.41
b 0.93 3.61
b 0.91 3.30
ab 0.98 9.22*
Price fairness
The chili prices I receive are fair. 3.20 a 0.93 3.22
a 0.86 3.96
b 0.52 3.65
c 0.76 37.15*
Regarding to the price I receive, my buyer seems does not
take advantage on me. 3.55 a 0.72 3.61
a 0.75 3.99
b 0.44 3.71
a 0.61 18.68*
Price reliability
The buyer always communicates properly if the price changes. 3.18 a 1.03 3.43
b 0.98 4.06
c 0.56 3.75
d 0.69 36.77*
Note: * significance at the 5%. Superscript letters indicate the result of Tukey HSD test (α=0.05)
33
Table 5. Mean and standard deviations of respondent characteristics
Cluster 1 Cluster 2 Cluster 3 Cluster 4 F-Stat
Characteristics Description N=84/14.02% n=69/11.52% n=272/45.41% n=174/29.05%
Mean Std Mean Std Mean Std Mean Std
Household (HH)
Age of respondent Years 46.55 10.67 43.04 10.06 45.69 11.43 46.69 10.86 1.96
Member of HH Number of persons living in HH 4.50 1.43 4.54 1.51 4.60 1.55 4.39 1.69 0.67
Education of respondent Years of education 7.03 3.43 6.93 2.82 6.59 2.86 6.76 3.14 0.59
Literacy 1=yes, can read local or national language, 0=no 1.01 0.11 1.07 0.26 1.04 0.20 1.03 0.18 1.29
Productive labor HH members between 15 and 65 years 3.02 1.13 3.04 1.22 3.01 1.17 2.98 1.24 0.06
Unproductive labor I HH members below 15 years 1.39 1.04 1.45 1.12 1.47 1.13 1.29 1.02 1.01
Unproductive labor II HH members above 65 years 0.08 0.28 0.04 0.21 0.12 0.37 0.12 0.38 1.16
Mobile phone
Number of mobile phone own by household
(unit) 1.13 1.00 1.17 1.18 1.33 1.21 1.24 1.06 0.83
Motor bike Number of motor bike own by household (unit) 0.64 0.74 0.58 0.67 0.62 0.70 0.73 0.76 1.07
Chilli production
Net chilli income Net chilli income in one last year (million IDR) 4.35 a 6.74
5.67
ab 7.83 9.11
b 19.60 7.37
ab 12.00 2.56**
Chilli area Total area planted with chillies during last one year
in hectare 0.30 0.28 0.32 0.37 0.46 0.58 0.34 0.53 1.61
Dry season I Area planted with chillies around April 2009 in hectare 0.09 0.19 0.09 0.13 0.17 0.30 0.10 0.19 1.88
Dry season II
Area planted with chillies around July 2009 in
hectare 0.05 0.10 0.09 0.32 0.09 0.20 0.05 0.17 1.72 Rainy season Area planted with chillies around Sept 2008/2009 in
hectare 0.16 0.25 0.13 0.21 0.17 0.30 0.17 0.47 0.23
Experience Years producing chilli 10.57 a 7.79
9.07
ab 6.78 8.22
b 6.18 9.07
ab 6.98 3.35*
Distance
Distance from the house to the nearest sub-
district market (km) 6.15 a 6.28 9.06
b 8.37 5.23
c 3.82 5.75
ac 4.22 10.75*
Note: * significance at the 5%; ** significant at the 10%. Superscript letters indicate the result of Tukey HSD test (α=0.05)
34
Table 6. Percent of farmers doing chilli sorting and channel membership
Cluster 1 Cluster 2 Cluster 3 Cluster 4 Chi-
Characteristics Description
n=84/
14.02%
n=69/
11.52%
n=272/
45.41%
n=174/
29.05% square
Sort into different groups by size
Yes 6 15 20 9 14.64*
No 94 85 80 91
Sort into different groups
by color
Yes 12 35 28 13 24.27*
No 88 65 72 87
Channel
Supermarket 2 23 25 16 23.09*
Traditional 98 77 75 84
Note: * significance at the 5%

35
Appendix 1. Analysis of number of clusters based on Calisnski and Harabasz
procedure
Number of
clusters
Calinski/Harabasz
pseudo-F
2 270.05
3 259.68
4 319.04
5 278.91
6 259.26
7 309.35
8 292.80
9 291.72
10 306.97
11 286.02
12 277.52
13 284.18
14 289.61
15 279.58
Note: Distinct clustering is characterized by large Calinski and Harabasz (StataCorp,
2005)