Embed Size (px)
Citation preview
Australia Pacific LNG Project Volume 5: Attachments Attachment 31: Greenhouse Gas Assessment - LNG Facility
Volume 5: Attachments Attachment 31: Greenhouse Gas Assessment - LNG Facility
Australia Pacific LNG Project EIS March 2010 Page ii
Disclaimer
This report has been prepared on behalf of and for the exclusive use of Australia Pacific LNG Pty Limited, and is subject to and issued in accordance with the agreement between Australia Pacific LNG Pty Limited and WorleyParsons Services Pty Ltd. WorleyParsons Services Pty Ltd accepts no liability or responsibility whatsoever for it in respect of any use of or reliance upon this report by any third party.
Copying this report without the permission of Australia Pacific LNG Pty Limited or WorleyParsons is not permitted.
Volume 5: Attachments Attachment 31: Greenhouse Gas Assessment - LNG Facility
Australia Pacific LNG Project EIS March 2010 Page iii
Executive summary Transition of the world’s energy supplies from greenhouse gas (GHG) intensive to low carbon sources of energy is a key measure in minimising global GHG emissions and the impacts of climate change (IPCC 2007). The importance of fuel switching from coal-fired combustion to natural gas as an important GHG mitigation measure has been highlighted for some time by the Intergovernmental Panel on Climate Change (IPCC) (IPCC 2001). Natural gas therefore has an important role as a transition fuel as it has a significantly lower GHG intensity than other fossil fuels such as black coal (Pace Global Energy Service 2009).
Within this global context Australia Pacific LNG Pty Limited (Australia Pacific LNG) proposes to develop a world-scale project that utilises Australia Pacific LNG’s substantial coal seam gas resources in Queensland to assist in the transition of energy sources. The coal seam gas reserves are located in the Surat and Bowen Basins with the main development planned for the Walloons Gas Fields Development Area.
This study is focused on GHG emissions from the Project’s Liquefied Natural Gas (LNG) facility including the associated marine facilities, and addresses the construction, operations and decommissioning phases of the project. Impacts relating to the GHG emissions from the gas fields and the gas pipeline are covered in Volume 5 Attachment 32 of this EIS. The LNG facility will (under a full development scenario) include notionally four LNG trains with an installed capacity of approximately 18 million tonnes LNG per annum (Mtpa), an associated wharf, a Materials Offloading Facility (MOF), construction accommodation facilities and a small support facility on the mainland. This infrastructure will be located near Laird Point within the Curtis Island Industry Precinct of the Gladstone State Development Area.
Scope 1 GHG emissions are produced directly from combustion, venting and fugitive sources that are within the Project’s boundary. Scope 2 GHG emissions arise from the generation of purchased electricity, heat and steam. This energy is generated outside of the Project boundary and is transmitted to the Project site. Scope 3 GHG emissions arise from other sources beyond the boundary of the Project.
The Project’s LNG facility is estimated to generate approximately 5.5 million tonnes CO2-e/yr of direct (scope 1) emissions when it operates at full capacity with all four trains. The GHG emissions arise primarily from the combustion of coal seam gas. Analysis of the main production and processing activities shows that the direct GHG emissions arise from gas turbines driving the refrigeration/compressor turbines (approximately 65%), power generation turbines (approximately17%) and the acid gas CO2 vent (approximately 11% based on 1% CO2 in the feed gas).
The GHG emissions intensity of the LNG plant is approximately 0.31 tonne CO2-e/tonne LNG produced which makes this facility one of the most greenhouse efficient LNG plants globally. The GHG emissions intensity overall (i.e. “coal seam gas reservoir to ship”) for the Australia LNG Project is approximately 0.63 tonnes CO2-e/tonne LNG.
Use of purchased grid electricity will be negligible for the Project, and hence the GHG emissions associated with purchased electricity (scope 2 emissions) will be insignificant. This is because the LNG facility and main marine infrastructure are located on Curtis Island and during construction and operations and ultimately decommissioning, the facility will have its own power supply (addressed as scope 1 emissions in this study). The mainland facilities will require grid power but their consumption of electricity, hence scope 2 GHG emissions, is relatively insignificant.
Volume 5: Attachments Attachment 31: Greenhouse Gas Assessment - LNG Facility
Australia Pacific LNG Project EIS March 2010 Page iv
Emissions also arise indirectly from Australia Pacific LNG’s activities including third party LNG product shipping, LNG consumption by customers and transport of material and equipment and employees. These indirect emissions are classified as scope 3 GHG emissions in this study.
Measures to mitigate GHG emissions that have been implemented in the Project include:
� Use of the ConocoPhillips’ proprietary Optimized Cascade® technology.
� High efficiency aero-derivative turbines to drive the process compressors.
� Waste heat recovery for process heat duties.
� Installation of boil-off gas compression facilities to recover vapours generated from the LNG tanks during production and from the export vessels during LNG loading.
The above-mentioned measures will result in a reduction in GHG emissions of approximately 1.55 million tonnes CO2-e/yr for the operation of four-trains, or approximately 21% of scope 1 GHG emissions compared with the reference case.
A lifecycle GHG analysis was also performed that compares the GHG emissions associated with the combustion of LNG against that for coal and other fuels. This analysis considers the case where LNG used for natural gas-fired electricity generation substitutes for coal-fired electricity generation using the 18 Mtpa of LNG exported during peak production. The analysis clearly demonstrates the GHG emissions that could be avoided by substituting GHG intensive fuels such as coal with natural gas derived from LNG. The avoided emissions from substituting coal-fired power generation technologies with natural gas-fired Combined cycle gas turbine (CCGT) technology is equivalent to reducing Australia’s 2007 GHG emissions by between 5.9% and 13.4%, which compensates the GHG emissions across the LNG production chain. On a global scale, GHG emissions could be reduced by between 0.12% and 0.28%
Volume 5: Attachments Attachment 31: Greenhouse Gas Assessment - LNG Facility
Australia Pacific LNG Project EIS March 2010 Page v
Contents
1. Introduction ............................................................................................................................... 1
1.1 The Project................................................................................................................................ 1
1.2 Greenhouse gas emissions ...................................................................................................... 2
1.3 Purpose..................................................................................................................................... 3
1.4 Scope of assessment................................................................................................................ 4
1.5 The role of LNG in mitigating climate change........................................................................... 4
1.6 Legislative and policy framework .............................................................................................. 5
1.6.1 International policy ....................................................................................................... 5
1.6.2 Australian policy ........................................................................................................... 6
1.6.3 Energy Efficiency Opportunities Act 2006.................................................................... 6
1.6.4 National Greenhouse and Energy Reporting Act 2007................................................ 6
1.6.5 Queensland policy and initiatives................................................................................. 7
1.6.6 Australia Pacific LNG Policy and position on climate change...................................... 7
2. Methodology.............................................................................................................................. 9
2.1 GHG accounting and reporting principles ................................................................................. 9
2.2 GHG sources for the LNG facility.............................................................................................. 9
2.2.1 GHG emissions from construction and decommissioning ......................................... 10
2.2.2 Operations.................................................................................................................. 12
2.3 GHG emissions estimation methodology................................................................................ 14
3. Existing environment............................................................................................................... 17
4. Potential impacts..................................................................................................................... 18
4.1 Modelling results ..................................................................................................................... 18
4.2 Explanation of results.............................................................................................................. 23
5. Mitigation measures ................................................................................................................ 25
5.1 Further GHG mitigation measures .......................................................................................... 27
5.2 Comparison with International Industry Practice .................................................................... 29
6. Comparison of lifecycle GHG emissions for LNG, coal and other fuels ................................. 31
7. Project’s potential impact on the existing environment........................................................... 34
8. Cumulative impacts................................................................................................................. 35
9. Conclusions............................................................................................................................. 38
Volume 5: Attachments Attachment 31: Greenhouse Gas Assessment - LNG Facility
Australia Pacific LNG Project EIS March 2010 Page vi
Figures
Figure 1.1 Overview of the Project GHG footprint.................................................................................. 3
Figure 4.1 Scope 1 GHG emissions for the Australia Pacific LNG facility ........................................... 18
Figure 4.2 Total projected scope 1 GHG emissions for the LNG facility operations across the Project’s lifetime ................................................................................................................................................... 23
Figure 5.1 GHG emissions reductions associated with the mitigation measures ................................ 26
Figure 5.2 GHG intensities of various Australian and international LNG plants .................................. 30
Tables
Table 2.1 Default GHG emission factors for major emissions sources................................................ 15
Table 2.2 Default GHG emission factors used to estimate scope 3 emissions ................................... 15
Table 2.3 GHG factors for embedded energy related emissions......................................................... 16
Table 3.1 Summary of global, Australian and Queensland GHG emissions inventories in 2007 ........ 17
Table 4.1 Estimated annual scope 1 GHG emissions for the Australia Pacific LNG facility during operations.............................................................................................................................................. 19
Table 4.2 Scope 1 GHG emissions from construction, operations and decommissioning of the LNG facility over the project lifetime .............................................................................................................. 20
Table 4.3 Scope 3 GHG emissions during construction of the temporary accommodation facility ..... 21
Table 4.4 Scope 3 GHG emissions during construction of the LNG facility (for 4 trains) .................... 21
Table 4.5 Scope 3 transport GHG emissions for operation of the LNG facility (for 4 trains) ............... 22
Table 4.6 Embedded energy related GHG emissions for the major Project materials for four LNG trains ...................................................................................................................................................... 22
Table 4.7 Scope 3 GHG emissions for construction and transport over the project lifetime ............... 22
Table 5.1 GHG mitigation actions quantified on a 4-train per annum basis......................................... 26
Table 6.1 Breakdown of the Project’s GHG footprint in 2023 .............................................................. 31
Table 6.2 Comparison of GHG emission intensities between LNG, coal and other fuels.................... 32
Table 6.3 Comparison of LNG and coal GHG emission intensities for power generation ................... 32
Table 7.1 The maximum impact of Project scope 1 GHG annual emissions in 2023.......................... 34
Table 8.1 Summary of GHG emissions for major projects in the Gl adstone region ........................ 36
Appendices
Appendix A Abbreviations and glossary of terms
Volume 5: Attachments Attachment 31: Greenhouse Gas Assessment - LNG Facility
Australia Pacific LNG Project EIS March 2010 Page 1
1. Introduction
The Intergovernmental Panel on Climate Change (IPCC) has reported that the effects of climate change are global, widespread and largely detrimental to society and the environment (IPCC 2007). These effects are reported to include increases in the frequency and intensity of extreme weather events resulting in greater flooding and droughts, sea level rise, storm surges, disruptions to food and water supplies, and the extinction of many species. Climate change is thus an urgent global problem to address.
Energy production and use accounts for approximately 65% of the world’s GHG emissions (IEA 2009). Efforts to tackle climate change must necessarily involve changes in the global energy sector. In addition, low cost and secure energy supplies are becoming scarcer and this presents risks to domestic and world economies and security.
Australia Pacific LNG Pty Limited (Australia Pacific LNG) proposes to develop a world-scale project that utilises Australia Pacific LNG’s substantial coal seam gas (CSG) resources in Queensland. The coal seam gas reserves are located in the Surat and Bowen Basins with the main development planned for the Walloons Gas Fields Development area.
Like most energy producing ventures, during construction and operation and ultimately decommissioning, the Project will use considerable amounts of energy and produce GHG emissions. While there are some economic drivers for energy efficiency and GHG reduction, there is also an imperative to reduce Project-related GHG emissions in order to contribute to global efforts to address climate change.
1.1 The Project
Australia Pacific LNG Pty Ltd is owned equally by Origin Energy (Origin) and ConocoPhillips Australasia (ConocoPhillips). Under this agreement, CSG will be extracted from the Walloons Gas Fields Development Area and delivered via gas pipeline to the proposed liquefied natural gas (LNG) facility near Laird Point on Curtis Island, Gladstone.
The Australia Pacific LNG Project consists of the gas fields, the gas pipeline and the LNG facility. The gas fields cover an area of approximately 570,000 hectares (ha) in the Queensland Western Downs region. The Project’s development plan will potentially include in the order of 10,000 wells over a 30-year project lifespan. Gas and water gathering systems will be developed to send the gas and water extracted from the wells to gas processing facilities and water treatment facilities respectively. Associated infrastructure will include roads and access tracks, storage ponds, temporary accommodation facilities, communication infrastructure and other logistics support areas.
A 450km underground high pressure gas pipeline will connect the Walloons gas fields with the LNG facility on Curtis Island near Gladstone. The pipeline (currently expected to be approximately 1.1 metres diameter) will be co-located with other high pressure gas transmission pipelines, where practicable, including the Callide and Gladstone State Development Area Common-user Infrastructure Corridors being developed by the Queensland Government.
The LNG facility is expected (under a full development scenario) to include four LNG trains with an installed facility capacity of approximately 18 million tonnes per annum (Mtpa) and an associated wharf and Materials Offloading Facility (MOF) to be located near Laird Point within the Curtis Island Industry Precinct of the Gladstone State Development Area. GHG emissions from the consumption of grid electricity for the supply base and ferry terminal located on the mainland are expected to be
Volume 5: Attachments Attachment 31: Greenhouse Gas Assessment - LNG Facility
Australia Pacific LNG Project EIS March 2010 Page 2
negligible and are not included in this assessment. The LNG facility will utilise ConocoPhillips’ proprietary Optimized Cascade® technology to process the coal seam gas.
1.2 Greenhouse gas emissions
This technical report focuses on the projected GHG emissions generated during the construction of the LNG facility and from the processing of coal seam gas to LNG, through to decommissioning. The reporting boundary is defined as those activities under the operational control of Australia Pacific LNG.
This EIS is seeking approval for the development of the Project gas fields, which will supply an estimated 633 petajoules per year (PJpa) of CSG. An analysis of the scope 1 (direct) and relevant scope 3 (indirect) GHG emissions for the Project gas fields and gas pipeline is presented in Attachment 32, Volume 5 and Chapter 14, Volumes 2 and 3 of this EIS.
The LNG facility is expected, at full-development, to produce approximately 18 Mtpa of LNG for export to customers. To fulfil the requirements of the LNG facility, CSG will also be sourced from other gas fields. Approval for these gas fields is not being sought in this EIS although their operations contribute to the overall GHG footprint of the Australia Pacific LNG Project. CSG sourced from these other gas fields will contribute an estimated 462 PJpa of CSG. The GHG emissions associated with CSG production and processing at other gas fields arise outside of the inventory reporting boundaries for the gas fields, gas pipeline and the LNG facility.
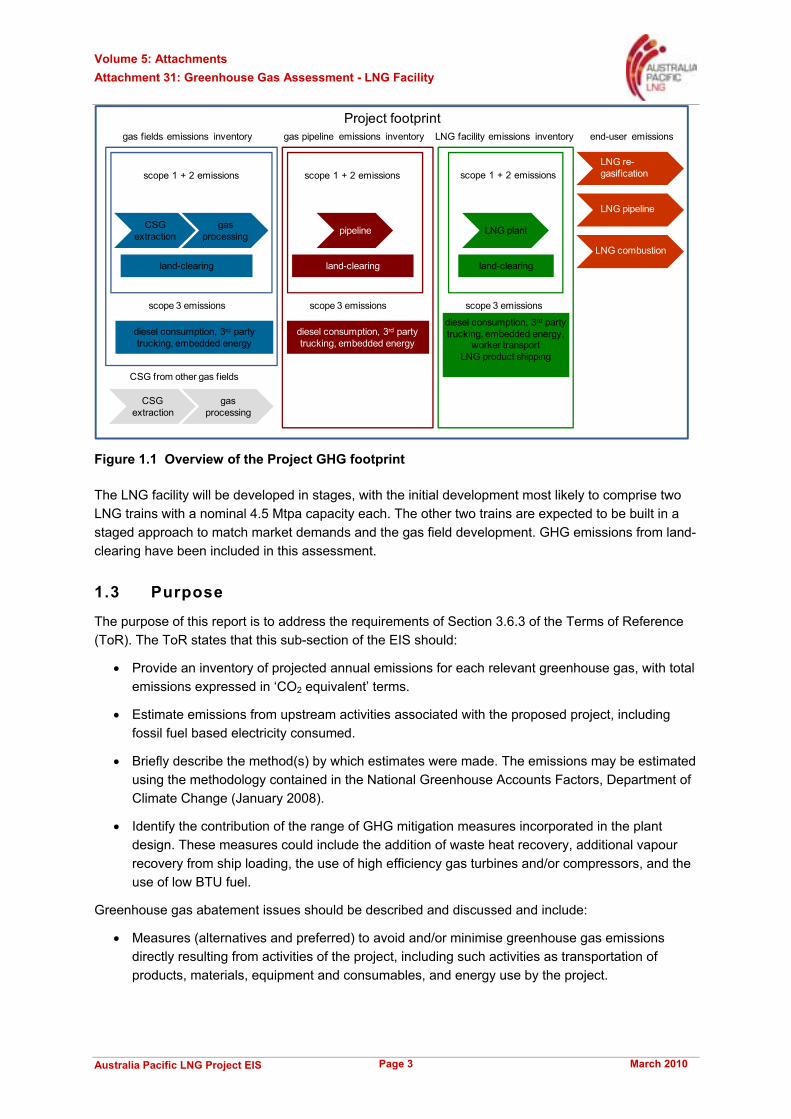
Figure 1.1 gives an overview of how the various GHG emissions inventories that will be developed in this EIS sit within the overall Project GHG footprint. For the Project, the following GHG emissions inventories are reported:
� A combined gas fields and gas pipeline GHG inventory (refer Volume 5, Attachment 32)
� An LNG facility GHG inventory (the subject of this study)
The GHG emissions from all relevant sources (and scopes) will be assessed for each inventory, and the impact of these GHG emissions is determined.
In order to compare LNG to other fuels, the overall GHG footprint associated with converting CSG to LNG is used. To determine this footprint, sources of GHG emissions that are beyond Australia Pacific LNG’s control but nonetheless contribute to the overall footprint are considered. In Figure 1.1 these sources include GHG emissions from other gas fields that supply CSG to the Project, and GHG emissions associated with combusting natural gas by the final consumer. LNG shipping is assessed briefly in this study as a scope 3 GHG emission source for the LNG facility. These sources of GHGs are not assessed in detail in this EIS but they are included in relation to a lifecycle GHG emissions analysis for CSG to LNG, presented in section 6.
Volume 5: Attachments Attachment 31: Greenhouse Gas Assessment - LNG Facility
Australia Pacific LNG Project EIS March 2010 Page 3
scope 1 + 2 emissions
CSG extraction
gas processing pipeline
land-clearing
LNG plant
scope 3 emissions
diesel consumption, 3rd party trucking, embedded energy
CSG extraction
gas processing
CSG from other gas fields
LNG re-gasification
LNG pipeline
LNG combustion
Project footprint
scope 3 emissions
diesel consumption, 3rd party trucking, embedded energy,
worker transportLNG product shipping
scope 1 + 2 emissionsscope 1 + 2 emissions
land-clearing
scope 3 emissions
diesel consumption, 3rd party trucking, embedded energy
land-clearing
gas fields emissions inventory gas pipeline emissions inventory LNG facility emissions inventory end-user emissions
Figure 1.1 Overview of the Project GHG footprint
The LNG facility will be developed in stages, with the initial development most likely to comprise two LNG trains with a nominal 4.5 Mtpa capacity each. The other two trains are expected to be built in a staged approach to match market demands and the gas field development. GHG emissions from land-clearing have been included in this assessment.
1.3 Purpose
The purpose of this report is to address the requirements of Section 3.6.3 of the Terms of Reference (ToR). The ToR states that this sub-section of the EIS should:
� Provide an inventory of projected annual emissions for each relevant greenhouse gas, with total emissions expressed in ‘CO2 equivalent’ terms.
� Estimate emissions from upstream activities associated with the proposed project, including fossil fuel based electricity consumed.
� Briefly describe the method(s) by which estimates were made. The emissions may be estimated using the methodology contained in the National Greenhouse Accounts Factors, Department of Climate Change (January 2008).
� Identify the contribution of the range of GHG mitigation measures incorporated in the plant design. These measures could include the addition of waste heat recovery, additional vapour recovery from ship loading, the use of high efficiency gas turbines and/or compressors, and the use of low BTU fuel.
Greenhouse gas abatement issues should be described and discussed and include:
� Measures (alternatives and preferred) to avoid and/or minimise greenhouse gas emissions directly resulting from activities of the project, including such activities as transportation of products, materials, equipment and consumables, and energy use by the project.
Volume 5: Attachments Attachment 31: Greenhouse Gas Assessment - LNG Facility
Australia Pacific LNG Project EIS March 2010 Page 4
� An assessment of how the preferred measures minimise emissions and achieve energy efficiency.
� A comparison between preferred measures for emission controls and energy consumption with best practice environmental management in the relevant sector of industry.
� A description of any opportunities for further offsetting greenhouse gas emissions through indirect means.
The methods used to determine the emissions for each relevant GHG source are described in Section 2. The state of the existing environment in terms of Queensland, Australian and global GHG inventories is reported in Section 3. An inventory of the projected annual GHG emissions in tonnes CO2-equivalent for the LNG facility is given in Section 4. These GHG emissions are associated with construction, operation and subsequent decommissioning of the LNG facility and associated marine infrastructure. Section 5 describes and quantifies the measures used to reduce the GHG emissions that have been incorporated into the design of the project. Further GHG reduction measures that could be implemented in the future are also discussed along with a comparison of the performance of the proposed LNG facility in relation to other “comparable” LNG projects. Section 6 provides a brief lifecycle GHG analysis of the GHG emissions associated with coal and LNG combustion for power generation. Section 7 considers the impact of the LNG facility in terms of its GHG emissions on Queensland state, national and global GHG emissions inventories. Section 8 present a cumulative impact assessment of the Project and Section 9 provides the key conclusions.
The primary emissions of GHGs from the proposed development are carbon dioxide, methane and nitrous oxide, while no emissions of other GHGs are expected to occur in any appreciable amount.
1.4 Scope of assessment
The scope of work covers the following:
� Scope 1 (direct) GHG emissions and relevant scope 3 (indirect) GHG emissions are projected to arise from the construction and operation of the LNG facility and associated marine infrastructure, and final decommissioning.
� Scope 2 GHG emissions arising from purchased grid electricity are excluded as the Project’s LNG facility located on Curtis Island will be powered by a stand-alone generation set, therefore, the associated GHG emissions are classified as scope 1. Scope 2 GHG emissions associated with the marine infrastructure (e.g. supply base and ferry terminal) located on the mainland are expected to be negligible.
� Identification and quantification of all activities that consume energy and produce GHGs.
� Assessment of the GHG emissions that would arise from land clearing for the LNG facility.
� Assessment of GHG mitigation measures that have been included at the design phase of the Project.
� Discussion of GHG mitigation opportunities that may be suitable for future implementation.
1.5 The role of LNG in mitigating climate change
The United Nations Framework Convention on Climate Change (UNFCCC) defines climate change as:
Volume 5: Attachments Attachment 31: Greenhouse Gas Assessment - LNG Facility
Australia Pacific LNG Project EIS March 2010 Page 5
a change of climate which is attributed directly or indirectly to human activity that alters the composition of the global atmosphere and which is in addition to natural climate variability observed over comparable time periods.
Emissions of greenhouse gases like carbon dioxide, methane and nitrous oxide have been strongly linked to changes in climate. In 2007, global greenhouse gas emissions were of the order of 29,000 million tonnes CO2-e (UNFCCC 2005 and 2009). Australia’s contribution is approximately 2% of global GHG emissions. The Australian federal government has developed a ‘three pillar approach’ to climate change policy:
1. Reduce Australia’s GHG emissions;
2. Adapt to the impacts of unavoidable climate change; and
3. Help shape and facilitate a global solution.
The Australia Pacific LNG Project complements the Australian federal government’s proposal to address climate change mitigation by supplying LNG, a low carbon transition fuel, into the global energy market. LNG provides a less greenhouse gas intensive alternative to traditional coal-fired electricity generation in the medium term, and is expected to be an invaluable companion to renewable energy sources in the future.
The IPCC has for a long time highlighted the importance of fuel switching from GHG intensive coal-fired combustion to natural gas as an important GHG mitigation measure (IPCC 2001).
1.6 Legislative and policy framework
GHG emissions are covered by a number of legislative and policy requirements at both a State and Commonwealth level, as well as international protocols to which Australia is signatory. These include:
� United Nations Framework Convention on Climate Change
� The Kyoto Protocol
� Queensland Greenhouse Strategy
� Energy Efficiency Opportunities Act 2006
� National Greenhouse and Energy Reporting Act 2007
1.6.1 International policy
The Kyoto Protocol to the United Nations Framework Convention on Climate Change was signed in 1997 and ratified by Australia in December 2007. One of the aims of the Kyoto Protocol is to achieve the ‘stabilisation of greenhouse gas concentrations in the atmosphere at a level that would prevent dangerous anthropogenic interference with the climate system’.
The Kyoto Protocol sets reduction targets on GHG emissions produced by Annex 1 countries, including Australia. Under the Kyoto Protocol, Australia has committed to reducing its GHG emissions to a level equivalent to 108% of 1990 levels by 2008–2012. For GHG emission reduction targets for the period beyond 2012, international negotiations remain in progress post the Copenhagen conference of parties.
Volume 5: Attachments Attachment 31: Greenhouse Gas Assessment - LNG Facility
Australia Pacific LNG Project EIS March 2010 Page 6
1.6.2 Australian policy
The Australian Government’s proposed Carbon Pollution Reduction Scheme (CPRS) is an emissions trading scheme in which GHG emissions would be capped, permits would be allocated up to the cap, and emissions permits would be traded. Liable entities would be required to obtain carbon pollution permits to acquit their GHG emissions liabilities. The CPRS is the Australian Government’s central policy instrument for reducing the GHG emissions Australia produces. He Australian government intends that the CPRS commences on 1 July 2011 however this is dependent on the passage of a number of Bills (Australian Government 2009a) through the Senate.
The CPRS intends to encourage industry to reduce GHG emissions. The scheme will include a long-term GHG reduction target of 60% of 2000 levels by 2050 (Australian Government 2008a). If the CPRS Bills are passed, the legislation may be different to what is proposed in the current CPRS Bills.
The Australian Government has set the following medium-term 2020 GHG emission reduction target:
� An unconditional target of a 5% reduction below 2000 levels by 2020
� A conditional target of up to 15% reduction below 2000 levels by 2020 in the context of a global agreement under which all major developing economies commit to substantially restrain emissions and advanced economies take on reductions comparable to Australia; or
� A conditional target of 25% reduction below 2000 levels by 2020 “if Australia is a party to a comprehensive agreement which is capable of stabilising atmospheric concentrations of GHG at around 450 parts per million of CO2-e or lower” (Australian Government 2009a).
The proposed CPRS includes measures designed to reduce the immediate impact of the price of carbon on emission-intensive trade-exposed (EITE) industries. LNG production has been identified as an EITE industry; consequently, the assistance is directly relevant to this Project. The initial assistance depends on the GHG emissions intensity per million dollars of revenue. The GHG emissions intensity of the LNG industry is between 1000-2000 t CO2-e/$m revenue [CO2 equivalent emissions per million dollars of revenue] (Petroleum Exporters Society of Australia 2009), suggesting assistance would cover 66% of GHG emissions.
1.6.3 Energy Efficiency Opportunities Act 2006
The Energy Efficiency Opportunities legislation (Australian Government 2006) was introduced by the Department of Resources, Energy and Tourism (DRET). It requires significant energy users, consuming over 0.5PJpa of energy, to take part in a transparent process of energy efficiency assessment and reporting.
The program’s requirements are set out in the legislation, which came into effect on 1 July 2006. Participants in the program are required to assess their energy use and report publicly on cost effective opportunities to improve energy efficiency. In particular, corporations must report publicly on opportunities with a financial payback period of less than four years. Australia Pacific LNG joint venture partners Origin Energy and ConocoPhillips have been reporting under the Energy Efficiencies Opportunities scheme since 2006 and 2007 respectively, so both partners in Australia Pacific LNG are familiar with the Scheme's requirements.
1.6.4 National Greenhouse and Energy Reporting Act 2007
The National Greenhouse and Energy Reporting Act (Australian Government 2008b) establishes a national framework for Australian corporations to report GHG emissions, and energy consumed and
Volume 5: Attachments Attachment 31: Greenhouse Gas Assessment - LNG Facility
Australia Pacific LNG Project EIS March 2010 Page 7
produced from 1 July 2008. The Act and supporting systems have been designed to provide a robust database for the proposed Carbon Pollution Reduction Scheme.
From 1 July 2008, corporations are required to report if they:
� Control facilities that emit 25 kilotonnes or more of GHG CO2-e, or produce or consume 100 terajoules or more of energy, or
� Their corporate group emits 125 kilotonnes CO2-e, or produces or consumes 500 terajoules or more of energy.
Lower thresholds for corporate groups will be phased in by 2010-11. The final thresholds will be 50 kilotonnes CO2-e or 200 terajoules of energy produced or consumed for a corporate group. Companies must register by 31 August and report by 31 October following the financial year in which they meet a threshold. A report must be submitted every year once registered even in those years where the threshold is not triggered. Origin and ConocoPhillips have both recently made their first reports under the National Greenhouse and Energy Reporting Act 2007, and so both partners in Australia Pacific LNG are familiar with the Act's requirements.
1.6.5 Queensland policy and initiatives
The Queensland Government’s ClimateSmart 2050 strategy (2007) outlines key long-term climate change targets. The Queensland Government has agreed to the national target of achieving a 60% reduction in national GHG emissions by 2050, compared with 2000 levels. This will involve cuts in GHG emissions of more than 30 Mt CO2-e over 10 years and save the Queensland economy about $80 million each year.
To help achieve this target, the Queensland government has developed the Queensland Gas Scheme, where Queensland electricity retailers and large users of electricity are required to source at least 13% of their electricity from gas-fired generators.
The Gas Scheme is aimed at reducing Queensland’s emission intensity from 0.917 t CO2-e/MWh (2000-2001 levels) to 0.794 t CO2-e/MWh by 2011-2012. The 13% target under this scheme has been increased to 15% by 2010 with the provision to increase it to 18% by 2020.
In 2008, the Queensland Government commenced a review of Queensland’s climate change strategies in response to national and international developments in climate change science and policy. In August 2009, the Queensland Government released ClimateQ: toward a greener Queensland (Queensland Government 2009).
This strategy consolidates and updates the policy approach outlined in ClimateSmart 2050 and Queensland's ClimateSmart Adaptation Plan 2007-12. The revised strategy presents investments and policies to ensure Queensland remains at the forefront of the national climate change response.
1.6.6 Australia Pacific LNG Policy and position on climate change
Australia Pacific LNG recognises that climate change poses significant risks and opportunities to its business. Australia Pacific LNG will be pro-active in building a business that will be well-positioned in a low-carbon economy. Origin’s and ConocoPhillips’ established corporate strategies on climate change will underpin Australia Pacific LNG’s response to the challenges of climate change.
Origin has long recognised the need to address the global issues of climate change, and has built a business that is well-positioned in a more carbon-constrained regulatory, social and investment environment. Origin has a strong portfolio of natural gas reserves in Australia and New Zealand and
Volume 5: Attachments Attachment 31: Greenhouse Gas Assessment - LNG Facility
Australia Pacific LNG Project EIS March 2010 Page 8
invests in renewable energy sources including wind, solar and geothermal. Origin has developed a series of retail offerings, such as GreenPower, to encourage customer participation in GHG reductions.
Origin has engaged strongly in the development of government policy in relation to mitigating GHG emissions and reducing the impacts of climate change. This includes contributions to the Garnaut Review (Garnaut 2008), the Carbon Pollution Reduction Scheme and other government processes, and participation in the media and public debate. Origin has also taken significant measures to understand and reduce its carbon footprint.
ConocoPhillips fully supports mandatory national frameworks to address GHG emissions. It has joined the U.S. Climate Action Partnership, a business-environmental leadership group dedicated to the quick enactment of strong legislation to require significant reductions of GHG emissions.
With operations around the globe, ConocoPhillips seeks to encourage external policy measures at the international level that deliver the following principles:
� Slow, stop and ultimately reverse the rate of growth in global GHG emissions
� Establish a value for carbon emissions, which is transparent and relatively stable and sufficient to drive the changed behaviours necessary to achieve targeted emissions reductions
� Develop and deploy innovative technology to help avoid or mitigate GHG emissions at all stages of the product’s life
� Ensure energy efficiency is implemented at all stages of the product’s life
� Recognise consumer preference for reduced GHG-intensive consumption, and work towards meeting these expectations
� Deploy carbon capture and storage as a practical near-term solution if technically and economically feasible
� Develop processes that are less energy and material intensive
� Build price of carbon into base-case business evaluations
� Ensure energy and materials efficiency is part of the project development/value improvement processes.
The Project will use the commitment and technical strengths of both of its co-venturers to develop and implement a GHG management plan that includes GHG mitigation measures, monitoring, reporting, and assessment of business-specific actions.
Volume 5: Attachments Attachment 31: Greenhouse Gas Assessment - LNG Facility
Australia Pacific LNG Project EIS March 2010 Page 9
2. Methodology
The GHG inventory for the Project’s LNG facility is based on the accounting and reporting principles of the Greenhouse Gas Protocol (the Protocol) (World Business Council for Sustainable Development and the World Resource Institute 2004) and various GHG estimation methodologies. The Protocol is an internationally accepted accounting and reporting standard for corporate GHG emissions. The methodology in the Greenhouse Gas Protocol is consistent with the methodology in the National Greenhouse Accounts Factors (Australian Government 2009b).
2.1 GHG accounting and reporting principles
The forecast GHG inventory developed in this study was based on the principles outlined in the Greenhouse Gas Protocol (the Protocol) (World Business Council for Sustainable Development and the World Resource Institute 2004). The guiding principles of the Protocol for compiling an inventory of GHG data are:
� Relevance
� Completeness
� Consistency
� Transparency
� Accuracy
The Protocol separates GHG-producing activities according to the related scope.
� Scope 1 GHG emissions are produced directly from combustion, fugitive and vented sources that are within the Project’s boundary (that is, the LNG facility).
� Scope 2 GHG emissions arise from the generation of purchased electricity, heat and steam. These emissions are generated outside of the Project boundary. The assumption for this study is that no grid electricity will be purchased for activities on Curtis Island and that all electricity requirements for on-site operations can be generated by gas turbines that use coal seam gas or by diesel generators. Although there will be a small support facility on the mainland, its power consumption and associated scope 2 GHG emissions will be relatively very small.
� Scope 3 GHG emissions are related to the activities of the reporting entity but arising from sources beyond the boundary of the LNG facility – for example transport of materials and equipment onto the LNG facility site. Scope 3 GHG emissions are also associated with the extraction, production and transportation of purchased fuels consumed for LNG production activities. Transport of the LNG product to international markets is assessed as a scope 3 GHG emission for the LNG facility.
2.2 GHG sources for the LNG facility
The GHG emissions for the proposed LNG facility have been estimated for an assumed operational lifetime of 30 years. Listed in this section are the likely sources of construction, operations and subsequent decommissioning emissions for the LNG facility.
Volume 5: Attachments Attachment 31: Greenhouse Gas Assessment - LNG Facility
Australia Pacific LNG Project EIS March 2010 Page 10
2.2.1 GHG emissions from construction and decommissioning
Construction activities are assumed to cover excavation, equipment hauling, and civil works such as land clearing, which are scope 1 GHG emissions for the Project. Relevant scope 3 GHG emissions arise from worker transport, shipment of materials and equipment to the project site, embedded energy in construction materials, waste sent to landfill.
Various types of construction equipment will be used from the inception of site works until startup and commissioning of the LNG facility. Construction will occur for a period of approximately four years and nine months for trains 1 and 2 in years 2011 to 2015. Construction of trains 3 and 4 is assumed to begin in 2017 and also last for four years and nine months. This will incur around 30% less GHG emissions because much of the common infrastructure will be in place when construction of trains 3 and 4 commence.
Decommissioning refers to site closure and removal of buildings and infrastructure. Decommissioning GHG emissions are scope 1 GHG emissions. However, due to uncertainties about the activities, these have not been estimated in detail. They are assumed to be the same as the construction phase GHG emissions as similar equipment and activities will be required.
Diesel and gasoline combustion for on-site transport and earth moving
Scope 1 GHG emissions will arise from the direct combustion of diesel by on-site transport associated with equipment hauling. A combination of diesel and petrol fuelled vehicles will be used for on-site personnel transport.
Diesel is expected to be consumed by excavation and earth moving machinery
Scope 3 GHG emissions are associated with diesel and gasoline combustion which result from extraction, production and transportation of these fuels to the Project site
Diesel combustion for power generation
The primary fuel used for stationary energy generation purposes will be diesel; generators are likely to operate intermittently during operations and full time during construction. This source is considered minimal when compared to other GHG sources.
Land clearing
The recent EIS for the GLNG project (GLNG 2009a) includes an assessment of GHGs from land-clearing in its GHG assessments. The GLNG EIS (GLNG 2009a) determined an emission factor for the GHGs associated with land-clearing on Curtis Island in the range 96 to159 tonnes CO2-e/hectare cleared and so for the purposes of this assessment a conservative figure of 200 tonnes CO2-e/hectare cleared is used. This GHG emission factor has been assumed for this study as the type of vegetation cleared for the Australia Pacific LNG facility is assumed (due to its proximity) to be the same as that for the GLNG LNG facility. To determine the GHGs from land-clearing, the land-clearance (in hectares) is multiplied by the assumed GHG emission factor. Land-clearance data is sourced from the Terrestrial Ecology study performed for this EIS (refer Chapter 8, Volume 4).
It should be noted that the LNG facility site will be rehabilitated at the end of the life of the project. To be conservative in this assessment no account has been taken for GHG offsets associated with such rehabilitation. However, site rehabilitation may generate GHG offsets for the GHG emissions associated with land clearing that will occur in the construction phase of the project.
Volume 5: Attachments Attachment 31: Greenhouse Gas Assessment - LNG Facility
Australia Pacific LNG Project EIS March 2010 Page 11
Fuel combustion for transport of materials and equipment
Scope 3 GHG emissions arise from third party trucking from off-site locations to the project site to the project site. It is expected that diesel will be the primary fuel combusted by truck transport. Fuel oil will be consumed by barge in transporting equipment and machinery from Auckland Point to Laird Point.
Transport of materials and equipment by truck over the construction phases have been studied in detail in the Traffic and Transport chapter for the LNG facility (refer Volume 4, Chapter 17). GHG emissions estimates are based on this data.
Fuel combustion for transport of workers
Scope 3 GHG emissions will arise from commuters using petrol vehicles to drive from the surrounding area to Auckland Point. Fuel oil will be consumed by ferry in transporting workers from Auckland Point to Laird Point.
Transport of workers by car and ferry over the construction phases have been studied in detail in the Traffic and Transport report for the LNG facility (refer Volume 4, Chapter 17). GHG emissions estimates are based on this data.
Temporary Accommodation Facil i ty
The construction of the temporary accommodation facility is forecast to take approximately 120 days to complete and will provide housing for 2100 workers. This will require transport of mobile homes, and ancillary buildings (expected to be trucked from Brisbane to Auckland Point). Transport of consumables such as potable and non-potable water, fuels (for power generation and transport) and waste from the construction site are considered, with consumables sourced in Gladstone. Construction workers will require ferry trips in and out of Laird Point to Auckland Point. Employees for this phase are assumed to travel to and from the site on a daily basis (7 days per week) travelling approximately 60 km per one way trip.
LNG facil i ty Construction
Based on the Traffic and Transport study performed for this EIS, about 50% of the personnel are estimated to commute by car from the Gladstone area to Auckland Point where ferry and barge will transport them to Laird Point. This is considered conservative for GHG emissions assessment purposes. Bus transport is another option but this has not been assessed in this study. The other 50% are assumed to travel to and from Gladstone to Brisbane by air (or possibly vehicle), with a ferry used between Curtis Island and the mainland. For details on transport of consumables and worker transport, refer to the Traffic and Transport study prepared for this EIS in Chapter 17, Volume 4.
Fuel combustion for shipping of materials and equipment
Scope 3 GHG emissions arise from the shipping of equipment and materials to the project site. Ships are expected to consume fuel oil.
Materials such as pipe lengths (imported from Asia), electrical items, insulation, fuels, concrete, and steel are considered as part of this study. Most of these materials and equipment will be trucked from Brisbane to Auckland Point, and then transported by barge to Laird Point. The steel pipe sections will be delivered direct by ship from Asia to the material offloading facility on Curtis Island. Structural steel may be shipped from China and other South East Asian countries.
Modular units for the LNG facility infrastructure will most likely be shipped from the Philippines and Thailand to the material offloading facility on Curtis Island. Materials used in the modular units will be
Volume 5: Attachments Attachment 31: Greenhouse Gas Assessment - LNG Facility
Australia Pacific LNG Project EIS March 2010 Page 12
shipped to the Philippines and Thailand for assembly, from ports that include the USA, Europe, the Far East, India and Turkey.
Embedded energy related emissions
To estimate the scope 3 GHG emissions associated with the embedded energy in construction materials, the tonnes of steel, concrete, insulation and copper cable were obtained for the construction of four trains. To determine the associated GHG emissions, the tonnes of materials were multiplied by the embedded emission factors (kg CO2-e/kg) from Hammond and Jones (2008). These factors do not include transport of the materials.
Waste disposal
Waste will be generated during the construction and decommissioning phases of the Project. Because the waste is being exported to an off-site landfill waste facility, the direct GHG emissions generated are the responsibility of the waste facility owner. However, these are scope 3 (indirect) GHG emissions generated during the construction of the LNG facility and are assessed here.
Waste from construction materials and site personnel are included in this assessment. It is expected that all non-local personnel, some subcontractor and supervision personnel remain on site within the temporary accommodation facility. Non-manual and local labour is expected to return to their residences after work.
The construction phase waste streams include general construction waste, food and domestic waste, paper, plastics, glass, and metals. Waste water is also generated, but this will be treated aerobically on-site and hence no biogas emissions are expected.
Waste from the decommissioning of the LNG facility will likely consist primarily of steel, concrete, copper wire and glass fibre insulation. When sent to landfill, these waste sources do not release GHGs in any appreciable amount and hence the GHG emission factors are zero (Australian Government 2009b). Therefore GHG emissions from decommissioning waste will be negligible and are not assessed any further.
2.2.2 Operations
Normal operations refer to the day-to-day running of the LNG facility to produce LNG product. These production processes will operate on a continual basis and include stationary GHG emission sources that combust, liquefy and refrigerate coal seam gas. Because these activities release coal seam gas or its combustion products, or impurities directly to the atmosphere, these activities are classified as scope 1 GHG emissions. The stationary GHG emissions sources identified for assessment include:
� Acid gas removal unit (AGRU) – each train has an AGRU which uses an amine to reduce the carbon dioxide concentration in the coal seam feed gas to a very low level, thus preventing blockages in the process due to frozen carbon dioxide. The carbon dioxide is absorbed into the amine and the amine solution is regenerated with the carbon dioxide sent to an acid gas vent. Carbon dioxide is subsequently discharged to the atmosphere.
� Gas turbines to drive compressors – a total of 24 high efficiency GE LM2500 - G4+ gas turbines are required for the operation of 4-trains (i.e. six for each train). These turbines are powered by CSG and are used to drive the ConocoPhillips Optimized Cascade® Process to refrigerate and liquefy the CSG. Because of the energy-intensive nature of the gas compression/refrigeration process, this is the largest source of GHG emissions for the LNG facility.
Volume 5: Attachments Attachment 31: Greenhouse Gas Assessment - LNG Facility
Australia Pacific LNG Project EIS March 2010 Page 13
� Gas turbines for power generation – the number of power generation turbines is dependent upon the optimisation of power requirements, site turbine rating, project phasing, reliability, emissions and capital/operating costs. While design optimisation is ongoing, the current base case (used for this GHG assessment) is that 12 (+ 1 spare) Solar Titan 130 power generator sets, rated at 15 megawatt (MW), are required for generating power for 4-train operations. These turbines are fuelled by CSG. Alternative designs including the increase of the number of turbines to 14 are currently being considered during the FEED phase of the Project.
� Hot oil heaters – these gas-fired heaters are used to support the heating requirements of a number of processes, although during normal operations the primary heat source is waste heat recovered from the process drive exhausts. These supplementary heaters are primarily for start-up purposes prior to employing recovered waste heat, but to achieve this function these heaters must be kept running at low rates and hot at all times.
� Nitrogen rejection unit (NRU) – each train has an NRU and GHG emissions arise from this source because the nitrogen in the feed gas is an impurity and when removed and vented, the nitrogen discharge contains a small concentration of methane that is released to the atmosphere.
� Fugitive gas emissions – these are unintended releases of methane from valves, flanges, seals and connectors associated with the processing of the CSG. Surveys undertaken by ConocoPhillips at its Darwin LNG facility have demonstrated that fugitive emissions from a modern LNG facility are very small.
Other GHG emitting activities may occur outside of the predicted normal parameters, but these are generally relatively short in duration. The intermittent sources of GHGs that will be assessed include the:
� Marine flare – this flare is located near the LNG ship loading area and handles surplus LNG vapours generated during the loading of LNG product onto the ship. This flare operates under upset conditions when the boil-off gas (BOG) compressors are not functional, or their capacity is exceeded. During ship loading, flaring is not normally expected as the BOG will be captured and either reliquefied or used as fuel gas. Occasionally a ‘hot’ ship may arrive from dry dock and is required to be cooled down prior to accepting LNG. This activity will likely result in flaring but is not a normal occurrence.
� Dry gas flare – this flare combusts liquid and vapour cryogenic hydrocarbons, releasing carbon dioxide and small quantities of methane.
� Wet gas flare – this flare combusts warm hydrocarbon streams thus releasing carbon dioxide and small quantities of methane.
� Diesel consumed for back-up power generation and other general support, emergency and back-up services.
It should be noted that negligible fugitive emissions are predicted to arise from the LNG storage tanks or from the ship-loading systems.
Transport of employees and consumables
Scope 3 GHG emissions arise from the transport of consumables such as refrigerant materials, diesel, chemicals and other miscellaneous materials that will be required throughout the project lifetime. Diesel fuelled trucks are expected to transport these goods to and from the project site.
Volume 5: Attachments Attachment 31: Greenhouse Gas Assessment - LNG Facility
Australia Pacific LNG Project EIS March 2010 Page 14
Scope 3 GHG emissions also arise from worker transport. It is expected that all workers will commute from the Gladstone area by private car to Auckland Point, where a ferry will transport them to Curtis Island. The assumption that each worker will commute by car is considered 'conservative' as buses may be used. If so, this would reduce the emissions on a per person basis. However, bus transport for workers has not been assessed. Traffic movements due to worker transport are covered in detail in the Traffic and Transport section in Volume 4, Chapter 17.
The general approach used to estimate the GHG emissions was to estimate the quantity of fuel consumed by each form of transport using the distances travelled and vehicle fuel efficiencies. From the quantity of fuel consumed, the emissions can be estimated using the emission factors in Table 2.2.
Transport of LNG Product
For LNG product shipping, it is assumed that the LNG is shipped to Japan and the distance travelled includes the return journey. The ship is assumed to have a capacity of 142,000 m3 (a small ship which is assumed to be conservative) and will use approximately 100 tonnes per day of the LNG boil-off gas from the LNG cargo as fuel. (Heede 2006). Some vessels may use bunker fuel, but for this EIS it is assumed that ships only use liquefied natural gas as fuel. Such an assumption is considered to be reasonable as use of bunker fuel would serve to slightly increase Scope 3 GHG emissions over those assessed here.
2.3 GHG emissions estimation methodology
GHG emissions factors for estimating the quantities of GHGs are usually expressed in terms of the quantity of a GHG per unit of energy consumed (kg CO2-e/GJ), or per unit of mass such as tonnes CO2-e/tonnes gas flared. The example of diesel combustion shows how the GHG emissions factors are applied. The volume of diesel combusted (in kilolitres or kL) is multiplied by the fuel’s energy content factor in GJ/kL to give the energy content of the diesel consumed. The energy content of the fuel is then converted to a GHG emission in carbon dioxide equivalents by multiplying it by the GHG emission factor (kg CO2-e/GJ). For GHG emissions from gas flaring, the tonnes of GHG emissions are estimated based on the tonnes of liquefied natural gas produced.
For the LM2500 + G4 gas turbines and Titan-130 turbines, data on the carbon dioxide and methane emissions were supplied by the vendor. Where vendor data was not available, default emission factors given in the US-EPA AP 42 tables (US-EPA 1998) and the American Petroleum Institute Compendium (API Compendium) (API 2004) were used as shown in Table 2.1. Data for fugitive methane emissions from gas processing equipment were estimated using methodologies in the API Compendium (API 2004).
Scope 1 emission factors for combustion of all liquid and gaseous fuels, and vented and flared coal seam gas were sourced from the AP 42 or the API Compendium. These are provided in Table 2.1. The API Compendium factors were preferred for flaring GHG emissions as emissions factors for all three GHGs (carbon dioxide, nitrous oxide and methane) are provided. The API Compendium (Table C10) also provides specific nitrous oxide (N2O) factors for the various diesel engines, which are not provided by the AP 42 emission factors.
In comparing AP 42 and NGA GHG emission factors for flare operations, the AP 42 factors are slightly higher for all three gases. For the hot oil heater, the carbon dioxide factor in AP 42 is 1% lower than the NGA factor and the methane and nitrous oxide emission factors are also lower in AP 42. For diesel combustion, the AP 42 emission factor for carbon dioxide is higher by 2.5% for large and small diesel-fired engines, the methane emission factor slightly lower than the NGA factor. The nitrous oxide emission factors were sourced from the API Compendium. This emission factor depends on the
Volume 5: Attachments Attachment 31: Greenhouse Gas Assessment - LNG Facility
Australia Pacific LNG Project EIS March 2010 Page 15
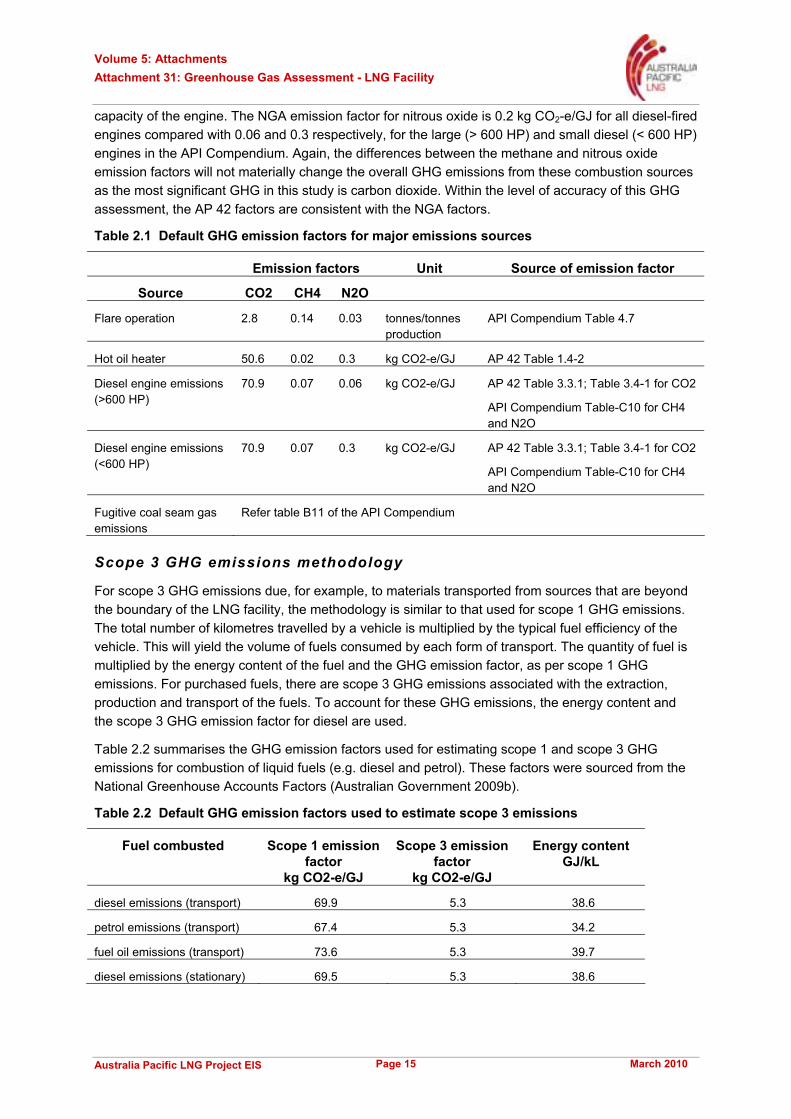
capacity of the engine. The NGA emission factor for nitrous oxide is 0.2 kg CO2-e/GJ for all diesel-fired engines compared with 0.06 and 0.3 respectively, for the large (> 600 HP) and small diesel (< 600 HP) engines in the API Compendium. Again, the differences between the methane and nitrous oxide emission factors will not materially change the overall GHG emissions from these combustion sources as the most significant GHG in this study is carbon dioxide. Within the level of accuracy of this GHG assessment, the AP 42 factors are consistent with the NGA factors.
Table 2.1 Default GHG emission factors for major emissions sources
Emission factors Unit Source of emission factor
Source CO2 CH4 N2O
Flare operation 2.8 0.14 0.03 tonnes/tonnes production
API Compendium Table 4.7
Hot oil heater 50.6 0.02 0.3 kg CO2-e/GJ AP 42 Table 1.4-2
Diesel engine emissions (>600 HP)
70.9 0.07 0.06 kg CO2-e/GJ AP 42 Table 3.3.1; Table 3.4-1 for CO2
API Compendium Table-C10 for CH4 and N2O
Diesel engine emissions (<600 HP)
70.9 0.07 0.3 kg CO2-e/GJ AP 42 Table 3.3.1; Table 3.4-1 for CO2
API Compendium Table-C10 for CH4 and N2O
Fugitive coal seam gas emissions
Refer table B11 of the API Compendium
Scope 3 GHG emissions methodology
For scope 3 GHG emissions due, for example, to materials transported from sources that are beyond the boundary of the LNG facility, the methodology is similar to that used for scope 1 GHG emissions. The total number of kilometres travelled by a vehicle is multiplied by the typical fuel efficiency of the vehicle. This will yield the volume of fuels consumed by each form of transport. The quantity of fuel is multiplied by the energy content of the fuel and the GHG emission factor, as per scope 1 GHG emissions. For purchased fuels, there are scope 3 GHG emissions associated with the extraction, production and transport of the fuels. To account for these GHG emissions, the energy content and the scope 3 GHG emission factor for diesel are used.
Table 2.2 summarises the GHG emission factors used for estimating scope 1 and scope 3 GHG emissions for combustion of liquid fuels (e.g. diesel and petrol). These factors were sourced from the National Greenhouse Accounts Factors (Australian Government 2009b).
Table 2.2 Default GHG emission factors used to estimate scope 3 emissions
Fuel combusted Scope 1 emission factor
kg CO2-e/GJ
Scope 3 emission factor
kg CO2-e/GJ
Energy content GJ/kL
diesel emissions (transport) 69.9 5.3 38.6
petrol emissions (transport) 67.4 5.3 34.2
fuel oil emissions (transport) 73.6 5.3 39.7
diesel emissions (stationary) 69.5 5.3 38.6
Volume 5: Attachments Attachment 31: Greenhouse Gas Assessment - LNG Facility
Australia Pacific LNG Project EIS March 2010 Page 16
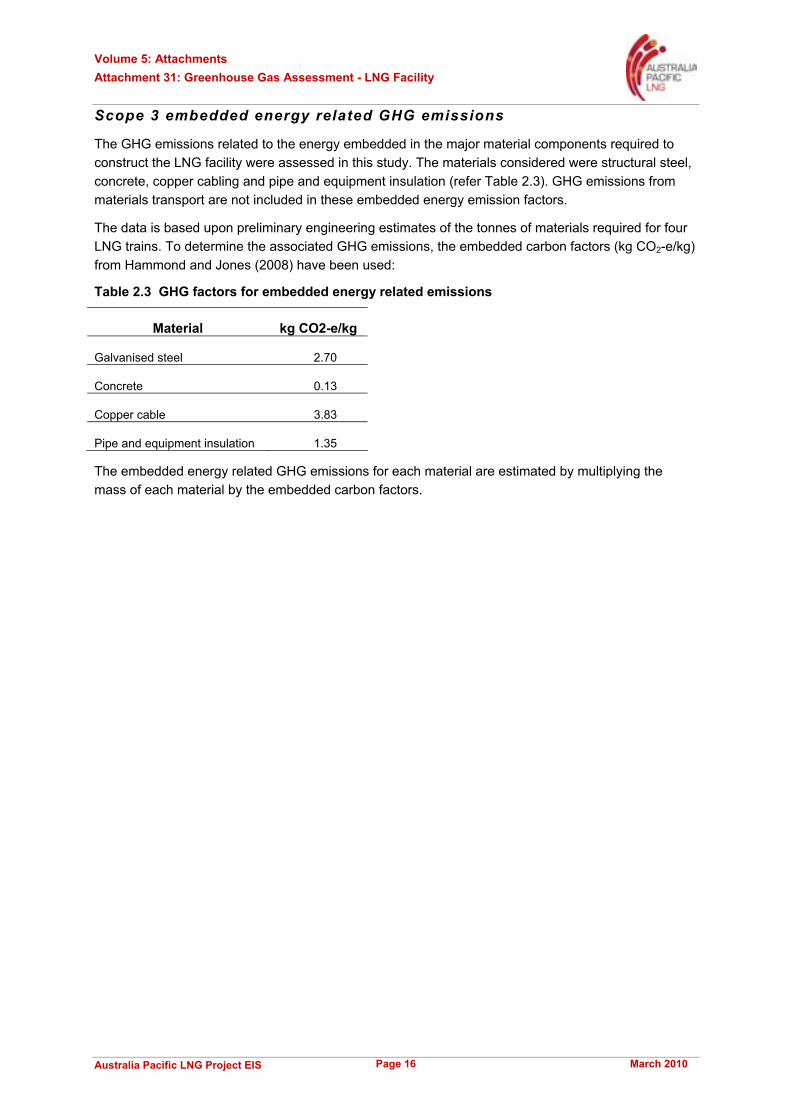
Scope 3 embedded energy related GHG emissions
The GHG emissions related to the energy embedded in the major material components required to construct the LNG facility were assessed in this study. The materials considered were structural steel, concrete, copper cabling and pipe and equipment insulation (refer Table 2.3). GHG emissions from materials transport are not included in these embedded energy emission factors.
The data is based upon preliminary engineering estimates of the tonnes of materials required for four LNG trains. To determine the associated GHG emissions, the embedded carbon factors (kg CO2-e/kg) from Hammond and Jones (2008) have been used:
Table 2.3 GHG factors for embedded energy related emissions
Material kg CO2-e/kg
Galvanised steel 2.70
Concrete 0.13
Copper cable 3.83
Pipe and equipment insulation 1.35
The embedded energy related GHG emissions for each material are estimated by multiplying the mass of each material by the embedded carbon factors.
Volume 5: Attachments Attachment 31: Greenhouse Gas Assessment - LNG Facility
Australia Pacific LNG Project EIS March 2010 Page 17
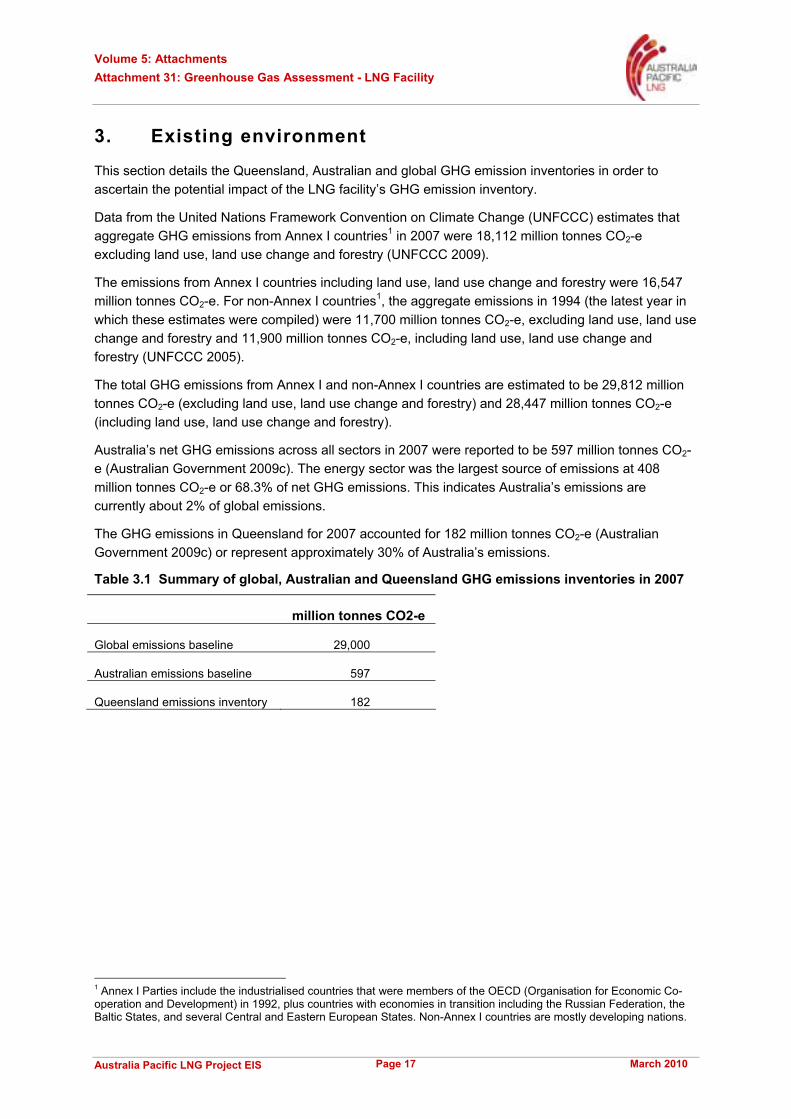
3. Existing environment
This section details the Queensland, Australian and global GHG emission inventories in order to ascertain the potential impact of the LNG facility’s GHG emission inventory.
Data from the United Nations Framework Convention on Climate Change (UNFCCC) estimates that aggregate GHG emissions from Annex I countries1 in 2007 were 18,112 million tonnes CO2-e excluding land use, land use change and forestry (UNFCCC 2009).
The emissions from Annex I countries including land use, land use change and forestry were 16,547 million tonnes CO2-e. For non-Annex I countries1, the aggregate emissions in 1994 (the latest year in which these estimates were compiled) were 11,700 million tonnes CO2-e, excluding land use, land use change and forestry and 11,900 million tonnes CO2-e, including land use, land use change and forestry (UNFCCC 2005).
The total GHG emissions from Annex I and non-Annex I countries are estimated to be 29,812 million tonnes CO2-e (excluding land use, land use change and forestry) and 28,447 million tonnes CO2-e (including land use, land use change and forestry).
Australia’s net GHG emissions across all sectors in 2007 were reported to be 597 million tonnes CO2-e (Australian Government 2009c). The energy sector was the largest source of emissions at 408 million tonnes CO2-e or 68.3% of net GHG emissions. This indicates Australia’s emissions are currently about 2% of global emissions.
The GHG emissions in Queensland for 2007 accounted for 182 million tonnes CO2-e (Australian Government 2009c) or represent approximately 30% of Australia’s emissions.
Table 3.1 Summary of global, Australian and Queensland GHG emissions inventories in 2007
million tonnes CO2-e
Global emissions baseline 29,000
Australian emissions baseline 597
Queensland emissions inventory 182
1 Annex I Parties include the industrialised countries that were members of the OECD (Organisation for Economic Co-operation and Development) in 1992, plus countries with economies in transition including the Russian Federation, the Baltic States, and several Central and Eastern European States. Non-Annex I countries are mostly developing nations.
Volume 5: Attachments Attachment 31: Greenhouse Gas Assessment - LNG Facility
Australia Pacific LNG Project EIS March 2010 Page 18
4. Potential impacts
This section describes the GHG emissions estimates for the LNG facility broken down by emissions scopes, Project phases and activities in an annualised form and across the project life.
4.1 Modelling results
GHG emissions have been estimated for the LNG facility over the project lifetime and includes the construction and operation stages of the Project. Production from each LNG train will be staged according to the development of the gas fields. Emissions associated with decommissioning activities have not been estimated in detail but are assumed to be the same as the construction phase GHG emissions.
Note that all GHGs reported in this section are aggregated GHG emissions in terms of CO2-e. Emissions of methane and nitrous oxide, as shown by the GHG emissions factors in Table 2.1, generally account for less than 1% of total GHG emissions from the major emissions sources such as the power and refrigeration turbines and the hot oil heaters. For this reason, methane and nitrous oxide emissions are not reported separately, but their emissions are aggregated into the total CO2-e emission estimates.
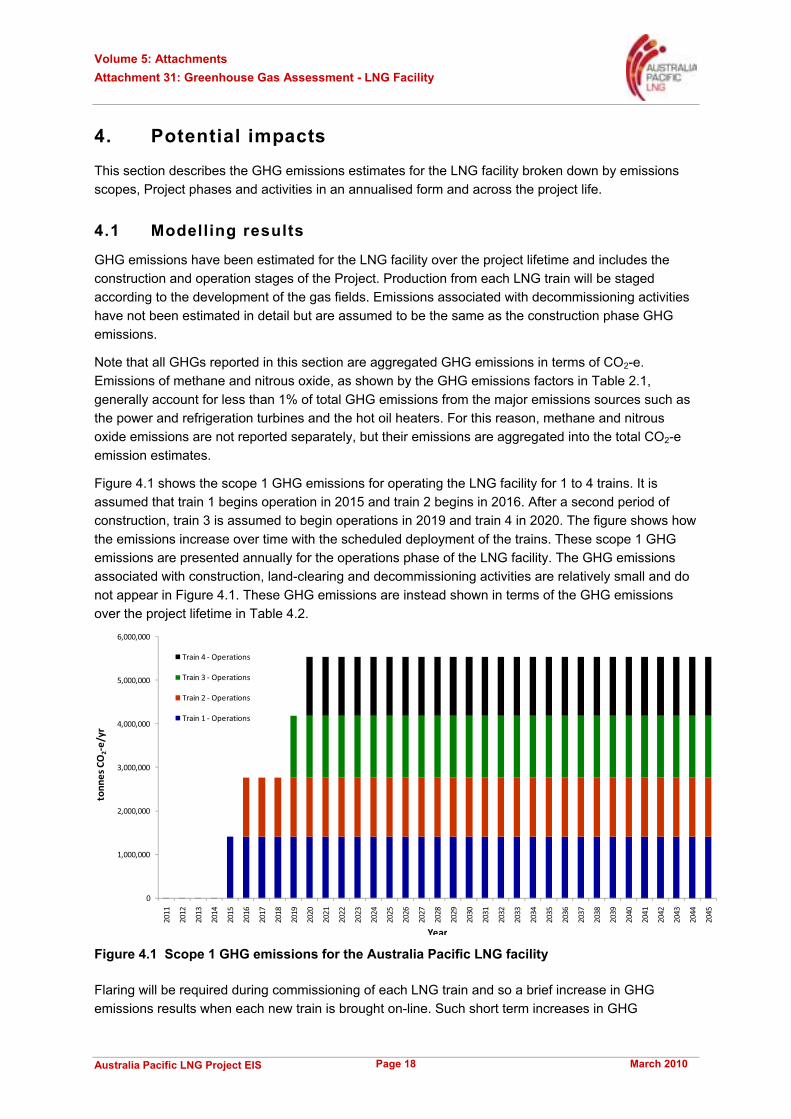
Figure 4.1 shows the scope 1 GHG emissions for operating the LNG facility for 1 to 4 trains. It is assumed that train 1 begins operation in 2015 and train 2 begins in 2016. After a second period of construction, train 3 is assumed to begin operations in 2019 and train 4 in 2020. The figure shows how the emissions increase over time with the scheduled deployment of the trains. These scope 1 GHG emissions are presented annually for the operations phase of the LNG facility. The GHG emissions associated with construction, land-clearing and decommissioning activities are relatively small and do not appear in Figure 4.1. These GHG emissions are instead shown in terms of the GHG emissions over the project lifetime in Table 4.2.
0
1,000,000
2,000,000
3,000,000
4,000,000
5,000,000
6,000,000
2011
2012
2013
2014
2015
2016
2017
2018
2019
2020
2021
2022
2023
2024
2025
2026
2027
2028
2029
2030
2031
2032
2033
2034
2035
2036
2037
2038
2039
2040
2041
2042
2043
2044
2045
tonn
es C
O2-
e/yr
Year
Train 4 - Operations
Train 3 - Operations
Train 2 - Operations
Train 1 - Operations
Figure 4.1 Scope 1 GHG emissions for the Australia Pacific LNG facility
Flaring will be required during commissioning of each LNG train and so a brief increase in GHG emissions results when each new train is brought on-line. Such short term increases in GHG
Volume 5: Attachments Attachment 31: Greenhouse Gas Assessment - LNG Facility
Australia Pacific LNG Project EIS March 2010 Page 19
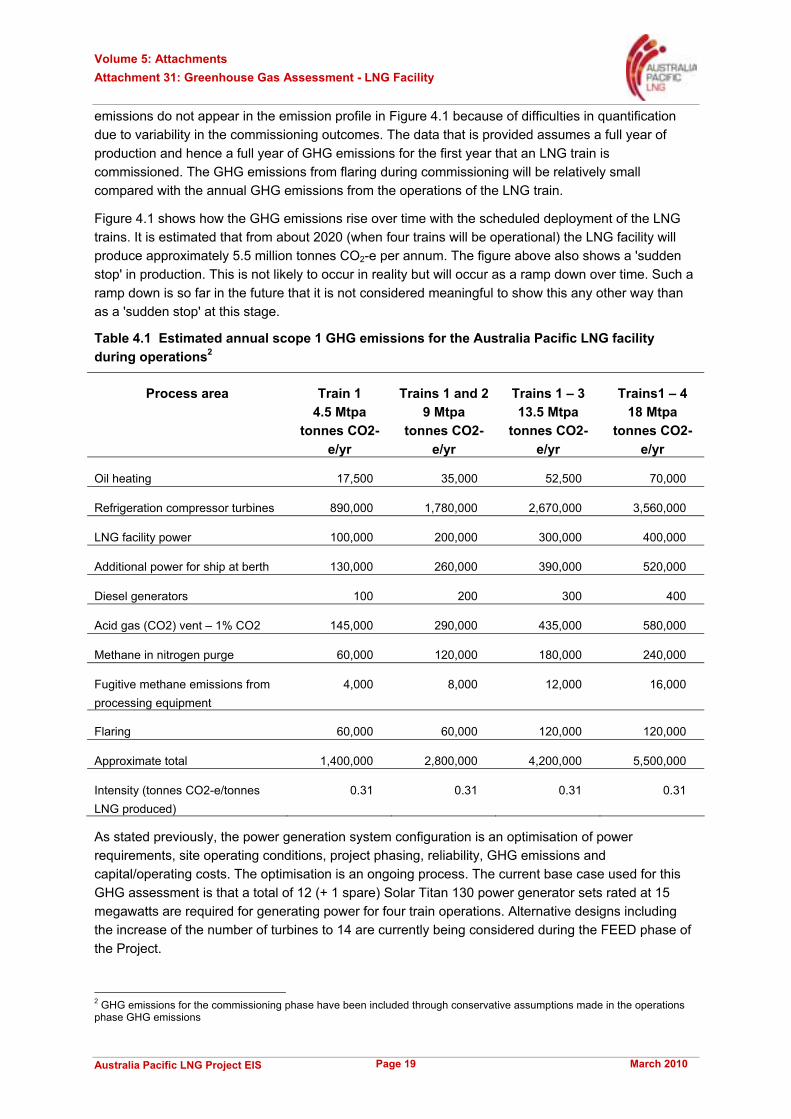
emissions do not appear in the emission profile in Figure 4.1 because of difficulties in quantification due to variability in the commissioning outcomes. The data that is provided assumes a full year of production and hence a full year of GHG emissions for the first year that an LNG train is commissioned. The GHG emissions from flaring during commissioning will be relatively small compared with the annual GHG emissions from the operations of the LNG train.
Figure 4.1 shows how the GHG emissions rise over time with the scheduled deployment of the LNG trains. It is estimated that from about 2020 (when four trains will be operational) the LNG facility will produce approximately 5.5 million tonnes CO2-e per annum. The figure above also shows a 'sudden stop' in production. This is not likely to occur in reality but will occur as a ramp down over time. Such a ramp down is so far in the future that it is not considered meaningful to show this any other way than as a 'sudden stop' at this stage.
Table 4.1 Estimated annual scope 1 GHG emissions for the Australia Pacific LNG facility during operations2
Process area Train 1 4.5 Mtpa
tonnes CO2-e/yr
Trains 1 and 29 Mtpa
tonnes CO2-e/yr
Trains 1 – 3 13.5 Mtpa
tonnes CO2-e/yr
Trains1 – 4 18 Mtpa
tonnes CO2-e/yr
Oil heating 17,500 35,000 52,500 70,000
Refrigeration compressor turbines 890,000 1,780,000 2,670,000 3,560,000
LNG facility power 100,000 200,000 300,000 400,000
Additional power for ship at berth 130,000 260,000 390,000 520,000
Diesel generators 100 200 300 400
Acid gas (CO2) vent – 1% CO2 145,000 290,000 435,000 580,000
Methane in nitrogen purge 60,000 120,000 180,000 240,000
Fugitive methane emissions from processing equipment
4,000 8,000 12,000 16,000
Flaring 60,000 60,000 120,000 120,000
Approximate total 1,400,000 2,800,000 4,200,000 5,500,000
Intensity (tonnes CO2-e/tonnes LNG produced)
0.31 0.31 0.31 0.31
As stated previously, the power generation system configuration is an optimisation of power requirements, site operating conditions, project phasing, reliability, GHG emissions and capital/operating costs. The optimisation is an ongoing process. The current base case used for this GHG assessment is that a total of 12 (+ 1 spare) Solar Titan 130 power generator sets rated at 15 megawatts are required for generating power for four train operations. Alternative designs including the increase of the number of turbines to 14 are currently being considered during the FEED phase of the Project.
2 GHG emissions for the commissioning phase have been included through conservative assumptions made in the operations phase GHG emissions
Volume 5: Attachments Attachment 31: Greenhouse Gas Assessment - LNG Facility
Australia Pacific LNG Project EIS March 2010 Page 20
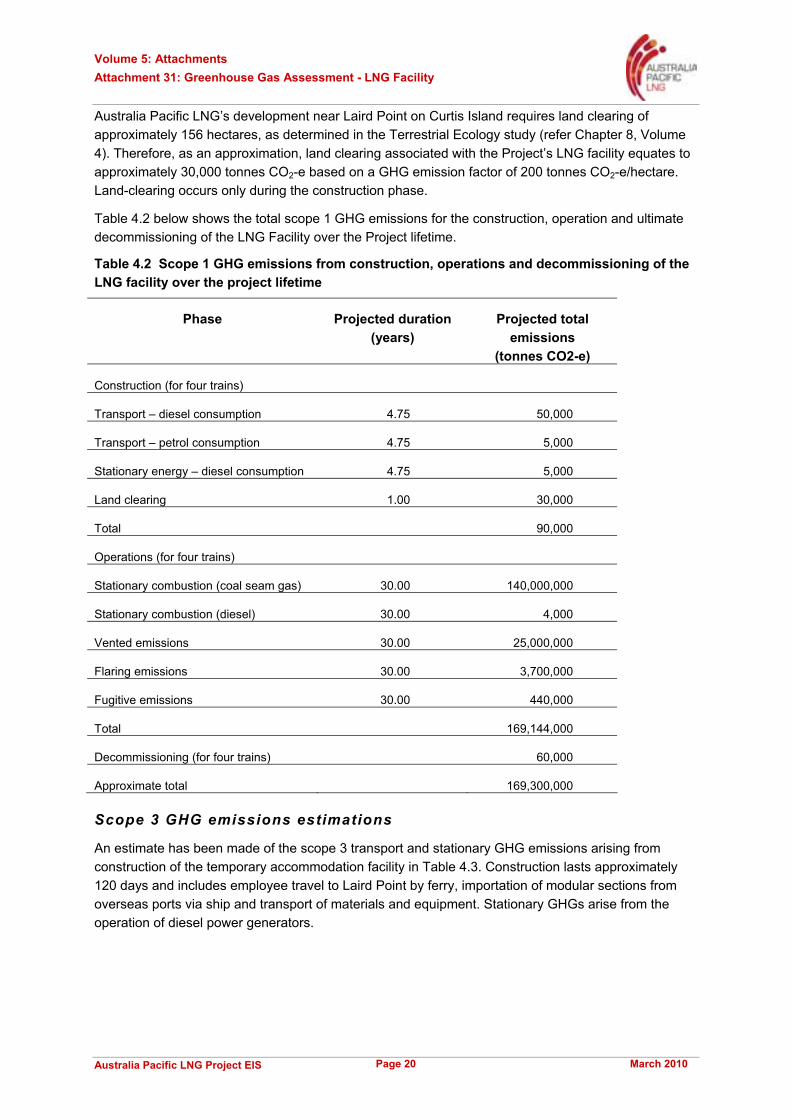
Australia Pacific LNG’s development near Laird Point on Curtis Island requires land clearing of approximately 156 hectares, as determined in the Terrestrial Ecology study (refer Chapter 8, Volume 4). Therefore, as an approximation, land clearing associated with the Project’s LNG facility equates to approximately 30,000 tonnes CO2-e based on a GHG emission factor of 200 tonnes CO2-e/hectare. Land-clearing occurs only during the construction phase.
Table 4.2 below shows the total scope 1 GHG emissions for the construction, operation and ultimate decommissioning of the LNG Facility over the Project lifetime.
Table 4.2 Scope 1 GHG emissions from construction, operations and decommissioning of the LNG facility over the project lifetime
Phase Projected duration (years)
Projected total emissions
(tonnes CO2-e)
Construction (for four trains)
Transport – diesel consumption 4.75 50,000
Transport – petrol consumption 4.75 5,000
Stationary energy – diesel consumption 4.75 5,000
Land clearing 1.00 30,000
Total 90,000
Operations (for four trains)
Stationary combustion (coal seam gas) 30.00 140,000,000
Stationary combustion (diesel) 30.00 4,000
Vented emissions 30.00 25,000,000
Flaring emissions 30.00 3,700,000
Fugitive emissions 30.00 440,000
Total 169,144,000
Decommissioning (for four trains) 60,000
Approximate total 169,300,000
Scope 3 GHG emissions estimations
An estimate has been made of the scope 3 transport and stationary GHG emissions arising from construction of the temporary accommodation facility in Table 4.3. Construction lasts approximately 120 days and includes employee travel to Laird Point by ferry, importation of modular sections from overseas ports via ship and transport of materials and equipment. Stationary GHGs arise from the operation of diesel power generators.
Volume 5: Attachments Attachment 31: Greenhouse Gas Assessment - LNG Facility
Australia Pacific LNG Project EIS March 2010 Page 21
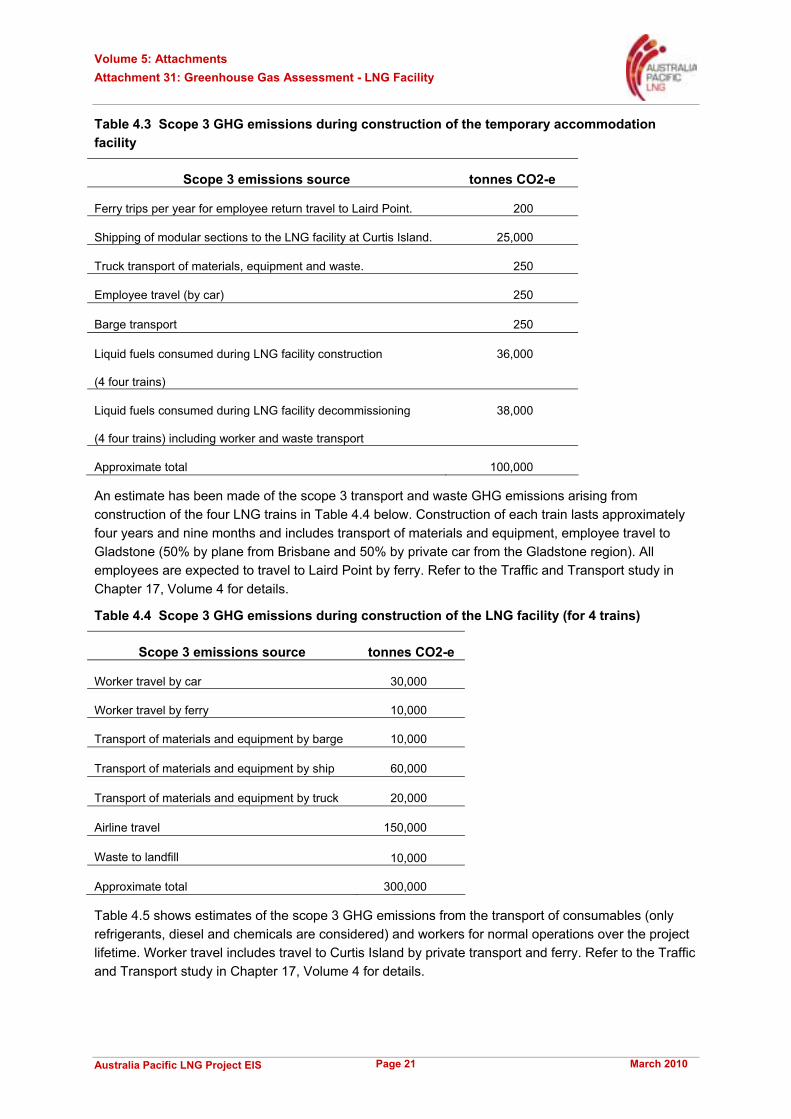
Table 4.3 Scope 3 GHG emissions during construction of the temporary accommodation facility
Scope 3 emissions source tonnes CO2-e
Ferry trips per year for employee return travel to Laird Point. 200
Shipping of modular sections to the LNG facility at Curtis Island. 25,000
Truck transport of materials, equipment and waste. 250
Employee travel (by car) 250
Barge transport 250
Liquid fuels consumed during LNG facility construction
(4 four trains)
36,000
Liquid fuels consumed during LNG facility decommissioning
(4 four trains) including worker and waste transport
38,000
Approximate total 100,000
An estimate has been made of the scope 3 transport and waste GHG emissions arising from construction of the four LNG trains in Table 4.4 below. Construction of each train lasts approximately four years and nine months and includes transport of materials and equipment, employee travel to Gladstone (50% by plane from Brisbane and 50% by private car from the Gladstone region). All employees are expected to travel to Laird Point by ferry. Refer to the Traffic and Transport study in Chapter 17, Volume 4 for details.
Table 4.4 Scope 3 GHG emissions during construction of the LNG facility (for 4 trains)
Scope 3 emissions source tonnes CO2-e
Worker travel by car 30,000
Worker travel by ferry 10,000
Transport of materials and equipment by barge 10,000
Transport of materials and equipment by ship 60,000
Transport of materials and equipment by truck 20,000
Airline travel 150,000
Waste to landfill 10,000
Approximate total 300,000
Table 4.5 shows estimates of the scope 3 GHG emissions from the transport of consumables (only refrigerants, diesel and chemicals are considered) and workers for normal operations over the project lifetime. Worker travel includes travel to Curtis Island by private transport and ferry. Refer to the Traffic and Transport study in Chapter 17, Volume 4 for details.
Volume 5: Attachments Attachment 31: Greenhouse Gas Assessment - LNG Facility
Australia Pacific LNG Project EIS March 2010 Page 22
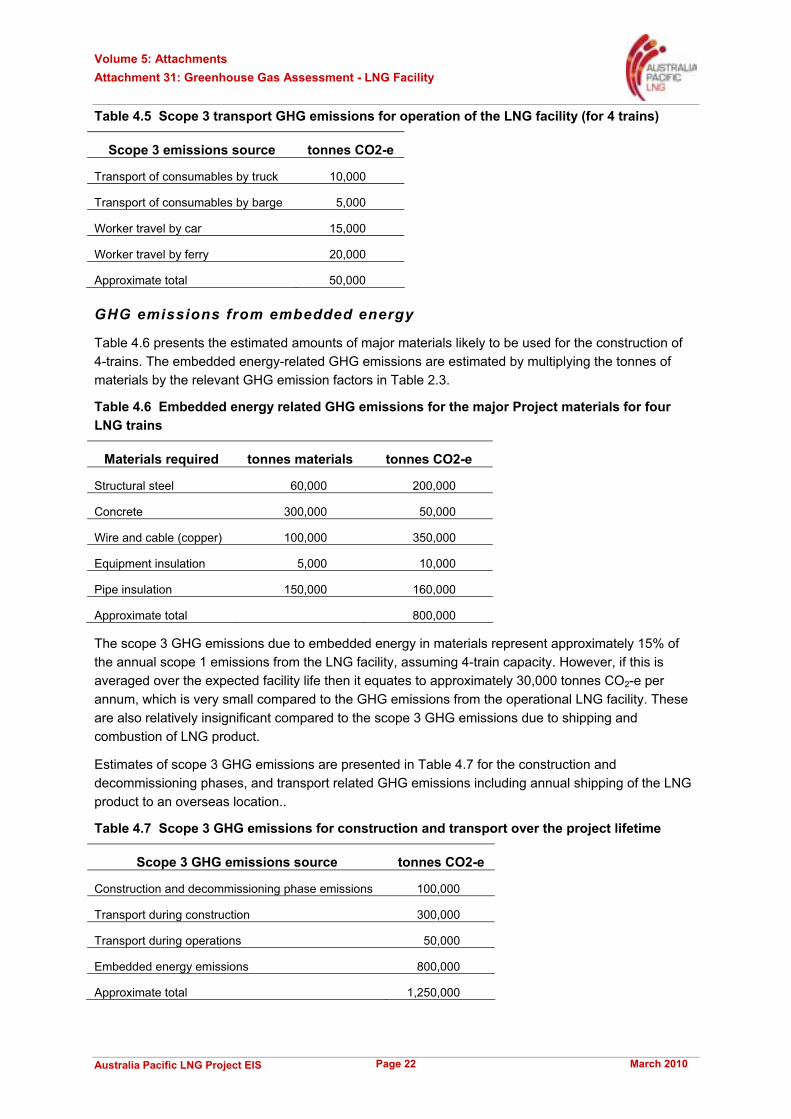
Table 4.5 Scope 3 transport GHG emissions for operation of the LNG facility (for 4 trains)
Scope 3 emissions source tonnes CO2-e
Transport of consumables by truck 10,000
Transport of consumables by barge 5,000
Worker travel by car 15,000
Worker travel by ferry 20,000
Approximate total 50,000
GHG emissions from embedded energy
Table 4.6 presents the estimated amounts of major materials likely to be used for the construction of 4-trains. The embedded energy-related GHG emissions are estimated by multiplying the tonnes of materials by the relevant GHG emission factors in Table 2.3.
Table 4.6 Embedded energy related GHG emissions for the major Project materials for four LNG trains
Materials required tonnes materials tonnes CO2-e
Structural steel 60,000 200,000
Concrete 300,000 50,000
Wire and cable (copper) 100,000 350,000
Equipment insulation 5,000 10,000
Pipe insulation 150,000 160,000
Approximate total 800,000
The scope 3 GHG emissions due to embedded energy in materials represent approximately 15% of the annual scope 1 emissions from the LNG facility, assuming 4-train capacity. However, if this is averaged over the expected facility life then it equates to approximately 30,000 tonnes CO2-e per annum, which is very small compared to the GHG emissions from the operational LNG facility. These are also relatively insignificant compared to the scope 3 GHG emissions due to shipping and combustion of LNG product.
Estimates of scope 3 GHG emissions are presented in Table 4.7 for the construction and decommissioning phases, and transport related GHG emissions including annual shipping of the LNG product to an overseas location..
Table 4.7 Scope 3 GHG emissions for construction and transport over the project lifetime
Scope 3 GHG emissions source tonnes CO2-e
Construction and decommissioning phase emissions 100,000
Transport during construction 300,000
Transport during operations 50,000
Embedded energy emissions 800,000
Approximate total 1,250,000
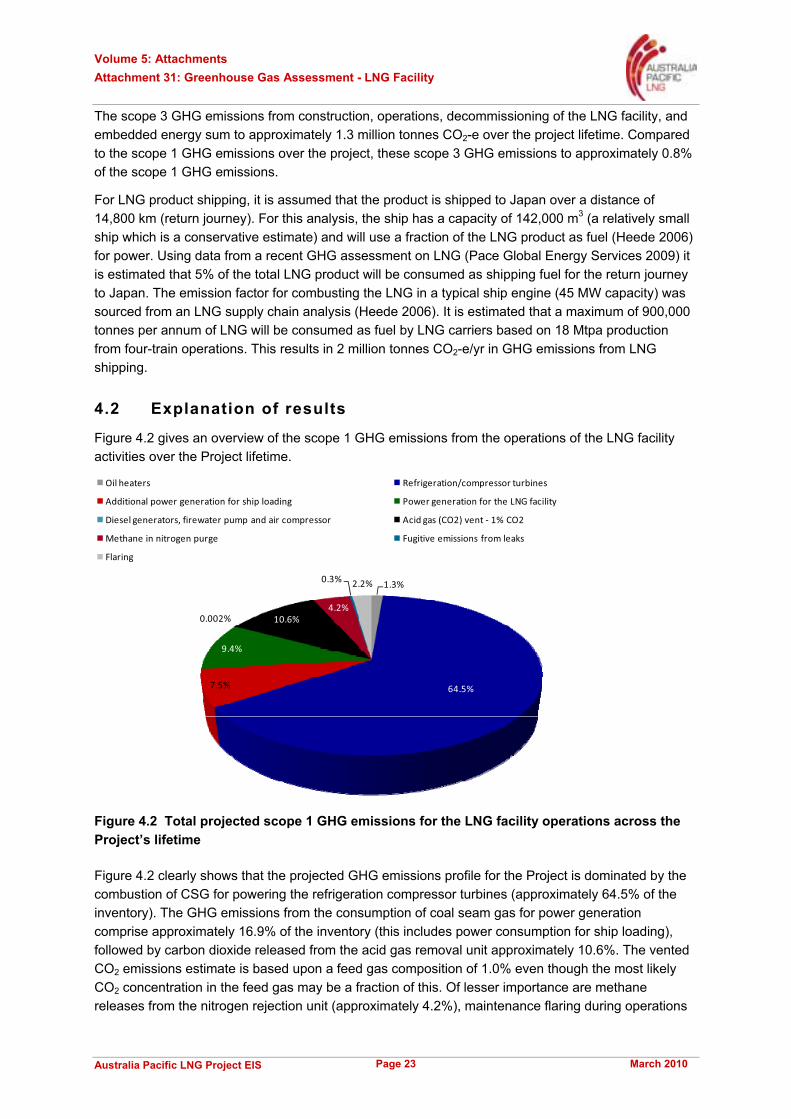
Volume 5: Attachments Attachment 31: Greenhouse Gas Assessment - LNG Facility
Australia Pacific LNG Project EIS March 2010 Page 23
The scope 3 GHG emissions from construction, operations, decommissioning of the LNG facility, and embedded energy sum to approximately 1.3 million tonnes CO2-e over the project lifetime. Compared to the scope 1 GHG emissions over the project, these scope 3 GHG emissions to approximately 0.8% of the scope 1 GHG emissions.
For LNG product shipping, it is assumed that the product is shipped to Japan over a distance of 14,800 km (return journey). For this analysis, the ship has a capacity of 142,000 m3 (a relatively small ship which is a conservative estimate) and will use a fraction of the LNG product as fuel (Heede 2006) for power. Using data from a recent GHG assessment on LNG (Pace Global Energy Services 2009) it is estimated that 5% of the total LNG product will be consumed as shipping fuel for the return journey to Japan. The emission factor for combusting the LNG in a typical ship engine (45 MW capacity) was sourced from an LNG supply chain analysis (Heede 2006). It is estimated that a maximum of 900,000 tonnes per annum of LNG will be consumed as fuel by LNG carriers based on 18 Mtpa production from four-train operations. This results in 2 million tonnes CO2-e/yr in GHG emissions from LNG shipping.
4.2 Explanation of results
Figure 4.2 gives an overview of the scope 1 GHG emissions from the operations of the LNG facility activities over the Project lifetime.
1.3%
64.5%7.5%
9.4%
0.002% 10.6%4.2%
0.3% 2.2%
Oil heaters Refrigeration/compressor turbines
Additional power generation for ship loading Power generation for the LNG facility
Diesel generators, firewater pump and air compressor Acid gas (CO2) vent - 1% CO2
Methane in nitrogen purge Fugitive emissions from leaks
Flaring
Figure 4.2 Total projected scope 1 GHG emissions for the LNG facility operations across the Project’s lifetime
Figure 4.2 clearly shows that the projected GHG emissions profile for the Project is dominated by the combustion of CSG for powering the refrigeration compressor turbines (approximately 64.5% of the inventory). The GHG emissions from the consumption of coal seam gas for power generation comprise approximately 16.9% of the inventory (this includes power consumption for ship loading), followed by carbon dioxide released from the acid gas removal unit approximately 10.6%. The vented CO2 emissions estimate is based upon a feed gas composition of 1.0% even though the most likely CO2 concentration in the feed gas may be a fraction of this. Of lesser importance are methane releases from the nitrogen rejection unit (approximately 4.2%), maintenance flaring during operations

Volume 5: Attachments Attachment 31: Greenhouse Gas Assessment - LNG Facility
Australia Pacific LNG Project EIS March 2010 Page 24
(approximately 2.2%) and oil heater emissions (approximately 1.3%). GHG emissions due to fugitive methane releases from processing equipment and consumption of diesel for back-up power generation (and the like) are relatively insignificant at approximately 0.3% and approximately 0.002% respectively.
Volume 5: Attachments Attachment 31: Greenhouse Gas Assessment - LNG Facility
Australia Pacific LNG Project EIS March 2010 Page 25
5. Mitigation measures
Australia Pacific LNG has an objective to reduce the GHG intensity of its production processes. Australia Pacific LNG has performed an analysis of the various technologies and processes to improve the energy efficiency of the LNG facility and reduce the GHG emissions. The liquefaction/refrigeration process is highly energy intensive and is therefore a key area where energy efficiency improvements have and will continue to be focused.
The liquefaction technology used in this project is the ConocoPhillips Optimized Cascade® Process, which is a well-proven technology for processing liquefied natural gas. The Process is currently used at the Darwin LNG facility, which is operated by ConocoPhillips. Santos/Petronas also propose to use it for their Gladstone LNG project (GLNG 2009a), while BG Group proposes to use it for their Queensland Curtis LNG (QGC 2009) CSG to LNG developments in Gladstone. This is primarily due to its efficiency and operational flexibility.
The preferred GHG mitigation measures that have been included in the design phase of the Project are:
� Efficient refrigeration turbines
� Utilisation of waste heat
� Vapour recovery to reduce flaring and venting.
Australia Pacific LNG has identified that GE LM2500-G4+ aero-derivative gas turbines are among the most fuel efficient turbines. The application of the aero-derivative turbines results in approximately 25% less GHG emissions compared with industrial Frame 5D turbines which are commonly used in LNG facilities around the world. It is estimated that on a per train per annum basis, the aero-derivative turbines could reduce the total scope 1 GHG emissions by approximately 225,000 tonnes CO2-e. Aero-derivative turbines are currently in use at some LNG plants such as Darwin LNG, so the implementation of this technology at the Australia Pacific LNG facility would be familiar to Australia Pacific LNG through ConocoPhillips. This technology is consistent with international leading practice.
The second GHG mitigation measure is the installation of waste heat recovery units on the gas turbine exhaust stacks, instead of gas-fired boilers/heaters. The waste heat will be used to heat the hot oil system and the dehydration system regeneration gas for two of the refrigeration gas turbines. Engineering estimates suggest this could reduce emissions by approximately 63,000 tonnes CO2-e per train per annum..
The third measure is the installation of BOG compression facilities to recover vapours generated from the LNG tanks and export vessels during LNG loading. The recovery of gas during the ship-loading process reduces GHG emissions associated with flaring this stream, and conserves coal seam gas. The estimated GHG savings are approximately 100,000 tonnes CO2-e per train per year.
These GHG mitigation measures have been quantified in Table 5.1 and displayed graphically in Figure 5.1. The reference case is essentially based on common international practice at the time of plant design.
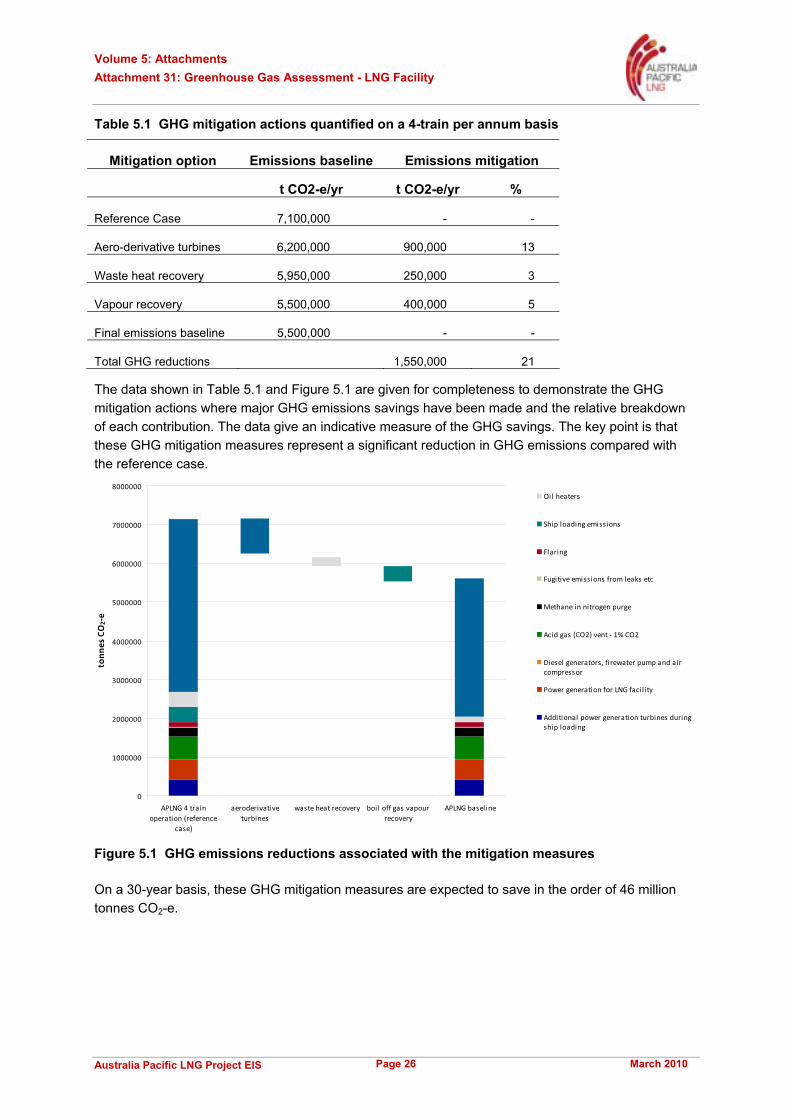
Volume 5: Attachments Attachment 31: Greenhouse Gas Assessment - LNG Facility
Australia Pacific LNG Project EIS March 2010 Page 26
Table 5.1 GHG mitigation actions quantified on a 4-train per annum basis
Mitigation option Emissions baseline Emissions mitigation
t CO2-e/yr t CO2-e/yr %
Reference Case 7,100,000 - -
Aero-derivative turbines 6,200,000 900,000 13
Waste heat recovery 5,950,000 250,000 3
Vapour recovery 5,500,000 400,000 5
Final emissions baseline 5,500,000 - -
Total GHG reductions 1,550,000 21
The data shown in Table 5.1 and Figure 5.1 are given for completeness to demonstrate the GHG mitigation actions where major GHG emissions savings have been made and the relative breakdown of each contribution. The data give an indicative measure of the GHG savings. The key point is that these GHG mitigation measures represent a significant reduction in GHG emissions compared with the reference case.
0
1000000
2000000
3000000
4000000
5000000
6000000
7000000
8000000
APLNG 4 trainoperation (reference
case)
aeroderivativeturbines
waste heat recovery boil off gas vapourrecovery
APLNG baseline
tonn
es C
O2-
e
Oil heaters
Ship loading emissions
Flaring
Fugitive emissions from leaks etc
Methane in nitrogen purge
Acid gas (CO2) vent - 1% CO2
Diesel generators, firewater pump and aircompressor
Power generation for LNG faci l ity
Additional power generation turbines duringship loading
Figure 5.1 GHG emissions reductions associated with the mitigation measures
On a 30-year basis, these GHG mitigation measures are expected to save in the order of 46 million tonnes CO2-e.
Volume 5: Attachments Attachment 31: Greenhouse Gas Assessment - LNG Facility
Australia Pacific LNG Project EIS March 2010 Page 27
Comparison of GHG emissions from ground and elevated gas flaring
Australia Pacific LNG has also assessed industry leading practice for GHG mitigation in flaring. As a result, Australia Pacific LNG proposes to use a ground flare similar to that currently used at ConocoPhillips’ Darwin LNG facility. This type of flare burns more cleanly than the conventional elevated pipe flare and this results in fewer emission by-products and less GHG emissions overall. Typically an elevated pipe flare burns at approximately 98% combustion efficiency (meaning 2% methane is uncombusted) and a ground flare would be expected to burn at approximately 99.5+% combustion efficiency (where only approximately 0.5% methane is uncombusted). The two cases are examined in more detail below.
Case A – conventional elevated pipe f lare
Assuming 100 tonnes of coal seam gas is flared at 98% efficiency, i.e. 98 tonnes of coal seam gas (assume this is methane) is flared. Using the flaring GHG emission factor in Table 2.1 of 2.97 tonnes CO2-e/tonne of gas flared, this gives GHG emissions from elevated flaring of 291.5 tonnes CO2-e. The remaining two tonnes of coal seam gas is assumed to be vented, so multiplying by the global warming potential of methane (21 tonnes CO2-e/tonne methane), gives 42 tonnes CO2-e vented. GHG emissions are 333.5 tonnes CO2-e per 100 tonnes flared.
Case B – ground f lare
Assuming 100 tonnes of coal seam gas is flared at 99.5% efficiency, i.e. 99.5 tonnes of coal seam gas is (methane) is flared. Using the same GHG emission factor as above, the GHG emissions from ground flaring is 295.5 tonnes CO2-e. Only 0.5 tonnes of coal seam gas is vented, so multiplying by the global warming potential of methane gives 10.5 tonnes CO2-e vented. GHG emissions are 306 tonnes CO2-e per 100 tonnes flared.
The difference in combustion efficiency between these two technologies therefore translates to approximately 10% reduction in GHG emissions for the flaring component. Given that flaring contributes approximately 2.2% to the total GHG emissions, this application of technology saves approximately 0.2% GHG emissions overall. However, the GHG reductions in flaring emissions have not been included in Figure 5.1 because of significant uncertainties associated with the different flaring methods.
In addition to the potential GHG emissions reductions, the use of a ground flare also reduces the light effects, visual aspects and aviation risks associated with a conventional elevated process flare.
Reducing methane emissions from rejected nitrogen
Nitrogen is vented to the atmosphere to prevent its build-up in the fuel gas and methane refrigerant streams. Nitrogen is removed from the gas stream using a dedicated cryogenic nitrogen rejection unit.
Methane emissions associated with the nitrogen rejection unit will be reduced by employing a thermal oxidiser. The thermal oxidizer converts the methane to carbon dioxide thus reducing the GHGs, as the global warming potential of methane is 21 times that of carbon dioxide. The challenge is that additional fuel is often required to make the oxidiser function, so the net GHG benefits have not been quantified here and will be reviewed as part of the ongoing assessment.
5.1 Further GHG mitigation measures
Various other design and operational features will be employed to minimise GHG emissions. These include:
Volume 5: Attachments Attachment 31: Greenhouse Gas Assessment - LNG Facility
Australia Pacific LNG Project EIS March 2010 Page 28
� Use of heat exchangers to recover energy (additional to recovery of heat from the gas turbine exhaust stacks).
� Use of inlet air-cooling which reduces water demand.
� Use of activated methyldiethanolamine (a-MDEA) as the amine for CO2 removal in lieu of available alternatives.
� Capturing the flash gas from the amine unit to either the fuel gas system or the flare.
� Flaring (or incineration) of waste streams instead of venting, where feasible.
� Insulating hot and cold equipment and piping.
� Selecting paint colours and equipment finishes to reduce heat transfer to cold equipment and piping.
� Washing gas turbines with water to maintain high efficiency.
� Procedures to start-up, shutdown and maintain equipment.
� Process control, shutdown and metering systems.
� Design plant layout to more efficiently move the streams through the process.
� Continuous closed system circulation of LNG through the loading lines to keep them cold.
� Specification of equipment such as compressors, pumps and air-coolers.
� Consideration of GHG emissions as part of the power generation system selection.
� Fugitive emissions surveys.
� Energy-efficient building design.
� A revised design (over that employed at Darwin) of the nitrogen removal unit which reduces the methane concentration in the nitrogen reject stream.
Australia Pacific LNG will also:
� Conduct energy efficiency audits
� Implement a process for regular review of new technology
� Meet commitments to monitor and report GHG emissions.
� Operate metering and sampling systems compliant with the NGER Act.
While not quantified in this assessment, an additional mitigation measure of installing a thermal oxidiser on the acid gas rejection unit has been identified for future engineering assessment: Methane from the acid gas rejection unit can be reduced with a thermal oxidiser, which also converts the methane in the acid gas stream to carbon dioxide. A decision is yet to be made about whether a thermal oxidizer will be required, but this will depend on the hydrogen sulphide content of the acid gas stream. The challenge is the same as mentioned for the nitrogen rejection unit. Additional fuel is often required to make the oxidiser function, so the net GHG benefits will be reviewed as part of the ongoing assessment.
Another future GHG mitigation measure is to investigate the installation of equipment which is carbon capture ready. At present there are there are no feasible reservoirs for CO2 storage currently available.
Volume 5: Attachments Attachment 31: Greenhouse Gas Assessment - LNG Facility
Australia Pacific LNG Project EIS March 2010 Page 29
Biodiversity offsets can be generated by tree planting in areas cleared during the construction of the Australia Pacific LNG Project or by the protection of previously unprotected parts of the ecosystem, and various other means (these are the ‘offset areas’). The draft biodiversity strategy will seek to minimise GHG emissions associated with land-clearing by increasing the habitat value of the offset areas through tree planting, which increases the biomass and the carbon sequestration potential of the forest sink. Thus, biodiversity offsets can generate GHG offsets. At this stage, the full range of activities that can generate biodiversity offsets is still being developed, and the GHG offsets associated with the biodiversity offsets cannot be quantified.
5.2 Comparison with International Industry Practice
Through an analysis of the key liquefied natural gas processes including compression, power generation and process heating, a number of mitigation measures were identified that reduce total GHG by around 21% over the reference case. These reductions contribute to achieving Australia Pacific LNG’s objective to reduce the GHG intensity of its LNG production process.
The GHG emissions intensities of the reference case and the current design of the LNG facility are shown in Figure 5.2. The figure also shows a number of Australian and international LNG facilities, some of which are in operation. Other LNG proponents such as Queensland Curtis LNG, Gladstone LNG (Santos/Petronas joint venture) and Gladstone LNG – Fisherman’s Landing, are at the design stage. It should be noted that the Darwin LNG, Egyptian LNG and Atlantic LNG currently operate with the ConocoPhillips Optimized Cascade® Process (OCP). Both Queensland Curtis LNG and Gladstone LNG have adopted this technology in their current LNG facility designs.
The Australia Pacific LNG project has adopted the OCP technology. Figure 5.2 shows that the current design of the Project’s LNG facility is amongst the least GHG intensive projects in the world.
However, comparisons with Darwin LNG should be explained further. Darwin LNG has an intensity of approximately 0.46 tonnes CO2-e/tonne LNG produced. This is partly because the feed gas used by Darwin LNG contains approximately 6% CO2, compared with 1% CO2 assumed for the feed gas to be used in the Australia Pacific LNG project.
Shell’s Prelude project (Shell 2009), which uses floating LNG technology, has the ability to process gas in situ over an offshore gas field. The 3.6 Mtpa facility generates approximately 2.3 million tonnes CO2-e per annum, with an overall intensity of 0.64 tonnes CO2-e/tonne liquefied natural gas production. From this, approximately 0.3 tonnes CO2-e/tonne liquefied natural gas is for the LNG facility and the remainder is vented reservoir CO2. Caution should also be used in making a direct comparison with the overall GHG emissions intensity for the Prelude development because it has 9% CO2 in the feed gas.
From Figure 5.2, the Queensland Curtis LNG project has a lower GHG intensity than the Australia Pacific LNG project. However, the EIS for this project (QGC 2009) reports gas field GHG emissions for two trains capacity and GHG emissions for a three-train LNG facility. It is therefore not clear that the full GHG inventory has been reported. For the Australia Pacific LNG project, GHG emissions from the gas field and LNG facility are reported on the basis of a full four-train capacity.
Comparisons between the Gladstone LNG project and the Australia Pacific LNG project cannot be made as the Gladstone LNG EIS (Gladstone LNG Pty Ltd 2008) does not specify power generation and desalination requirements, the CO2 content of the feed gas or the frequency and volumes of gas flared.
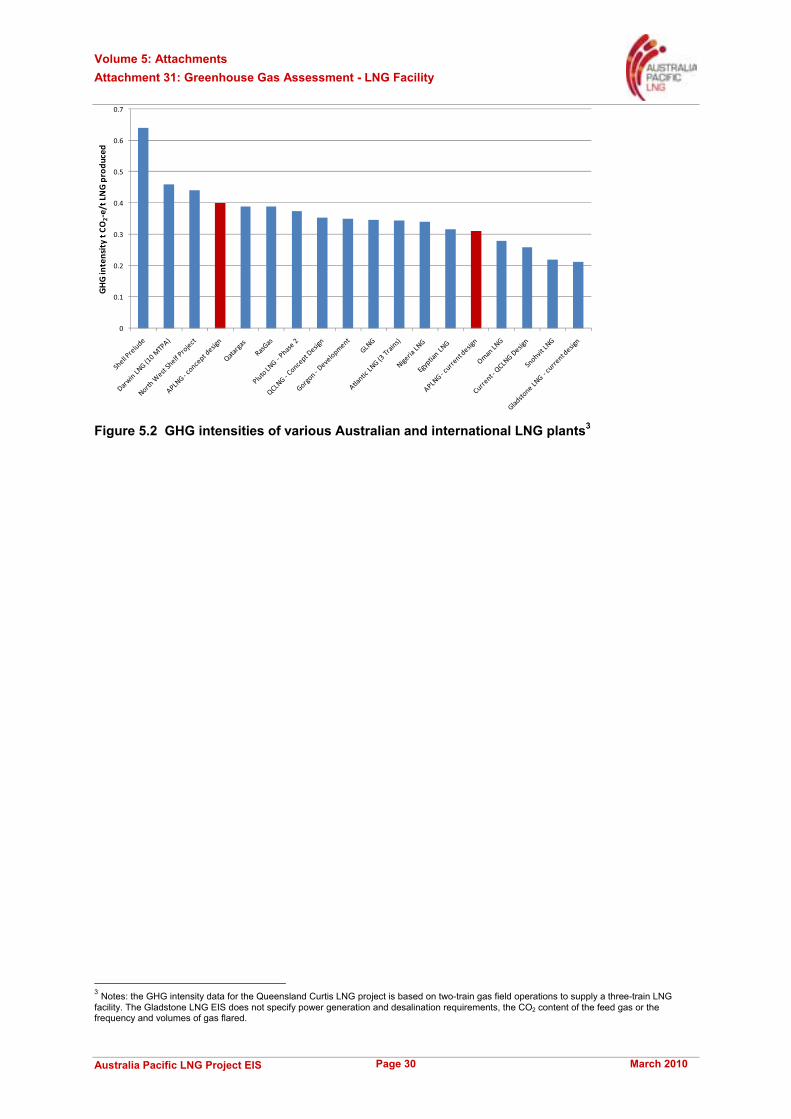
Volume 5: Attachments Attachment 31: Greenhouse Gas Assessment - LNG Facility
Australia Pacific LNG Project EIS March 2010 Page 30
0
0.1
0.2
0.3
0.4
0.5
0.6
0.7G
HG
inte
nsit
y t C
O2-
e/t L
NG
pro
duce
d
Figure 5.2 GHG intensities of various Australian and international LNG plants3
3 Notes: the GHG intensity data for the Queensland Curtis LNG project is based on two-train gas field operations to supply a three-train LNG facility. The Gladstone LNG EIS does not specify power generation and desalination requirements, the CO2 content of the feed gas or the frequency and volumes of gas flared.
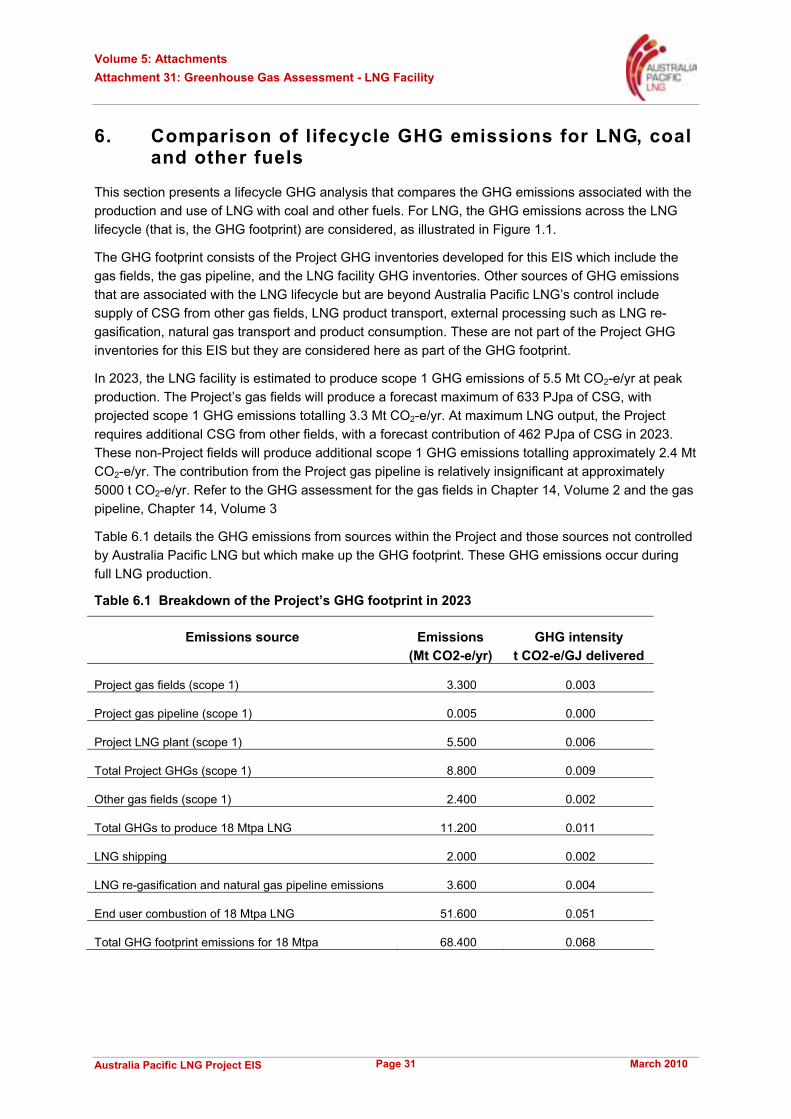
Volume 5: Attachments Attachment 31: Greenhouse Gas Assessment - LNG Facility
Australia Pacific LNG Project EIS March 2010 Page 31
6. Comparison of lifecycle GHG emissions for LNG, coal and other fuels
This section presents a lifecycle GHG analysis that compares the GHG emissions associated with the production and use of LNG with coal and other fuels. For LNG, the GHG emissions across the LNG lifecycle (that is, the GHG footprint) are considered, as illustrated in Figure 1.1.
The GHG footprint consists of the Project GHG inventories developed for this EIS which include the gas fields, the gas pipeline, and the LNG facility GHG inventories. Other sources of GHG emissions that are associated with the LNG lifecycle but are beyond Australia Pacific LNG’s control include supply of CSG from other gas fields, LNG product transport, external processing such as LNG re-gasification, natural gas transport and product consumption. These are not part of the Project GHG inventories for this EIS but they are considered here as part of the GHG footprint.
In 2023, the LNG facility is estimated to produce scope 1 GHG emissions of 5.5 Mt CO2-e/yr at peak production. The Project’s gas fields will produce a forecast maximum of 633 PJpa of CSG, with projected scope 1 GHG emissions totalling 3.3 Mt CO2-e/yr. At maximum LNG output, the Project requires additional CSG from other fields, with a forecast contribution of 462 PJpa of CSG in 2023. These non-Project fields will produce additional scope 1 GHG emissions totalling approximately 2.4 Mt CO2-e/yr. The contribution from the Project gas pipeline is relatively insignificant at approximately 5000 t CO2-e/yr. Refer to the GHG assessment for the gas fields in Chapter 14, Volume 2 and the gas pipeline, Chapter 14, Volume 3
Table 6.1 details the GHG emissions from sources within the Project and those sources not controlled by Australia Pacific LNG but which make up the GHG footprint. These GHG emissions occur during full LNG production.
Table 6.1 Breakdown of the Project’s GHG footprint in 2023
Emissions source Emissions (Mt CO2-e/yr)
GHG intensity t CO2-e/GJ delivered
Project gas fields (scope 1) 3.300 0.003
Project gas pipeline (scope 1) 0.005 0.000
Project LNG plant (scope 1) 5.500 0.006
Total Project GHGs (scope 1) 8.800 0.009
Other gas fields (scope 1) 2.400 0.002
Total GHGs to produce 18 Mtpa LNG 11.200 0.011
LNG shipping 2.000 0.002
LNG re-gasification and natural gas pipeline emissions 3.600 0.004
End user combustion of 18 Mtpa LNG 51.600 0.051
Total GHG footprint emissions for 18 Mtpa 68.400 0.068
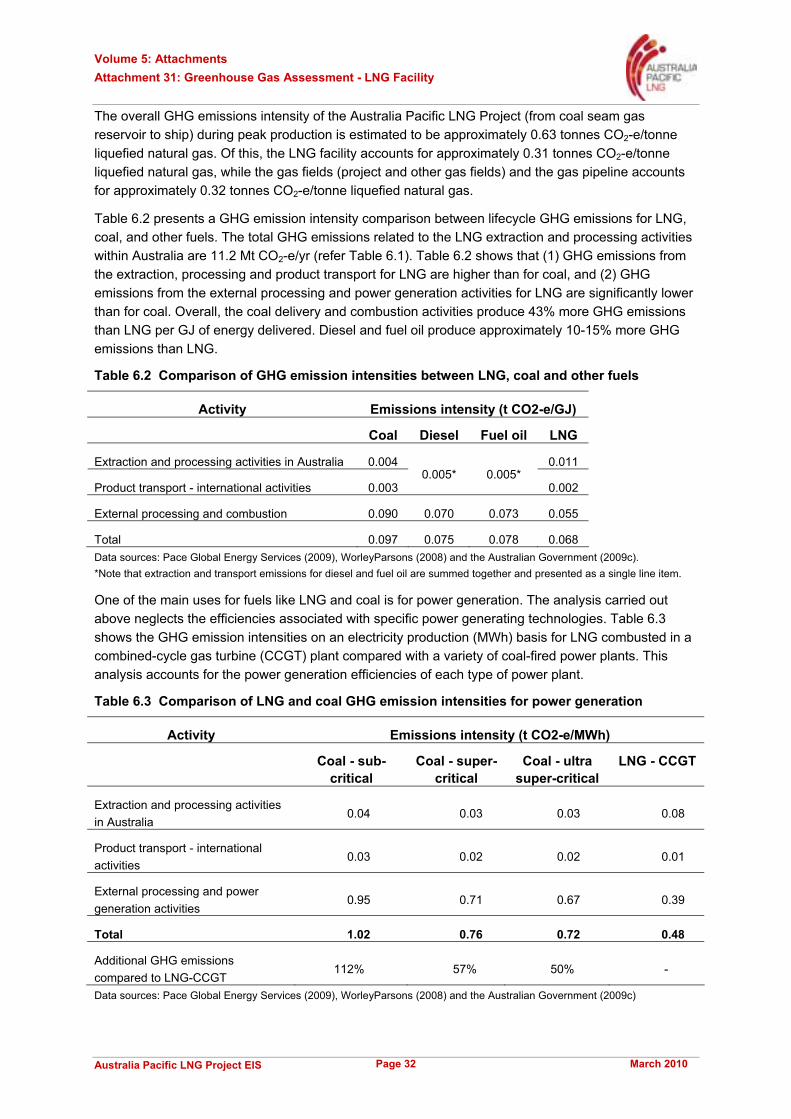
Volume 5: Attachments Attachment 31: Greenhouse Gas Assessment - LNG Facility
Australia Pacific LNG Project EIS March 2010 Page 32
The overall GHG emissions intensity of the Australia Pacific LNG Project (from coal seam gas reservoir to ship) during peak production is estimated to be approximately 0.63 tonnes CO2-e/tonne liquefied natural gas. Of this, the LNG facility accounts for approximately 0.31 tonnes CO2-e/tonne liquefied natural gas, while the gas fields (project and other gas fields) and the gas pipeline accounts for approximately 0.32 tonnes CO2-e/tonne liquefied natural gas.
Table 6.2 presents a GHG emission intensity comparison between lifecycle GHG emissions for LNG, coal, and other fuels. The total GHG emissions related to the LNG extraction and processing activities within Australia are 11.2 Mt CO2-e/yr (refer Table 6.1). Table 6.2 shows that (1) GHG emissions from the extraction, processing and product transport for LNG are higher than for coal, and (2) GHG emissions from the external processing and power generation activities for LNG are significantly lower than for coal. Overall, the coal delivery and combustion activities produce 43% more GHG emissions than LNG per GJ of energy delivered. Diesel and fuel oil produce approximately 10-15% more GHG emissions than LNG.
Table 6.2 Comparison of GHG emission intensities between LNG, coal and other fuels
Activity Emissions intensity (t CO2-e/GJ)
Coal Diesel Fuel oil LNG
Extraction and processing activities in Australia 0.004 0.011
Product transport - international activities 0.003 0.005* 0.005*
0.002
External processing and combustion 0.090 0.070 0.073 0.055
Total 0.097 0.075 0.078 0.068 Data sources: Pace Global Energy Services (2009), WorleyParsons (2008) and the Australian Government (2009c). *Note that extraction and transport emissions for diesel and fuel oil are summed together and presented as a single line item.
One of the main uses for fuels like LNG and coal is for power generation. The analysis carried out above neglects the efficiencies associated with specific power generating technologies. Table 6.3 shows the GHG emission intensities on an electricity production (MWh) basis for LNG combusted in a combined-cycle gas turbine (CCGT) plant compared with a variety of coal-fired power plants. This analysis accounts for the power generation efficiencies of each type of power plant.
Table 6.3 Comparison of LNG and coal GHG emission intensities for power generation
Activity Emissions intensity (t CO2-e/MWh)
Coal - sub- critical
Coal - super-critical
Coal - ultra super-critical
LNG - CCGT
Extraction and processing activities in Australia
0.04 0.03 0.03 0.08
Product transport - international activities
0.03 0.02 0.02 0.01
External processing and power generation activities
0.95 0.71 0.67 0.39
Total 1.02 0.76 0.72 0.48
Additional GHG emissions compared to LNG-CCGT
112% 57% 50% -
Data sources: Pace Global Energy Services (2009), WorleyParsons (2008) and the Australian Government (2009c)

Volume 5: Attachments Attachment 31: Greenhouse Gas Assessment - LNG Facility
Australia Pacific LNG Project EIS March 2010 Page 33
On this basis, LNG combustion in a CCGT is a substantially lower GHG emission generation option with coal combustion in a sub-critical power plant producing 112% more GHG emissions. The more advanced coal-fired generation such as super-critical and ultra super-critical power plants still produce 57% and 50% more GHG emissions, respectively, than LNG combusted in a CCGT. This clearly shows that LNG can be a key fuel in assisting international efforts in the transition to a low-carbon economy.
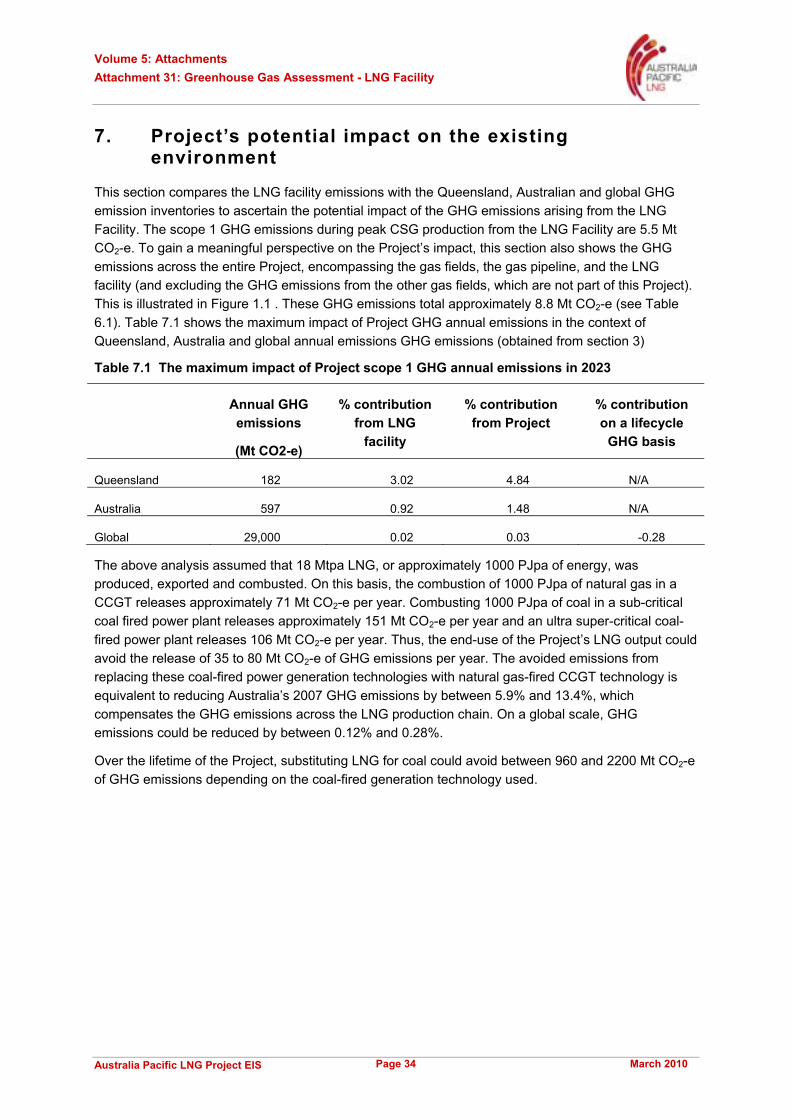
Volume 5: Attachments Attachment 31: Greenhouse Gas Assessment - LNG Facility
Australia Pacific LNG Project EIS March 2010 Page 34
7. Project’s potential impact on the existing environment
This section compares the LNG facility emissions with the Queensland, Australian and global GHG emission inventories to ascertain the potential impact of the GHG emissions arising from the LNG Facility. The scope 1 GHG emissions during peak CSG production from the LNG Facility are 5.5 Mt CO2-e. To gain a meaningful perspective on the Project’s impact, this section also shows the GHG emissions across the entire Project, encompassing the gas fields, the gas pipeline, and the LNG facility (and excluding the GHG emissions from the other gas fields, which are not part of this Project). This is illustrated in Figure 1.1 . These GHG emissions total approximately 8.8 Mt CO2-e (see Table 6.1). Table 7.1 shows the maximum impact of Project GHG annual emissions in the context of Queensland, Australia and global annual emissions GHG emissions (obtained from section 3)
Table 7.1 The maximum impact of Project scope 1 GHG annual emissions in 2023
Annual GHG emissions
(Mt CO2-e)
% contribution from LNG
facility
% contribution from Project
% contribution on a lifecycle
GHG basis
Queensland 182 3.02 4.84 N/A
Australia 597 0.92 1.48 N/A
Global 29,000 0.02 0.03 -0.28
The above analysis assumed that 18 Mtpa LNG, or approximately 1000 PJpa of energy, was produced, exported and combusted. On this basis, the combustion of 1000 PJpa of natural gas in a CCGT releases approximately 71 Mt CO2-e per year. Combusting 1000 PJpa of coal in a sub-critical coal fired power plant releases approximately 151 Mt CO2-e per year and an ultra super-critical coal-fired power plant releases 106 Mt CO2-e per year. Thus, the end-use of the Project’s LNG output could avoid the release of 35 to 80 Mt CO2-e of GHG emissions per year. The avoided emissions from replacing these coal-fired power generation technologies with natural gas-fired CCGT technology is equivalent to reducing Australia’s 2007 GHG emissions by between 5.9% and 13.4%, which compensates the GHG emissions across the LNG production chain. On a global scale, GHG emissions could be reduced by between 0.12% and 0.28%.
Over the lifetime of the Project, substituting LNG for coal could avoid between 960 and 2200 Mt CO2-e of GHG emissions depending on the coal-fired generation technology used.
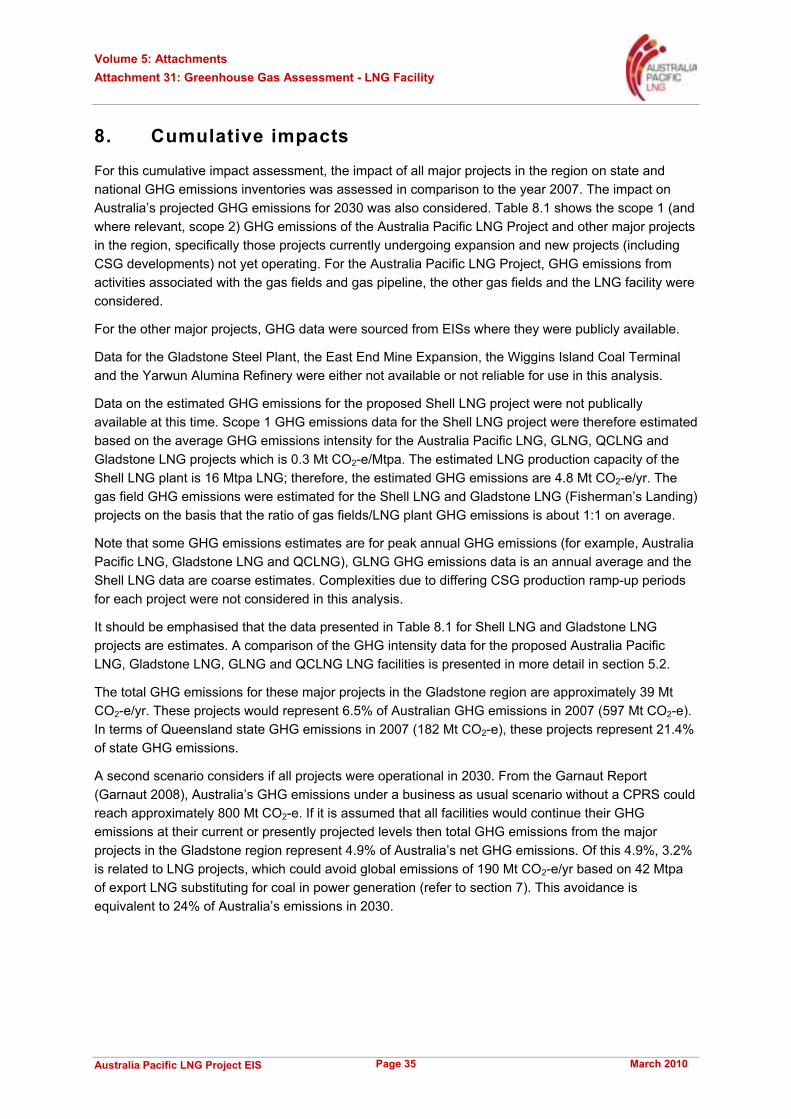
Volume 5: Attachments Attachment 31: Greenhouse Gas Assessment - LNG Facility
Australia Pacific LNG Project EIS March 2010 Page 35
8. Cumulative impacts
For this cumulative impact assessment, the impact of all major projects in the region on state and national GHG emissions inventories was assessed in comparison to the year 2007. The impact on Australia’s projected GHG emissions for 2030 was also considered. Table 8.1 shows the scope 1 (and where relevant, scope 2) GHG emissions of the Australia Pacific LNG Project and other major projects in the region, specifically those projects currently undergoing expansion and new projects (including CSG developments) not yet operating. For the Australia Pacific LNG Project, GHG emissions from activities associated with the gas fields and gas pipeline, the other gas fields and the LNG facility were considered.
For the other major projects, GHG data were sourced from EISs where they were publicly available.
Data for the Gladstone Steel Plant, the East End Mine Expansion, the Wiggins Island Coal Terminal and the Yarwun Alumina Refinery were either not available or not reliable for use in this analysis.
Data on the estimated GHG emissions for the proposed Shell LNG project were not publically available at this time. Scope 1 GHG emissions data for the Shell LNG project were therefore estimated based on the average GHG emissions intensity for the Australia Pacific LNG, GLNG, QCLNG and Gladstone LNG projects which is 0.3 Mt CO2-e/Mtpa. The estimated LNG production capacity of the Shell LNG plant is 16 Mtpa LNG; therefore, the estimated GHG emissions are 4.8 Mt CO2-e/yr. The gas field GHG emissions were estimated for the Shell LNG and Gladstone LNG (Fisherman’s Landing) projects on the basis that the ratio of gas fields/LNG plant GHG emissions is about 1:1 on average.
Note that some GHG emissions estimates are for peak annual GHG emissions (for example, Australia Pacific LNG, Gladstone LNG and QCLNG), GLNG GHG emissions data is an annual average and the Shell LNG data are coarse estimates. Complexities due to differing CSG production ramp-up periods for each project were not considered in this analysis.
It should be emphasised that the data presented in Table 8.1 for Shell LNG and Gladstone LNG projects are estimates. A comparison of the GHG intensity data for the proposed Australia Pacific LNG, Gladstone LNG, GLNG and QCLNG LNG facilities is presented in more detail in section 5.2.
The total GHG emissions for these major projects in the Gladstone region are approximately 39 Mt CO2-e/yr. These projects would represent 6.5% of Australian GHG emissions in 2007 (597 Mt CO2-e). In terms of Queensland state GHG emissions in 2007 (182 Mt CO2-e), these projects represent 21.4% of state GHG emissions.
A second scenario considers if all projects were operational in 2030. From the Garnaut Report (Garnaut 2008), Australia’s GHG emissions under a business as usual scenario without a CPRS could reach approximately 800 Mt CO2-e. If it is assumed that all facilities would continue their GHG emissions at their current or presently projected levels then total GHG emissions from the major projects in the Gladstone region represent 4.9% of Australia’s net GHG emissions. Of this 4.9%, 3.2% is related to LNG projects, which could avoid global emissions of 190 Mt CO2-e/yr based on 42 Mtpa of export LNG substituting for coal in power generation (refer to section 7). This avoidance is equivalent to 24% of Australia’s emissions in 2030.
Volu
me
5: A
ttach
men
ts
Atta
chm
ent 3
1: G
reen
hous
e G
as A
sses
smen
t - L
NG
Fac
ility
A
ustr
alia
Pac
ific
LNG
Pro
ject
EIS
M
arch
201
0 Pa
ge 3
6
Tabl
e 8.
1 S
umm
ary
of G
HG
em
issi
ons
for m
ajor
pro
ject
s in
the
Gla
dsto
ne re
gion
Proj
ect
Emis
sion
s da
taM
t CO
2-e/
yr
Aus
tralia
Pac
ific
LNG
3.
3 E
stim
ated
ann
ual s
cope
1 G
HG
em
issi
ons
for t
he P
roje
ct g
as fi
elds
and
the
gas
pipe
line
durin
g pe
ak L
NG
pr
oduc
tion.
2.
4 E
stim
ated
ann
ual s
cope
1 G
HG
em
issi
ons
from
oth
er g
as fi
elds
dur
ing
peak
LN
G p
rodu
ctio
n.
5.
5 E
stim
ated
ann
ual s
cope
1 G
HG
em
issi
ons
for t
he A
ustra
lia P
acifi
c LN
G fa
cilit
y w
ith fo
ur-tr
ain
oper
atio
ns
prod
ucin
g 18
Mtp
a of
LN
G
Bou
lder
Ste
el
n/a
Gla
dsto
ne S
teel
Pla
nt p
roje
ct. E
IS d
ue to
be
lodg
ed; G
HG
dat
a no
t pub
lical
ly a
vaila
ble
(refe
r Bou
lder
Ste
el
2009
)
Boyn
e Sm
elte
rs R
educ
tion
Line
Ex
pans
ion
3.1
Tota
l sco
pe 1
and
2 G
HG
em
issi
ons
for t
he e
xpan
sion
of p
lant
’s 3
redu
ctio
n lin
es (r
efer
Boy
ne S
mel
ters
200
2)
East
End
Min
e Ex
pans
ion
n/a
GH
G d
ata
is n
ot p
ublic
ally
ava
ilabl
e
GLN
G F
acilit
y 3.
7
3.5
Ave
rage
ann
ual s
cope
1 G
HG
em
issi
ons
for t
he 1
0 M
tpa
case
usi
ng th
e up
per l
imit
GH
G e
mis
sion
s; c
over
s op
erat
ions
and
land
-cle
arin
g (r
efer
GN
LG 2
009)
Aver
age
annu
al s
cope
1 e
mis
sion
s (1
0 M
tpa)
ass
umin
g C
oP O
CP
tech
nolo
gy is
ado
pted
Gla
dsto
ne L
NG
(Fis
herm
an’s
La
ndin
g)
0.6
0.6
Est
imat
ed s
cope
1 G
HG
em
issi
ons
for g
as fi
eld
and
pipe
line
oper
atio
ns c
arrie
d ou
t by
Arro
w E
nerg
y/A
GL
(refe
r G
lads
tone
LN
G 2
008)
.
Est
imat
ed m
axim
um a
nnua
l sco
pe 1
and
2 G
HG
em
issi
ons
for 2
Tra
ins
(3 M
tpa)
Gla
dsto
ne P
acifi
c N
icke
l 0.
2
0.6
Sta
ge 1
em
issi
ons:
sco
pe 1
and
2 G
HG
em
issi
ons
per a
nnum
(ref
er G
lads
tone
Pac
ific
Nic
kel 2
009,
App
endi
x M
)
Sta
ge 2
em
issi
ons:
sco
pe 1
and
2 G
HG
em
issi
ons
per a
nnum
Mou
ra L
ink
Rai
lway
0.5
Sco
pe 1
and
2 G
HG
em
issi
ons
per a
nnum
(ref
er Q
ueen
slan
d R
ail 2
008,
sec
tion
10)
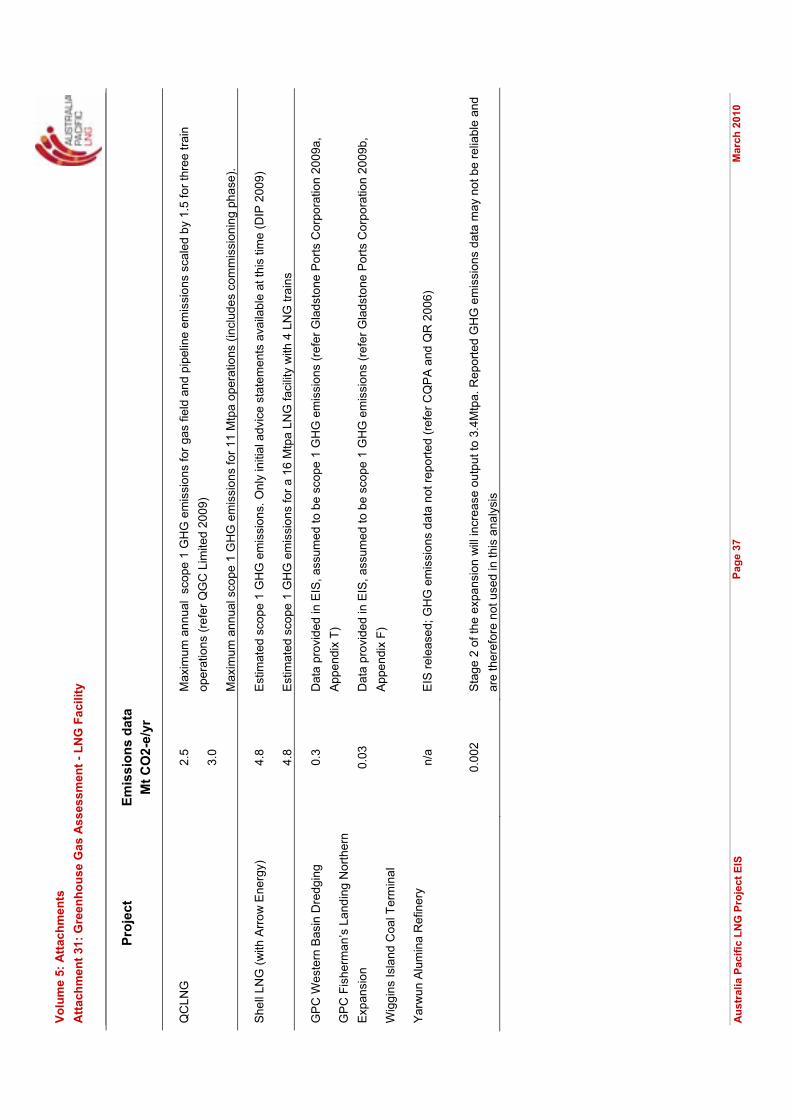
Volu
me
5: A
ttach
men
ts
Atta
chm
ent 3
1: G
reen
hous
e G
as A
sses
smen
t - L
NG
Fac
ility
A
ustr
alia
Pac
ific
LNG
Pro
ject
EIS
M
arch
201
0 Pa
ge 3
7
Proj
ect
Emis
sion
s da
taM
t CO
2-e/
yr
QC
LNG
2.
5
3.0
Max
imum
ann
ual
scop
e 1
GH
G e
mis
sion
s fo
r gas
fiel
d an
d pi
pelin
e em
issi
ons
scal
ed b
y 1.
5 fo
r thr
ee tr
ain
oper
atio
ns (r
efer
QG
C L
imite
d 20
09)
Max
imum
ann
ual s
cope
1 G
HG
em
issi
ons
for 1
1 M
tpa
oper
atio
ns (i
nclu
des
com
mis
sion
ing
phas
e).
She
ll LN
G (w
ith A
rrow
Ene
rgy)
4.
8
4.8
Est
imat
ed s
cope
1 G
HG
em
issi
ons.
Onl
y in
itial
adv
ice
stat
emen
ts a
vaila
ble
at th
is ti
me
(DIP
200
9)
Est
imat
ed s
cope
1 G
HG
em
issi
ons
for a
16
Mtp
a LN
G fa
cilit
y w
ith 4
LN
G tr
ains
GPC
Wes
tern
Bas
in D
redg
ing
GP
C F
ishe
rman
’s L
andi
ng N
orth
ern
Expa
nsio
n
Wig
gins
Isla
nd C
oal T
erm
inal
Yar
wun
Alu
min
a R
efin
ery
0.3
0.03
n/
a 0.
002
Dat
a pr
ovid
ed in
EIS
, ass
umed
to b
e sc
ope
1 G
HG
em
issi
ons
(refe
r Gla
dsto
ne P
orts
Cor
pora
tion
2009
a,
Appe
ndix
T)
Dat
a pr
ovid
ed in
EIS
, ass
umed
to b
e sc
ope
1 G
HG
em
issi
ons
(refe
r Gla
dsto
ne P
orts
Cor
pora
tion
2009
b,
Appe
ndix
F)
EIS
rele
ased
; GH
G e
mis
sion
s da
ta n
ot re
porte
d (re
fer C
QP
A a
nd Q
R 2
006)
Sta
ge 2
of t
he e
xpan
sion
will
incr
ease
out
put t
o 3.
4Mtp
a. R
epor
ted
GH
G e
mis
sion
s da
ta m
ay n
ot b
e re
liabl
e an
d ar
e th
eref
ore
not u
sed
in th
is a
naly
sis
Volume 5: Attachments Attachment 31: Greenhouse Gas Assessment - LNG Facility
Australia Pacific LNG Project EIS March 2010 Page 38
9. Conclusions
The projected LNG facility GHG emissions inventory shows that for the operation of four LNG trains, the scope 1 GHG emissions per annum are approximately 5.5 million tonnes CO2-e at a GHG emission intensity of approximately 0.31 tonnes CO2-e/tonne LNG produced. The intensity of the Australia Pacific LNG facility is amongst the lowest in the world. The GHG emissions intensity overall (i.e. “coal seam gas reservoir to ship”) is approximately 0.63 tonnes CO2-e/tonne LNG (based on 11.2 Mt CO2-e emissions/18 MTPA LNG).
The emissions projection for the Australia Pacific LNG facility is dominated by scope 1 GHG emissions sources that combust coal seam gas i.e. the refrigeration/compressor gas turbines and the power generation turbines and reservoir CO2.
Over the Project lifetime, the scope 1 and relevant scope 3 GHG emissions for the LNG facility component of the Project total approximately 169 million tonnes CO2-e.
Measures to mitigate GHG emissions from the LNG facility that have been implemented in the Project include:
� Use of the ConocoPhillips’ proprietary Optimized Cascade® technology.
� High efficiency aero-derivative turbines to drive the process compressors.
� Waste heat recovery for process heat duties.
� Installation of boil-off gas compression facilities to recover vapours generated from the LNG tanks during production and from the export vessels during LNG loading.
A number of other GHG mitigation measures have also been included, while other measures are being considered for possible future implementation.
The above-mentioned measures will result in a reduction in GHG emissions of approximately 1.55 million tonnes CO2-e/yr for the operation of four-trains, or approximately 21% of scope 1 GHG emissions compared with the reference case. Australia Pacific LNG’s policy is to continually develop and deploy innovative technologies to mitigate GHG emissions and to encourage energy efficiency at all stages. As a result, the above GHG mitigation opportunities have been incorporated into the design phase of the project and further mitigation will be investigated as the design matures.
The GHG emission inventory of the Project was benchmarked against the national and the state inventory. The GHG emissions associated with the LNG facility represent 0.9% of Australia’s 2007 national GHG emissions inventory and 3.0% of Queensland ’s 2007 GHG emissions. In terms of global GHG emissions the LNG facility represents approximately 0.02%.
The Project’s addition to the Queensland, Australian and global GHG emissions inventories is offset by the Project’s potential reduction of global GHG emissions. This report shows the results of a lifecycle GHG assessment of natural gas-fired electricity generation compared with coal-fired generation. The primary conclusion was that LNG combustion in a CCGT is substantially lower in GHG emissions than coal combustion in a sub-critical power plant which produces 112% more GHG emissions. The more advanced coal-fired generation such as super-critical and ultra super-critical power plants still produce 57% and 50% more GHG emissions, respectively. This clearly shows that LNG can be a key fuel in assisting international efforts in the transition to a low-carbon economy.
This study shows that global GHG emissions could be reduced by 0.28% if the Project’s peak LNG output of 18 Mtpa is used to generate electricity in place of sub-critical coal-fired power generation.
Volume 5: Attachments Attachment 31: Greenhouse Gas Assessment - LNG Facility
Australia Pacific LNG Project EIS March 2010 Page 39
References
American Petroleum Institute Compendium(API) 2004 Compendium of Greenhouse Gas Emissions Methodologies for the Oil and Gas Industry.
Australian Government 2006 Energy Efficiencies Opportunities Act.
Australian Government 2008a Carbon pollution reduction scheme, white paper, Chapter 12.
Australian Government 2008b National Greenhouse and Energy Reporting Act 2007
Australian Government 2008c National Greenhouse and Energy Reporting (Measurement) Technical Guidelines 2008 v1.1.
Australian Government, 2009a New measures for the Carbon Pollution Reduction Scheme
Australian Government 2009b National greenhouse accounts factors
Australian Government 2009c Reporting year 2007, Kyoto Protocol Accounting Framework http://www.ageis.greenhouse.gov.au/
Australian Government 2008d National Greenhouse and Energy Reporting (Measurement) Technical Guidelines 2008 v1.1.
Boulder Steel Limited 2009 Gladstone Steel Project http://www.bouldersteel.com.au/pagecontent/datelist/ASX-Ann-2009-Sept-09-CommunityConsultationPresentation1.pdf
Boyne Smelters Limited 2002 Comalco Smelter Development, Boyne Island Aluminium Smelter – extension of reduction lines: Environmental Impact Statement. Sinclair Knight Merz, Brisbane.
Department of Infrastructure and Planning (DIP), Queensland Government, 2009 http://www.dip.qld.gov.au/projects/energy/gas/shell-australia-lng.html
Central Queensland Ports Authority and Queensland Rail (CQPA and QR) 2006 Wiggins Island Coal Terminal EIS, http://www.cqpa.com.au/Pages/Publications/Wiggins.htm
Garnaut, R 2008 The Garnaut Climate Change Review-final report. Cambridge University Press, Chapter 12, p. 284
GLNG 2009a Environmental Impact Statement. Available: http://www.glng.com.au/Content.aspx?p=90
GLNG 2009b Supplementary Environmental Statement, http://www.glng.com.au/library/Part_3_K_Greenhouse_Gas_Emissions.pdf
Gladstone LNG Pty Ltd. 2008. Gladstone LNG Project – Fisherman’s Landing: Environmental Impact Statement. WorleyParsons, Brisbane.
Gladstone Pacific Ltd 2009 Gladstone Nickel Project http://www.gladstonepacific.com.au/index.php?src=gendocs&link=environmental%20impact%20statement&category=environment
Gladstone Ports Corporation 2009a Port of Gladstone western basin dredging and disposal project: Environmental Impact Statement http://www.gpcl.com.au/Project_Western_Basin_Dredging_&_Disposal_EIS.html
Volume 5: Attachments Attachment 31: Greenhouse Gas Assessment - LNG Facility
Australia Pacific LNG Project EIS March 2010 Page 40
Gladstone Ports Corporation 2009b Report for Fisherman's Landing Northern Expansion Greenhouse Gas Assessment: http://www.gpcl.com.au/Project_Fishermans_Landing_Northern_Expansion_Project_EIS.html
Hammond, G.P and Jones, C.I 2008 Inventory of embodied carbon and energy (ICE), Department of Mechanical Engineering, University of Bath, United Kingdom.
Heede, R 2006 LNG supply chain greenhouse gas emissions for the Cabrillo Deepwater Port: natural gas from Australia to California
Intergovernmental Panel on Climate Change (IPCC), 2001, Climate Change, 2001. A Report of working group III of the Intergovernmental Panel on Climate Change, Chapter 3.
Intergovernmental Panel on Climate Change (IPCC), 2007. Fourth Assessment Report. Synthesis Report. Cambridge University Press.
http://www.shell.com/static/au-en/downloads/about_shell/prelude/completeeisdoclowres.pdf
Pace Global Energy Services 2009 Life Cycle Assessment of GHG Emissions from LNG and Coal Fired Generation Scenarios: Assumptions and Results
Petroleum Exploration Society of Australia (PESA) 2009, Newsletter, Issue 98, February-March 2009, Source: http://www.pesa.com.au/publications/pesa_news/feb_mar_09/pesanews_9813.html
Queensland Government 2007 ClimateSmart 2050: Queensland climate change strategy 2007: a low carbon future.
Queensland Government 2009 ClimateQ: toward a greener Queensland. Source http://www.climatechange.qld.gov.au/whats_being_done/queensland_climate_change_strategy.
Queensland Rail 2008 Moura Link – Aldoga Rail Project: Environmental Impact Statement. Available: http://www.qrnetwork.com.au/infrastructure-investments/projects/Moura-link-Aldoga-rail-EIS.aspx
QGC 2009. Queensland Curtis LNG: Environmental Impact Statement http://qclng.com.au/eis/draft-eis/
Shell 2009 Prelude floating LNG project draft environmental impact statement, source: http://www.shell.com/static/au-en/downloads/about_shell/prelude/completeeisdoclowres.pdf
UNFCCC 2009, National inventory greenhouse data for the period 1990-2007.
UNFCCC 2005, Sixth compilation and synthesis of initial national communications from Parties not included in Annex I to the Convention.
US Environmental Protection Agency (US-EPA) 1998 AP 42 Compilation of air pollutant emission factors, volume 1: stationary point and area sources
World Business Council for Sustainable Development and the World Resource Institute 2004 The Greenhouse Gas Protocol: A Corporate Accounting and Reporting Standard.
WorleyParsons 2008 Confidential report
Volume 5: Attachments Attachment 31: Greenhouse Gas Assessment - LNG Facility
Australia Pacific LNG Project EIS March 2010 Page 41
Appendix A Abbreviations and glossary of terms Abbreviations
BOG Boil Off Gas
LNG Liquefied Natural Gas
NRU Nitrogen Removal Unit
AGRU Acid Gas Removal Unit
CO2 carbon dioxide
CH4 Methane
CSG Coal seam gas
CCGT Combined cycle gas turbine
EITE Emissions-intensive trade-exposed industry
MOF Material Offloading Facility
N2O nitrous oxide
NGER Act National Greenhouse and Energy Reporting Act (2007)
GHG Greenhouse gases
GJ gigajoule (109 joules)
TJ terajoule (1012 joules)
PJ petajoule (1015 joules)
Mtpa million tonnes per annum
t CO2-e tonnes CO2- equivalent
Mt CO2-e million tonnes CO2-equivalent
Glossary of terms
LNG Train An LNG train is the term used to describe the liquefaction and purification facilities in a liquefied natural gas plant
Scope 1 emission Refers to direct greenhouse gas emissions arising from generation of heat, steam and electricity from fuel combustion; manufacturing processes that produce emissions; transport of materials, waste and people; fugitive or unintentional releases of greenhouse gases from pipes and joints; and on-site waste management.
Scope 2 emission Refers to emissions from the generation of electricity purchased and consumed by an end user
Scope 3 emission Refers to emissions related to the activities of the reporting entity but arising outside the reporting boundary.
Carbon dioxide The key greenhouse gases in this Project are carbon dioxide, methane and
Volume 5: Attachments Attachment 31: Greenhouse Gas Assessment - LNG Facility
Australia Pacific LNG Project EIS March 2010 Page 42
equivalent nitrous oxide. To simplify the accounting of GHGs, the unit of a carbon dioxide equivalent or CO2-e is used. This ensures that the global warming potential of each gas is accounted for. Carbon dioxide has a global warming potential of 1, methane has a global warming potential of 21, and nitrous oxide has a global warming potential of 310.
Transition fuel As the world moves toward cleaner energy sources such as renewable energy (e.g. solar, wind and wave power), fossil fuels will continue to be used to provide energy generation. Black coal is currently the most greenhouse gas intensive fuel, but LNG is much less intensive and is seen as part of the transition to cleaner, renewable energy sources.
LULUCF Land use, land use change and forestry. Under the UNFCCC this is a greenhouse gas inventory sector that covers emissions and removals of greenhouse gases resulting from direct human-induced land use, land-use change and forestry activities