Embed Size (px)
Citation preview
Australia Pacific LNG Project Supplemental information to the EIS Air Quality Impact Assessment Gas Fields
Air Quality Impact Assessment – Gas Fields
Australia Pacific LNG Project EIS Page ii August 2010 Rev 0
Disclaimer
This report has been prepared on behalf of and for the exclusive use of Australia Pacific LNG Pty Limited, and is subject to and issued in accordance with the agreement between Australia Pacific LNG Pty Limited and WorleyParsons Services Pty Ltd. WorleyParsons Services Pty Ltd accepts no liability or responsibility whatsoever for it in respect of any use of or reliance upon this report by any third party.
Copying this report without the permission of Australia Pacific LNG Pty Limited or WorleyParsons is not permitted.
AUSTRALIA PACIFIC LNG GAS FIELDS SUPPLEMENTARY AIR QUALITY IMPACT ASSESSMENT Prepared for
WorleyParsons KE1005947 August 2010
Final Prepared by Katestone Environmental Pty Ltd ABN 92 097 270 276 Terrace 5, 249 Coronation Drive PO Box 2217 Milton, Queensland, Australia 4064
www.katestone.com.au [email protected]
Ph +61 7 3369 3699 Fax +61 7 3369 1966
Document Quality Details
Job Number:
Title: Australia Pacific LNG Project
Client:
Document reference: 301001-00448-00-EN-REP-0255_Air Quality_Rev0_Print.doc
Prepared by: Andrew Vernon
Reviewed by: Simon Welchman
Revision Date Approved Signature
Final 1.0 13/7/10 Simon Welchman
Disclaimer This document is intended only for its named addressee and may not be relied upon by any other person. Katestone Environmental Pty Ltd disclaims any and all liability for damages of whatsoever nature to any other party and accepts no responsibility for any damages of whatsoever nature, however caused arising from misapplication or misinterpretation by third parties of the contents of this document. This document has been prepared with all due care and attention by professional scientists and engineers according to accepted practices and techniques. This document is issued in confidence and is relevant only to the issues pertinent to the subject matter contained herein. Katestone Environmental accepts no responsibility for any misuse or application of the material set out in this document for any purpose other than the purpose for which it is provided. Where site inspections, testing or fieldwork have taken place, the report is based on the information made available by the client, their employees, agents or nominees during the visit, visual observations and any subsequent discussions with regulatory authorities. The validity and comprehensiveness of supplied information has not been independently verified except where expressly stated and, for the purposes of this report, it is assumed that the information provided to Katestone Environmental Pty. Ltd. is both complete and accurate. Copyright This document, electronic files or software are the copyright property of Katestone Environmental Pty. Ltd. and the information contained therein is solely for the use of the authorised recipient and may not be used, copied or reproduced in whole or part for any purpose without the prior written authority of Katestone Environmental Pty. Ltd. Katestone Environmental Pty. Ltd. makes no representation, undertakes no duty and accepts no responsibility to any third party who may use or rely upon this document, electronic files or software or the information contained therein. © Copyright Katestone Environmental Pty. Ltd.
Katestone Environmental Pty Ltd
WorleyParsons Australia Pacific LNG Gas Fields Supplementary
August 2010
Page i
Contents 1. Introduction .........................................................................................................................1
2. SAQIA Methodology ...........................................................................................................2
2.1 Pre-FEED Design Changes................................................................................................2
2.2 Assessment Methodology...................................................................................................3
1.1.1 Scenario 1 - Australia Pacific LNG gas field ..................................................................3
1.1.2 Scenario 2 - Gas wells case study.................................................................................4
3. Emissions............................................................................................................................5
3.1 TM2500 Gas Turbines.......................................................................................................5
3.2 Gas Wells............................................................................................................................6
3.3 Existing Talinga Gas Processing Facility............................................................................7
4. Air Quality Criteria.............................................................................................................10
4.1 Queensland Environmental Protection Policies ...............................................................10
4.2 National Environment Protection Measure .......................................................................11
4.3 Relevant Ambient Air Quality Goals for the Project..........................................................11
5. Scenario 1 – Australia Pacific LNG entire gas field results ..............................................14
5.1 Nitrogen dioxide and carbon monoxide ............................................................................14
5.2 Hydrocarbons ...................................................................................................................15
5.3 Comparison with EIS results ............................................................................................16
6. Scenario 2 – ‘Undullah Nose’ case study results .............................................................17
6.1 Nitrogen dioxide................................................................................................................17
7. Cumulative Impacts with Third Party Gas Producers.......................................................19
8. Conclusion ........................................................................................................................20
9. References .......................................................................................................................22
Tables Table 1 Source characteristics of the TM2500+ gas turbine under normal operating conditions at 100% capacity..................................................................................................................................... 5
Table 2 Exhaust concentrations and emission rates of NOx, CO and hydrocarbons from a TM2500+ gas turbine under normal operating conditions at 100% capacity...................................... 6
Katestone Environmental Pty Ltd
WorleyParsons Australia Pacific LNG Gas Fields Supplementary
August 2010
Page ii
Table 3 Source characteristics of the gas well engines under normal operating conditions at 100% capacity ........................................................................................................................................ 7
Table 4 Exhaust concentrations and emission rates of NOx from the gas well engines under normal operating conditions at 100% capacity ................................................................................... 7
Table 5 Emission source characteristics of the gas-fired engines used at the Talinga GPF at maximum load (90 TJ/day).................................................................................................................. 8
Table 6 Exhaust gas concentrations and emission rates of criteria pollutants for the existing Talinga GPF at maximum load (90 TJ/day) ........................................................................................ 9
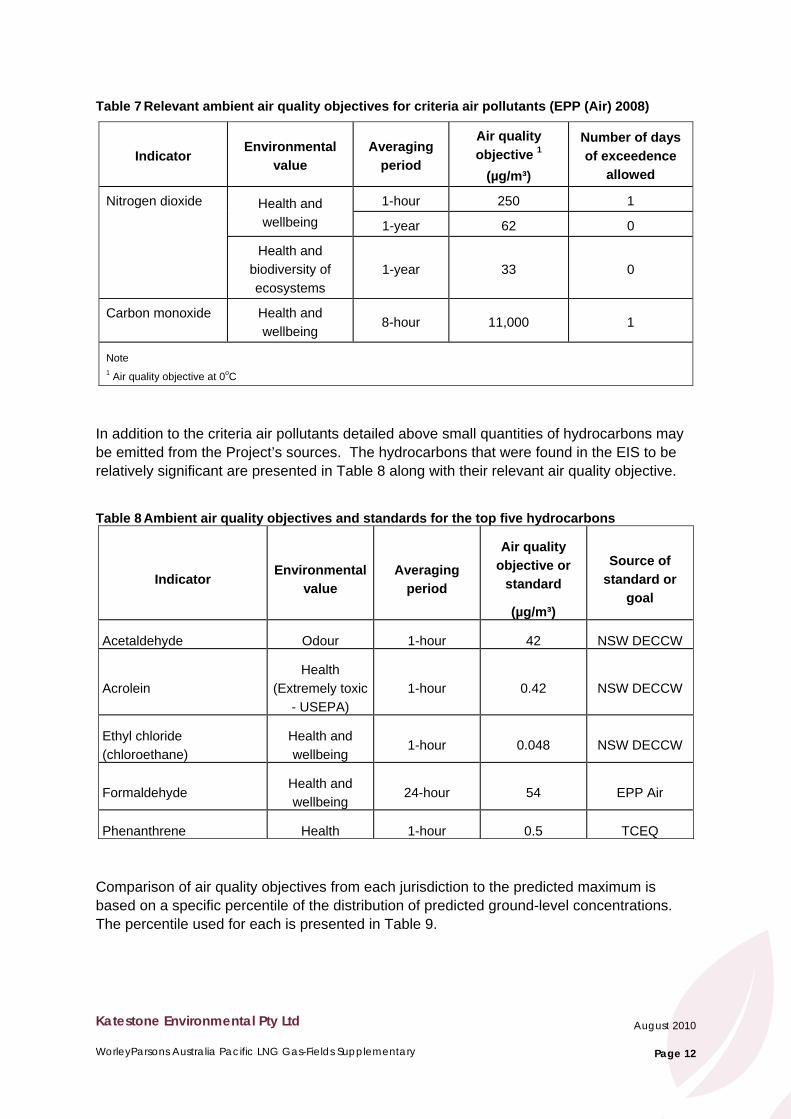
Table 7 Relevant ambient air quality objectives for criteria air pollutants (EPP (Air) 2008) ...... 12
Table 8 Ambient air quality objectives and standards for the top five hydrocarbons................. 12
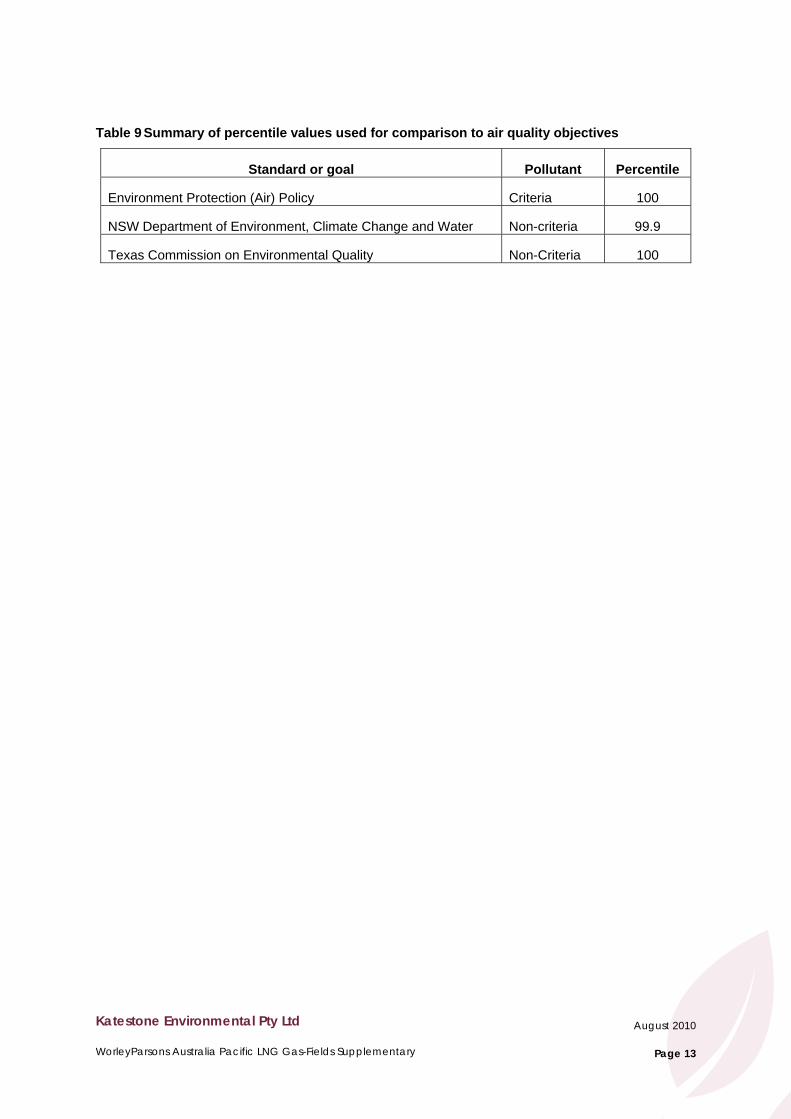
Table 9 Summary of percentile values used for comparison to air quality objectives ............... 13
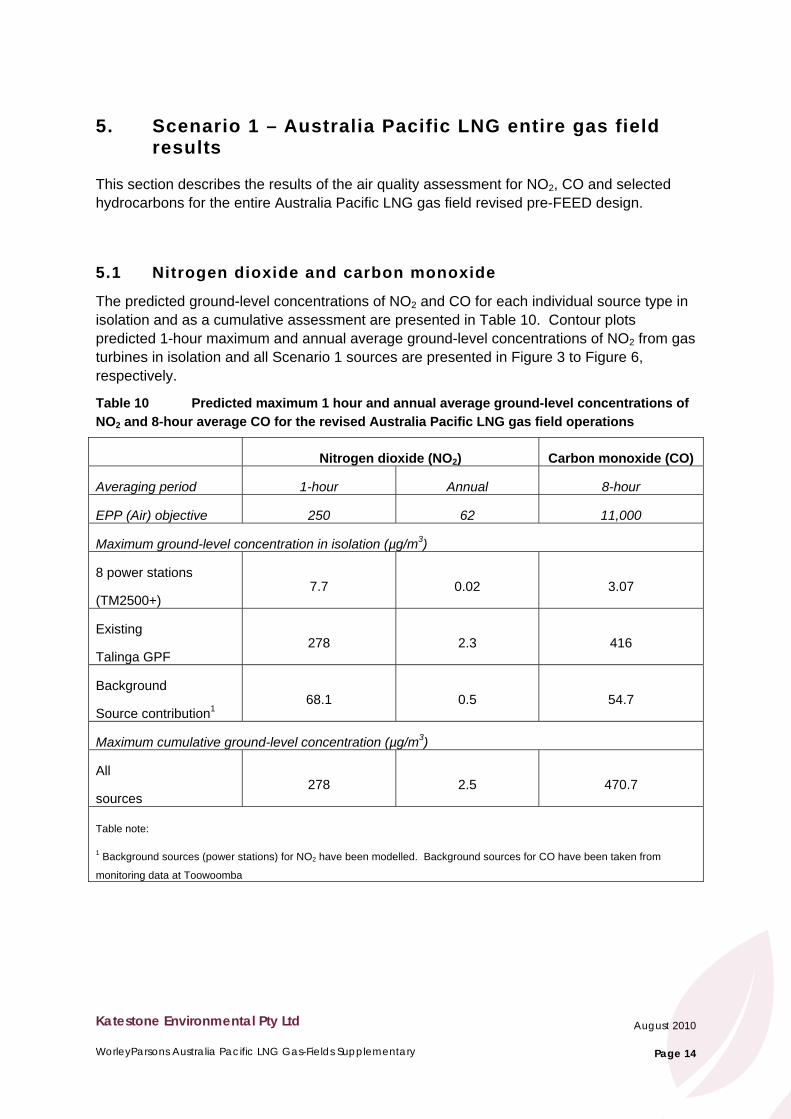
Table 10 Predicted maximum 1 hour and annual average ground-level concentrations of NO2 and 8-hour average CO for the revised Australia Pacific LNG gas field operations................................ 14
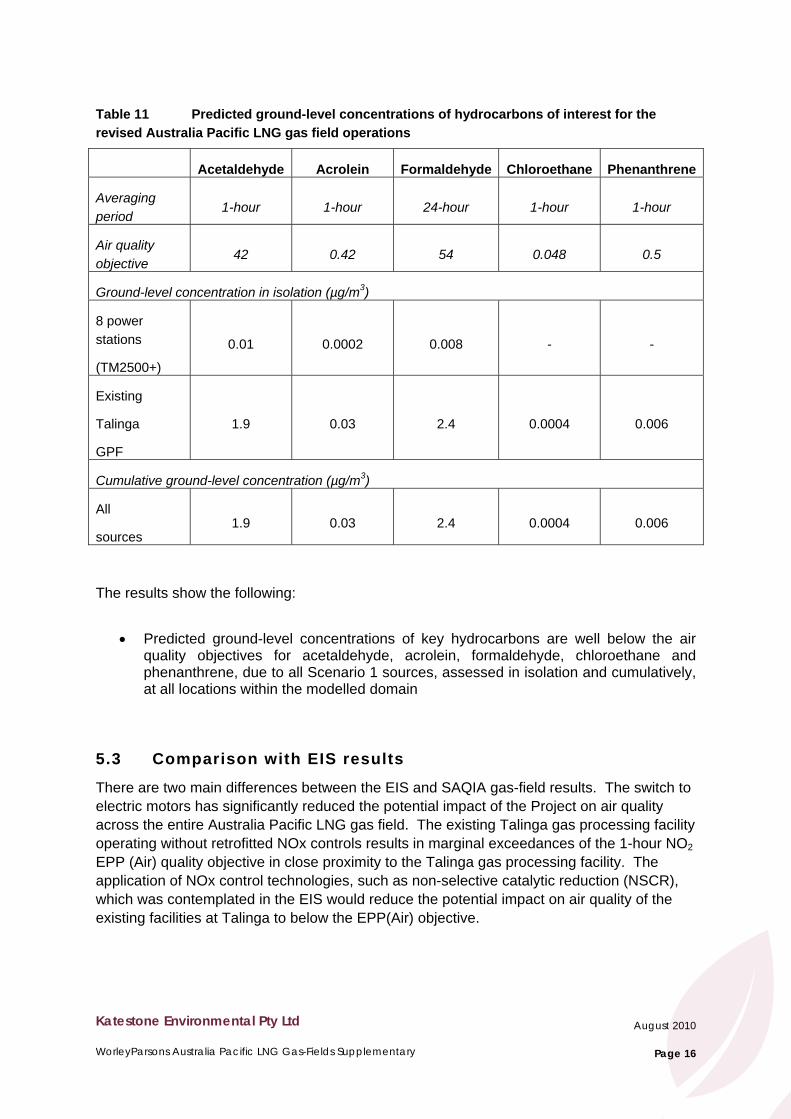
Table 11 Predicted ground-level concentrations of hydrocarbons of interest for the revised Australia Pacific LNG gas field operations........................................................................................ 16
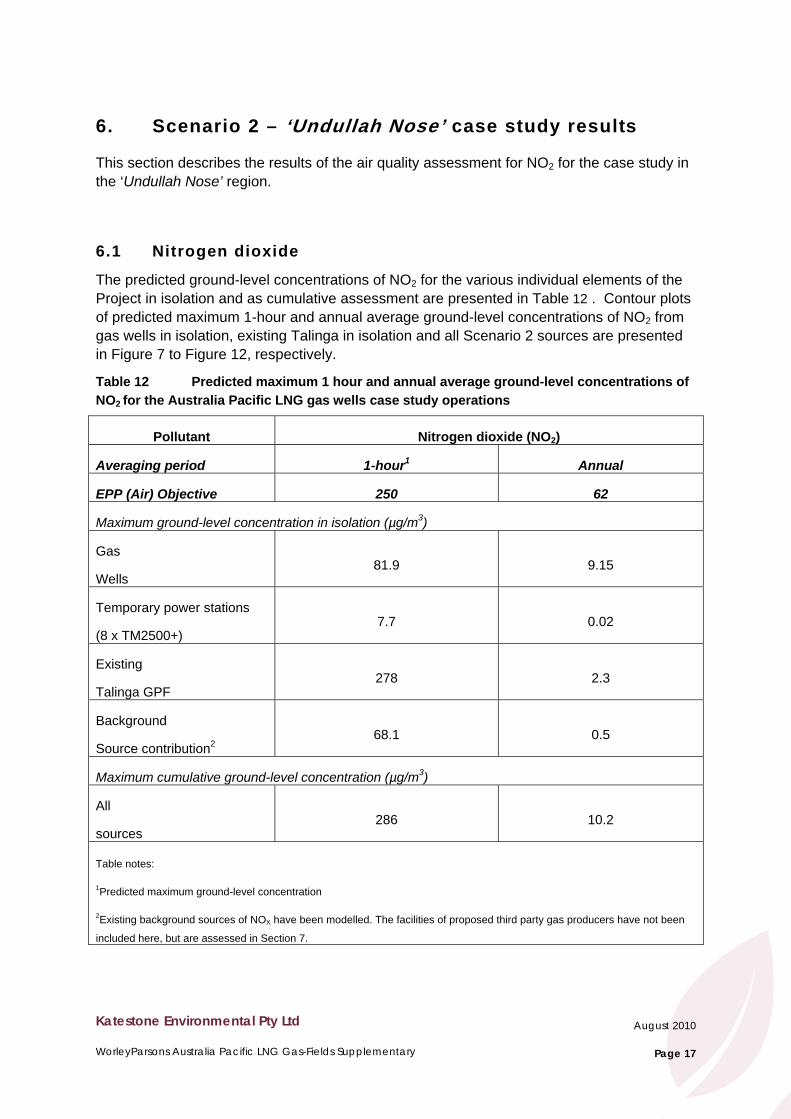
Table 12 Predicted maximum 1 hour and annual average ground-level concentrations of NO2 for the Australia Pacific LNG gas wells case study operations .............................................................. 17
Figures Figure 1 Map showing the proposed location of revised pre-FEED design air emission sources23
Figure 2 Map showing the proposed location of gas wells in the Talinga, Orana and Condabri Australia Pacific LNG tenements ...................................................................................................... 24
Figure 3 Predicted maximum 1-hour average ground-level concentrations for NO2 from eight TM2500+ gas turbines ...................................................................................................................... 25
Figure 4 Predicted annual average ground-level concentrations for NO2 from eight TM2500+ gas turbines ...................................................................................................................................... 26
Figure 5 Predicted cumulative maximum 1-hour average ground-level concentrations for NO2 from all Scenario 1 sources....................................................................................................................... 27
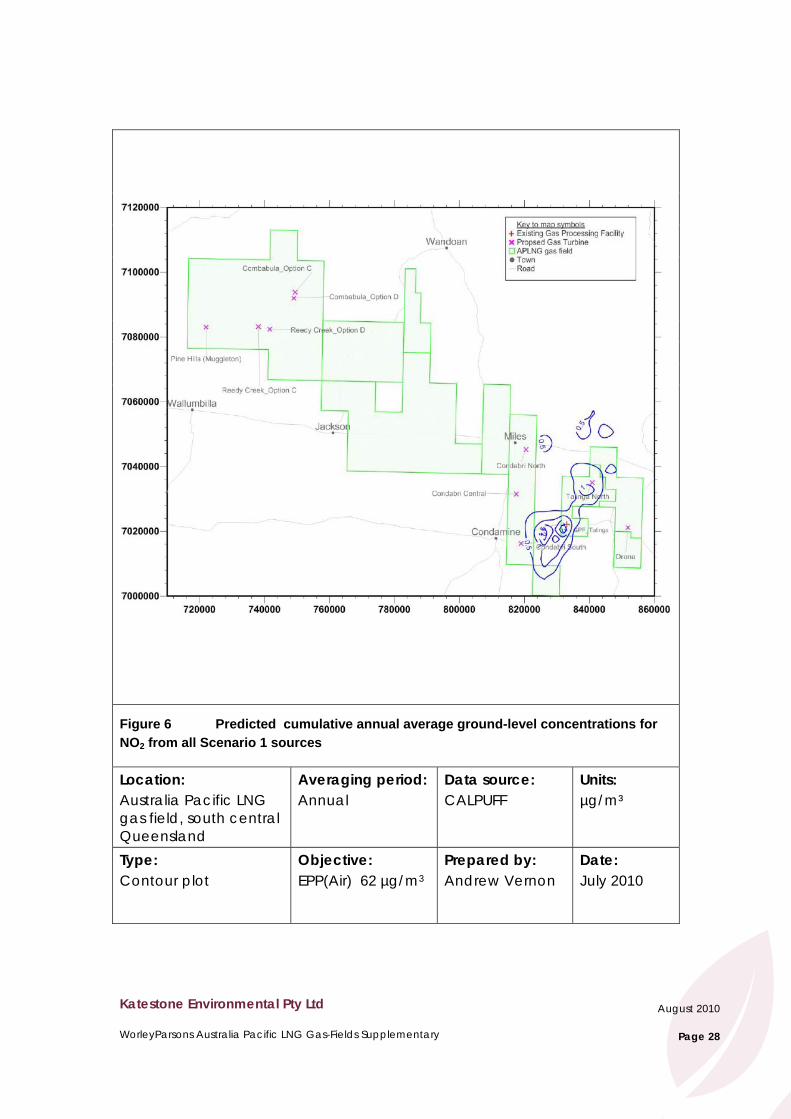
Figure 6 Predicted cumulative annual average ground-level concentrations for NO2 from all Scenario 1 sources ........................................................................................................................... 28
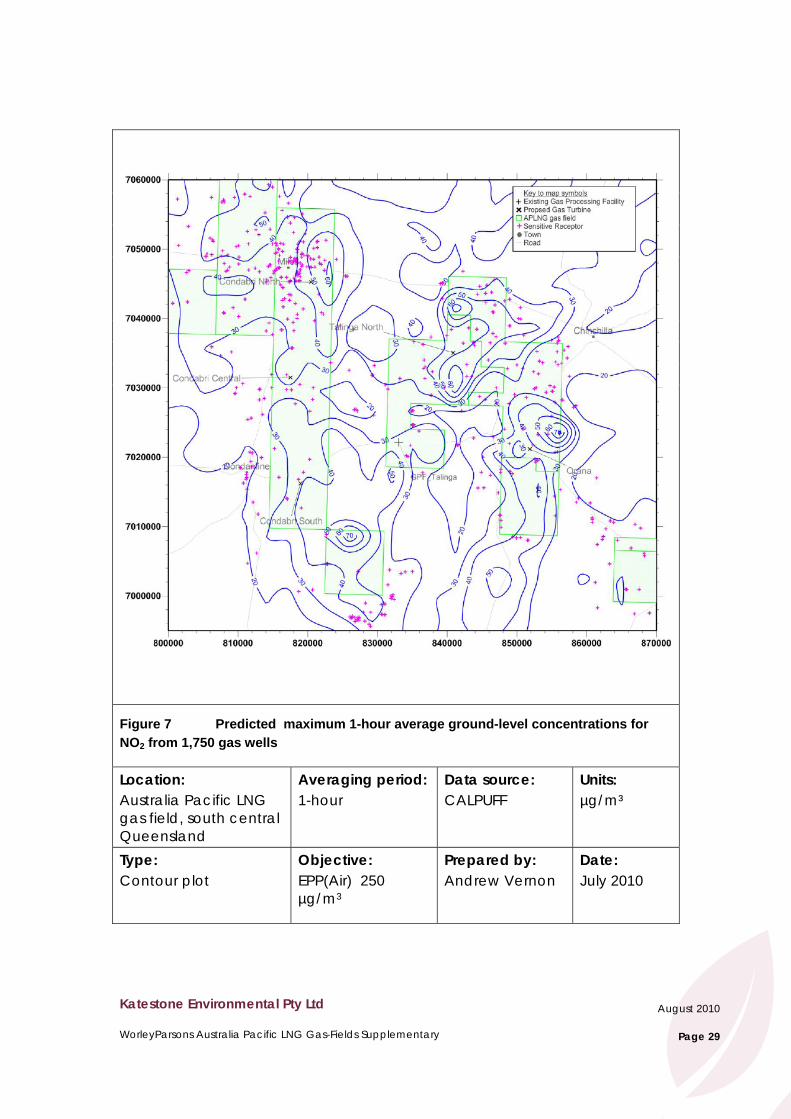
Figure 7 Predicted maximum 1-hour average ground-level concentrations for NO2 from 1,750 gas wells ...................................................................................................................................... 29
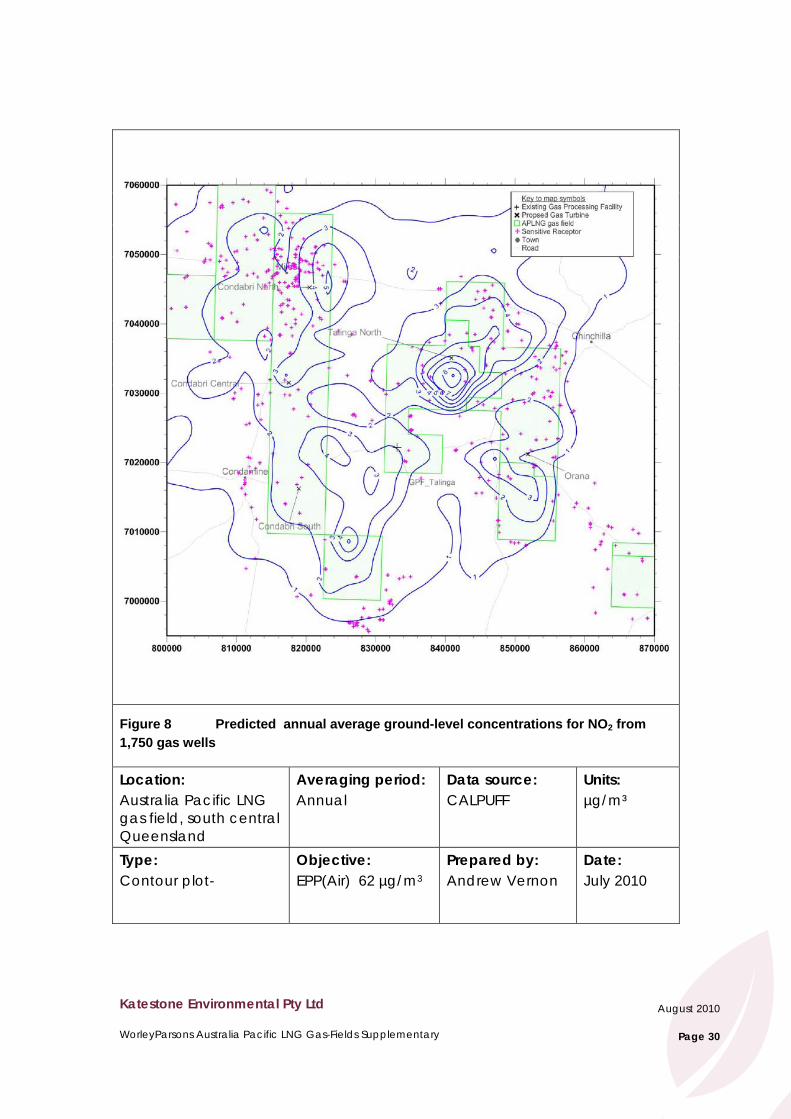
Figure 8 Predicted annual average ground-level concentrations for NO2 from 1,750 gas wells 30
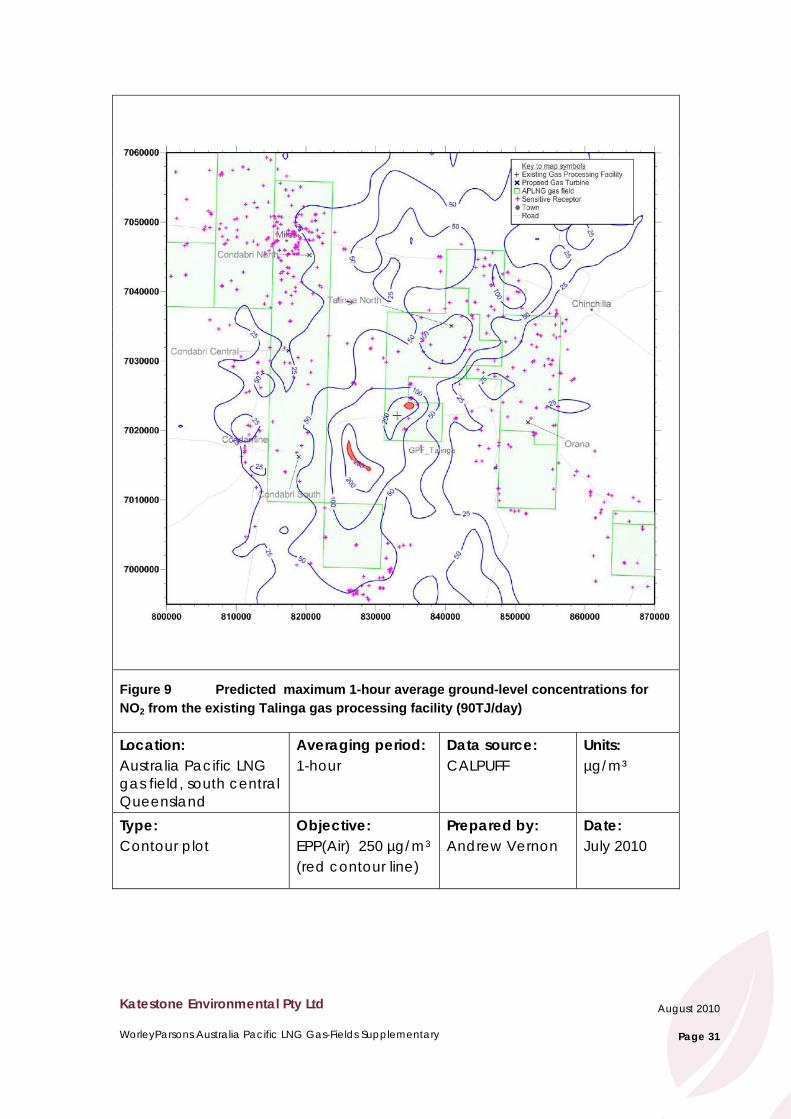
Figure 9 Predicted maximum 1-hour average ground-level concentrations for NO2 from the existing Talinga gas processing facility (90TJ/day) .......................................................................... 31
Katestone Environmental Pty Ltd
WorleyParsons Australia Pacific LNG Gas Fields Supplementary
August 2010
Page iii
Figure 10 Predicted annual average ground-level concentrations for NO2 from the existing Talinga gas processing facility (90TJ/day)..................................................................................................... 32
Figure 11 Predicted maximum 1-hour average ground-level concentrations for NO2 from all Scenario 2 sources ........................................................................................................................... 33
Figure 12 Predicted annual average ground-level concentrations for NO2 from all Scenario 2 sources ...................................................................................................................................... 34
Katestone Environmental Pty Ltd
WorleyParsons Australia Pacific LNG Gas-Fields Supplementary
August 2010
Page 1
1. Introduction
Katestone Environmental was commission by WorleyParsons to undertake an air quality impact assessment in preparation of the gas-fields component of the Australia Pacific LNG Environmental Impact Statement (EIS). The Australia Pacific LNG Project (the Project) proposes to extract coal seam gas (CSG) from a network of wells and processing facilities in the Surat Basin, known as the Walloons gas fields, transport the CSG via pipeline to a processing facility in Gladstone and process the CSG ready for export as liquefied natural gas (LNG).
Since the completion of the EIS for the Project there have been a number of significant changes to the Project’s pre-front end engineering design (pre-FEED) including the type, location and number of air emission sources.
This report details the outcomes of a supplementary air quality impact assessment (SAQIA) of the changes to the gas-fields component of the Project. The supplementary assessment has focused on the following key air pollutants that were found to be of importance in the EIS, namely:
• Oxides of nitrogen (NOx), as nitrogen dioxide (NO2)
• Carbon monoxide (CO)
• Hydrocarbons (VOC) and in particular: acetaldehyde, acrolein, chloroethane,
formaldehyde and phenanthrene
The assessment of potential impacts on air quality has been carried out using the atmospheric dispersion modelling methodology developed for the EIS. The location of each emission source has been provided by WorleyParsons for input into the dispersion model. The locations may change as the project develops further. Notwithstanding this, the outcome of the assessment is not expected to change substantially as a result of final siting details being determined.
Katestone Environmental Pty Ltd
WorleyParsons Australia Pacific LNG Gas-Fields Supplementary
August 2010
Page 2
2. SAQIA Methodology
2.1 Pre-FEED Design Changes
The major change to the gas-fields component of the Project is that electric motors will be used instead of gas-fired engines to drive equipment at the gas processing facilities, water transfer stations and water treatment facilities. The change from gas-fired engines to electric motors significantly reduces the emission rates of air pollutants from the Project and the number of air emission sources, as electric motors do not produce exhaust emissions.
To power all the electric motors across the Australia Pacific LNG gas field, electricity will be supplied from the grid. During the first two to five years of the Project’s lifetime it is anticipated that the infrastructure to provide gridded power to the Project will not be fully developed. As a short-term solution it is proposed that eight temporary power stations, comprised of a single gas-fired power generation turbine (GE TM2500+), are located across the gas field at locations where gas infrastructure will be developed. This is likely to be quite conservative as there will not be eight temporary power stations operating at any one time. This is due to the progressive development of gas processing facilities coming on line and the progressive grid connection to these facilities as power line infrastructure is developed during the first five years.
The pre-FEED design for the EIS recommended an upgrade to the existing gas processing facility located at Talinga. The EIS considered an increase in the output of the plant from 90 TJ/day to 180 TJ/day and included provisions to retrofit NOx control technology to a number of existing gas engines. It is now the case that the existing facility at Talinga will remain at 90 TJ/day output and there will be no NOx control technology applied to the existing infrastructure.
A qualitative assessment of the impact of small gas-fired engines at the gas wells was conducted for the EIS based upon the proposed engine size at the wells compared to against the gas processing facilities gas engines. This showed that even though there were a large number of engines required at gas wells across the gas field, the overall impact would be minimal compared to the impact of the larger gas engines at each gas processing facility.
The decision to switch to electric motors at the gas processing facilities now means that the gas-fired engines at the gas wells are a relatively important source of air emissions and therefore a quantitative assessment has been conducted. Detailed information on the type of engines and the location of gas wells has been provided and will be assessed in this supplementary report as a case study in the ‘Undullah Nose’ region of the gas-fields.
Katestone Environmental Pty Ltd
WorleyParsons Australia Pacific LNG Gas-Fields Supplementary
August 2010
Page 3
2.2 Assessment Methodology
This section describes the operational scenarios considered for the supplementary assessment of air quality for the entire Australia Pacific LNG gas-fields Project. A full description of the dispersion modelling assessment methodology can be found in section 7 of the EIS and relevant Appendices.
Two operational scenarios have been assessed that represent a worst-case air quality impact for the Project.
Scenario 1 assesses the potential impact of the Project on air quality across the study region. Scenario 2 assesses the potential local air quality impact for the central gas fields’ area known as the ‘Undullah Nose’. The ‘Undullah Nose’ was chosen because it is the location where the highest potential for cumulative impacts exists due to it having the greatest density of gas infrastructure both associated with the Australia Pacific LNG Project and activities of other producers.
1.1.1 Scenario 1 - Australia Pacific LNG gas field
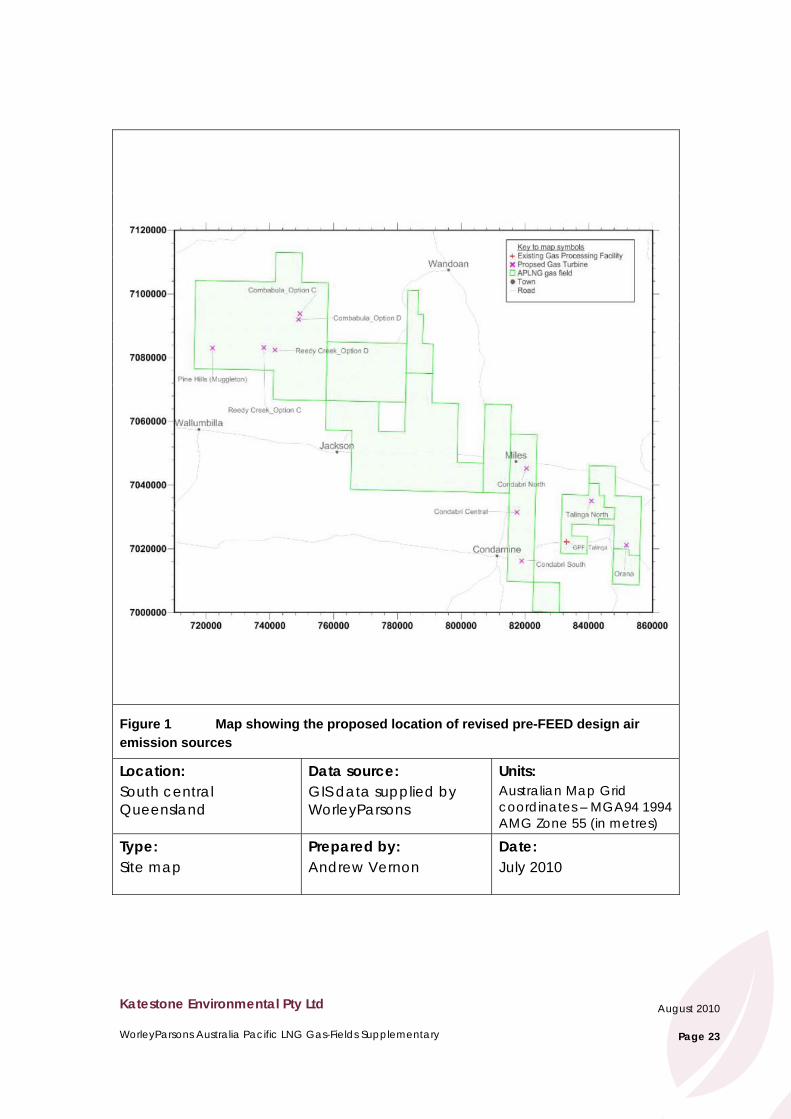
The existing gas processing facility infrastructure at Talinga, operating at 90 TJ/day, has been assessed along with eight TM2500+ gas turbines to be located across the Australia Pacific LNG gas fields, which will provide electricity to the proposed gas processing facilities while grid power is unavailable. WorleyParsons provided Katestone Environmental with ten possible locations for the proposed gas turbines (Figure 1). There are two options for the locations of the gas turbines at Reedy Creek and Combabula. For this assessment the Reedy Creek Option C and Combabula Option D locations have been chosen as they represent the minimum separation between each other and the Pine Hills location to the west and therefore the maximum potential for cumulative impacts.
The existing Talinga gas processing facility comprises the following air emission sources:
• 12 x Waukesha L7042GSI gas-fired reciprocation screw compressors (rich burn) • 5 x Caterpillar G3612 gas-fired reciprocating engines
• 3x Caterpillar G3406 gas-fired boilers
The assessment for Scenario 1 has been carried out for the existing Talinga operations and the proposed temporary gas turbines in isolation and cumulatively. For the cumulative assessment, background concentrations have been included for NO2 and CO but not for the hydrocarbons. This approach is consistent with the EIS.
Katestone Environmental Pty Ltd
WorleyParsons Australia Pacific LNG Gas-Fields Supplementary
August 2010
Page 4
The assessment of background concentrations in the study area is the same as the EIS. NO2 levels have been modelled for all existing sources and added to the Australia Pacific LNG air emission sources. A background CO level has been determined from the measurements from the DERM Toowoomba monitoring station.
The dispersion modelling results have been presented as a maximum concentration at any location across the model area, in isolation and cumulatively. Contour plots of NO2 are presented for each source in isolation and cumulatively.
1.1.2 Scenario 2 - Gas wells case study
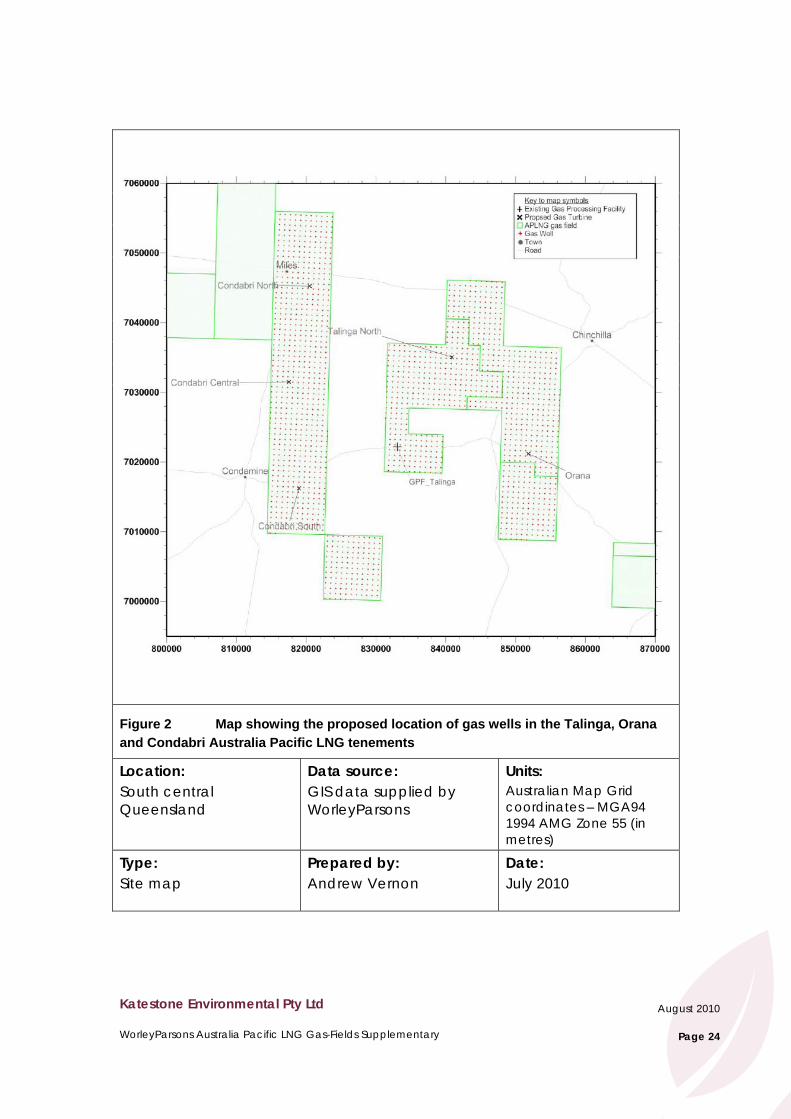
This scenario focuses on the area surrounding the existing Talinga gas processing facility known as the ‘Undullah Nose’. An indicative location of every gas well, spaced 750 metres apart, in the Talinga, Orana and Condabri tenements has been provided by WorleyParsons. The potential impact of the gas-fired engines to be installed at gas wells has been assessed in isolation and cumulatively to include both existing and proposed Australia Pacific LNG infrastructure and background sources (large power stations). A cumulative assessment that includes third party gas proponent infrastructure based upon the data submitted in the EIS has also been conducted.
To assess a worst-case impact each gas well has been assumed to require a gas compressor engine powered by a micro-turbine, giving a total of 1,730 micro-turbines across the ‘Undullah Nose’ region. It has been assumed that 50% of the gas wells will require pumping at any particular point in time, and so every second gas well has been modelled with a gas-fired engine operating to drive the water pump (approximately 850 gas-engines). In reality, the development of a gas field tenement is transient over the lifetime of the Project and it is extremely unlikely that all the sources from the gas wells in the ‘Undullah Nose’ region would be operating at the same time.
As will be shown in section 5 the major pollutant of concern is NO2 from gas-fired engines at the existing Talinga gas processing facility and therefore this scenario has focused on NO2 only.
The assessment of background concentrations in the study area is the same as the EIS. Nitrogen dioxide levels have been modelled for all existing sources and added to the Australia Pacific LNG air emission sources. The results have been presented as a maximum concentration at any location across the model area, in isolation and cumulatively. Contour plots of NO2 are presented for all the gas wells in isolation and as a cumulative plot of all sources.
Katestone Environmental Pty Ltd
WorleyParsons Australia Pacific LNG Gas-Fields Supplementary
August 2010
Page 5
3. Emissions The key pollutants identified in the EIS and assessed in this report include NOX (as NO2), CO and various hydrocarbon species. WorleyParsons provided information on the emissions and source characteristics for the proposed gas turbines and gas well engines. Emissions and source characteristics from the existing infrastructure and background sources have been taken from the EIS.
Chemical speciation of the hydrocarbons that could be found in the exhaust emissions from the gas-fired turbines was not available in the information provided by WorleyParsons. The conventional approach to speciate hydrocarbon emissions is to use the USEPA AP-42 document Stationary Gas Turbines (Chapter 3.1).
3.1 TM2500 Gas Turbines
The eight temporary power stations will each use a single TM2500+ gas turbine to generate electricity. The source characteristics have been supplied by WorleyParsons and are detailed in Table 1. Emission rates of NOX, CO and hydrocarbons are detailed in Table 2.
Table 1 Source characteristics of the TM2500+ gas turbine under normal operating conditions at 100% capacity
Parameter Units Value
Number of stacks per turbine unit -- 1
Total number of turbine units -- 8
Stack height (above ground level) m 6
Stack diameter m 2.5
Exhaust gas temperature K 770
Exhaust gas velocity m/s 35.4
Exhaust gas flow rate (actual stack conditions) m3/s 161.6
Normalised exhaust gas flow rate (0oC, 1 Atm) Nm3/s 57.3
Katestone Environmental Pty Ltd
WorleyParsons Australia Pacific LNG Gas-Fields Supplementary
August 2010
Page 6
Table 2 Exhaust concentrations and emission rates of NOx, CO and hydrocarbons from a TM2500+ gas turbine under normal operating conditions at 100% capacity
Pollutant Concentration
(mg/Nm3)
Emission rate
(g/s)
Oxides of nitrogen 52.46 3.01
Carbon monoxide 47.27 2.71
Acetaldehyde 2.1E-02 0.001
Acrolein 3.3E-03 0.0002
Formaldehyde 3.7E-01 0.02
Table note:
Exhaust gas concentrations (mg/Nm3) and emission rates (g/s) are based on total emissions per unit at 100% operating load.
Exhaust oxygen content not provided.
Concentrations provided at stack conditions.
3.2 Gas Wells
The emission source characteristics of the small gas-fired engine used to drive the wellhead water pumps and the micro-turbines used to extract CSG as well production declines are presented in Table 3, while the stack concentration and mass emission rate of NOx is presented in Table 4.
Katestone Environmental Pty Ltd
WorleyParsons Australia Pacific LNG Gas-Fields Supplementary
August 2010
Page 7
Table 3 Source characteristics of the gas well engines under normal operating conditions at 100% capacity
Parameter Units Water Pump Engine Gas Compressor
Number of stacks per unit -- 1 1
Total number of assessed units -- 870 1,750
Stack height (above ground level) m 2.6 2.1
Stack diameter m 0.08 0.13
Exhaust gas temperature oC 649 275
Exhaust gas velocity m/s 41 37.9
Exhaust gas flow rate (actual stack conditions)
m3/s 0.21 0.48
Normalised exhaust gas flow rate (0oC, 1 Atm)
Nm3/s 0.06 0.24
Table 4 Exhaust concentrations and emission rates of NOx from the gas well engines under normal operating conditions at 100% capacity
Water Pump Engine Gas Compressor
Pollutant Concentration
(mg/Nm3)
Emission rate
(g/s)
Concentration
(mg/Nm3)
Emission rate
(g/s)
Oxides of nitrogen 3,312 0.20 23.2 0.01
Table note:
Exhaust gas concentrations (mg/Nm3) and emission rates (g/s) are based on total emissions per unit at 100% operating load.
Exhaust oxygen content not provided.
Concentrations provided at stack conditions.
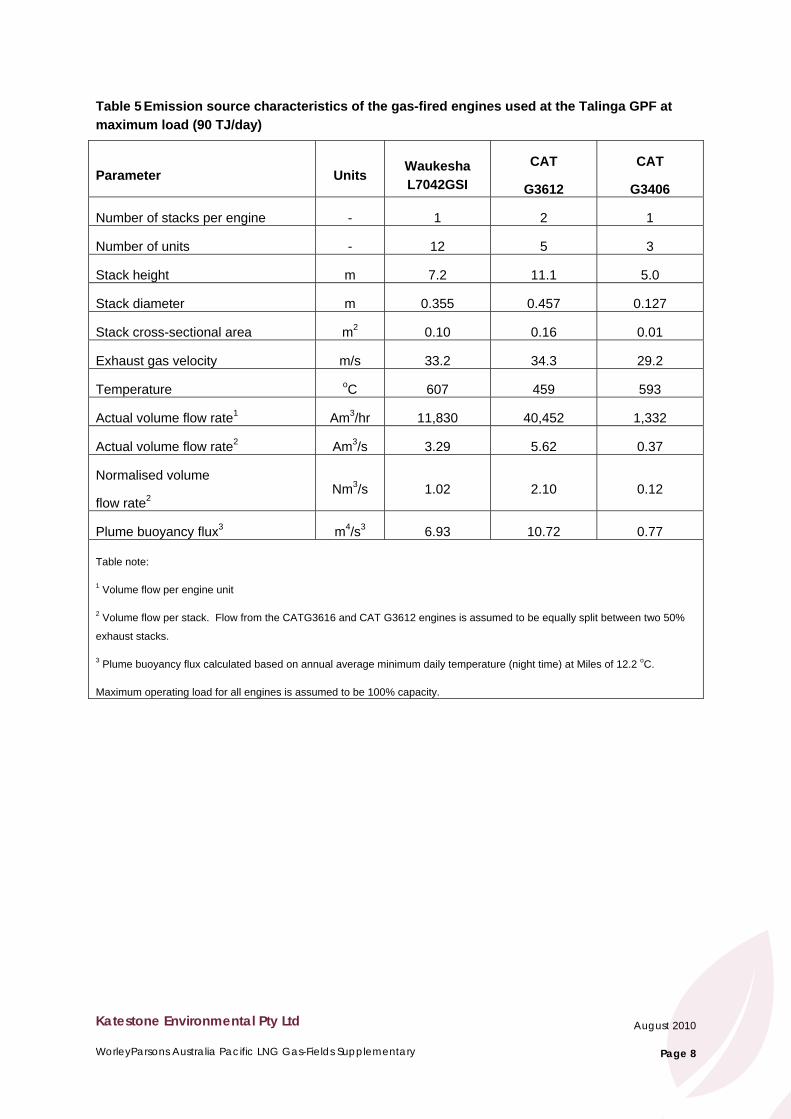
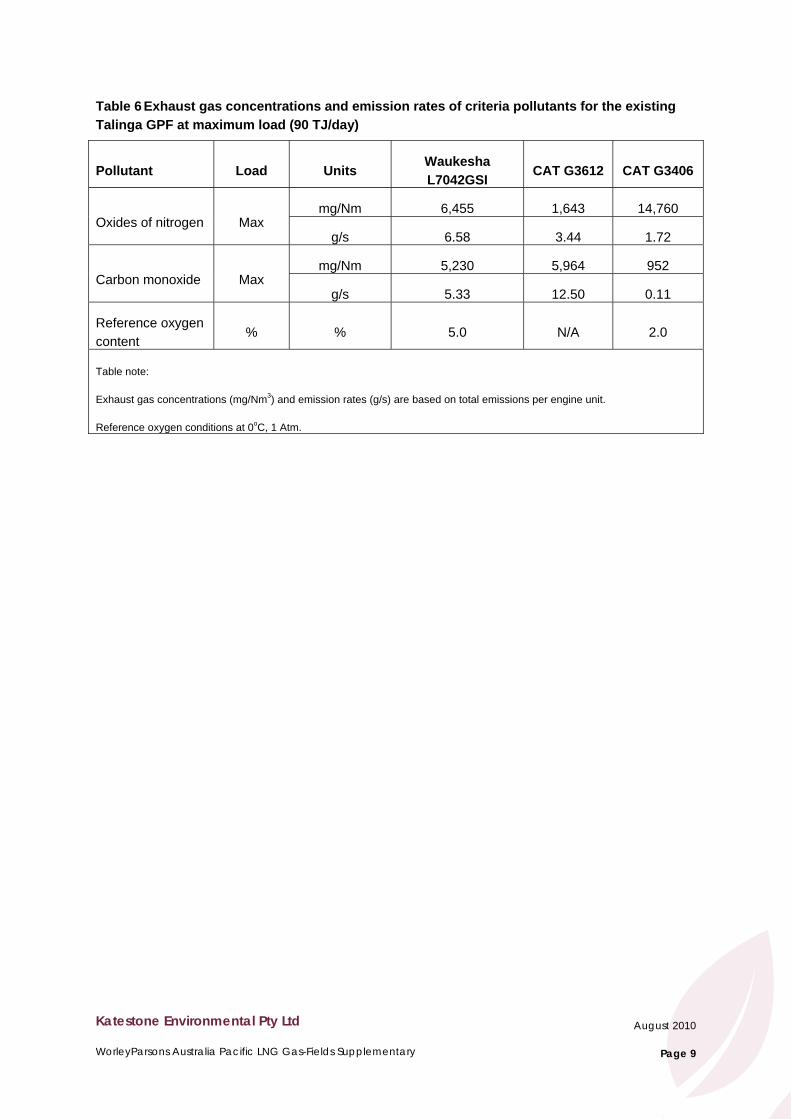
3.3 Existing Talinga Gas Processing Facility
The emissions and source characteristics of the existing Talinga gas processing facility operating at 90 TJ/day is detailed in Section 4.13 of the EIS and reproduced here in Table 5 and Table 6.
Katestone Environmental Pty Ltd
WorleyParsons Australia Pacific LNG Gas-Fields Supplementary
August 2010
Page 8
Table 5 Emission source characteristics of the gas-fired engines used at the Talinga GPF at maximum load (90 TJ/day)
Parameter Units Waukesha L7042GSI
CAT
G3612
CAT
G3406
Number of stacks per engine - 1 2 1
Number of units - 12 5 3
Stack height m 7.2 11.1 5.0
Stack diameter m 0.355 0.457 0.127
Stack cross-sectional area m2 0.10 0.16 0.01
Exhaust gas velocity m/s 33.2 34.3 29.2
Temperature oC 607 459 593
Actual volume flow rate1 Am3/hr 11,830 40,452 1,332
Actual volume flow rate2 Am3/s 3.29 5.62 0.37
Normalised volume
flow rate2 Nm3/s 1.02 2.10 0.12
Plume buoyancy flux3 m4/s3 6.93 10.72 0.77
Table note:
1 Volume flow per engine unit
2 Volume flow per stack. Flow from the CATG3616 and CAT G3612 engines is assumed to be equally split between two 50%
exhaust stacks.
3 Plume buoyancy flux calculated based on annual average minimum daily temperature (night time) at Miles of 12.2 oC.
Maximum operating load for all engines is assumed to be 100% capacity.
Katestone Environmental Pty Ltd
WorleyParsons Australia Pacific LNG Gas-Fields Supplementary
August 2010
Page 9
Table 6 Exhaust gas concentrations and emission rates of criteria pollutants for the existing Talinga GPF at maximum load (90 TJ/day)
Pollutant Load Units Waukesha L7042GSI
CAT G3612 CAT G3406
mg/Nm 6,455 1,643 14,760 Oxides of nitrogen Max
g/s 6.58 3.44 1.72
mg/Nm 5,230 5,964 952 Carbon monoxide Max
g/s 5.33 12.50 0.11
Reference oxygen content
% % 5.0 N/A 2.0
Table note:
Exhaust gas concentrations (mg/Nm3) and emission rates (g/s) are based on total emissions per engine unit.
Reference oxygen conditions at 0oC, 1 Atm.
Katestone Environmental Pty Ltd
WorleyParsons Australia Pacific LNG Gas-Fields Supplementary
August 2010
Page 10
4. Air Quality Criteria
4.1 Queensland Environmental Protection Policies
The Environmental Protection Act 1994 (EP Act) provides for the management of the air environment in Queensland. The legislation applies to government, industry and individuals and provides a mechanism for the delegation of responsibility to other government departments and local government and provides all government departments with a mechanism to incorporate environmental factors into decision-making.
The object of the EP Act is summarised as follows:
The object of the Environmental Protection Act 1994 is to protect Queensland’s environment while allowing for development that improves the total quality of life, both now and in the future, in a way that maintains the ecological processes on which life depends. (EPP (Air) Explanatory notes, General outline)
The EP Act gives the Environment Minister the power to create Environmental Protection Policies that aim to protect the environmental values identified for Queensland. In accordance with the EP Act, the Environmental Protection (Air) Policy (EPP (Air)) is to be reviewed every ten years, with the initial EPP(Air) having been gazetted in 1997. Consequently, the EPP (Air) was scheduled for revision in 2008 and the revised EPP (Air) 2008 commenced on 1 January 2009.
The objective of the EPP (Air) 2008 is summarised as follows:
The objective of the Environmental Protection (Air) Policy 2008 is to identify the environmental values of the air environment to be enhanced or protected and to achieve the object of the Environmental Protection Act 1994, i.e., ecologically sustainable development.
The application and purpose of the EPP (Air) 2008 is summarised as follows:
The purpose of the EPP (Air) is to achieve the object of the Act in relation to the air environment (EPP (Air) Part 2, Section 5).
The purpose of this policy is achieved by - a) Identifying environmental values to be enhanced or protected; and b) Stating indicators and air quality objectives for enhancing or protecting the
environmental values; and c) providing a framework for making consistent, equitable and informed
decisions about the air environment (EPP (Air) Part 2, Section 6).
The environmental values to be enhanced or protected under the EPP (Air) are – a) the qualities of the air environment that are conducive to protecting the health
and biodiversity of ecosystems; and b) the qualities of the air environment that are conducive to human health and
wellbeing; and
Katestone Environmental Pty Ltd
WorleyParsons Australia Pacific LNG Gas-Fields Supplementary
August 2010
Page 11
c) the qualities of the air environment that are conducive to protecting the aesthetics of the environment, including the appearance of buildings structures and other property; and
d) the qualities of the air environment that are conducive to protecting agricultural use of the environment.
The administering authority must consider the requirements of the EPP (Air) when it decides an application for an environmental authority, amendment of a licence or approval of a draft Environmental Management Plan. Schedule 1 of the EPP (Air) specifies air quality objectives for various averaging periods.
4.2 National Environment Protection Measure
The National Environment Protection Council defines national ambient air quality standards and goals in consultation, and with agreement from, all state governments. These were first published in 1998 in the National Environment Protection (Ambient Air Quality) Measure (NEPM (Air)). Compliance with the NEPM (Air) standards is assessed via ambient air quality monitoring undertaken at locations prescribed by the NEPM (Air) and that are representative of large urban populations. The goal of the NEPM (Air) is for the ambient air quality standards to be achieved at these monitoring stations within ten years of commencement; that is in 2008. The EPP (Air) 2008 has adopted the NEPM (Air) goals as air quality objectives.
4.3 Relevant Ambient Air Quality Goals for the Project
The predicted ground-level concentrations of air pollutants have been compared with the relevant state, national and international ambient air quality objectives and standards to determine acceptability, namely:
• Queensland Environmental Protection (Air) Policy 2008
• National Environment Protection Measure (Ambient Air Quality) 1998
• NSW Department of Environment and Climate Change (NSW DECC) Approved Methods for the Modelling and Assessment of Air Pollutants in NSW (2005)
• Texas Commission on Environmental Quality Toxicological section list of Effects
Screening Levels.
Table 7 presents a summary of the relevant ambient air quality goals for criteria pollutants adopted for this assessment.
Katestone Environmental Pty Ltd
WorleyParsons Australia Pacific LNG Gas-Fields Supplementary
August 2010
Page 12
Table 7 Relevant ambient air quality objectives for criteria air pollutants (EPP (Air) 2008)
Indicator Environmental
value Averaging
period
Air quality objective 1
(µg/m³)
Number of days of exceedence
allowed
1-hour 250 1 Health and wellbeing 1-year 62 0
Nitrogen dioxide
Health and biodiversity of ecosystems
1-year 33 0
Carbon monoxide Health and wellbeing
8-hour 11,000 1
Note
1 Air quality objective at 0oC
In addition to the criteria air pollutants detailed above small quantities of hydrocarbons may be emitted from the Project’s sources. The hydrocarbons that were found in the EIS to be relatively significant are presented in Table 8 along with their relevant air quality objective.
Table 8 Ambient air quality objectives and standards for the top five hydrocarbons
Indicator Environmental
value Averaging
period
Air quality objective or
standard
(µg/m³)
Source of standard or
goal
Acetaldehyde Odour 1-hour 42 NSW DECCW
Acrolein Health
(Extremely toxic - USEPA)
1-hour 0.42 NSW DECCW
Ethyl chloride (chloroethane)
Health and wellbeing
1-hour 0.048 NSW DECCW
Formaldehyde Health and wellbeing
24-hour 54 EPP Air
Phenanthrene Health 1-hour 0.5 TCEQ
Comparison of air quality objectives from each jurisdiction to the predicted maximum is based on a specific percentile of the distribution of predicted ground-level concentrations. The percentile used for each is presented in Table 9.
Katestone Environmental Pty Ltd
WorleyParsons Australia Pacific LNG Gas-Fields Supplementary
August 2010
Page 13
Table 9 Summary of percentile values used for comparison to air quality objectives
Standard or goal Pollutant Percentile
Environment Protection (Air) Policy Criteria 100
NSW Department of Environment, Climate Change and Water Non-criteria 99.9
Texas Commission on Environmental Quality Non-Criteria 100
Katestone Environmental Pty Ltd
WorleyParsons Australia Pacific LNG Gas-Fields Supplementary
August 2010
Page 14
5. Scenario 1 – Australia Pacific LNG entire gas field results
This section describes the results of the air quality assessment for NO2, CO and selected hydrocarbons for the entire Australia Pacific LNG gas field revised pre-FEED design.
5.1 Nitrogen dioxide and carbon monoxide
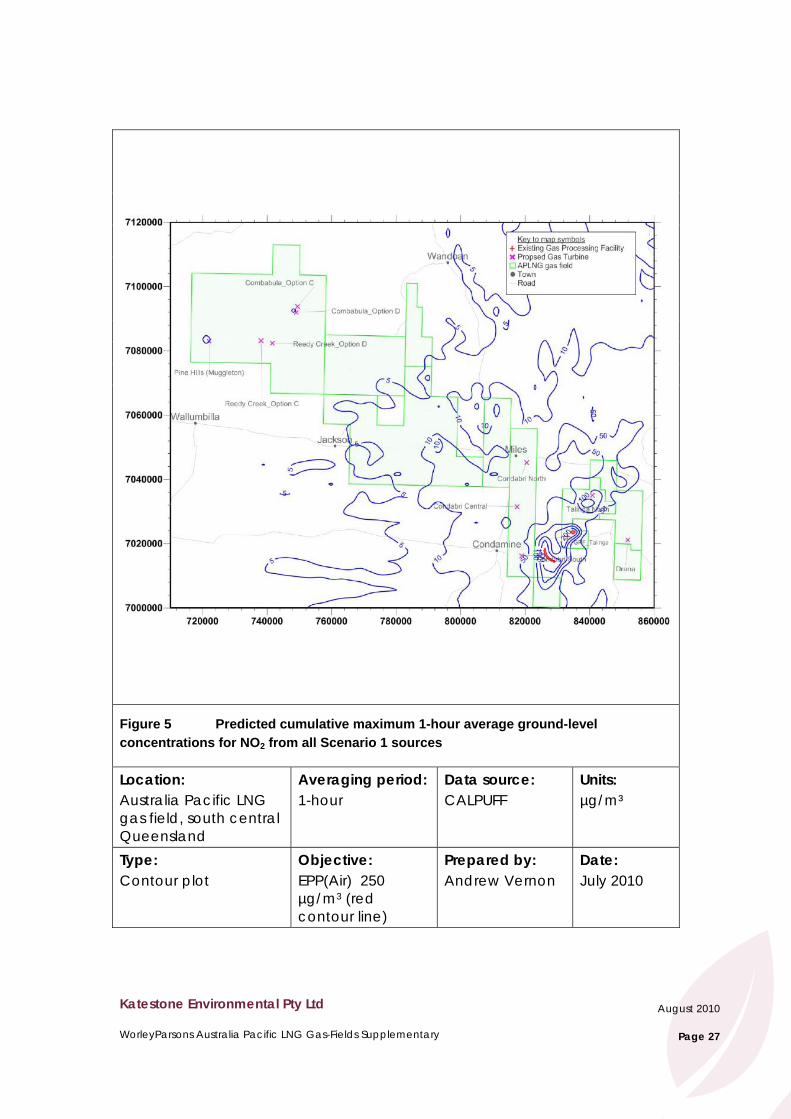
The predicted ground-level concentrations of NO2 and CO for each individual source type in isolation and as a cumulative assessment are presented in Table 10. Contour plots predicted 1-hour maximum and annual average ground-level concentrations of NO2 from gas turbines in isolation and all Scenario 1 sources are presented in Figure 3 to Figure 6, respectively.
Table 10 Predicted maximum 1 hour and annual average ground-level concentrations of NO2 and 8-hour average CO for the revised Australia Pacific LNG gas field operations
Nitrogen dioxide (NO2) Carbon monoxide (CO)
Averaging period 1-hour Annual 8-hour
EPP (Air) objective 250 62 11,000
Maximum ground-level concentration in isolation (µg/m3)
8 power stations
(TM2500+) 7.7 0.02 3.07
Existing
Talinga GPF 278 2.3 416
Background
Source contribution1 68.1 0.5 54.7
Maximum cumulative ground-level concentration (µg/m3)
All
sources 278 2.5 470.7
Table note:
1 Background sources (power stations) for NO2 have been modelled. Background sources for CO have been taken from
monitoring data at Toowoomba
Katestone Environmental Pty Ltd
WorleyParsons Australia Pacific LNG Gas-Fields Supplementary
August 2010
Page 15
The results show the following:
• Predicted maximum 1-hour average ground-level concentrations of NO2 due to all
Scenario 1 sources exceeds the EPP (Air) objective of 250 µg/m3 in close proximity
to the Talinga gas processing facility. Away from the Talinga facility, compliance with the object is achieved by a significant margin.
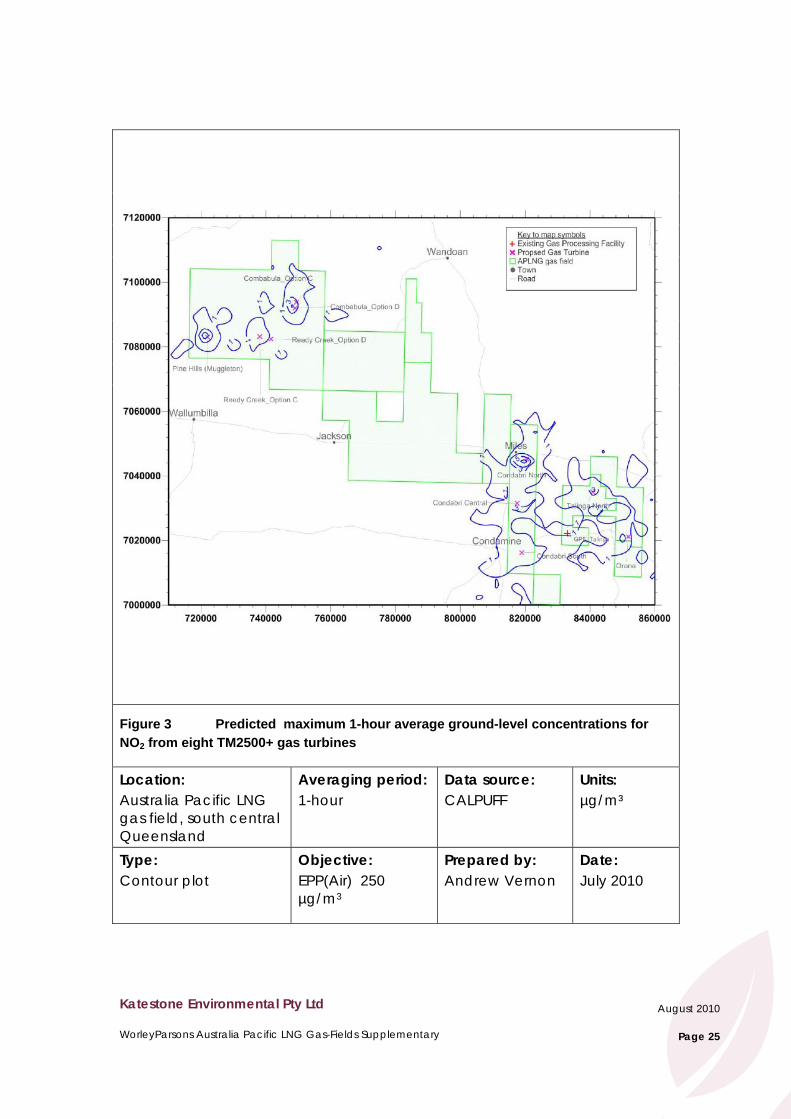
• The main contribution to the predicted exceedances is the existing Talinga gas processing facility. The proposed TM2500+ gas turbines contribute a relatively small amount.
• Predicted maximum 1-hour average ground-level concentrations of NO2 as a result of eight TM2500+ gas turbines is 7.7 µg/m3 or 3% of the EPP (Air) objective of 250 µg/m3
• Predicted maximum 1-hour average ground-level concentrations of NO2 as a result of
the existing Talinga gas processing facility operating at 90 TJ/day is 278 µg/m3 or 111% of the EPP (Air) objective of 250 µg/m3
• Predicted maximum 1-hour average ground-level concentration of NO2 at all sensitive receptors due to all Scenario 1 sources is below the EPP (Air) objective of 250 µg/m3
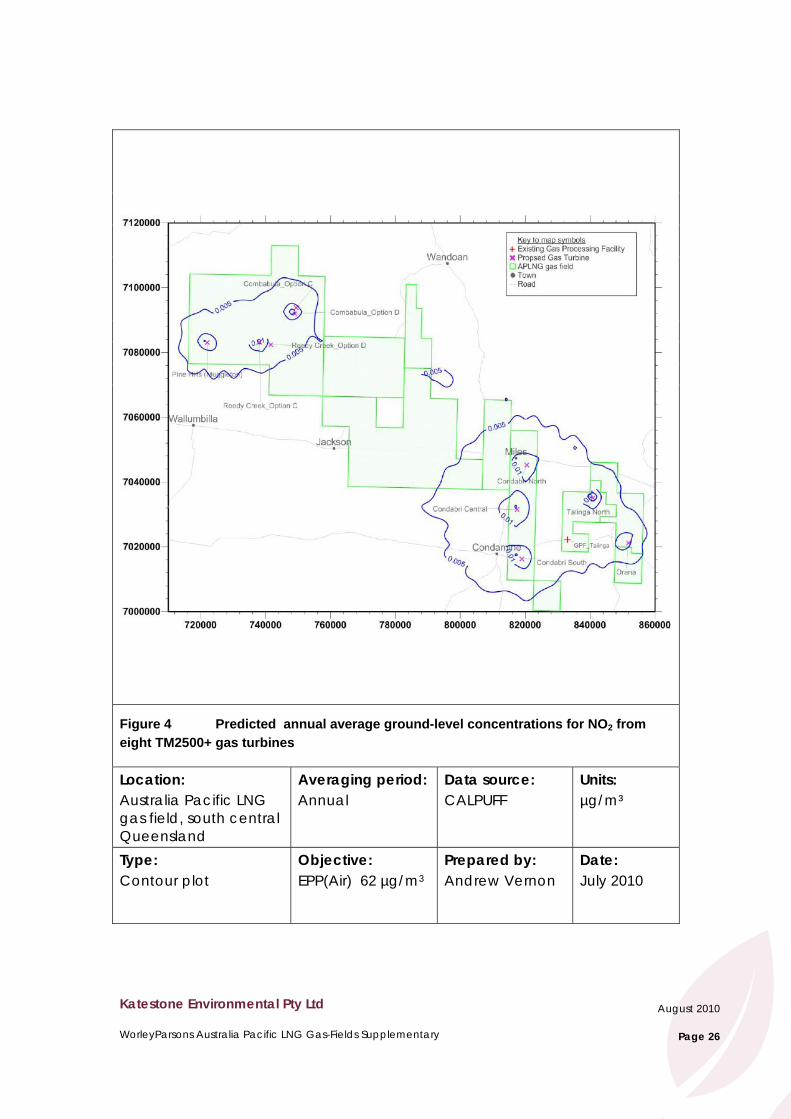
• Predicted annual average ground-level concentrations of NO2 due to all Scenario 1
sources, including a background concentration, are well below the EPP (Air) air quality objective at all locations within the modelled domain
• Predicted ground-level concentrations of CO are well below the EPP (Air) air quality
objective for the 8-hour averaging period due to all Scenario 1 sources, including a background concentration of 54.7 µg/m3, at all locations within the modelled domain.
5.2 Hydrocarbons
The predicted ground-level concentrations of hydrocarbons for the various individual elements in isolation and as a cumulative assessment are presented in Table 11.
Katestone Environmental Pty Ltd
WorleyParsons Australia Pacific LNG Gas-Fields Supplementary
August 2010
Page 16
Table 11 Predicted ground-level concentrations of hydrocarbons of interest for the revised Australia Pacific LNG gas field operations
Acetaldehyde Acrolein Formaldehyde Chloroethane Phenanthrene
Averaging period
1-hour 1-hour 24-hour 1-hour 1-hour
Air quality objective
42 0.42 54 0.048 0.5
Ground-level concentration in isolation (µg/m3)
8 power stations
(TM2500+)
0.01 0.0002 0.008 - -
Existing
Talinga
GPF
1.9 0.03 2.4 0.0004 0.006
Cumulative ground-level concentration (µg/m3)
All
sources 1.9 0.03 2.4 0.0004 0.006
The results show the following:
• Predicted ground-level concentrations of key hydrocarbons are well below the air
quality objectives for acetaldehyde, acrolein, formaldehyde, chloroethane and phenanthrene, due to all Scenario 1 sources, assessed in isolation and cumulatively, at all locations within the modelled domain
5.3 Comparison with EIS results
There are two main differences between the EIS and SAQIA gas-field results. The switch to electric motors has significantly reduced the potential impact of the Project on air quality across the entire Australia Pacific LNG gas field. The existing Talinga gas processing facility operating without retrofitted NOx controls results in marginal exceedances of the 1-hour NO2 EPP (Air) quality objective in close proximity to the Talinga gas processing facility. The application of NOx control technologies, such as non-selective catalytic reduction (NSCR), which was contemplated in the EIS would reduce the potential impact on air quality of the existing facilities at Talinga to below the EPP(Air) objective.
Katestone Environmental Pty Ltd
WorleyParsons Australia Pacific LNG Gas-Fields Supplementary
August 2010
Page 17
6. Scenario 2 – ‘Undullah Nose’ case study results
This section describes the results of the air quality assessment for NO2 for the case study in the ‘Undullah Nose’ region.
6.1 Nitrogen dioxide
The predicted ground-level concentrations of NO2 for the various individual elements of the Project in isolation and as cumulative assessment are presented in Table 12 . Contour plots of predicted maximum 1-hour and annual average ground-level concentrations of NO2 from gas wells in isolation, existing Talinga in isolation and all Scenario 2 sources are presented in Figure 7 to Figure 12, respectively.
Table 12 Predicted maximum 1 hour and annual average ground-level concentrations of NO2 for the Australia Pacific LNG gas wells case study operations
Pollutant Nitrogen dioxide (NO2)
Averaging period 1-hour1 Annual
EPP (Air) Objective 250 62
Maximum ground-level concentration in isolation (µg/m3)
Gas
Wells 81.9 9.15
Temporary power stations
(8 x TM2500+) 7.7 0.02
Existing
Talinga GPF 278 2.3
Background
Source contribution2 68.1 0.5
Maximum cumulative ground-level concentration (µg/m3)
All
sources 286 10.2
Table notes:
1Predicted maximum ground-level concentration
2Existing background sources of NOX have been modelled. The facilities of proposed third party gas producers have not been
included here, but are assessed in Section 7.
Katestone Environmental Pty Ltd
WorleyParsons Australia Pacific LNG Gas-Fields Supplementary
August 2010
Page 18
The results show the following:
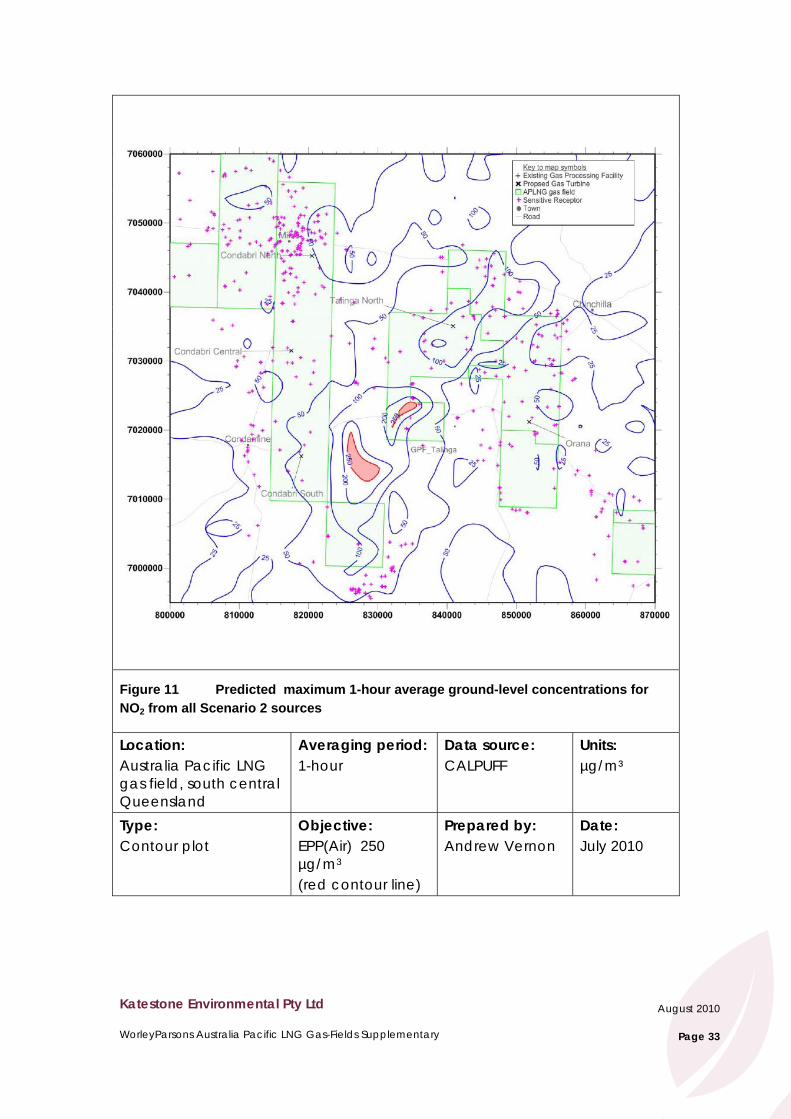
• Predicted maximum 1-hour average ground-level concentrations of NO2 as a result of
all Scenario 2 sources exceeds the EPP (Air) objective of 250 µg/m3 in close
proximity to the Talinga gas processing facility.
• Predicted maximum 1-hour average ground-level concentrations of NO2 as a result of
all Scenario 2 sources is 286 µg/m3 or 114% of the EPP (Air) objective of 250 µg/m3. The main contribution to the predicted exceedance is from the existing Talinga gas processing facility.
• Predicted maximum 1-hour average ground-level concentrations of NO2 as a result of
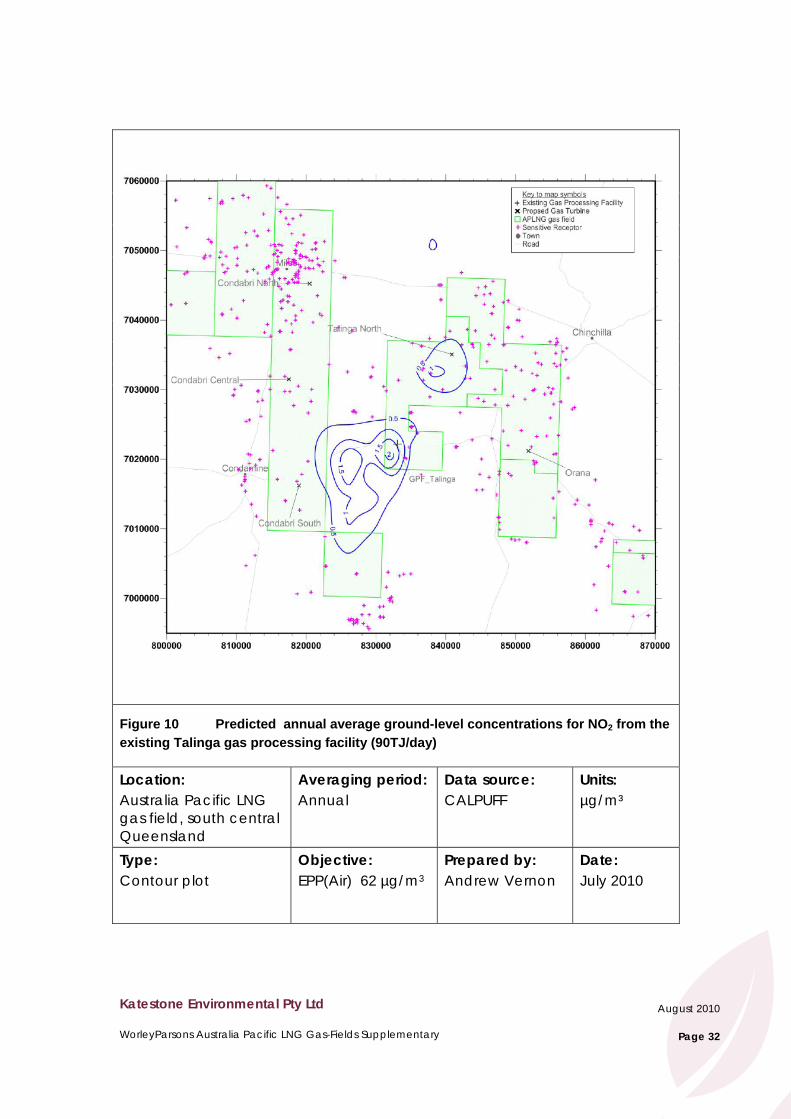
the existing Talinga gas processing facility operating at 90 TJ/day, assessed in isolation, is 278 µg/m3 or 111% of the EPP (Air) objective of 250 µg/m3
• Predicted maximum 1-hour average ground-level concentrations of NO2 due to gas
wells, temporary power stations and background sources is 82 µg/m³ or 33% of the EPP (Air) air quality objective of 250 µg/m³.
• Predicted maximum 1-hour average ground-level concentration of NO2 at all
sensitive receptors due to all Scenario 2 sources is below the EPP (Air) objective of 250 µg/m3
• Predicted annual average ground-level concentrations of NO2 due to all Scenario 2
sources are well below the EPP (Air) air quality objective at all locations within the modelled domain
Katestone Environmental Pty Ltd
WorleyParsons Australia Pacific LNG Gas-Fields Supplementary
August 2010
Page 19
7. Cumulative Impacts with Third Party Gas Producers For the EIS, Katestone Environmental carried out a cumulative assessment of Australia Pacific LNG and third party gas proponent infrastructure in the ‘Undullah Nose’ region. Conservative estimates of locations and total emissions from third party infrastructure were provided by Australia Pacific LNG.
Australia Pacific LNG has now provided information that states the third party gas proponent infrastructure will use electric motors at the gas processing facilities and a small gas-fired engine at each gas well. As detailed in EIS prepared by third party proponents, the maximum 1-hour ground-level concentration of NO2 associated with third party gas wells in the ‘Undullah Nose’ region is approximately 45 µg/m3. This peak concentration is predicted to occur within the third parties’ gas tenement to the south and southwest of the Australia Pacific LNG Talinga tenement.
Cumulative ground-level concentrations of NO2 due to both the proposed third party infrastructure in the ‘Undullah Nose’ region, the existing activities and the Australia Pacific LNG Project are unlikely to cause exceedances of the objectives at any of the existing sensitive receptors. However, compliance at the two receptors closest to Talinga gas processing facility would be marginal. The application of NOx control technologies, such as non-selective catalytic reduction (NSCR), which was contemplated in the EIS would reduce the potential impact on air quality of the existing facilities at Talinga to well below the EPP (Air) objective.
Katestone Environmental Pty Ltd
WorleyParsons Australia Pacific LNG Gas-Fields Supplementary
August 2010
Page 20
8. Conclusion
Katestone Environmental has undertaken a supplementary air quality impact assessment for the revised pre-FEED designs to the Australia Pacific LNG Gas-Fields Project located in the Surat Basin, south central Queensland.
The supplementary air quality assessment focussed on the key pollutants identified in the EIS, namely:
• NO2 • CO • Acetaldehyde • Acrolein • Formaldehyde • Chloroethane • Phenanthrene.
The following conclusion can be drawn:
Scenario 1
• Predicted maximum 1-hour average ground-level concentrations of NO2 due to all
Scenario 1 sources exceeds the EPP (Air) objective of 250 µg/m3 in close proximity
to the Talinga gas processing facility. Away from the Talinga facility, compliance with the object is achieved by a significant margin.
• The main contribution to the predicted exceedances is the existing Talinga gas processing facility. The proposed TM2500+ gas turbines contribute a relatively small amount. Australia Pacific LNG is currently undergoing stack monitoring at Talinga to understand the actual emissions. Results from this monitoring will be available upon request.
• Predicted maximum 1-hour average ground-level concentration of NO2 at all sensitive receptors due to all Scenario 1 sources is below the EPP (Air) objective of 250 µg/m3.
• Predicted annual average ground-level concentrations of NO2 due to all Scenario 1
sources, including a background concentration, are well below the EPP (Air) air quality objective at all locations within the modelled domain.
• Predicted ground-level concentrations of CO are well below the EPP (Air) air quality objective for the 8-hour averaging period due to all Scenario 1 sources, including a background concentration of 54.7 µg/m3, at all locations within the modelled domain.
• Predicted ground-level concentrations of key hydrocarbons are well below the air
quality objectives for acetaldehyde, acrolein, formaldehyde, chloroethane and phenanthrene, due to all Scenario 1 sources, at all locations within the modelled domain.
Katestone Environmental Pty Ltd
WorleyParsons Australia Pacific LNG Gas-Fields Supplementary
August 2010
Page 21
Scenario 2
• Predicted maximum 1-hour average ground-level concentrations of NO2 as a result of
all Scenario 2 sources exceeds the EPP (Air) objective of 250 µg/m3 in close
proximity to the Talinga gas processing facility.
• The main contribution to the predicted exceedance is from the existing Talinga gas
processing facility. The proposed gas turbines, gas well engines and background sources contribute a relatively small amount.
• Predicted maximum 1-hour average ground-level concentrations of NO2 due to gas
wells, temporary power stations and background sources, assessed in isolation, are below the EPP (Air) air quality objective at any location within the modelled domain
• Predicted maximum 1-hour average ground-level concentration of NO2 at all
sensitive receptors due to all Scenario 2 sources is below the EPP (Air) objective of 250 µg/m3
• Predicted annual average ground-level concentrations of NO2 due to all Scenario 2
sources are well below the EPP (Air) air quality objective at all locations within the modelled domain. Talinga stack emission monitoring is currently underway to verify the model results.
Cumulative impact with third party gas proponents
• Cumulative ground-level concentrations of NO2 due to both the proposed third party
infrastructure in the ‘Undullah Nose’ region, the existing activities and the Australia Pacific LNG Project are unlikely to cause exceedances of the objectives at any of the existing sensitive receptors.
• Compliance with the maximum 1-hour NO2 EPP (Air) objective at the two receptors closest to Talinga gas processing facility would be marginal. The application of NOx control technologies, such as non-selective catalytic reduction (NSCR), which was contemplated in the EIS would reduce the potential impact on air quality of the existing facilities at Talinga to well below the EPP (Air) objective.
Katestone Environmental Pty Ltd
WorleyParsons Australia Pacific LNG Gas-Fields Supplementary
August 2010
Page 22
9. References
Department of Environment, Climate Change and Water, 2005. Approved Methods for the Modelling and Assessment of Air Pollutants in New South Wales.
Environmental Protection Agency, 2008. “Environmental Protection (Air) Policy”, Subordinate Legislation 2008 No. 441 and amendments, Office of the Queensland Parliamentary Counsel, Queensland.
Katestone Environmental, 2010, “Australia Pacific LNG Gas Fields Project Area – Air Quality Impact Assessment”, prepared for WorleyParsons
Texas Commission on Environmental Quality, 2008. Effects Screening Levels, Texas, United States.
USEPA 2000. - AP42, Fifth Edition, Volume 1: “Stationary Internal Combustion Sources”, Chapter 3.1 “Stationary Gas Turbines”.
Katestone Environmental Pty Ltd
WorleyParsons Australia Pacific LNG Gas-Fields Supplementary
August 2010
Page 23
Figure 1 Map showing the proposed location of revised pre-FEED design air emission sources
Location: South central Queensland
Data source: GIS data supplied by WorleyParsons
Units: Australian Map Grid coordinates – MGA94 1994 AMG Zone 55 (in metres)
Type: Site map
Prepared by: Andrew Vernon
Date: July 2010
Katestone Environmental Pty Ltd
WorleyParsons Australia Pacific LNG Gas-Fields Supplementary
August 2010
Page 24
Figure 2 Map showing the proposed location of gas wells in the Talinga, Orana and Condabri Australia Pacific LNG tenements
Location: South central Queensland
Data source: GIS data supplied by WorleyParsons
Units: Australian Map Grid coordinates – MGA94 1994 AMG Zone 55 (in metres)
Type: Site map
Prepared by: Andrew Vernon
Date: July 2010
Katestone Environmental Pty Ltd
WorleyParsons Australia Pacific LNG Gas-Fields Supplementary
August 2010
Page 25
Figure 3 Predicted maximum 1-hour average ground-level concentrations for NO2 from eight TM2500+ gas turbines
Location: Australia Pacific LNG gas field, south central Queensland
Averaging period: 1-hour
Data source: CALPUFF
Units: µg/m³
Type: Contour plot
Objective: EPP(Air) 250 µg/m3
Prepared by: Andrew Vernon
Date: July 2010
Katestone Environmental Pty Ltd
WorleyParsons Australia Pacific LNG Gas-Fields Supplementary
August 2010
Page 26
Figure 4 Predicted annual average ground-level concentrations for NO2 from eight TM2500+ gas turbines
Location: Australia Pacific LNG gas field, south central Queensland
Averaging period: Annual
Data source: CALPUFF
Units: µg/m³
Type: Contour plot
Objective: EPP(Air) 62 µg/m3
Prepared by: Andrew Vernon
Date: July 2010
Katestone Environmental Pty Ltd
WorleyParsons Australia Pacific LNG Gas-Fields Supplementary
August 2010
Page 27
Figure 5 Predicted cumulative maximum 1-hour average ground-level concentrations for NO2 from all Scenario 1 sources
Location: Australia Pacific LNG gas field, south central Queensland
Averaging period: 1-hour
Data source: CALPUFF
Units: µg/m³
Type: Contour plot
Objective: EPP(Air) 250 µg/m3 (red contour line)
Prepared by: Andrew Vernon
Date: July 2010
Katestone Environmental Pty Ltd
WorleyParsons Australia Pacific LNG Gas-Fields Supplementary
August 2010
Page 28
Figure 6 Predicted cumulative annual average ground-level concentrations for NO2 from all Scenario 1 sources
Location: Australia Pacific LNG gas field, south central Queensland
Averaging period: Annual
Data source: CALPUFF
Units: µg/m³
Type: Contour plot
Objective: EPP(Air) 62 µg/m3
Prepared by: Andrew Vernon
Date: July 2010
Katestone Environmental Pty Ltd
WorleyParsons Australia Pacific LNG Gas-Fields Supplementary
August 2010
Page 29
Figure 7 Predicted maximum 1-hour average ground-level concentrations for NO2 from 1,750 gas wells
Location: Australia Pacific LNG gas field, south central Queensland
Averaging period: 1-hour
Data source: CALPUFF
Units: µg/m³
Type: Contour plot
Objective: EPP(Air) 250 µg/m3
Prepared by: Andrew Vernon
Date: July 2010
Katestone Environmental Pty Ltd
WorleyParsons Australia Pacific LNG Gas-Fields Supplementary
August 2010
Page 30
Figure 8 Predicted annual average ground-level concentrations for NO2 from 1,750 gas wells
Location: Australia Pacific LNG gas field, south central Queensland
Averaging period: Annual
Data source: CALPUFF
Units: µg/m³
Type: Contour plot-
Objective: EPP(Air) 62 µg/m3
Prepared by: Andrew Vernon
Date: July 2010
Katestone Environmental Pty Ltd
WorleyParsons Australia Pacific LNG Gas-Fields Supplementary
August 2010
Page 31
Figure 9 Predicted maximum 1-hour average ground-level concentrations for NO2 from the existing Talinga gas processing facility (90TJ/day)
Location: Australia Pacific LNG gas field, south central Queensland
Averaging period: 1-hour
Data source: CALPUFF
Units: µg/m³
Type: Contour plot
Objective: EPP(Air) 250 µg/m3 (red contour line)
Prepared by: Andrew Vernon
Date: July 2010
Katestone Environmental Pty Ltd
WorleyParsons Australia Pacific LNG Gas-Fields Supplementary
August 2010
Page 32
Figure 10 Predicted annual average ground-level concentrations for NO2 from the existing Talinga gas processing facility (90TJ/day)
Location: Australia Pacific LNG gas field, south central Queensland
Averaging period: Annual
Data source: CALPUFF
Units: µg/m³
Type: Contour plot
Objective: EPP(Air) 62 µg/m3
Prepared by: Andrew Vernon
Date: July 2010
Katestone Environmental Pty Ltd
WorleyParsons Australia Pacific LNG Gas-Fields Supplementary
August 2010
Page 33
Figure 11 Predicted maximum 1-hour average ground-level concentrations for NO2 from all Scenario 2 sources
Location: Australia Pacific LNG gas field, south central Queensland
Averaging period: 1-hour
Data source: CALPUFF
Units: µg/m³
Type: Contour plot
Objective: EPP(Air) 250 µg/m3 (red contour line)
Prepared by: Andrew Vernon
Date: July 2010
Katestone Environmental Pty Ltd
WorleyParsons Australia Pacific LNG Gas-Fields Supplementary
August 2010
Page 34
Figure 12 Predicted annual average ground-level concentrations for NO2 from all Scenario 2 sources
Location: Australia Pacific LNG gas field, south central Queensland
Averaging period: Annual
Data source: CALPUFF
Units: µg/m³
Type: Contour plot
Objective: EPP(Air) 62 µg/m3
Prepared by: Andrew Vernon
Date: July 2010