Embed Size (px)
Citation preview
Climate Change:Australia’s national report under the
United Nations Framework Conventionon Climate Change
September 1994
© Copyright Commonwealth of Australia 1994
This work is copyright. Apart from any use as permitted under the Copyright Act 1968, no part may be reproduced by any process without prior written permission from the Australian Government Publishing Service. Requests and inquiries concerning reproduction and rights should be directed to the Manager, Commonwealth Information Services, Australian Government Publishing Service, GPO Box 84, Canberra ACT 2601.
ISBN 0 642 21323 2
For additional copies of this document or for further information, please contact the Community Information Unit of the Department of the Environment Sport and Territories,GPO Box 787,Canberra ACT 2601
Phone (008) 803 772, Facsimile (06) 274 1970.
Printed in Australia by National Capital Printing
Contents
Abbreviations iv
Executive summary 1
Chapter 1 Australia in context 7
Chapter 2 Australia’s climate change 19
Chapter 3 Australia’s National Greenhouse Gas Inventory 31
Chapter 4 Policies and measures 45
Chapter 5 Education and information activities 63
Chapter 6 Projections and impacts of measures 69
Chapter 7 Research, development and observation on climate change 83
Chapter 8 Australian assistance to developing countries 93
Chapter 9 Future directions 99
iii
iv
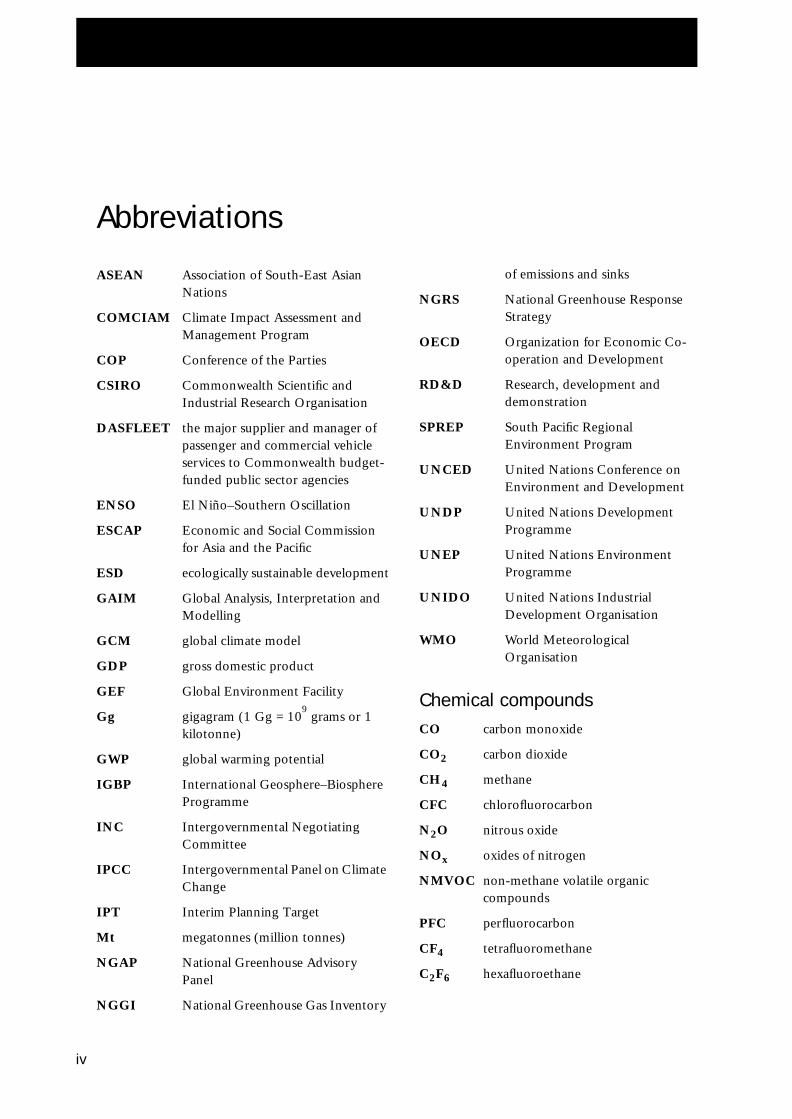
Abbreviations
ASEAN Association of South-East Asian Nations
COMCIAM Climate Impact Assessment and Management Program
COP Conference of the Parties
CSIRO Commonwealth Scientific and Industrial Research Organisation
DASFLEET the major supplier and manager of passenger and commercial vehicle services to Commonwealth budget-funded public sector agencies
ENSO El Niño–Southern Oscillation
ESCAP Economic and Social Commission for Asia and the Pacific
ESD ecologically sustainable development
GAIM Global Analysis, Interpretation and Modelling
GCM global climate model
GDP gross domestic product
GEF Global Environment Facility
Gg gigagram (1 Gg = 109 grams or 1
kilotonne)
GWP global warming potential
IGBP International Geosphere–Biosphere Programme
INC Intergovernmental Negotiating Committee
IPCC Intergovernmental Panel on Climate Change
IPT Interim Planning Target
Mt megatonnes (million tonnes)
NGAP National Greenhouse Advisory Panel
NGGI National Greenhouse Gas Inventory
of emissions and sinks
NGRS National Greenhouse Response Strategy
OECD Organization for Economic Co-operation and Development
RD&D Research, development and demonstration
SPREP South Pacific Regional Environment Program
UNCED United Nations Conference on Environment and Development
UNDP United Nations Development Programme
UNEP United Nations Environment Programme
UNIDO United Nations Industrial Development Organisation
WMO World Meteorological Organisation
Chemical compoundsCO carbon monoxide
CO2 carbon dioxide
CH4 methane
CFC chlorofluorocarbon
N2O nitrous oxide
NOx oxides of nitrogen
NMVOC non-methane volatile organic compounds
PFC perfluorocarbon
CF4 tetrafluoromethane
C2F6 hexafluoroethane
Executive summary
IntroductionAustralia, along with over 150 other countries, signed the United Nations Framework Convention on Climate Change at the United Nations Conference on the Environment and Development in June 1992. Australia became the ninth country to ratify the Convention when in December 1992 it lodged its instrument of ratification with the United Nations Secretary-General.
This national communication sets out how Australia, as an Annex 1 Party to the Convention, is meeting its international obligations. It provides a preliminary overview of the national circumstances that influence Australia’s response capacity and also outlines what strategies and measures have been taken to date to address the enhanced greenhouse effect.
Australia’s national contextAustralia is the lowest, the flattest and, apart from Antarctica, the driest of the world’s continents. With a land mass of over 768 million hectares, it is the sixth largest country in the world.
Australia has a wide range of climatic zones. Rainfall variability is characteristic of much of the continent. Extreme climate events such as droughts, floods, tropical cyclones, severe storms and bushfires are regular occurrences requiring flexibility and adaptation.
Australia’s population was 17.5 million at June 1991. This was an increase of 1.4 per cent over the previous year. Net immigration accounted for 43 per cent of the increase. In the period 1985–92, Australia has a population growth rate that was higher than all other Annex 1 countries with the exception of Turkey.
While the population density of Australia is only two people per square kilometre, the population is highly urbanised along the eastern and southern coasts, the south-west corner of the continent and the northern and eastern coasts of Tasmania.
Land use in Australia includes extensive natural landscapes as well as an array of human land uses.
Australia has one of the world’s largest designated areas of nature conservation to protect native flora and fauna with over 50 million hectares of terrestrial parks and reserves and some 41 million hectares of marine and estuarine protected areas.
Other land uses include human settlements and infrastructure, industry, agriculture and forestry. Agriculture, including broad acre pastoral land, covers 460 million hectares of land with a further 1 million hectares of plantation forest. Human settlements and infrastructure cover a relatively small area of land.
Australia has a mature economy with a large services sector and well developed agriculture, minerals and manufacturing base. Australia is a major trading nation in the Asia–Pacific region and the primary industry sectors (agriculture, minerals and energy) are highly export orientated. The structure of the Australian economy is a product of historical and geographic factors and, in particular, Australia’s endowment of natural resources.
Australia has developed energy supply and energy intensive industries based on its abundant fossil fuel energy resources especially coal and natural gas. Australia is a major energy exporter, supplying energy and energy intensive products, including processed minerals, to many developed and developing countries in the Asia–Pacific region and throughout the world. The availability of reliable long term energy supplies has been a fundamental factor in the development of energy intensive industries in Australia.
An economic structure which incorporates energy intensive industry together with a need to transport goods and people over long distances means that Australia’s per capita emissions are higher than the Organization for Economic Co-operation and Development (OECD) average. However, total greenhouse gas emissions in Australia are estimated to be less than 1.4 per cent of world emissions.
While Australia recognises that accurate scientific data on the potential regional impacts of climate change are not yet available, there are particular vulnerability that warrant action in line with the precautionary principle. For example, the dangers
1
Executive summary
of the spread of tropical diseases and pests could adversely affect agricultural and pastoral industries. Coastal areas may be subject to greater storm and flood frequency, increasing the cost of infrastructure and services.
On the other hand, at present, Australia has limited alternatives to the fossil fuel energy resources which support its current economic structure. Australia is therefore seeking to mitigate emissions through ‘no regrets’ measures, such as improving the efficiency with which energy is used. These measures not only limit emissions but reduce overall costs and enhance Australia’s international competitiveness.
Given our economic structure and trade competitiveness in the Asia–Pacific region, Australia may be vulnerable to some policies and measures, even if coordinated amongst Annex 1 countries.
Australia’s National Greenhouse Gas Inventory Australia has used a methodology based on the Intergovernmental Panel on Climate Change (IPCC) methodology to compile the Australian National Greenhouse Gas Inventory.
A key issue for Australia is the anthropogenic burning of biomass. This phenomenon has been occurring for at least the last 40 000 years as part of land management practices and is still used throughout Australia. Deliberate regular burning of biomass under controlled conditions causes less damage to vegetation, wildlife and human settlements than catastrophic bushfires. Because controlled burning does not change the natural carbon cycle, carbon dioxide emissions from that source have not been included in the inventory.
Overall, while the inventory is consistent with the current state of world knowledge in greenhouse gas assessments, the level of robustness in the figures
2
does vary with the quality of the data obtained. For example, while the transport sector estimates have a high degree of accuracy (plus or minus 10 per cent), the land use and forestry sector and the agriculture sector have a much higher degree of uncertainty (typically a factor of two). This is because of the implicit difficulty in obtaining accurate data and statistics on land clearing and on the carbon content of vegetation and in soils. Research to improve the quality of the data will continue.
The inventory shows that in 1990 Australia emitted 572 million tonnes of carbon dioxide equivalent, of which the distribution by gas was:
• carbon dioxide—73.4 per cent
• methane—22.9 per cent
• nitrous oxide—3.1 per cent
• other—0.6 per cent.
Total carbon dioxide emissions for 1990 from all sectors amounted to 420 million tonnes. Carbon dioxide emissions from energy production and use (282 million tonnes) dominate. Emissions from land use change and forestry contributed just over 30 per cent of the total.
Within the energy sector, the main source of carbon dioxide emissions is energy transformation industries which produce 160 million tonnes of carbon dioxide. Emissions from energy and transformation industries were close to twice those of transport. Industrial processes sector emissions are only 1 per cent of total carbon dioxide emissions. The main source of emissions in the biosphere was land clearing for agriculture; these emissions are estimated by the expert group to lie between 39 million tonnes and 352 million tonnes with a best estimate of 156 million tonnes. Managed forests are, however, a sink and carbon
Executive summary
dioxide uptake by managed forests and pasture improvement amounted to 25 million tonnes or 16 per cent of carbon dioxide emissions from land clearing.
Methane emissions for 1990 amounted to 6.2 million tonnes. In terms of carbon dioxide equivalents, methane emissions at 131 million tonnes accounted for about 23 per cent of total emissions of 572 million tonnes. The main sources of methane emissions were waste and agriculture, especially livestock.
Nitrous oxide emissions of 17.4 million tonnes carbon dioxide equivalent make up 3 per cent of total 1990 greenhouse gas emissions of 572 million tonnes. Agriculture was the primary source of nitrous oxide emissions.
The sources of other minor gases are discussed in the body of the report.
National Greenhouse Response StrategyThe primary framework for addressing climate change is the National Greenhouse Response Strategy which, along with the National Strategy for Ecologically Sustainable Development, was endorsed by Australian governments (Commonwealth, State and local) in 1992. It is important to note that the strategy is a dynamic one that provides for a phased approach to the introduction of measures in order to achieve cost-effective outcomes of lasting, long-term benefit.
In the first phase of measures adopted under the strategy, Australian governments agreed to a range of initiatives based on the comprehensive approach of addressing all sources, sectors and sinks of greenhouse gases. The prime objective is set by the Interim Planning Target which aims to:
stabilise greenhouse gas emissions (not controlled by the Montreal Protocol) based on 1988 levels by the year 2000 and to reduce these emissions by 20 per cent by the year 2005…subject to Australia not implementing response measures that would have net adverse impacts nationally or on Australia’s trade
competitiveness, in the absence of similar action by major greenhouse gas producing countries.
The main initiatives aimed at addressing greenhouse gas emissions are:
• structural reform of the electricity sector (including integrated least-cost planning)
• energy pricing to better reflect economic, social and environmental costs
• removal of impediments to free and fair trade in natural gas in Australia
• promoting greater use of co-generation and renewable energy options
• improved energy performance in the household, industrial, commercial and transport sectors
• provision of information for energy users.
The National Greenhouse Response Strategy recognises that greenhouse friendly policies must be supported by institutional and structural reform particularly in the energy sector. This sector is primarily the responsibility of the States under Australia’s federal system of government.
Australia’s response also embraces many measures on land management which are detailed in Australia’s Ecologically Sustainable Development Strategy and in this report.
National electricity market reformsThe Council of Australian Governments (a domestic heads of government forum for discussing broad, strategic policy issues) agreed to cooperate in the implementation of major structural reform of the electricity supply industry. A National Grid Management Council has been established to oversee the implementation of reforms that include the introduction of competition in the generation sector and the establishment of an independent interstate transmission network separate from generation and distribution interests. The scheduled implementation date for the competitive
3
Executive summary
electricity market is 1 July 1995.
The move to a competitive market will allow a range of specific energy benefits to be realised. A competitive market will provide the right price signals which will ensure that efficiency measures, renewable energy options and demand side measures are adopted where they are more cost-effective.
For greenhouse gas abatement, this means opening up the opportunities for cleaner energy forms (for example, natural gas and solar power) as well as giving co-generation and demand management options the capacity to compete with traditional coal-based electricity generation. Australia already is a world leader in solar technology while co-generation and demand management are being progressively implemented at enterprise level.
For example, a demand management action plan developed by the State Electricity Commission of Victoria resulted in the investment of A$33 million in energy efficiency measures for Victorian busi-nesses. Telecom Australia has used photovoltaic technologies since the 1980s for telecommunica-tions, while economic incentives have been used nationally to encourage demand for solar hot water systems. In South Australia, methane from one large landfill site is being used to generate power to supplement the state electricity grid. There are about a dozen landfill gas recovery sites in Australia.
Also, a major point is that the development of a national electricity market is providing incentives for the growth States like Queensland to draw on the excess generating capacity of States such as New South Wales, thereby obviating the necessity for additional electricity generation in the future. In addition, pricing policies that better reflect the full cost of supply and that eliminate cross subsidies should also encourage more sensible investment in energy infrastructure.
4
Sectoral initiativesA national program of action on energy management involving the Commonwealth, States and Territories is coordinated by the relevant ministerial council. Energy audits, the use of energy efficient building materials and appliances, guidelines for passive solar housing and strategic designs for more energy efficient urban development are all being actively investigated or implemented at national, State or local government level.
To reduce energy use in government buildings, the Prime Minister in 1992 announced energy efficiency targets for buildings owned or occupied by the Commonwealth. A 15 per cent increase in efficiency is anticipated within five years and 25 per cent within 10 years.
In the manufacturing sector, the Commonwealth has encouraged firms at the enterprise level to adopt greater energy efficiency through programs such as Enterprise Energy Audit Program, the Cleaner Production Program and the Better Business by Environmental Management Program. Measures have also been included in the tax system to enable firms to invest in new plant and equipment and offset the costs of environmental expenditures. This provides an incentive for investment in greater energy efficiency.
In the transport sector, government initiatives with the potential to save energy and reduce carbon dioxide emissions include rail reforms, road transport reform, the promotion of technical innovation, controls on vehicle emissions, a national bicycle strategy, improving the efficiency of public transport and fleets, the use of alternative fuels, urban planning and design and travel demand strategies.
Executive summary
Sustainable land use management is becoming the subject of increasing attention in Australia with greenhouse benefits stemming from the enhancement and preservation of the carbon sinks in vegetation and soils. The period 1990–1999 has been declared the decade of Landcare and more than A$420 million has been committed by the Commonwealth for land management, tree planting and remnant vegetation protection programs. Tax concessions have also been provided to enable rural producers to offset environmental management costs. Measures to manage land clearing and forestry have also been introduced as part of the broad range of measures agreed on as part of the National Strategy for Ecologically Sustainable Development and the National Forest Policy Statement.
Research into the processes of climate change and its monitoring has also been a major task for Australia’s premier research institutions. A core research program is conducted by the Commonwealth Scientific and Industrial Research Organisation in conjunction with the Bureau of Meteorology and leading universities to investigate the fundamental aspects of climate change. A dedicated research program has also been established to increase understanding of the processes and sensitivities of climate change and the implications for adaptation. International, regional and bilateral research cooperation is also undertaken by Australia.
A number of preliminary research activities on the economic impact of response measures have also been undertaken.
The importance of having all stakeholders involved in the consideration and implementation of greenhouse gas abatement activity is underscored by the Commonwealth Government’s establishment of the National Greenhouse Advisory Panel (with membership drawn from key community interest groups) and the establishment of non-government organisation forums to keep agencies abreast of current developments (in science and policy) within an open government framework. A specific greenhouse subcommittee of the
Intergovernmental Committee for Ecologically Sustainable Development has also been established to consider possible options to strengthen the National Greenhouse Response Strategy.
In recognition of the global nature of climate change, international assistance has also been provided to developing countries both on a multilateral and bilateral basis. For example, Australia has contributed A$30 million in the pilot phase for the Global Environmental Facility and further funds are planned for replenishment. Other assistance has been provided through a range of specific program areas relating to climate change.
Projections and impacts of measuresOn present estimates, if no greenhouse gas measures were taken, Australia’s greenhouse gas emissions would grow from 572 million tonnes of carbon dioxide equivalent in 1990 to 654 million tonnes in the year 2000. This would represent an increase of 82 million tonnes or 14 per cent over 1990 levels. This estimate is, however, dependent on the present accuracy and continuing validity of a number of assumptions, such as oil prices, population growth rates, agricultural markets and technological change.
If existing measures are continued at the current rate of application, it is estimated that they would result in emission reduction of about 44 million tonnes of carbon dioxide equivalent in the year 2000. Of this, measures aimed at reducing emissions from sources are estimated to contribute 29 million tonnes, and measures aimed at sink enhancement are estimated to contribute the remaining 15 million tonnes.
With current measures taken into account, Australia’s greenhouse gas emissions in the year 2000 are projected to be 606 million tonnes of carbon dioxide equivalent, which is 38 million tonnes (7 per cent) above 1990 levels.
5
Executive summary
Future directions for AustraliaThe Australian Government has always envisaged that the National Greenhouse Response Strategy would be a framework for a phased response. The Intergovernmental Committee for Ecologically Sustainable Development, which includes representation from Commonwealth, State and Territory first ministers, in partnership with the National Greenhouse Advisory Panel, will have a prime role in assessing opportunities for the development of the National Greenhouse Response Strategy. The Commonwealth Officials Working Group will also assist in facilitating the process for considering further measures in 1994. The need for key stakeholders to be actively involved and to contribute to the process is recognised by the Commonwealth Government. At the same time the scope for international cooperation on both a bilateral and a multilateral basis is also a future area for activity.
The National Greenhouse Advisory Panel will provide guidance on possible additional measures that may be introduced in the future. Currently the Commonwealth Government, in consultation with stakeholders, is examining the areas on which to focus future efforts. Energy services, urban and infrastructure development, transport, commerce and industry, and sink conservation and enhancement are areas from which possible measures might be drawn.
6
1
Chapter One
Australia in context
Australia is committed to contributing to effective global action to protect the world’s climate system from the potential adverse effects of anthropogenic climate change.
In taking on this vital responsibility, Australia is conscious that each country, whether developed or developing, will play an individual role. This is because each country is different: different because of historical, present and future realities and perspectives. These differences are recognised in the Convention and its obligations.
When assessing the role that each country plays, Australia believes it will be important to consider the country’s backdrop or profile to illustrate the particular circumstances faced in reducing greenhouse emissions and adapting to climate change impacts.
The following information helps to paint a basic picture of Australia, its natural and built environments, its people, and its economy. Australia believes these factors combine to provide us with a unique situation—one filled with opportunities and challenges.
The geography and environment of AustraliaOne of the key determinants of any country’s context relative to climate change issues is its geography and environment or, in other words, its physical form. For Australia, geography and environment, and abundance of natural resources, provide the framework for describing the climate change picture.
Australia has a land area of 7 682 300 square kilometres, excluding external Territories, making it the sixth largest country in the world, and the largest in the southern hemisphere. The Australian continent extends from approximately 5° south to 40° south of the equator. Australia is also the only country that solely occupies a continent, providing Australians with some unique circumstances relative to other developed countries. All Australia’s interaction with other countries, such as trade and bilateral and regional relationships, is conducted over vast distances.
Australia is one of the oldest, lowest, flattest and, apart from Antarctica, driest of the continents. The world’s second largest sub-tropical desert is found in Australia and occupies about 85 per cent of the land mass. The coastline stretches for 36 700 kilometres, giving us a diverse marine environment including tropical mangrove and coral reef habitats.
Many Australian soils are derived from ancient material which has a slow rate of soil formation and as a result tend to be shallow and infertile. This makes a mere 10 per cent of Australia’s huge expanse arable.
Australia has been geographically isolated from other continents since it separated from Antarctica 35 million years ago. As a result a unique biota has evolved. Australia is recognised as one of about a dozen countries with megadiversity. Australia has the planet’s second highest number of reptile species (686), is fifth in flowering species (23 000) and tenth in amphibian species (over 180).
7
Australia in context
These factors combine to give Australia a distinctive physical geography and an unique natural environment and contribute to the potential vulnerability of Australia to climate change impacts.
Australia’s climateThe threat of the impacts of anthropogenic climate change has enormous significance to all countries. Few countries are already subject to such great climate variability as Australia, and have an economy with such a high dependence on their agricultural sector. Therefore, the potential threats take on a special dimension for Australia.
Australia has a wide range of climatic zones, from the tropical regions in the north, to the arid expanses of the interior, and the temperate regions in the south. Thus any shift in the climate regime with latitude resulting from anthropogenic sources has the potential to affect vast areas of the continent.
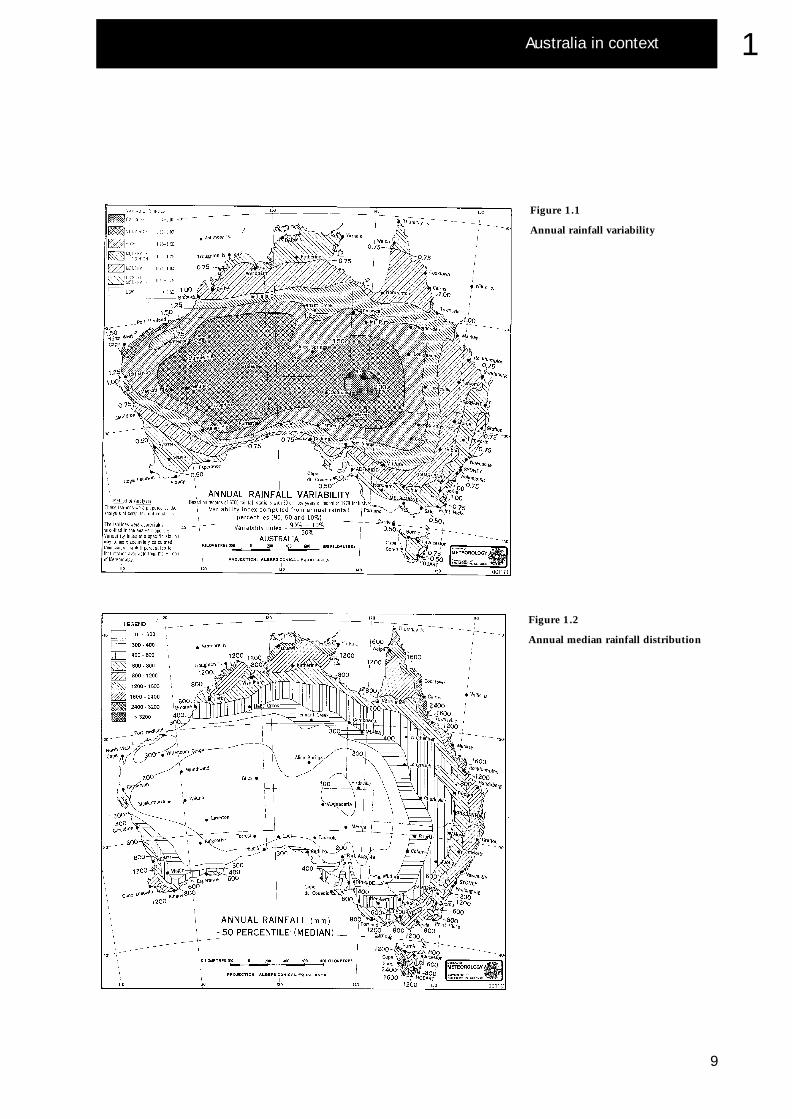
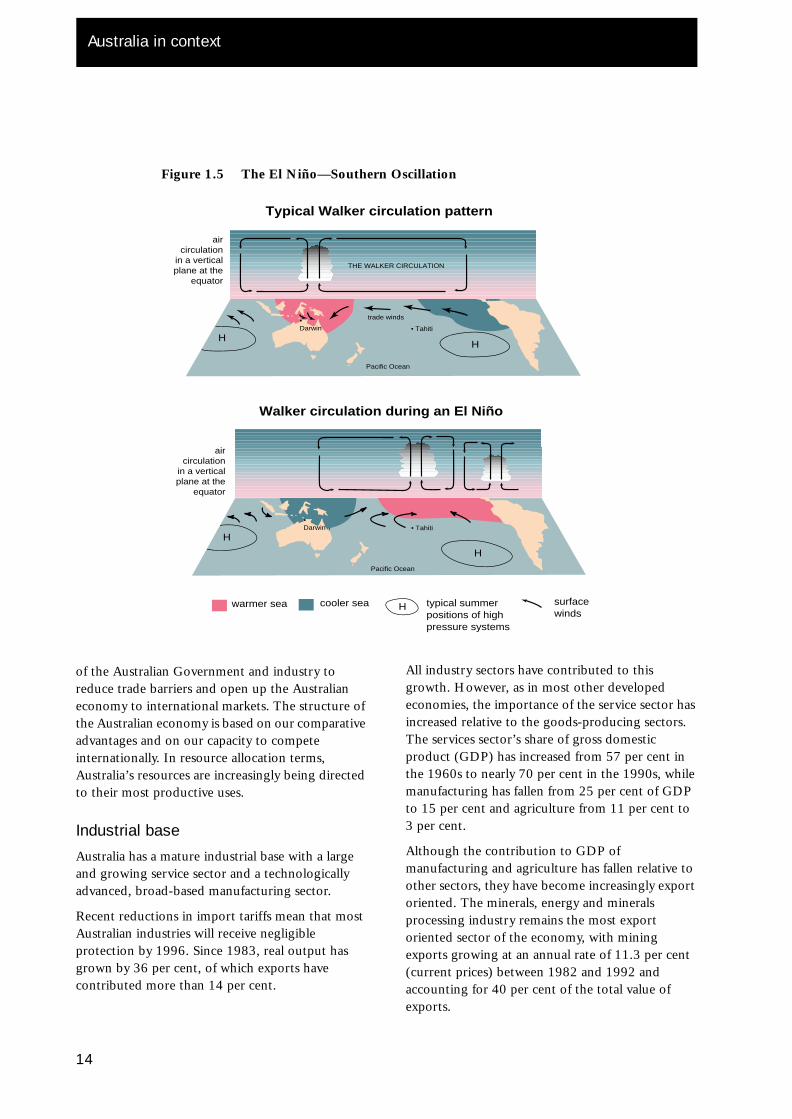
As a function of its geographical location in the southern hemisphere on the western rim of the Pacific Ocean, the most notable feature of the climate is the extreme rainfall variability over much of the continent. Figure 1.1 shows the annual rainfall variability. This variability exposes Australia to many extreme climate events—particularly droughts, floods, tropical cyclones, severe storms and bushfires. The El Niño–Southern Oscillation phenomenon (Figure 1.5) makes a significant contribution to inter-annual rainfall variability.
As already noted Australia is the second driest of all continents. Eighty per cent of Australia has a median rainfall of less than 600 millimetres annually and 50 per cent of Australia has less than300 millimetres. Figure 1.2 shows the annual median rainfall distribution.
8
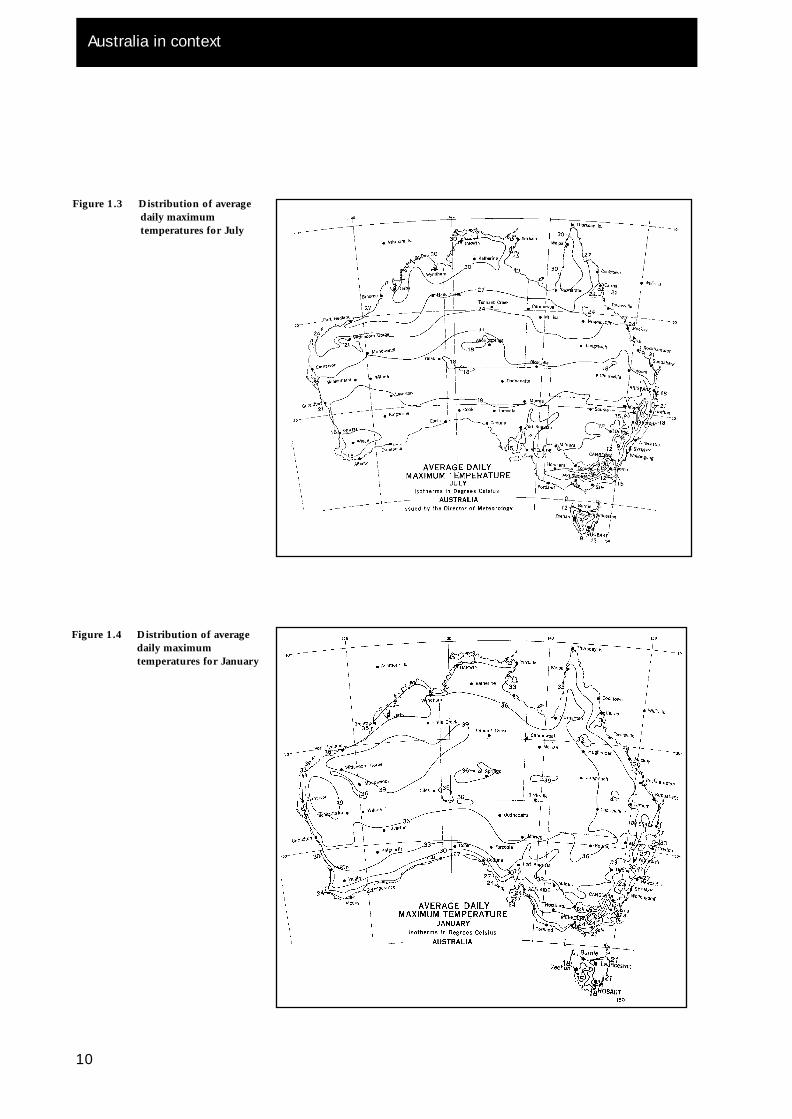
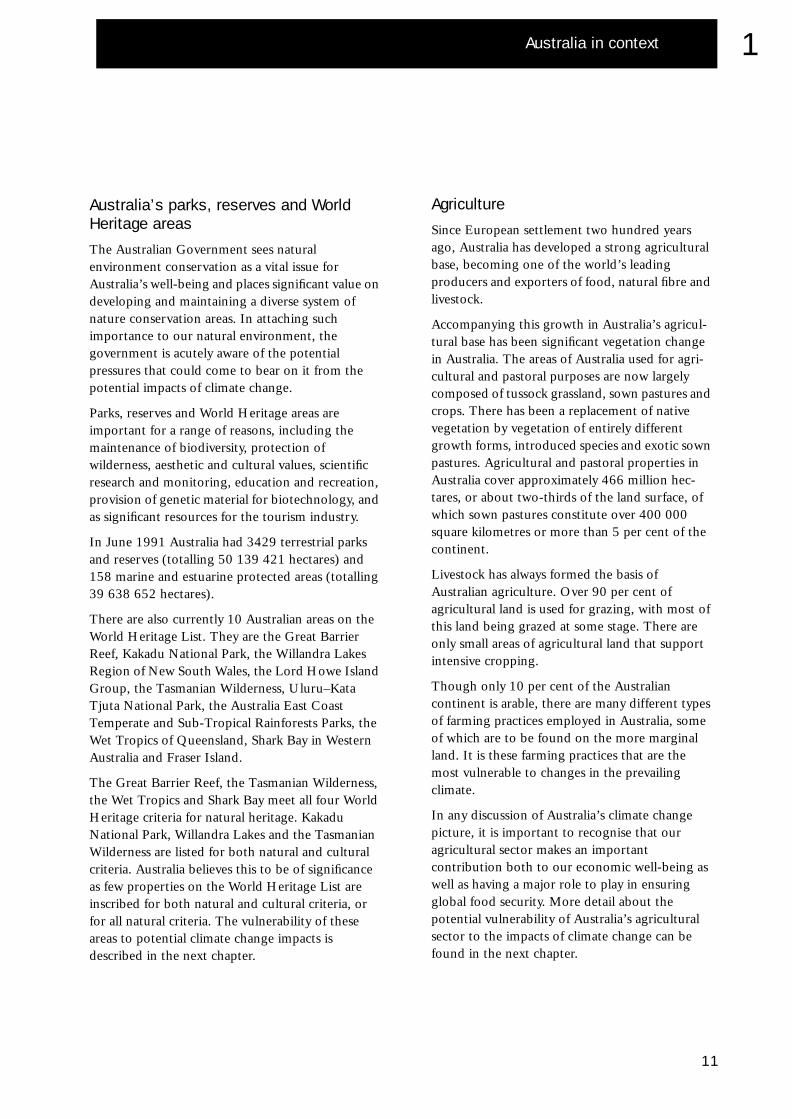
High temperatures over large areas of the continent, particularly in summer, exacerbate the impact of the relatively frequent occurrence of drought. The distribution of average daily maximum temperatures across Australia for July and January are shown in Figure 1.3 and Figure 1.4 respectively.
Along the narrow coastal strip, where the majority of the population centres are located, sea breezes moderate maximum temperatures during warmer months. The coastal regions also experience smaller daily temperature ranges than inland areas because of the influence of the sea. Frosts are a regular occurrence during winter in the southern inland half of the continent and can cause serious losses to some agricultural crops. Year-to-year snowfall in Australia is highly variable in area, depth and duration and is usually restricted to south-eastern Australia in areas above about 1500 metres and rarely occurs below 500 metres. High levels of solar radiation are a feature of most of the continent. There are also areas of high winds suitable for harnessing for wind power generation.
The great range of climate zones, experience with large seasonal to inter-annual climate variability, and high prevalence of natural disasters have resulted in Australia (its natural and human environments) developing adaptability and flexibility in dealing with climate-related issues.
Natural resources and land use Land in Australia supports a vast range of activities including: agricultural production, forestry, mining and quarrying, human settlements, transport and communication, nature conservation, tourism and recreation. Water supply and water quality are also two important natural resources, and are predicted to become increasingly important issues.
Australia in context
9
1
Figure 1.1
Annual rainfall variability
Figure 1.2
Annual median rainfall distribution
Australia in context
10
Figure 1.3 Distribution of average daily maximum temperatures for July
Figure 1.4 Distribution of average daily maximum temperatures for January
Australia in context
1
Australia’s parks, reserves and World Heritage areas
The Australian Government sees natural environment conservation as a vital issue for Australia’s well-being and places significant value on developing and maintaining a diverse system of nature conservation areas. In attaching such importance to our natural environment, the government is acutely aware of the potential pressures that could come to bear on it from the potential impacts of climate change.
Parks, reserves and World Heritage areas are important for a range of reasons, including the maintenance of biodiversity, protection of wilderness, aesthetic and cultural values, scientific research and monitoring, education and recreation, provision of genetic material for biotechnology, and as significant resources for the tourism industry.
In June 1991 Australia had 3429 terrestrial parks and reserves (totalling 50 139 421 hectares) and 158 marine and estuarine protected areas (totalling 39 638 652 hectares).
There are also currently 10 Australian areas on the World Heritage List. They are the Great Barrier Reef, Kakadu National Park, the Willandra Lakes Region of New South Wales, the Lord Howe Island Group, the Tasmanian Wilderness, Uluru–Kata Tjuta National Park, the Australia East Coast Temperate and Sub-Tropical Rainforests Parks, the Wet Tropics of Queensland, Shark Bay in Western Australia and Fraser Island.
The Great Barrier Reef, the Tasmanian Wilderness, the Wet Tropics and Shark Bay meet all four World Heritage criteria for natural heritage. Kakadu National Park, Willandra Lakes and the Tasmanian Wilderness are listed for both natural and cultural criteria. Australia believes this to be of significance as few properties on the World Heritage List are inscribed for both natural and cultural criteria, or for all natural criteria. The vulnerability of these areas to potential climate change impacts is described in the next chapter.
Agriculture
Since European settlement two hundred years ago, Australia has developed a strong agricultural base, becoming one of the world’s leading producers and exporters of food, natural fibre and livestock.
Accompanying this growth in Australia’s agricul-tural base has been significant vegetation change in Australia. The areas of Australia used for agri-cultural and pastoral purposes are now largely composed of tussock grassland, sown pastures and crops. There has been a replacement of native vegetation by vegetation of entirely different growth forms, introduced species and exotic sown pastures. Agricultural and pastoral properties in Australia cover approximately 466 million hec-tares, or about two-thirds of the land surface, of which sown pastures constitute over 400 000 square kilometres or more than 5 per cent of the continent.
Livestock has always formed the basis of Australian agriculture. Over 90 per cent of agricultural land is used for grazing, with most of this land being grazed at some stage. There are only small areas of agricultural land that support intensive cropping.
Though only 10 per cent of the Australian continent is arable, there are many different types of farming practices employed in Australia, some of which are to be found on the more marginal land. It is these farming practices that are the most vulnerable to changes in the prevailing climate.
In any discussion of Australia’s climate change picture, it is important to recognise that our agricultural sector makes an important contribution both to our economic well-being as well as having a major role to play in ensuring global food security. More detail about the potential vulnerability of Australia’s agricultural sector to the impacts of climate change can be found in the next chapter.
11
Australia in context
Forestry
The forests of Australia, both public and private, are valuable renewable resources providing many benefits. When managed in an ecologically sustainable way, they provide food and shelter for a large number of animals as well as satisfying many community needs for resource use such as wood production, water and recreational activities, and greenhouse gas sinks.
In Australia, tree cover can be classified under a number of broad categories including rainforest, wet and dry sclerophyll forest, mixed forest and woodlands or shrub lands. Characteristics of these ecosystem types are determined by the interplay of a range of factors including rainfall, soil, topography, temperature and distinguishing ecological processes.
Australia has a total land area of approximately 768 million hectares, of which 63 million are classified as woodland, 41 million are native forest and 1 million are plantations.
Fisheries
The Australian fishing zone covers an area 16 per cent larger than the Australian land mass and is the third largest fishing zone in the world. Australia’s fisheries are extremely diverse but, by world standards and considering its position with respect to major ocean circulation patterns, its marine ecosystem is relatively unproductive. Overall, Australia’s fish production is not significant by world standards.
In 1990–91 the gross value of commercial fisheries production in Australia was estimated to be A$1137 million. Of this total, aquaculture production (including oysters, pearls, salmonids, prawns, marine and ornamental fish) comprised around 20 per cent. In relative importance, commercial fish production ranks behind Australia’s major livestock and cropping industries but is worth more than sheep, pig or poultry meat production.
While the value of commercial fish landings
12
accounts for about 3 per cent of all farm and fish production in Australia, the fishing industry is of major significance in some regions, providing an important source of employment and business activity. In commercial importance, the most valuable fisheries are rock lobster, prawns and abalone.
Mineral resources
The Australian mineral industry provides construction materials, energy resources such as fossil fuels—coal, oil and natural gas—and industrial raw materials. It now produces some 65 different mineral commodities. Australia is one of the world’s leading miners of bauxite, diamonds, gold, iron ore, lead, manganese ore, nickel, titanium, tungsten, zinc, uranium and zircon.
PopulationThe estimated resident population of Australia at 30 June 1991 was 17.5 million, an increase of 1.4 per cent over the previous year. Natural increase contributes approximately 57 per cent to Australia’s population, while net migration accounted for 43 per cent of this increase.
From year to year overseas migration gains are continuing to be more volatile than natural increases and, because of their size, are setting the pattern for trends in total population growth. From a peak of 1.8 per cent in 1981–82, the total growth rate dropped to 1.2 per cent in the middle of the 1980s as the migration intake declined. In the latter part of the decade the sharp rise in net migration resulted in a recovery in total growth to 1.7 per cent in 1989. In the 1990s the total growth rate has fallen back again as the migration intake eases.
Overall, Australia’s current population growth rates are higher than the average for countries in the OECD. According to the World Bank, for the period 1985–92, Australia’s population growth rate was 1.6 per cent, only one other Annex I country, Turkey (2.2 per cent) having a greater growth rate for the same period.
Australia in context
1
Distribution and demography
The population density of Australia is two people per square kilometre. This is low by world standards—Singapore has 4475, Japan 321, UK 230 and the US 26 people per square kilometre.
The low population density figure for Australia masks the urbanised pattern of population distribution and the level of population that can be sustainably supported by land and water supplies. Nearly 75 per cent of Australians live in or within 50 kilometres of Australia’s coastal cities and thus are potentially threatened by any impacts of climate change on sea levels. More than six million people, about 35 per cent of the total population, live in the two major cities, Sydney and Melbourne.
Australia’s population is projected to progressively age with the median age of the population of 31.9 years in 1989 projected to rise to between 38.2 and 39.0 years in 2011. The population aged 65 and over is projected to significantly increase for the same period, from 11 per cent to 13.7 per cent of the total.
Constitutional arrangementsThe Commonwealth of Australia consists of a federation of eight self-governing States and Territories: Victoria, New South Wales, Queensland, Western Australia, South Australia, Tasmania, the Australian Capital Territory and the Northern Territory.
The Australian Constitution, which came into effect in 1901, provides for the operation of the Federal Parliament. The Federal Government is headed by the Prime Minister and includes ministers who are responsible for particular federal matters.
Each of the States and Territories has its own government. Before the establishment of the self-governing States and Territories, communities were encouraged to form local governments. As a consequence, there are currently 914 local governments in Australia.
The three levels of government in Australia have an important role to play in developing, implementing and monitoring our greenhouse response. All have endorsed Australia’s National Greenhouse Response Strategy, giving Australia a national approach to the challenge of anthropogenic climate change.
Australia’s economyAustralia has the thirteenth largest economy in the world. In 1991–1992, we had a gross domestic product of A$389 billion and a GDP per capita of A$22 400. While annual real GDP growth has averaged 3.2 per cent between 1970–71 and 1992–93, there have been significant fluctuations in the growth rate over this period.
Australia experienced a recession in 1990–91, but recovery is well under way. Since the recession, Australia’s economy has grown considerably faster than other OECD countries’ economies, with a growth of 2.7 per cent in 1992–93 and expected growth of about 3.5 per cent in 1993–94.
A significant effect on Australia’s economy is drought, with the major 1982 El Niño occurrence (Figure 1.5) resulting in a 40 per cent drop in the wheat harvest, a loss of 20 million sheep, and a decrease in farm income of A$300–500 million.
The improvement in key economic factors in recent years and continuing micro-economic reform should provide a more solid foundation for sustainable growth in the economy and employment throughout the remainder of the decade and beyond.
The structure of the Australian economy has also been changing as a result of an economic reform program that has been pursued over the past decade. The thrust of economic policy has been toward integrating the Australian economy with the global economy and exposing local industries and government business enterprises to domestic and international competitive pressures. Over recent years there has been a concerted effort on the part
13
Australia in context
Typical Walker circulation pattern
Walker circulation during an El Niño
aircirculation
in a verticalplane at the
equator
aircirculation
in a verticalplane at the
equator
THE WALKER CIRCULATION
trade winds
Pacific Ocean
Pacific Ocean
• Darwin
• Darwin
• Tahiti
• Tahiti
HH
H
H
Hwarmer sea cooler sea typical summerpositions of highpressure systems
surfacewinds
• Darwin
Figure 1.5 The El Niño—Southern Oscillation
of the Australian Government and industry to reduce trade barriers and open up the Australian economy to international markets. The structure of the Australian economy is based on our comparative advantages and on our capacity to compete internationally. In resource allocation terms, Australia’s resources are increasingly being directed to their most productive uses.
Industrial base
Australia has a mature industrial base with a large and growing service sector and a technologically advanced, broad-based manufacturing sector.
Recent reductions in import tariffs mean that most Australian industries will receive negligible protection by 1996. Since 1983, real output has grown by 36 per cent, of which exports have contributed more than 14 per cent.
14
All industry sectors have contributed to this growth. However, as in most other developed economies, the importance of the service sector has increased relative to the goods-producing sectors. The services sector’s share of gross domestic product (GDP) has increased from 57 per cent in the 1960s to nearly 70 per cent in the 1990s, while manufacturing has fallen from 25 per cent of GDP to 15 per cent and agriculture from 11 per cent to 3 per cent.
Although the contribution to GDP of manufacturing and agriculture has fallen relative to other sectors, they have become increasingly export oriented. The minerals, energy and minerals processing industry remains the most export oriented sector of the economy, with mining exports growing at an annual rate of 11.3 per cent (current prices) between 1982 and 1992 and accounting for 40 per cent of the total value of exports.
Australia in context
1
Over the past 50 years, the services sector—and tourism in particular—has grown to become a significant economic, social and cultural activity in Australia. Growth in tourism to Australia in recent years has been rapid. It is estimated that tourism contributed 5.1 per cent (A$23.4 billion) to Australia’s GDP in 1989–90, of which 74 per cent was attributed to domestic tourism. A strong and viable tourism industry will remain a major contributor to continued employment growth and tourism’s contribution to foreign exchange earnings will continue to be a significant item in Australia’s balance of payments.
The potential impacts of climate change, especially on Australia’s natural environment, have obvious implications for Australia’s tourism industry. The amount of tourism in Australia is also potentially sensitive to changes in the costs of domestic and international travel, which could be affected by some types of greenhouse response measures.
Transport
The geographic and demographic characteristics of the country have greatly influenced the structure of the Australian transport system. With 75 per cent of Australia’s population resident in urban centres, the transport system, more than in most other industrialised nations, has had to meet needs set by vast distances between urban centres. Also, a key determinant in how Australia’s transport system has evolved is the need to transport large volumes of commodities, both rural and mineral, from inland production areas to cities and ports.
The transport sector in Australia is dominated by the road sector. Almost 90 per cent of passenger kilometres and 33 per cent of tonne kilometres is accounted for by road transport. This predominance of road transport over other modes has increased significantly over the last two decades with large decreases in rail freight and passenger movements. This growth picture is reflected in the energy used by the transport sector. Rapid growth in diesel fuel use for road freight has also been evident over the same period.
In Australia the transport sector accounts for some 24 per cent of all emissions of carbon dioxide from fossil fuels. Cars account for some 12 per cent of all carbon dioxide emissions, and some 53 per cent of all transport carbon dioxide emissions.
The performance of the transport sector has a critical effect on Australia’s economic performance. Freight transport is an important component in the cost structure of Australian industry and so is a prominent element in determining the price of intermediate inputs of finished goods. For a highly foreign-trade-exposed country such as Australia, this high percentage contribution of the transport sector to final price makes it imperative for economic well-being that the sector be not only internally efficient but also competitive by world standards.
Australia’s trade
Australia has always been a trading nation. Agricul-tural and mineral resources make up 65 per cent of total exports of goods and services. Manufactured goods make up a further 15 per cent and the serv-ices sector contributes about 20 per cent.
Over the past 10 years Australia has had one of the highest rates of growth in exports of manufactured goods and mineral products in the OECD. Exports of manufactures have grown at 12.5 per cent annually between 1982 and 1992, four times faster than agricultural exports and slightly faster than mining. Much of the shift is structural and has been underpinned by policy measures that have opened Australia to more international competition and have improved the flexibility of product and factor markets.
Australia has a strong comparative advantage in resource processing—adding value to farm, timber and mineral products. These resource processing industries which tend to be energy intensive have subsequently led to a growing energy intensity of Australian exports. Major Australian processed exports include food goods, metals products, machinery and equipment, and chemicals, petroleum, aluminium and coal products.
15
Australia in context
Exports have contributed appreciably to output growth during most of the past decade. Real output has grown by about 36 per cent, of which exports have contributed more than 14 percentage points. The expected upturn in global economic activity should bring further improvement to Australia’s trading results.
Australia’s resource endowments and efficient farming, pastoral and mining practices have given it a clear competitive advantage in primary production. A major share of Australia’s export revenue depends on sales of primary products and will continue to do so for the foreseeable future. But Australia is striving to diversify its export mix, and in particular to increase its exports of services and high-value-added manufactures.
Australia still runs a significant deficit on its trade in services. But in the past decade, services exports have grown more strongly than merchandise exports. By 1992–93, services exports had risen to about 3.3 times their 1982–83 value, whereas merchandise exports had risen to about 2.9 times their 1982–83 value.
The broad balances in Australia’s merchandise trade reflect the traditional pattern—Australia runs large surpluses on trade in primary products and large deficits on trade in manufactures.
A large share of Australia’s exports has traditionally been sold to the industrialised countries of Europe, to the United States and to Japan. These countries together still buy about half of Australia’s exports. Increasingly though, non-traditional partners (industrialising Asia, especially) are among Australia’s fastest growing export markets, and conversely are becoming our competitors. In 1982–83, South-East Asia bought about 8 per cent of Australia’s merchandise exports; by 1992–93, that share had risen to 14 per cent. The corresponding share for North Asia excluding Japan has risen from 11 per cent to 19 per cent during the past decade.
16
The role of the energy sector
Resources
Australia has large resources of coal and uranium, substantial resources of natural gas and significant, but limited, resources of crude oil and condensate. There are, in addition, extensive but currently sub-economic resources of shale oil, and vast inferred coal resources. With the exception of some coal resources, most of Australia’s fossil fuel energy resources are located in relatively isolated areas remote from demand centres. In particular a large proportion of our natural gas reserves are located in the centre and off the north-west shore of the continent and are remote from demand centres in the south-east. Significant levels of investment will be necessary to increase east coast access to gas.
Australia is considered to be relatively under-explored for energy resources and there appears to be good prospects for further substantial discoveries.
Renewable energy makes a contribution to Australia’s energy stocks. Australia has unlimited potential for the use of solar energy resources. Like fossil fuels, many renewable energy resources are unevenly distributed within Australia. Wind energy as a resource is found mainly on the coastlines of the southern States. Outside Tasmania and New South Wales, Australia has no real large-scale hydro-electricity potential, and most of the commercially favourable sites have already been exploited. There is potential for small-scale hydro-electricity generation which is being investigated
In contrast to many OECD countries, most of Aus-tralia’s energy requirements are met from domestic primary energy resources. The exception has been liquid fuels, although following major oil discover-ies in the 1960s and further discoveries in the 1980s, oil self-sufficiency has reached high levels, currently around 80 per cent. In the absence of fur-ther major discoveries, oil self-sufficiency will decline from the mid-1990s. Australia has no nuclear based energy compared to the OECD aver-age contribution of nuclear energy of 23.8 per cent.
Australia in context
1
Transformation and distribution
The process of converting primary energy into usable energy is itself a major user of primary energy. For example, the electricity generation sector is the single largest user of primary energy in Australia, accounting for 38 per cent of total domestic energy use in 1990.
The Australian electricity generation industry is largely State-based and dependent on fossil fuels, especially coal. The economics of electricity generation has generally favoured the siting of power stations relatively close to coal supplies. The electricity thus generated therefore needs to be transmitted via high-voltage transmissions lines to population centres and then distributed to users.
Energy losses during electricity transmission and distribution average about 8 per cent of the electricity generated, which reflects the large distances over which electricity is transmitted. Losses during natural gas transmission and distribution are significantly lower, and average less than 2 per cent.
The energy transformation sector is a significant direct contributor to Australia’s economic activity. Energy constitutes a significant input cost for some sectors of the economy, including the traded goods sector, and is, hence, an important component of Australia’s international competitiveness in key industries such as aluminium, other metals processing, and sectors having significant transport needs such as rural and mineral commodity production, timber production and tourism.
In 1989–90, the energy production sector, excluding coal and uranium production, accounted for:
• 5 per cent of GDP
• 1 per cent of total employment
• A$60 billion in capital investment, equivalent to 10 per cent of total non-residential investment
• 8 per cent of total Commonwealth Government revenues.
Energy demand
The demand for energy in Australia has been increasing strongly; it has more than tripled since the 1960s. However, the rate of increase has fallen steadily over this period (5.4 per cent per year in the 1960s to 2.7 per cent per year in the 1980s).
While aggregate energy consumption continues to grow, there are some indications that Australia is producing and using energy more efficiently, although the rate of increase in efficiency is generally lower than in other OECD countries.
Australia’s thermal efficiency in electricity generation and in the recovery of crude oil has been steadily increasing over the past two decades, while energy intensity (primary energy consumed per unit of GDP) increased during the early to mid-1970s but fell after 1977–78, levelling out in the mid-1980s. Australia’s electricity intensity (the ratio of electricity use per unit of GDP) has increased significantly over this period. These trends have also been affected by structural changes in Australia’s economy, particularly the increased upgrading of our commodity products.
17
Australia in context
Ecologically sustainable developmentAustralia has fully embraced the principles and practices of ecologically sustainable development and has as its primary goal:
development that improves the total quality of life, both now and in the future, in a way that maintains the ecological processes on which life depends.
Ecologically sustainable development in Australia had its beginnings in 1989 when the Australian Government held a summit of industry, union, consumer and conservation organisations in order to commence an approach towards encouraging Australia’s industry sectors and conservation groups to embrace and apply the principles of ecologically sustainable development.
Following on from this summit, an initial public discussion paper was produced which led the Federal Government to establish nine sectoral working groups to consider the implementation of ecologically sustainable development principles. Membership of these working groups was drawn from industry, the trade union movement, conservation groups, scientific organisations and all levels of Australian governments.
Based on the reports of these working groups, Australian governments have developed a National Strategy for Ecologically Sustainable Development. This national approach seeks to reduce the likelihood of serious environmental impacts arising from our economic activity. It means changes to Australia’s patterns of resource use, including improvements in the quality of Australia’s air, land and water, and in the development of new, environmentally friendly products and processes.
18
Australia and the Framework Convention on Climate ChangeAustralia signed the Convention at the United Nations Conference on Environment and Development (UNCED) in June 1992 and became the ninth country to ratify the Convention in December 1992. Since then Australia has been an active participant in the ongoing sessions of the Intergovernmental Negotiating Committee (INC). Australia is an Annex I Party to the Convention and this national communication is intended to meet our reporting requirements.
Australia’s role in the negotiations reflects the importance it attaches to maintaining an effective multilateral system. Climate change is a global problem which requires global solutions. We must ensure that international action will be both effective and equitable.
Australia also recognises the particular importance of the negotiations for countries in our region. The South Pacific and Indian Ocean countries have particular and obvious concerns about climate change and rising sea levels. Australian policy is responsive to these concerns through a commitment to exchanging information and undertaking research and monitoring of climate change; through support for regional conventions like the South Pacific Regional Environment Protection Convention and through working to ensure that regional interests are addressed in broader international forums such as the Intergovernmental Panel on Climate Change.
2
Chapter Two
Australia’s climate change
Australia is potentially vulnerable to both the
impacts of climate change and the impacts of
response measures taken to reduce
greenhouse gas emissions. The reasons for
this relatively unique situation of ‘dual’
vulnerability are many. Australia is the only
developed megadiversity country, with an
economy characterised by a strong reliance
on resource-based industries, large
agricultural and minerals sectors, and energy-
intensive industries such as steel and
aluminium production.
Climate change impacts
Since accurate regional predictions of climate change are not yet available, Australia makes considerable use of regional scenarios of climate change as a basis for assessing the potential impacts of climate change over the Australian continent.
While it will be some time before predictions can be accurately made, the scenarios provide a useful tool in terms of planning possible approaches to adaptation.
Scenarios of future climate
Methodologies used in Australia
A set of commonly-used scenarios is based on the
results from five different global climate models
(GCMs) developed by research groups around the
world. These GCMs, before incorporation into the
scenarios, were assessed against their ability to
simulate the present climate over the Australian
region. To date, the results from transient coupled
ocean-atmosphere model experiments have not
been available for this work, so these scenarios are
based on output from equilibrium double carbon
dioxide experiments.
The scenarios take into account:
• the full range of possible carbon dioxide emissions considered plausible by the Intergovernmental Panel on Climate Change
• the range in climate sensitivity for a doubling of carbon dioxide based on IPCC estimates
• a range of regional responses to global warming determined from the GCMs.
As a result, the low bound of the scenarios assumes
the lowest IPCC carbon dioxide emissions; a
climate sensitivity of 1.5°C for an equivalent
doubling of carbon dioxide; and a weak regional
response. The equivalent high bound to the
scenarios assumes the greatest IPCC emissions; a
climate sensitivity of 4.5°C for an equivalent
doubling of carbon dioxide and a strong regional
response, as determined from the GCM results.
Estimates of temperature and precipitation change
were then scaled down to two dates in the future:
2030 and 2070, and the regional patterns of
temperature and precipitation change were derived
from the GCMs directly.
19
Australia’s climate change vulnerabilities
Even though these scenarios are able to account for
three major sources of uncertainty, they do not
account for possible changes in the El Niño–
Southern Oscillation (ENSO) phenomenon, nor
changes in tropical cyclone frequency or intensity.
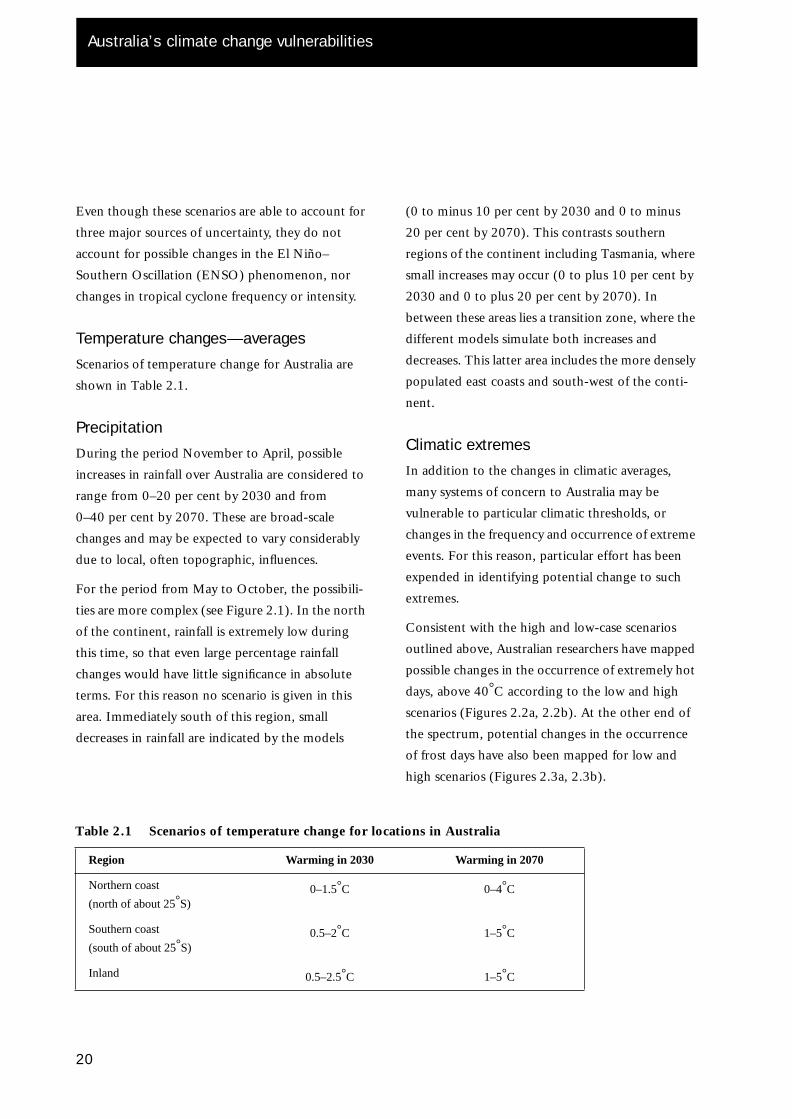
Temperature changes—averages
Scenarios of temperature change for Australia are
shown in Table 2.1.
Precipitation
During the period November to April, possible
increases in rainfall over Australia are considered to
range from 0–20 per cent by 2030 and from
0–40 per cent by 2070. These are broad-scale
changes and may be expected to vary considerably
due to local, often topographic, influences.
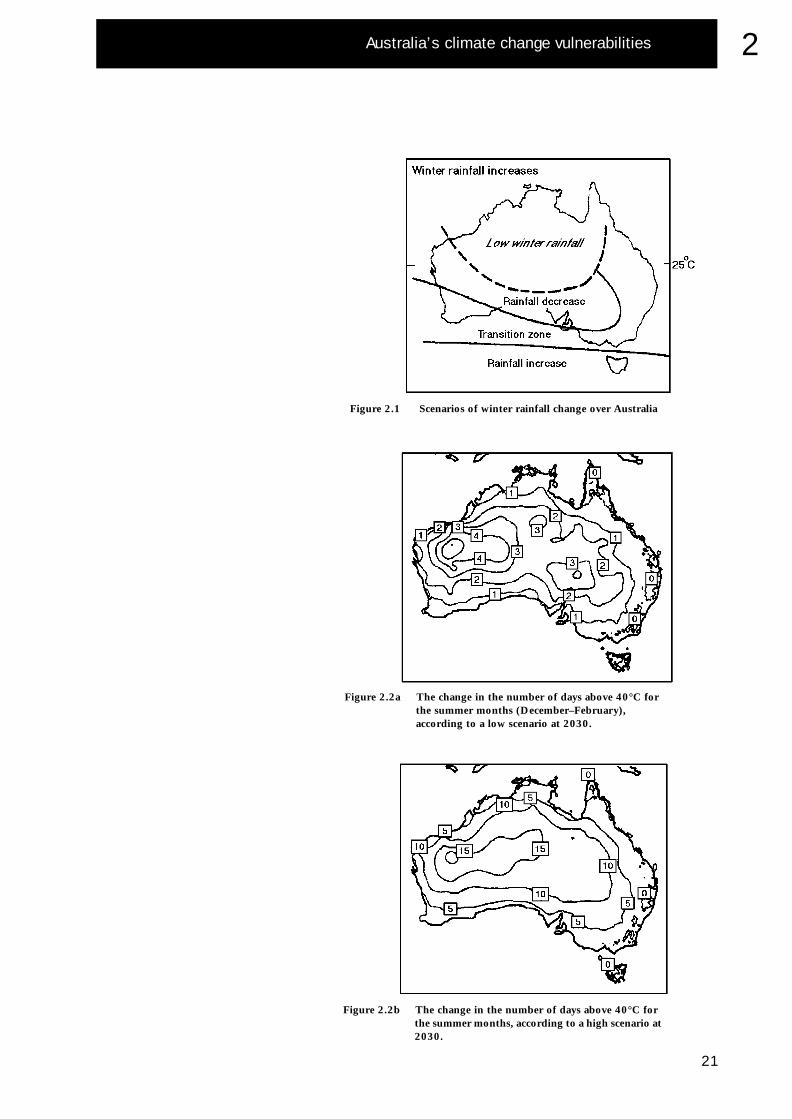
For the period from May to October, the possibili-
ties are more complex (see Figure 2.1). In the north
of the continent, rainfall is extremely low during
this time, so that even large percentage rainfall
changes would have little significance in absolute
terms. For this reason no scenario is given in this
area. Immediately south of this region, small
decreases in rainfall are indicated by the models
20
Table 2.1 Scenarios of temperature change for loca
Region Warming in 2030
Northern coast
(north of about 25°S)0–1.5°C
Southern coast
(south of about 25°S)0.5–2°C
Inland 0.5–2.5°C
(0 to minus 10 per cent by 2030 and 0 to minus
20 per cent by 2070). This contrasts southern
regions of the continent including Tasmania, where
small increases may occur (0 to plus 10 per cent by
2030 and 0 to plus 20 per cent by 2070). In
between these areas lies a transition zone, where the
different models simulate both increases and
decreases. This latter area includes the more densely
populated east coasts and south-west of the conti-
nent.
Climatic extremes
In addition to the changes in climatic averages,
many systems of concern to Australia may be
vulnerable to particular climatic thresholds, or
changes in the frequency and occurrence of extreme
events. For this reason, particular effort has been
expended in identifying potential change to such
extremes.
Consistent with the high and low-case scenarios
outlined above, Australian researchers have mapped
possible changes in the occurrence of extremely hot
days, above 40°C according to the low and high
scenarios (Figures 2.2a, 2.2b). At the other end of
the spectrum, potential changes in the occurrence
of frost days have also been mapped for low and
high scenarios (Figures 2.3a, 2.3b).
tions in Australia
Warming in 2070
0–4°C
1–5°C
1–5°C
Australia’s climate change vulnerabilities
21
2
Figure 2.1 Scenarios of winter rainfall change over Australia
Figure 2.2b The change in the number of days above 40°C for the summer months, according to a high scenario at 2030.
Figure 2.2a The change in the number of days above 40°C for the summer months (December–February), according to a low scenario at 2030.
Australia’s climate change vulnerabilities
2
For a number of reasons, possible changes in
precipitation are more difficult to quantify than
changes to temperature. Nevertheless, several
avenues of research, including the direct analysis of
GCM output, the use of limited area models nested
within a GCM, and synthetic data sets derived from
modified weather generators, all suggest that
significant increases to the frequency of heavy rain
events, or drought, may occur. As with scenarios
constructed for other regions of the world, those
discussed here are constrained by the detail available
from, and limitations associated with, the GCMs.
Duration of snow cover
The Australian Alps are located in the south-east of
the continent. In most years they experience a
significant winter snow cover. Parts of Tasmania are
also snow-covered for part of the year. In the
Australian Alps the snow cover generally lasts a few
weeks at elevations of 1200–1400 metres, to several
months at higher elevations. Although snowfall is
not unknown even at sea level in southern parts of
Australia, it is not of environmental or economic
significance outside the alpine area.
There have been several studies into the potential
changes in the duration of snow cover in the Aus-
tralian Alps as a consequence of global climate
change. In general, this work reveals that small
changes in temperature may significantly reduce
snow cover on some mountains. The research sug-
gests that snow cover in this region is less sensitive
to the changes in precipitation than temperature
under these scenarios of climate change.
2
Sea-level rise
Australia has more than 36 000 kilometres of
coastline. The IPCC scenarios of sea-level rise
have been adopted, but special attention is being
paid to determining potential changes in the
heights of storm surges, and catchment
discharge which will all interact to affect coastal
inundation, erosion and local sediment budgets.
These climatically forced changes may be as
important to the coastal zone as mean sea-level
rise.
Possible impact on natural ecosystems
Australia has many native species that are unique
to the continent. This means that any changes in
climate which increase survival pressures on
these native Australian species may result in the
extinction of these organisms.
Australia’s ecosystems are adapted to large
natural year-to-year climate variability, because
Australia experiences one of the most variable
rainfall regimes on earth. As a result, Australian
plants and animals are able to tolerate recurring
drought. This does not mean, however, that
native species may not be sensitive to
anthropogenic climate change.
One sensitivity study examined the response of
42 vertebrate species, many of which are already
considered threatened or endangered in the
State of Victoria, to temperature and
precipitation change. The results showed that
many of these species would be vulnerable to
small changes in temperature. An increase in
temperature of 1°C resulted in a 90–100 per
Australia’s climate change vulnerabilities
2
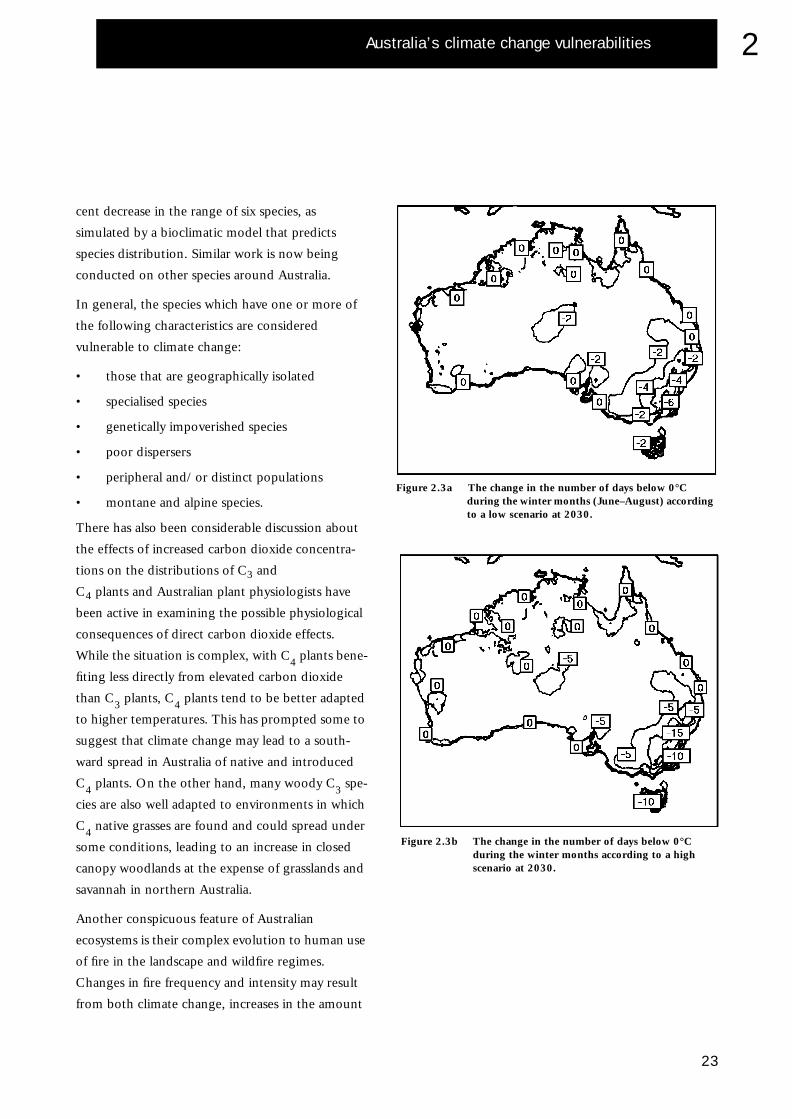
Figure 2.3a The change in the number of days below 0°C during the winter months (June–August) according to a low scenario at 2030.
Figure 2.3b The change in the number of days below 0°C during the winter months according to a high scenario at 2030.
cent decrease in the range of six species, as
simulated by a bioclimatic model that predicts
species distribution. Similar work is now being
conducted on other species around Australia.
In general, the species which have one or more of
the following characteristics are considered
vulnerable to climate change:
• those that are geographically isolated
• specialised species
• genetically impoverished species
• poor dispersers
• peripheral and/or distinct populations
• montane and alpine species.
There has also been considerable discussion about
the effects of increased carbon dioxide concentra-
tions on the distributions of C3 and
C4 plants and Australian plant physiologists have
been active in examining the possible physiological
consequences of direct carbon dioxide effects.
While the situation is complex, with C4 plants bene-
fiting less directly from elevated carbon dioxide
than C3 plants, C4 plants tend to be better adapted
to higher temperatures. This has prompted some to
suggest that climate change may lead to a south-
ward spread in Australia of native and introduced
C4 plants. On the other hand, many woody C3 spe-
cies are also well adapted to environments in which
C4 native grasses are found and could spread under
some conditions, leading to an increase in closed
canopy woodlands at the expense of grasslands and
savannah in northern Australia.
Another conspicuous feature of Australian
ecosystems is their complex evolution to human use
of fire in the landscape and wildfire regimes.
Changes in fire frequency and intensity may result
from both climate change, increases in the amount
23
Australia’s climate change vulnerabilities
of leaf litter due to direct carbon dioxide effects and
its carbon : nitrogen ratios. The research that is
available suggests that fire frequency may increase in
many parts of Australia. Such changes could have
profound effects on Australian ecosystems,
particularly fire-sensitive climax communities.
Possible socio-economic impactsVery few studies in Australia have attempted to
assess both the direct impacts of climate change and
increases of atmospheric carbon dioxide on individ-
ual sectors of society, and how these may interact
with and affect Australian society as a whole.
The direct impacts of climate change on agriculture,
for example, will be potentially compounded by
effects on the agricultural economy arising from
actions to reduce emissions by the transport sector;
by health effects such as heat stress on agricultural
workers; changes to market prices brought about by
changes in global patterns of supply and demand;
through to the impacts of policy-induced changes
introduced to mitigate climate change. Changes in
the agriculture sector may, in turn, influence the
Australian economy, patterns of human settlement
and land use.
There is a well-recognised need for an integrated
approach to assessing the impacts of climate
change, which would involve increased interaction
between experts from a wide variety of scientific and
other fields. An increasing number of cross-
disciplinary projects are being initiated through a
recently established network of interested
specialists.
Agriculture
The potential vulnerability of Australian agriculture
to climate change is a key issue to Australia as one
of the world’s major exporters of agricultural
commodities.
Although there has been some research into the
potential impacts of climate change on Australian
agriculture, it is far too early to be able to
comprehensively assess the potential vulnerability of
Australian agriculture to climate change. Similarly,
possible opportunities for agriculture associated
with climate change cannot yet be assessed in a
comprehensive manner. Nevertheless, the research
that has been conducted has raised several areas in
which Australian agriculture is potentially
vulnerable to climate change:
• increases in extremely hot days, leading to heat stress in cattle and sheep
• a reduction in the number of cool days, leading to a reduction in yield from horticultural crops requiring winter chill for fruit-set
• increases in the occurrence of days where temperatures exceed 35°C, resulting in poorer wheat quality
• higher temperatures between flowering and ripening of wheat crops, leading to a shorter grain-filling season, thus reducing yield
• a South Australian State study into the effect of reduced rainfall on wheat yield indicates a reduction of wheat production by A$105 million per year, or 20 per cent of the tonnage and value of the South Australian wheat crop.
On the other hand, some of these effects may be
offset or outweighed by other factors such as:
• carbon dioxide fertilisation, increasing yield and improving crop water-use efficiency
24
Australia’s climate change vulnerabilities
2
• a wetter climate
• higher winter temperatures, increasing wheat production
• higher winter temperatures, increasing winter pasture production in some regions.
Potential impacts of increases in extreme rainfall on
agriculture have not been assessed. However,
depending on the magnitude of the changes which
are possible, agricultural activities may be
significantly affected. Increases in rainfall extremes
may, for example, lead to increased erosion, to
which much of Australia is already vulnerable. Such
changes also imply that careful examinations of
irrigation systems may need to be undertaken.
Climate change may also influence the incidence
and range of pests and diseases that affect agricul-
ture. Studies of the distribution of native and intro-
duced pests and diseases have indicated that climate
change may offer opportunities for organisms pres-
ently confined to the north of the continent to
spread southwards and increase dramatically as a
result of an increase in temperature.
The spread of pests and disease is often sensitive to
extreme events or the crossing of climatic thresh-
olds which lead to outbreaks in, and colonisation
of, new areas where they become endemic. Exam-
ples of pests considered potentially sensitive to cli-
mate change in Australia include cattle tick and the
Queensland fruit fly, which would affect the beef
and horticultural industries, and a number of fungal
diseases that affect viticulture.
Since global climate change and its effects are
unlikely to be uniform, Australia is also aware that
differences in the regional impacts of climate
change may produce changes in the supply and
demand for agriculture commodities, thus affecting
markets and price structures.
Fisheries
Little research into the potential impact of climate
change on Australian fisheries has been undertaken,
although a national workshop on the subject has
been conducted, and there is an increasing
acknowledgement and understanding of the
importance of national climatic variability on
Australian fish stocks.
Australian fisheries, especially spawning areas, are in
many cases linked to nutrient and freshwater dis-
charge from rivers, to the existence of coastal man-
groves, and to water temperature and estuarine
salinity. Each of these factors may be affected by cli-
mate change, through, for example: changes in the
occurrence and frequency of extreme precipitation
(nutrient and freshwater discharge), sea-level rise
and carbon dioxide fertilisation (mangroves).
Prawn fisheries in the Gulf of Carpentaria are partic-
ularly sensitive to changes in river discharge; and
the life cycle of the western rock lobster is closely
associated with the Leeuwin Current running along
the Western Australian coast and also responds to
signals from the El Niño–Southern Oscillation phe-
nomenon. Fisheries off the Tasmanian coast are also
known to respond to these signals.
At this stage, however, there is no clear indication as
to how Australian fisheries may be affected by
climatic change, especially since the future
behaviour of the ENSO phenomenon remains
unresolved.
Forestry
Much Australian research has examined the
potential influence of direct carbon dioxide effects
on forest productivity. Generic tree growth models,
which have been used in these studies, suggest that
the forest production initially responds strongly to
25
Australia’s climate change vulnerabilities
increased carbon dioxide, but this response
diminishes with time. The rate of nitrogen uptake
decreases in relation to the availability of soil
nutrients and carbon production may then be
limited by the supply of nitrogen in the soil.
Nitrogen cycling has a long response time, so it may
take many years for the forest to reach a new
equilibrium. Some of these studies have assumed
that water availability does not limit growth but
further work is needed in this area.
Coastal zone
Australia’s largest cities are located in the coastal
zone and the most of the population lives along the
coastal margins. Vulnerability assessment studies
have shown that climate change is likely to have sig-
nificant adverse impacts on the economic, cultural
and natural values of the coastal zone through sea-
level rise, changes in storm intensity and frequency,
and salt water intrusion into ground water supplies.
Many areas of Australia are vulnerable to damage by
storms and cyclones. The Insurance Council of
Australia has indicated that since 1967 insurance
payments in relation to tropical cyclones alone have
totalled A$1715 million. Changes in intensity or
frequency of storms is likely to exacerbate these
problems.
Major infrastructure
Increased seasonal rainfall, and especially more
frequent heavy rainfall events, as suggested by the
climate change scenarios, would lead to increased
magnitude and frequency of floods.
Much infrastructure, including drainage systems,
culverts, bridges, levee banks and dams, is designed
to withstand appropriate return period flood events.
In the design of these structures, it is assumed that
the underlying climatic state is stable and the design
flood probability will also remain constant for the
design life of the project under consideration. If
return periods for these events are substantially
reduced, then there is increased risk of system
failure, with associated costs in property loss, lost
operating time, and other damage. Such failures in
the urban environment may extend to a variety of
transport and telecommunications systems.
Since changes in the frequency of extreme rainfall
events have not been quantified, it is not possible to
adequately assess Australia’s vulnerability to such
changes.
Human health
Investigations into the possible implications of
climate change on human health in Australia have
been limited. Reviews that have been conducted
point to the extremely complex nature of the
problem, involving potential changes to
populations of disease vectors, notably mosquitoes,
water-related health effects, as well as the more
obvious climatically sensitive problems such as
changes in heat stress associated with temperature
increases. Older adults are particularly sensitive to
temperature extremes (an important fact given
Australia’s ageing population) as are those
dependent on medication, people living and
working in poor environments, and people with
existing medical conditions.
Current research concerns the identification of
patterns of social vulnerability to climate change,
examining current social trends that may change
that vulnerability and assembling a geographical
view of risk that may assist in understanding the
potential impacts of climate change on human
health.
26
Australia’s climate change vulnerabilities
2
Some work has also been conducted on the poten-
tial for changes to the occurrence of malaria as a
result of climate change. The work conducted to
date suggests that the distribution of malaria in
Australia may be sensitive to climate change, but
that such conclusions are highly dependent on the
scenarios of change used to drive the model used to
predict the distribution of the disease.
Work is also under way on identifying possible
changes to heat stress and associated mortality.
Adaptation measuresMeasures for adapting to climate change are
severely constrained by our present limited ability to
understand the nature of climatic changes to which
Australia will need to adapt. For this reason,
Australian effort in this area has emphasised the
need to produce improved estimates of regional
climate change as a sound basis for planning
adaptation measures. Nevertheless, several potential
strategies for adapting to climate change have been
identified.
Agriculture
Possible adaptation strategies relevant to agriculture
that have been identified include:
• adoption of more climatically robust crop cultivators
• improved management techniques and changes to management practices
• development of new cultivators suited to changed climate, through both traditional selective breeding methods and genetic engineering
• increased emphasis on erosion control techniques to accommodate potential increases in rainfall intensities.
In addition, many of the modern decision support
systems being developed to better manage
Australia’s natural climatic variability may allow
adaptation to changes in seasonal temperatures,
rainfall and soil moisture. They may also provide
insight into how agricultural practices may be
adjusted in response to climate change.
Coastal zone
Australia has played a key role in the international
assessment of coastal impacts and has been a major
contributor of expertise and financial resources to
several IPCC-sponsored coastal impacts workshops
since 1990. Trials of the IPCC common
methodology for vulnerability assessment have been
completed in the Cocos Island Territory,
Geographe Bay (Western Australia) and Kiribati.
During 1993 Australian experts presented a revised
vulnerability assessment methodology to the World
Coast Conference held in the Netherlands. This
methodology was widely received because it
addressed economic, cultural, and environmental
values in addition to the engineering aspects of
coastal management.
The Commonwealth, State and Territory
governments are currently undertaking major trials
of the revised methodology at seven key locations
around the Australian coastline including
Lauderdale (Tasmania), Port of Darwin (Northern
Territory), Spencer Gulf (South Australia),
Metropolitan Perth (Western Australia), Gippsland
27
Australia’s climate change vulnerabilities
2
Lakes and Port Philip Bay (Victoria) and the
Whitsunday Region (Queensland). A national
network of state-of-the-art tide gauges has been
established around Australia to complement an
Australian-sponsored network in the South Pacific.
The Australian Government has recently completed
the most comprehensive review of coastal zone
management and is cooperatively developing a
national approach to coastal zone management with
State, Territory and local governments.
Vulnerability assessment, adaptation, and other
response measures are being integrated into this
policy framework. The objective is to facilitate
planning at local and regional level to address the
potential climate change impacts. It is likely that the
national approach will build on State approaches
such as the South Australian coastal zone policy.
Human health
Despite the lack of reliable information on the
potential effects of climate change on human health
in Australia, there are a number of measures which
would improve the ability of Australia to adapt or
respond to climate-induced changes to human
health. These include:
• the development of systems to monitor climate-related diseases
• incorporation of health impact assessments into greenhouse plans and strategies
• improved national policies and structures for disaster response.
A better understanding of the potential impacts and
responses relating to human health can be
anticipated as additional research in this area is
conducted.
8
Vulnerabilities to climate change response measures
BackgroundAustralia has a large land area with widely dispersed
natural resources, a long navigable coastline, and is
remote from our overseas markets. Australia is also
a transport-intensive country which has to move
large quantities of material and people over long
distances.
Historical and geographic factors have also strongly
influenced the development of agricultural activities
which contribute to greenhouse gas emissions.
Expected strong economic growth and above-
OECD average population growth mean that
Australia’s demand for energy will also continue to
increase strongly in the foreseeable future.
Australia at present has few economically viable
alternatives to fossil fuels as its primary energy
source, with no nuclear energy and limited hydro-
electricity capacity. The cost of reducing Australia’s
reliance on fossil fuels is high in terms of replacing
existing infrastructure and the impact of costs on
the competitiveness of the Australian economy and,
in particular, of export industries.
Australia’s climate change vulnerabilities
2
Vulnerability to climate change response
International and national actions to reduce greenhouse gas emissions could have a major impact on Australia’s economy which is char-acterised by a strong reliance on resource-based industries, with large agricultural and minerals sectors and energy-intensive indus-tries such as steel and aluminium production. Australia’s abundant supply of coal serves as the basis for our energy-intensive industries and has led Australia to become the world’s leading exporter of coal.
These resource-based industries remain important both to Australia’s domestic economy and in generating income from exports, and dependence on them will continue for the foreseeable future, notwithstanding diversification in our industrial and commercial base. Australia’s dependence on coal and other natural resources has an important bearing on the shape and future development of our National Greenhouse Response Strategy.
A case study—Australia's energy sector
Australia’s energy characteristics as part of the economy
Australia’s resource endowment has had a profound
impact on the types of fossil fuels used to produce
energy and the structure of the economy. Australia
is well endowed with certain fossil fuels, particularly
coal, and has used this resource base to develop
export-oriented industries and energy intensive
activities such as aluminium smelting and steel-
making. The shares of black coal and natural gas in
total energy production are much greater than their
shares of domestic energy consumption because of
their importance as export commodities. Australia is
a substantial net energy exporter, with
approximately 62 per cent of total energy
production being exported in 1992–93.
It follows then that one of the primary sources of
anthropogenic carbon dioxide emissions in
Australia is the burning of fossil fuels such as coal,
oil and natural gas. The burning of fossil fuels
accounts for the majority of total Australian energy
consumption. Hence, any strategy to reduce
Australian greenhouse gas emissions will more than
likely impose constraints on the use of fossil fuel
sources of energy.
29
Australia’s climate change vulnerabilities
Fossil fuel exports
Apart from being a major energy source for
domestic electricity generation, significant
quantities of black coal are exported from Australia.
Australia is the world’s largest coal exporter, with
over 30 per cent of total world coal exports
emanating from Australia in 1992–93. Coal exports
also accounted for almost 12 per cent of total
Australian merchandise exports in 1992–93, with
72 per cent (128 million tonnes) of Australian black
coal production being exported in that year. Over
50 per cent of these exports went to Japan, with
other major markets including the European
Union, South Korea, Taiwan and the Association of
South-East Asian Nations. Australia is also a
substantial net exporter of other energy products
such as natural gas and uranium.
Given the economic significance of energy exports
for Australia, any international greenhouse gas
abatement strategy that changes global energy use is
likely to have significant implications for the
Australian economy. In particular, policies aimed at
reducing global emissions of greenhouse gases from
fossil fuels will have an impact on the Australian
coal industry through their effect on world energy
markets.
30
3
Chapter Three
Australia’s National GreenhouseGas Inventory
Inventories of anthropogenic greenhouse gas
emissions and sinks for Australia have been
compiled for the years 1990 and 1988. The
background to the methodology used in the
compilation of the inventories is presented
together with a brief outline of the
compilation including extracts from the
1990 inventory.
A national greenhouse gas inventory
provides the basis for a number of
greenhouse strategic objectives, the chief of
which is to provide direction for the
development of policies to mitigate the
threat of global warming. Other reasons
underscoring this objective include:
• the provision of a comprehensive database to be used in designing response measures
• monitoring emissions of greenhouse gases from sources and removals by sinks associated with all relevant sectors of activity
• evaluating the efficacy of abatement policies
• developing emission projection scenarios
• providing a major component of reports on Australia’s greenhouse response in accordance with national and international commitments
• contributing to scientific studies on the climate system.
Inventory methodology
Methodology development
A prerequisite for the compilation of internationally comparable national greenhouse gas inventories is the development of transparent and internationally compatible and comparable methodologies. In Australia, a methodology based on the Intergovernmental Panel on Climate Change default methodology has been developed and used in the compilation of the Australian National Greenhouse Gas Inventory. It is more sophisticated than the IPCC default methodology and takes into account conditions specific to Australia. It is, however, consistent with international requirements regarding transparency, consistency, compatibility and comparability.
While the Federal Government has formal responsibility for the establishment of the national inventory, its development and management is overseen jointly by representatives of the Federal Government, and the States and Territories governments constituting the National Greenhouse Gas Inventory Committee.
In developing a methodology, the approach adopted was to categorise Australian economic activity on a sectoral basis following the IPCC model. Sectors were broken down into sub-sectors as presented in Table 3.5. Appropriate methods were then developed to estimate greenhouse gas emissions in each of the five main sectors, that is, energy, agriculture, land use change and forestry, industrial processes and solvents, and waste.
In developing the Australian methodology, expert consultants were engaged to form and manage working groups. These groups, comprising members from research organisations, academia, peak national and other interest organisations, were established under the chair of a recognised authority in the field. Five working groups were formed: a single working group for both fuel combustion activities and fugitive fuel emissions, one for each of transport and land use change and forestry (carbon dioxide from the biosphere), and two for agriculture (non-carbon dioxide gases from
31
Australia’s national greenhouse gas inventory
the biosphere and livestock). The primary task of the working groups was to develop and document, in the form of a methodology workbook, an Australian methodology to estimate greenhouse gas emissions and sinks in each sector.
Working group members discussed and sought opinions and information from their respective constituent organisations to gain as wide a spectrum of views as possible contributing to an eventual consensus on the method developed. A significant aspect of the consultation process was a public review phase undertaken to achieve wide community participation and information dissemination.
To date, six methodology workbooks covering the major sectors have been completed.
Energy
1.Workbook for Fuel Combustion Activities (Stationary Sources)
2.Workbook for Fugitive Fuel Emissions (Fuel Production, Transmission, Storage and Distribution)
3.Workbook for Transport (Mobile Sources)
Land use change
4.Workbook for Carbon Dioxide from the Biosphere & Forestry
Agriculture
5.Workbook for Non-Carbon Dioxide Gases from the Biosphere
6.Workbook for Livestock
The development of an Australian specific methodology in the remaining two sectors, industrial processes and solvents, and waste will be undertaken later in 1994. For current reporting completeness, however, inventory data have been compiled for these sectors (except for solvents) using the IPCC default methodology and Australian statistics, and incorporated in the 1990 inventory for Australia. This information should be regarded as preliminary.
32
The inventory methodology workbooks developed for each sector contain the Australian methodology for the compilation of a national greenhouse gas inventory in that sector. Each workbook consists of a series of algorithms with worked examples illustrating the method used to estimate emissions for one or more greenhouse gases in each specific area. In accordance with the IPCC guidelines, the focus has been on carbon dioxide, methane and nitrous oxide with information also provided on oxides of nitrogen, carbon monoxide, non-methane volatile organic compounds (NMVOCs) and perfluorocarbons (PFCs). Although they are greenhouse gases, chlorofluorocarbons or CFCs are excluded from this inventory for the same reason that they are excluded from the Climate Change Convention; that is, they are already covered under the Montreal Protocol on Stratospheric Ozone-Depleting Substances.
Methodology issues
Australia’s inventory for 1990 and 1988 is a first attempt to compile a comprehensive inventory of greenhouse gas emissions on a national basis and, as such, current inventory data will be subject to revision in the light of new information and improved methods.
The working groups have identified a number of issues that need to be addressed, two of which are biomass burning and uncertainty in inventory data.
Biomass burning
This is a significant issue for Australia because of the widespread use of fire as a land management tool. Anthropogenic burning of biomass in Australia on a large scale and for non-energy purposes is a very old activity carried out for at least the last 40 000 or so years.
Currently deliberate regular burning of biomass is undertaken to reduce catastrophic bush/forest fire impacts on larger vegetation, wildlife, human facilities and welfare. Deliberate burning is also used to promote pasture growth for grazing animals.
Australia’s national greenhouse gas inventory
3
Greenhouse gas emissions produced by deliberate burning are similar to those from wildfires and litter decay. As emissions from deliberate burning do not effectively change the natural carbon cycle, the issue of whether such emissions should be counted as anthropogenic or not needs to be addressed. The present IPCC guidelines somewhat inconsistently treat carbon dioxide emissions as non-anthropogenic but non-carbon dioxide emissions as anthropogenic. Pending the resolution of these issues, emissions from biomass burning are included in the Australian national inventory in accordance with the IPCC guidelines.
Uncertainty
There are various levels of uncertainty associated with different sections of the inventory. In Australia, for some sub-sectors, such as transport, the level of uncertainty is relatively low (less than plus or minus 10 per cent) while for others, such as land use change and forestry, and agriculture, the level of uncertainty is much higher (typically a factor of two). This is due to the difficulty in obtaining accurate statistics and relevant data. In the Australian inventory for 1990 and 1988, estimates of uncertainty are specified for all the sub-sectors.
Research is currently being undertaken in a number of areas where large uncertainties exist, with the aim of providing more accurate statistics and improving inventory data.
Greenhouse gas emissions and sinks
Greenhouse gas emissions in Australia in 1990 totalled 572 million tonnes carbon dioxide equivalent.
Inventory compilationThe compilation of the national inventory involved the application of Australian statistics pertaining to a particular year to the methodology developed for each sector or sub-sector. The various sectoral inventories were subsequently collated into one comprehensive national inventory for the specified year, in this instance 1990, the Convention base year for inventories. The year 1990 refers to the Australian fiscal year, 1 July 1989 to 30 June 1990.
Australia’s inventory follows the Framework Convention on Climate Change requirement that each Party to the Convention compiles a national inventory of anthropogenic sources and sinks of greenhouse gases. Consistent with the default methodology of the IPCC, the potential associated with the sink capacity of Australia’s natural vegetation is not included in the inventory estimates. Similarly, the carbon dioxide fertilisation effect which could enhance Australia’s sink capacity in the order of 340 million tonnes is also not included in the data presented below.
The following inventory presentation generally adopts the IPCC recommended reporting layout. Table 3.1 provides an overview of Australian emissions of the main greenhouse gases in 1990 reported as carbon dioxide equivalent. Global warming potentials (GWPs) are conversion factors used to express the relative warming effects of the various greenhouse gases in terms of their carbon dioxide equivalent. Table 3.2 presents greenhouse gas emissions in the same year but using 1992 GWPs and can be compared with Table 3.1 using 1990 GWPs. Table 3.3 provides a picture of the relative contributions of greenhouse gas emissions from each of the five sectors to total emissions in 1990 in percentage terms.
Tables 3.4 and 3.5 provide a more detailed breakdown on emissions in 1990 as presented in Table 3.1. Of these two tables, Table 3.4 provides a summary of Australia’s emissions of the three main greenhouse gases and perfluorocarbons on a sectoral basis for 1990. Table 3.5 (Part 1 and Part 2) is essentially an elaboration of Table 3.4 and covers the major greenhouse gases, other
33
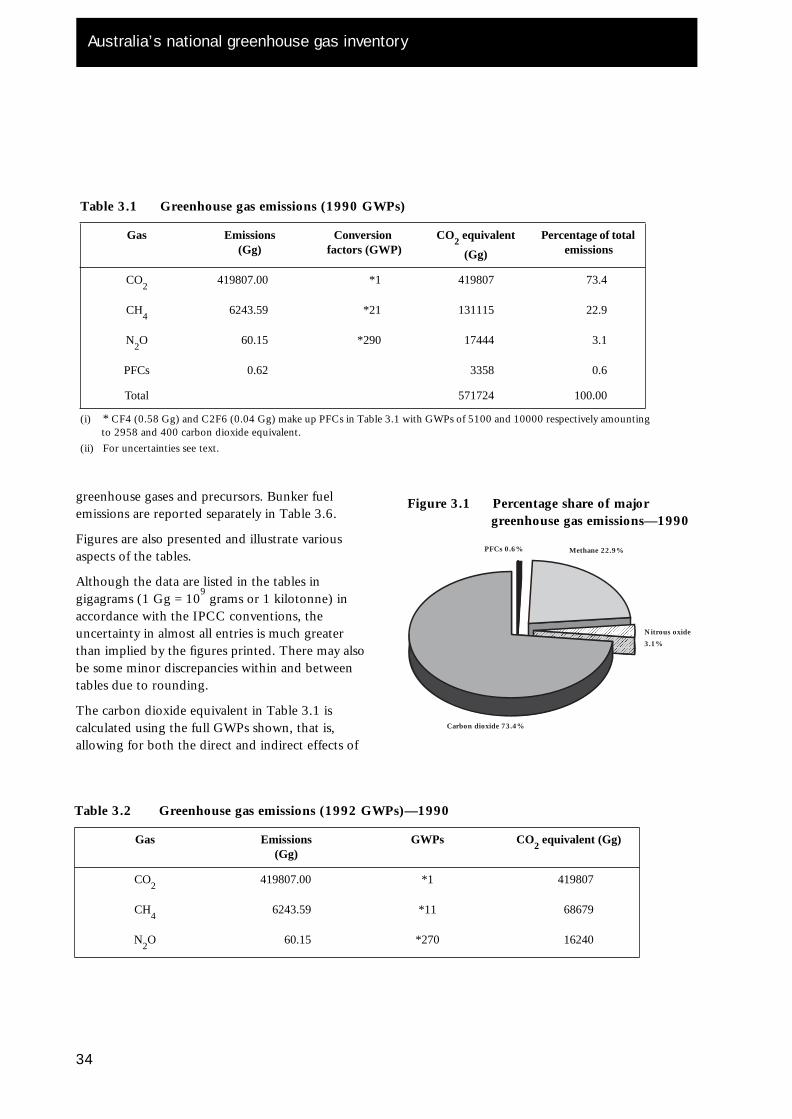
Australia’s national greenhouse gas inventory
Table 3.1 Greenhouse gas emissions (1990 GWPs)
(i)
*
CF4 (0.58 Gg) and C2F6 (0.04 Gg) make up PFCs in Table 3.1 with GWPs of 5100 and 10000 respectively amounting to 2958 and 400 carbon dioxide equivalent.
(ii) For uncertainties see text.
Gas Emissions(Gg)
Conversion factors (GWP)
CO
2
equivalent
(Gg)
Percentage of total emissions
CO
2
419807.00 *1 419807 73.4
CH
4
6243.59 *21 131115 22.9
N
2
O 60.15 *290 17444 3.1
PFCs 0.62 3358 0.6
Total 571724 100.00
Figure 3.1 Percentage share of major greenhouse gas emissions—1990
Methane 22.9%
Nitrous oxide
3.1%
Carbon dioxide 73.4%
PFCs 0.6%
greenhouse gases and precursors. Bunker fuel emissions are reported separately in Table 3.6.
Figures are also presented and illustrate various aspects of the tables.
Although the data are listed in the tables in gigagrams (1 Gg = 10
9 grams or 1 kilotonne) in
accordance with the IPCC conventions, the uncertainty in almost all entries is much greater than implied by the figures printed. There may also be some minor discrepancies within and between tables due to rounding.
The carbon dioxide equivalent in Table 3.1 is calculated using the full GWPs shown, that is, allowing for both the direct and indirect effects of
34
Table 3.2 Greenhouse gas emissions (1992 GWPs)—1990
Gas Emissions(Gg)
GWPs CO2 equivalent (Gg)
CO2
419807.00 *1 419807
CH4
6243.59 *11 68679
N2O 60.15 *270 16240
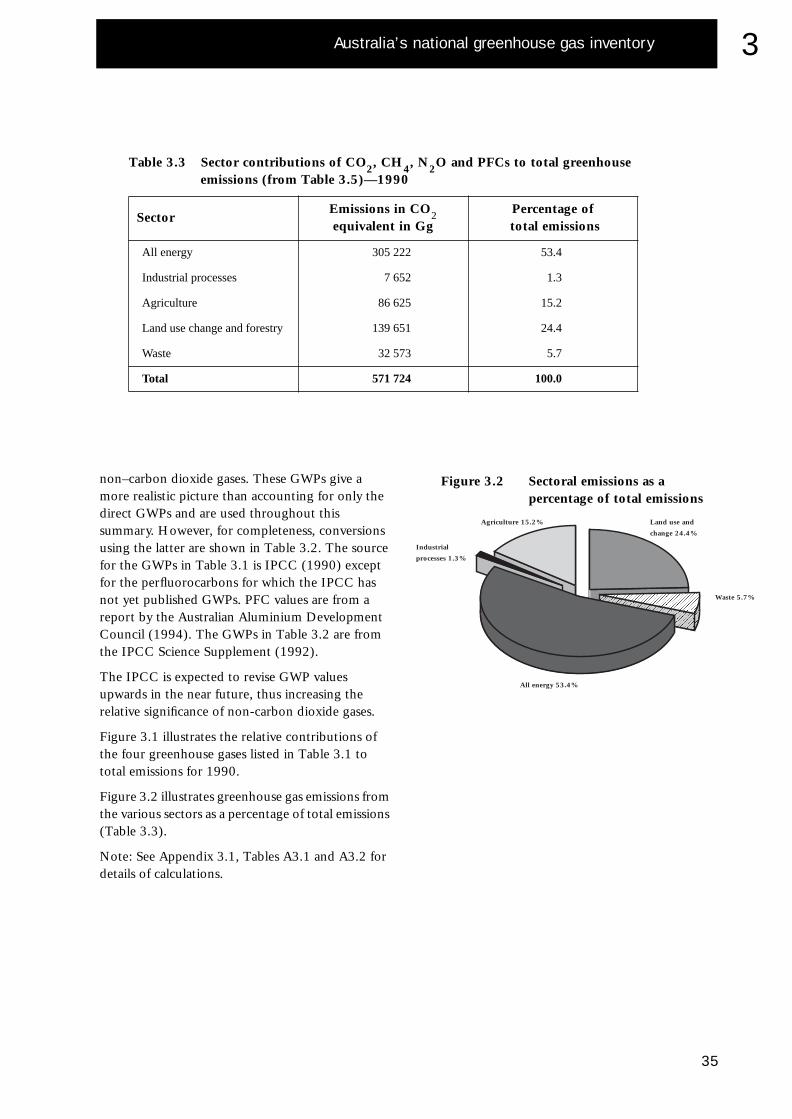
Australia’s national greenhouse gas inventory
3
Table 3.3 Sector contributions of CO
2
, CH
4
, N
2
O and PFCs to total greenhouse emissions (from Table 3.5)—1990
SectorEmissions in CO
2
equivalent in Gg Percentage of
total emissions
All energy 305 222 53.4
Industrial processes 7 652 1.3
Agriculture 86 625 15.2
Land use change and forestry 139 651 24.4
Waste 32 573 5.7
Total 571 724 100.0
Figure 3.2 Sectoral emissions as a percentage of total emissions
Land use and
change 24.4%
Waste 5.7%
All energy 53.4%
Agriculture 15.2%
Industrial
processes 1.3%
non–carbon dioxide gases. These GWPs give a more realistic picture than accounting for only the direct GWPs and are used throughout this summary. However, for completeness, conversions using the latter are shown in Table 3.2. The source for the GWPs in Table 3.1 is IPCC (1990) except for the perfluorocarbons for which the IPCC has not yet published GWPs. PFC values are from a report by the Australian Aluminium Development Council (1994). The GWPs in Table 3.2 are from the IPCC Science Supplement (1992).
The IPCC is expected to revise GWP values upwards in the near future, thus increasing the relative significance of non-carbon dioxide gases.
Figure 3.1 illustrates the relative contributions of the four greenhouse gases listed in Table 3.1 to total emissions for 1990.
Figure 3.2 illustrates greenhouse gas emissions from the various sectors as a percentage of total emissions (Table 3.3).
Note: See Appendix 3.1, Tables A3.1 and A3.2 for details of calculations.
35
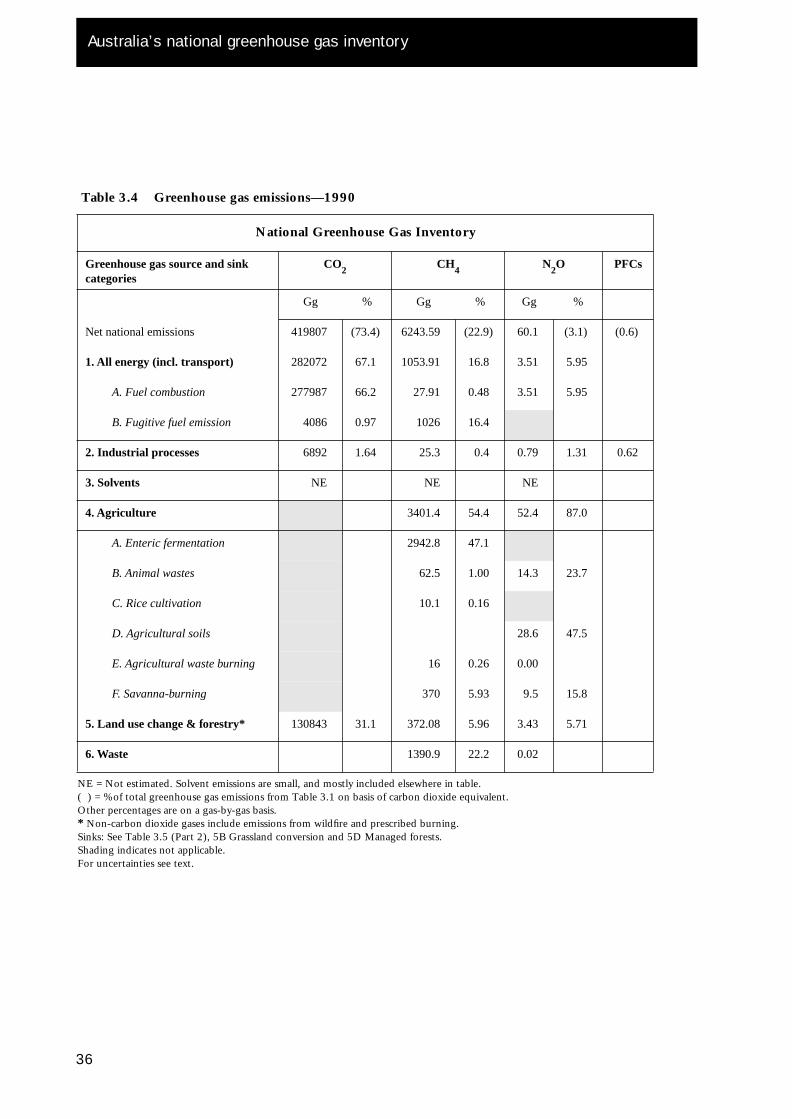
Australia’s national greenhouse gas inventory
36
Table 3.4 Greenhouse gas emissions—1990
National Greenhouse Gas Inventory
Greenhouse gas source and sinkcategories
CO
2
CH
4
N
2
O PFCs
Gg % Gg % Gg %
Net national emissions 419807 (73.4) 6243.59 (22.9) 60.1 (3.1) (0.6)
1. All energy (incl. transport)
282072 67.1 1053.91 16.8 3.51 5.95
A. Fuel combustion
277987 66.2 27.91 0.48 3.51 5.95
B. Fugitive fuel emission
4086 0.97 1026 16.4
2. Industrial processes
6892 1.64 25.3 0.4 0.79 1.31 0.62
3. Solvents
NE NE NE
4. Agriculture
3401.4 54.4 52.4 87.0
A. Enteric fermentation
2942.8 47.1
B. Animal wastes
62.5 1.00 14.3 23.7
C. Rice cultivation
10.1 0.16
D. Agricultural soils
28.6 47.5
E. Agricultural waste burning
16 0.26 0.00
F. Savanna-burning
370 5.93 9.5 15.8
5. Land use change & forestry*
130843 31.1 372.08 5.96 3.43 5.71
6. Waste
1390.9 22.2 0.02
NE = Not estimated. Solvent emissions are small, and mostly included elsewhere in table.( ) = % of total greenhouse gas emissions from Table 3.1 on basis of carbon dioxide equivalent.Other percentages are on a gas-by-gas basis.
*
Non-carbon dioxide gases include emissions from wildfire and prescribed burning.Sinks: See Table 3.5 (Part 2), 5B Grassland conversion and 5D Managed forests.Shading indicates not applicable.For uncertainties see text.
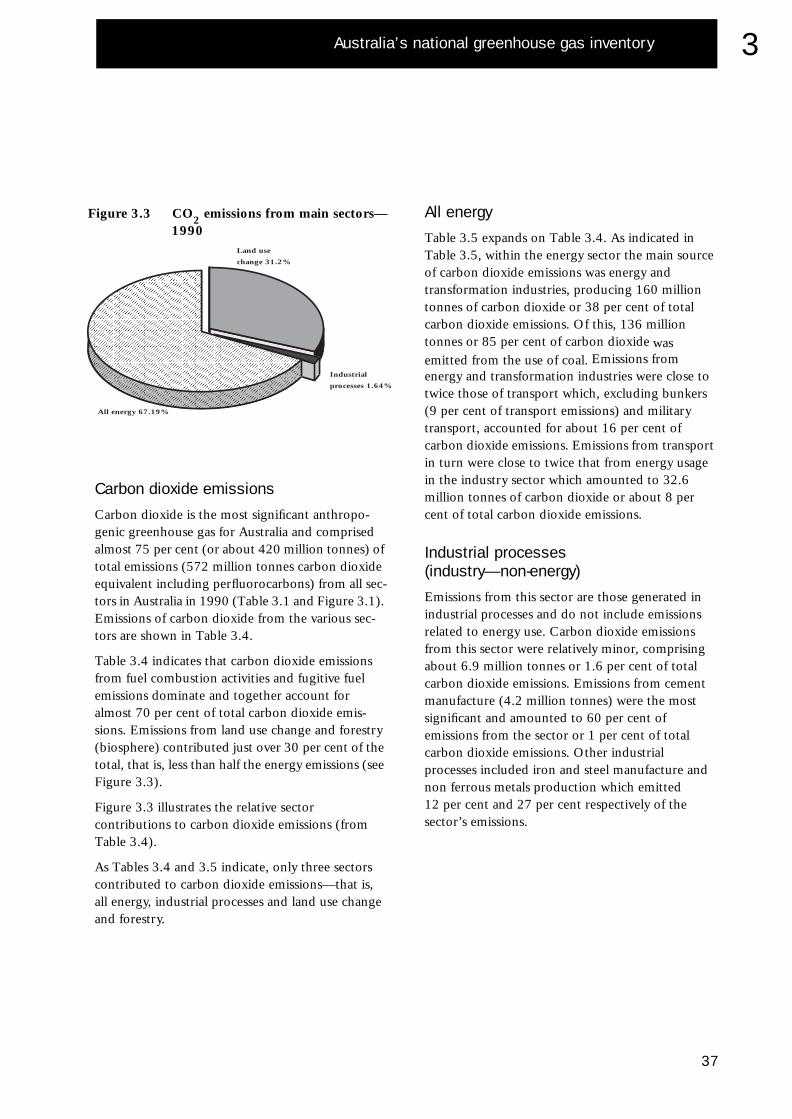
Australia’s national greenhouse gas inventory
3
Figure 3.3 CO
2
emissions from main sectors—1990
Land use
change 31.2%
Industrial
processes 1.64%
All energy 67.19%
Carbon dioxide emissions
Carbon dioxide is the most significant anthropo-genic greenhouse gas for Australia and comprised almost 75 per cent (or about 420 million tonnes) of total emissions (572 million tonnes carbon dioxide equivalent including perfluorocarbons) from all sec-tors in Australia in 1990 (Table 3.1 and Figure 3.1). Emissions of carbon dioxide from the various sec-tors are shown in Table 3.4.
Table 3.4 indicates that carbon dioxide emissions from fuel combustion activities and fugitive fuel emissions dominate and together account for almost 70 per cent of total carbon dioxide emis-sions. Emissions from land use change and forestry (biosphere) contributed just over 30 per cent of the total, that is, less than half the energy emissions (see Figure 3.3).
Figure 3.3 illustrates the relative sector contributions to carbon dioxide emissions (from Table 3.4).
As Tables 3.4 and 3.5 indicate, only three sectors contributed to carbon dioxide emissions—that is, all energy, industrial processes and land use change and forestry.
All energy
Table 3.5 expands on Table 3.4. As indicated in Table 3.5, within the energy sector the main source of carbon dioxide emissions was energy and transformation industries, producing 160 million tonnes of carbon dioxide or 38 per cent of total carbon dioxide emissions. Of this, 136 million tonnes or 85 per cent of carbon dioxide was emitted from the use of coal. Emissions from energy and transformation industries were close to twice those of transport which, excluding bunkers (9 per cent of transport emissions) and military transport, accounted for about 16 per cent of carbon dioxide emissions. Emissions from transport in turn were close to twice that from energy usage in the industry sector which amounted to 32.6 million tonnes of carbon dioxide or about 8 per cent of total carbon dioxide emissions.
Industrial processes(industry—non-energy)
Emissions from this sector are those generated in industrial processes and do not include emissions related to energy use. Carbon dioxide emissions from this sector were relatively minor, comprising about 6.9 million tonnes or 1.6 per cent of total carbon dioxide emissions. Emissions from cement manufacture (4.2 million tonnes) were the most significant and amounted to 60 per cent of emissions from the sector or 1 per cent of total carbon dioxide emissions. Other industrial processes included iron and steel manufacture and non ferrous metals production which emitted 12 per cent and 27 per cent respectively of the sector’s emissions.
37
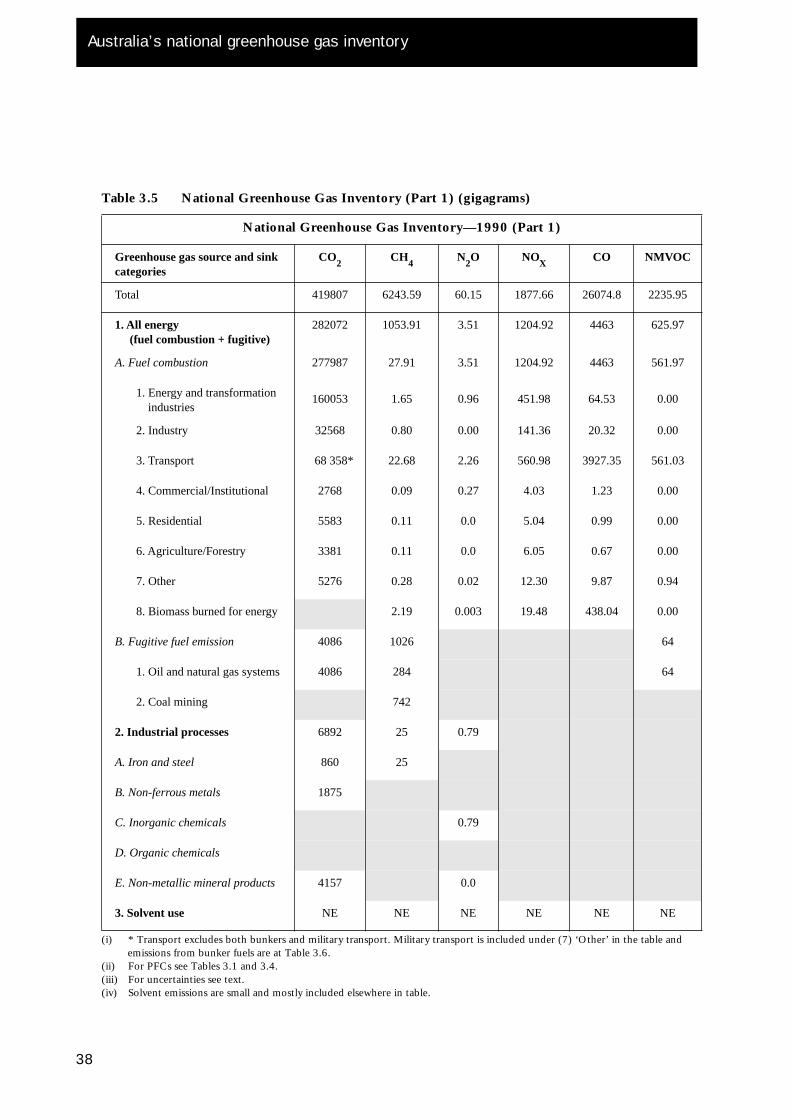
Australia’s national greenhouse gas inventory
38
Table 3.5 National Greenhouse Gas Inventory (Part 1) (gigagrams)
National Greenhouse Gas Inventory—1990 (Part 1)
Greenhouse gas source and sink categories
CO
2
CH
4
N
2
O NO
X
CO NMVOC
Total 419807 6243.59 60.15 1877.66 26074.8 2235.95
1. All energy(fuel combustion + fugitive)
282072 1053.91 3.51 1204.92 4463 625.97
A. Fuel combustion
277987 27.91 3.51 1204.92 4463 561.97
1. Energy and transformation industries
160053 1.65 0.96 451.98 64.53 0.00
2. Industry 32568 0.80 0.00 141.36 20.32 0.00
3. Transport 68 358* 22.68 2.26 560.98 3927.35 561.03
4. Commercial/Institutional 2768 0.09 0.27 4.03 1.23 0.00
5. Residential 5583 0.11 0.0 5.04 0.99 0.00
6. Agriculture/Forestry 3381 0.11 0.0 6.05 0.67 0.00
7. Other 5276 0.28 0.02 12.30 9.87 0.94
8. Biomass burned for energy 2.19 0.003 19.48 438.04 0.00
B. Fugitive fuel emission
4086 1026 64
1. Oil and natural gas systems 4086 284 64
2. Coal mining 742
2. Industrial processes
6892 25 0.79
A. Iron and steel
860 25
B. Non-ferrous metals
1875
C. Inorganic chemicals
0.79
D. Organic chemicals
E. Non-metallic mineral products
4157 0.0
3. Solvent use
NE NE NE NE NE NE
(i) * Transport excludes both bunkers and military transport. Military transport is included under (7) ‘Other’ in the table and emissions from bunker fuels are at Table 3.6.
(ii) For PFCs see Tables 3.1 and 3.4.(iii) For uncertainties see text.(iv) Solvent emissions are small and mostly included elsewhere in table.
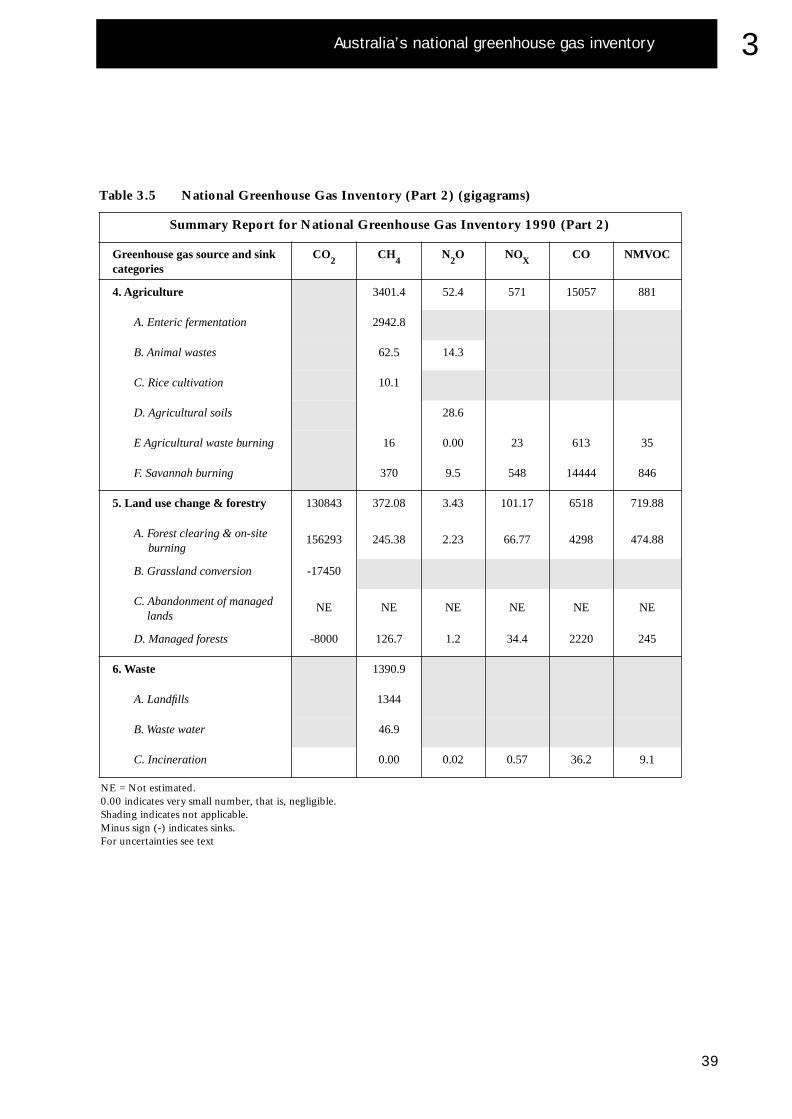
Australia’s national greenhouse gas inventory
39
3
Table 3.5 National Greenhouse Gas Inventory (Part 2) (gigagrams)
Summary Report for National Greenhouse Gas Inventory 1990 (Part 2)
Greenhouse gas source and sink categories
CO
2
CH
4
N
2
O NO
X
CO NMVOC
4. Agriculture
3401.4 52.4 571 15057 881
A. Enteric fermentation
2942.8
B. Animal wastes
62.5 14.3
C. Rice cultivation
10.1
D. Agricultural soils
28.6
E Agricultural waste burning
16 0.00 23 613 35
F. Savannah burning
370 9.5 548 14444 846
5. Land use change & forestry
130843 372.08 3.43 101.17 6518 719.88
A. Forest clearing & on-site burning
156293 245.38 2.23 66.77 4298 474.88
B. Grassland conversion
-17450
C. Abandonment of managed lands
NE NE NE NE NE NE
D. Managed forests
-8000 126.7 1.2 34.4 2220 245
6. Waste
1390.9
A. Landfills
1344
B. Waste water
46.9
C. Incineration
0.00 0.02 0.57 36.2 9.1
NE = Not estimated.0.00 indicates very small number, that is, negligible.Shading indicates not applicable.Minus sign (-) indicates sinks.For uncertainties see text
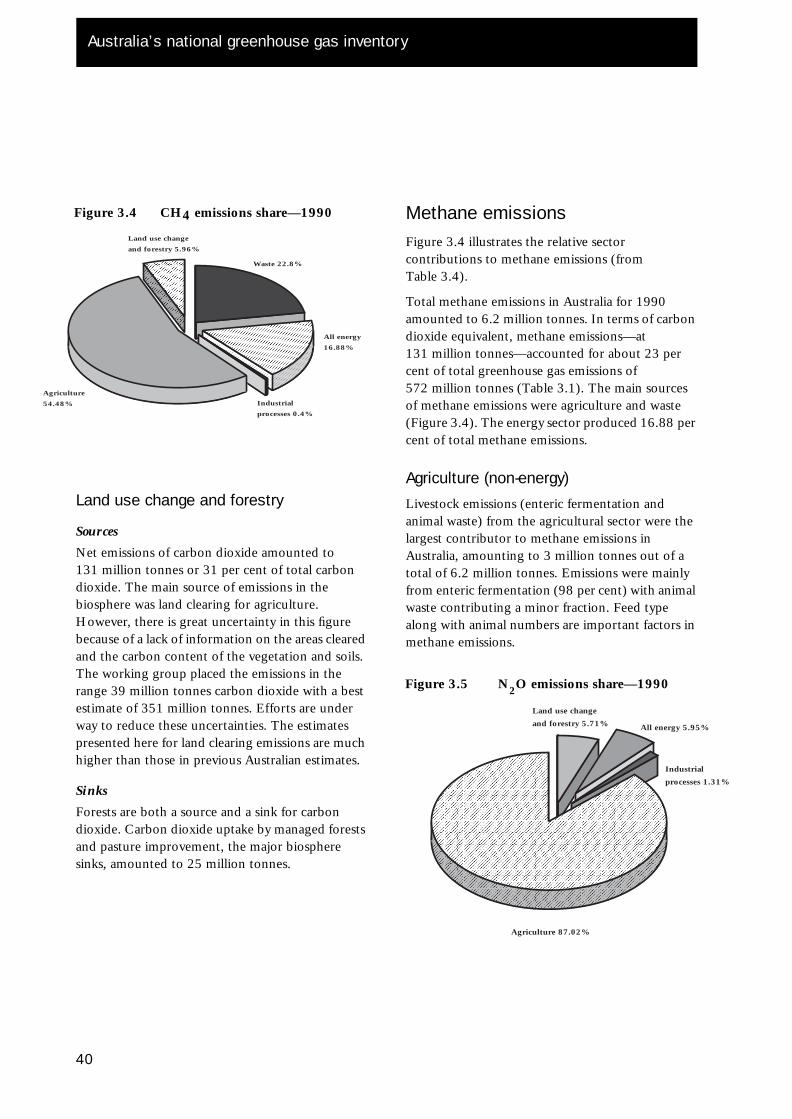
Australia’s national greenhouse gas inventory
Land use change
and forestry 5.96%
Waste 22.8%
All energy
16.88%
Industrial
processes 0.4%
Agriculture
54.48%
Figure 3.4 CH4 emissions share—1990
Figure 3.5 N
2
O emissions share—1990
Industrial
processes 1.31%
All energy 5.95%
Land use change
and forestry 5.71%
Land use change and forestry
Sources
Net emissions of carbon dioxide amounted to 131 million tonnes or 31 per cent of total carbon dioxide. The main source of emissions in the biosphere was land clearing for agriculture. However, there is great uncertainty in this figure because of a lack of information on the areas cleared and the carbon content of the vegetation and soils. The working group placed the emissions in the range 39 million tonnes carbon dioxide with a best estimate of 351 million tonnes. Efforts are under way to reduce these uncertainties. The estimates presented here for land clearing emissions are much higher than those in previous Australian estimates.
Sinks
Forests are both a source and a sink for carbon dioxide. Carbon dioxide uptake by managed forests and pasture improvement, the major biosphere sinks, amounted to 25 million tonnes.
40
Methane emissionsFigure 3.4 illustrates the relative sector contributions to methane emissions (from Table 3.4).
Total methane emissions in Australia for 1990 amounted to 6.2 million tonnes. In terms of carbon dioxide equivalent, methane emissions—at 131 million tonnes—accounted for about 23 per cent of total greenhouse gas emissions of 572 million tonnes (Table 3.1). The main sources of methane emissions were agriculture and waste (Figure 3.4). The energy sector produced 16.88 per cent of total methane emissions.
Agriculture (non-energy)
Livestock emissions (enteric fermentation and animal waste) from the agricultural sector were the largest contributor to methane emissions in Australia, amounting to 3 million tonnes out of a total of 6.2 million tonnes. Emissions were mainly from enteric fermentation (98 per cent) with animal waste contributing a minor fraction. Feed type along with animal numbers are important factors in methane emissions.
Agriculture 87.02%
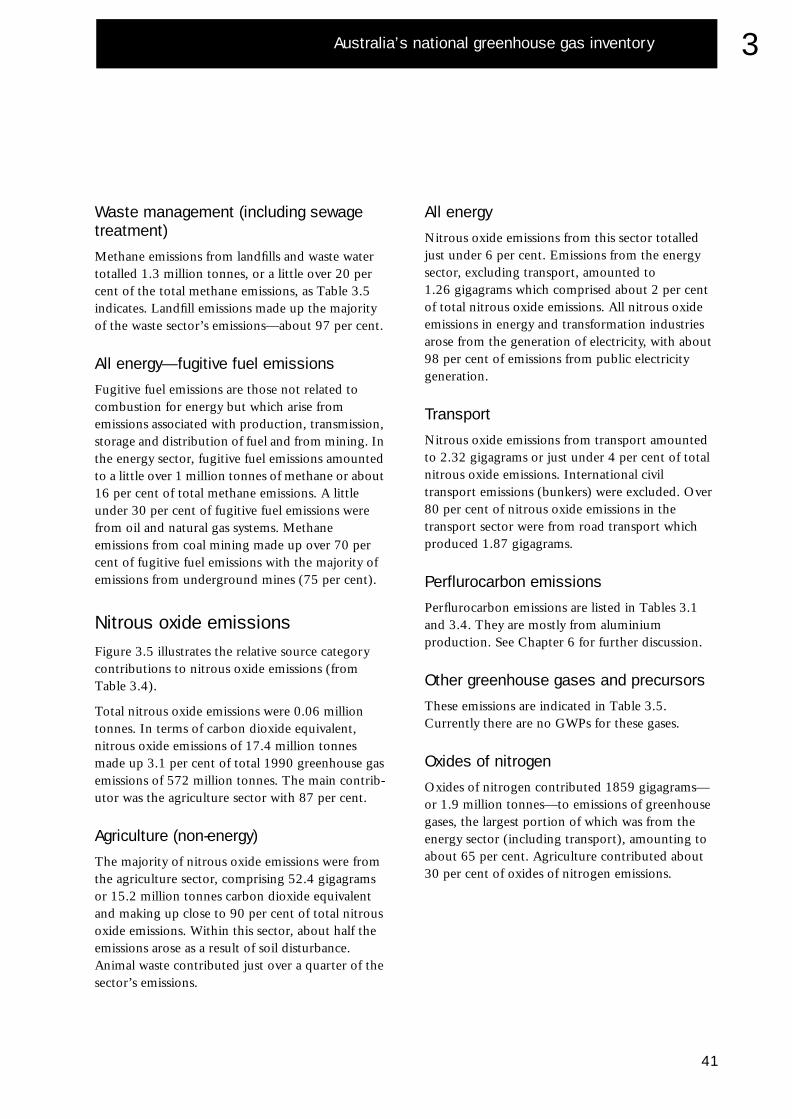
Australia’s national greenhouse gas inventory
3
Waste management (including sewage treatment)
Methane emissions from landfills and waste water totalled 1.3 million tonnes, or a little over 20 per cent of the total methane emissions, as Table 3.5 indicates. Landfill emissions made up the majority of the waste sector’s emissions—about 97 per cent.
All energy—fugitive fuel emissions
Fugitive fuel emissions are those not related to combustion for energy but which arise from emissions associated with production, transmission, storage and distribution of fuel and from mining. In the energy sector, fugitive fuel emissions amounted to a little over 1 million tonnes of methane or about 16 per cent of total methane emissions. A little under 30 per cent of fugitive fuel emissions were from oil and natural gas systems. Methane emissions from coal mining made up over 70 per cent of fugitive fuel emissions with the majority of emissions from underground mines (75 per cent).
Nitrous oxide emissionsFigure 3.5 illustrates the relative source category contributions to nitrous oxide emissions (from Table 3.4).
Total nitrous oxide emissions were 0.06 million tonnes. In terms of carbon dioxide equivalent, nitrous oxide emissions of 17.4 million tonnes made up 3.1 per cent of total 1990 greenhouse gas emissions of 572 million tonnes. The main contrib-utor was the agriculture sector with 87 per cent.
Agriculture (non-energy)
The majority of nitrous oxide emissions were from the agriculture sector, comprising 52.4 gigagrams or 15.2 million tonnes carbon dioxide equivalent and making up close to 90 per cent of total nitrous oxide emissions. Within this sector, about half the emissions arose as a result of soil disturbance. Animal waste contributed just over a quarter of the sector’s emissions.
All energy
Nitrous oxide emissions from this sector totalled just under 6 per cent. Emissions from the energy sector, excluding transport, amounted to 1.26 gigagrams which comprised about 2 per cent of total nitrous oxide emissions. All nitrous oxide emissions in energy and transformation industries arose from the generation of electricity, with about 98 per cent of emissions from public electricity generation.
Transport
Nitrous oxide emissions from transport amounted to 2.32 gigagrams or just under 4 per cent of total nitrous oxide emissions. International civil transport emissions (bunkers) were excluded. Over 80 per cent of nitrous oxide emissions in the transport sector were from road transport which produced 1.87 gigagrams.
Perflurocarbon emissions
Perflurocarbon emissions are listed in Tables 3.1 and 3.4. They are mostly from aluminium production. See Chapter 6 for further discussion.
Other greenhouse gases and precursors
These emissions are indicated in Table 3.5. Currently there are no GWPs for these gases.
Oxides of nitrogen
Oxides of nitrogen contributed 1859 gigagrams—or 1.9 million tonnes—to emissions of greenhouse gases, the largest portion of which was from the energy sector (including transport), amounting to about 65 per cent. Agriculture contributed about 30 per cent of oxides of nitrogen emissions.
41
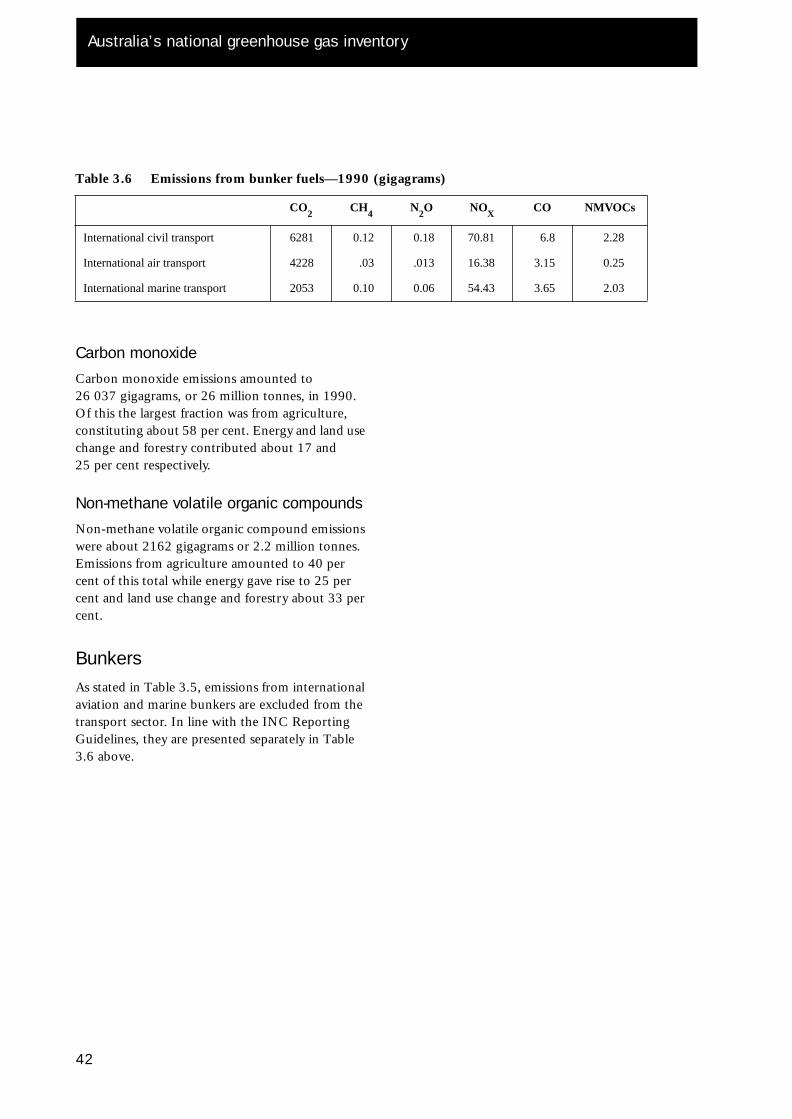
Australia’s national greenhouse gas inventory
Table 3.6 Emissions from bunker fuels—1990 (gigagrams)
CO
2
CH
4
N
2
O NO
X
CO NMVOCs
International civil transport 6281 0.12 0.18 70.81 6.8 2.28
International air transport 4228 .03 .013 16.38 3.15 0.25
International marine transport 2053 0.10 0.06 54.43 3.65 2.03
Carbon monoxide
Carbon monoxide emissions amounted to 26 037 gigagrams, or 26 million tonnes, in 1990. Of this the largest fraction was from agriculture, constituting about 58 per cent. Energy and land use change and forestry contributed about 17 and 25 per cent respectively.
Non-methane volatile organic compounds
Non-methane volatile organic compound emissions were about 2162 gigagrams or 2.2 million tonnes. Emissions from agriculture amounted to 40 per cent of this total while energy gave rise to 25 per cent and land use change and forestry about 33 per cent.
BunkersAs stated in Table 3.5, emissions from international aviation and marine bunkers are excluded from the transport sector. In line with the INC Reporting Guidelines, they are presented separately in Table 3.6 above.
42
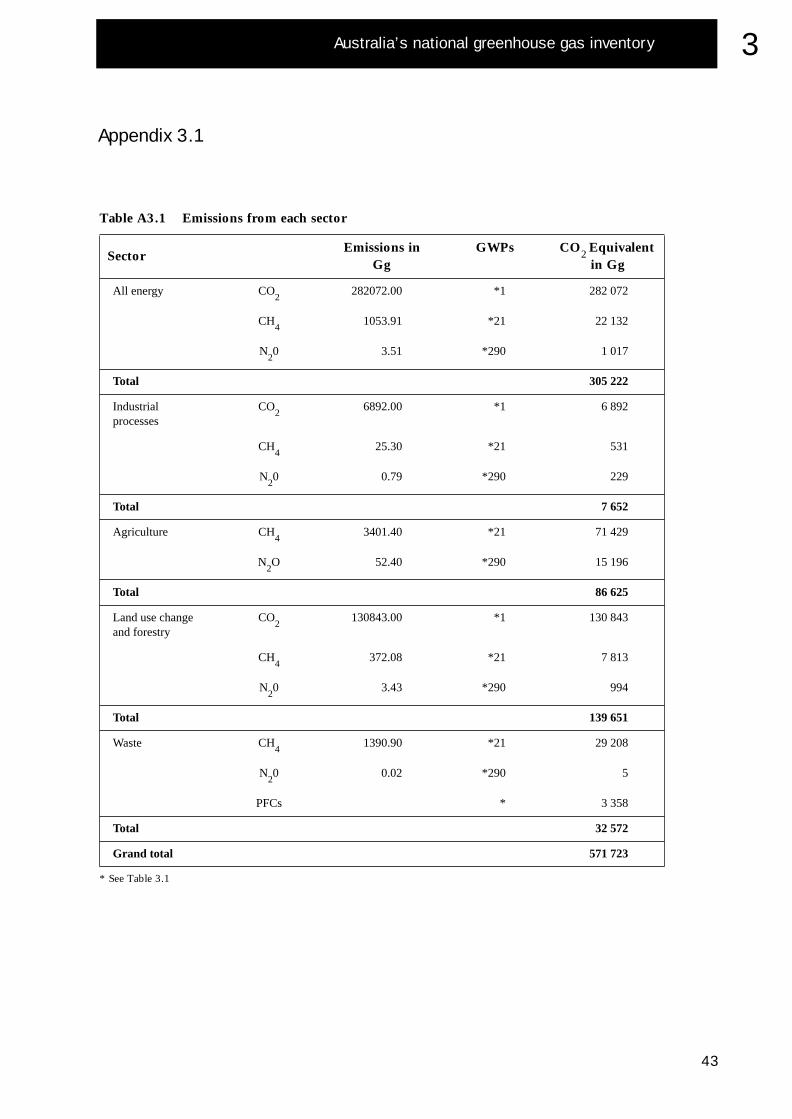
Australia’s national greenhouse gas inventory
43
3
Appendix 3.1
Table A3.1 Emissions from each sector
SectorEmissions in
Gg GWPs CO
2
Equivalent in Gg
All energy CO
2
282072.00 *1 282 072
CH
4
1053.91 *21 22 132
N
2
0 3.51 *290 1 017
Total 305 222
Industrial processes
CO
2
6892.00 *1 6 892
CH
4
25.30 *21 531
N
2
0 0.79 *290 229
Total 7 652
Agriculture CH4
3401.40 *21 71 429
N2O 52.40 *290 15 196
Total 86 625
Land use change and forestry
CO2
130843.00 *1 130 843
CH4
372.08 *21 7 813
N20 3.43 *290 994
Total 139 651
Waste CH4
1390.90 *21 29 208
N20 0.02 *290 5
PFCs * 3 358
Total 32 572
Grand total 571 723
* See Table 3.1
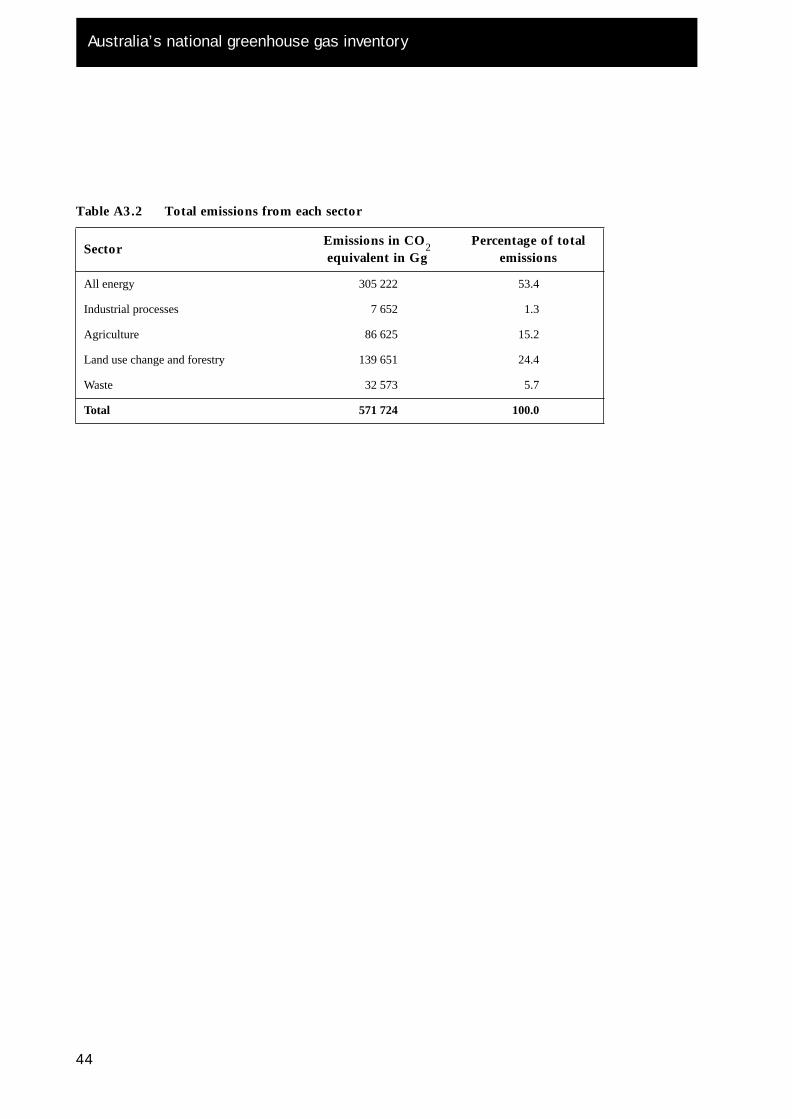
Australia’s national greenhouse gas inventory
Table A3.2 Total emissions from each sector
SectorEmissions in CO2 equivalent in Gg
Percentage of total emissions
All energy 305 222 53.4
Industrial processes 7 652 1.3
Agriculture 86 625 15.2
Land use change and forestry 139 651 24.4
Waste 32 573 5.7
Total 571 724 100.0
44
4
Chapter Four
Policies and measures
Overall policy context
Australia’s greenhouse policies and response measures are based on the comprehensive approach of addressing all sources, sectors and sinks of greenhouse gases not already controlled under the Montreal Protocol. The comprehensive approach is also a key feature of the Framework Convention on Climate Change. Australia’s key greenhouse policy and the basis for the National Greenhouse Response Strategy is the national interim planning target.
To stabilise greenhouse gas emissions (not controlled by the Montreal Protocol) based on 1988 levels by the year 2000 and to reduce these emissions by 20 per cent by the year 2005…subject to Australia not implementing response measures that would have net adverse impacts nationally or on Australia’s trade competitiveness, in the absence of similar action by major greenhouse gas producing countries.
The interim planning target, while not a legally binding commitment, acts as a yardstick against which the implementation of greenhouse response measures can be assessed. It also provides a focus for action in Australia to help mitigate anthropogenic global climate change, and establishes a context within which future planning is being undertaken.
IntroductionAustralia recognises that continued research, education and sharing of information is required to increase understanding of the potential implications of and responses to climate change. However, these approaches have limited value if they are not coupled with the adoption of a range of strategic, targeted and effective policies and measures. This premise forms a central element of Australia’s greenhouse program.
The main framework for this program is set out in the National Greenhouse Response Strategy. The National Greenhouse Response Strategy was agreed to in 1992 by Commonwealth, State and Territory governments following consultation with industry and community groups.
The goal of the National Greenhouse Response Strategy is to contribute towards effective global action to limit greenhouse gas emissions and enhance greenhouse gas sinks; to improve knowledge and understanding of the enhanced greenhouse effect; and to prepare for potential impacts of climate change in Australia.
It is important to note that the National Greenhouse Response Strategy is a dynamic strategy with an emphasis on monitoring implementation and the developing measures. Indeed, since its adoption at the end of 1992, many additional measures having a significant impact on limiting emissions have been identified and implementation of these measures has commenced.
The National Greenhouse Response Strategy recognises that a wide range of greenhouse-related actions and policies have already been adopted by Australian governments. These measures form an integral part of the National Greenhouse Response Strategy. Many of the new actions extend and expand on existing programs.
The key elements of the National Greenhouse Response Strategy comprise:
• a set of general principles underlying all response measures
• a set of sectoral objectives and sectoral
45
Policies and measures
strategies guiding response measures in key economic sectors and areas of public activity
• mechanisms for continuing monitoring of the programs identified in the strategy and for assessment of performance in limiting greenhouse gas emissions, conserving and enhancing sinks, and preparing for adaptation to climate change
• arrangements for the periodic review and continuing development of the strategy.
It is clear that in Australia, like many other countries, a cooperative approach to reducing greenhouse gas emissions is required. Given this, measures are being identified and implemented by all levels of government as well as by industry and community groups to reduce net emissions.
While the National Greenhouse Response Strategy provides the main framework for Australia’s approach to addressing emissions of greenhouse gases, there are other important initiatives that will reduce greenhouse gas emissions, though this is not their primary motivation. These initiatives include measures outlined in Australia’s National Strategy for Ecologically Sustainable Development; the National Landcare Program; the National Forest Policy Statement; as well as actions taken in response to the Australian Government’s micro-economic reform agenda.
Grouping of measuresThe measures outlined in this chapter are grouped by individual greenhouse gases, as well as by sector of economic activity. This form of classification, which is different from the approach taken in Australia’s National Greenhouse Response Strategy, reflects the decision by the Convention Intergovernmental Negotiating Committee to group measures using the IPCC guidelines established for the production of inventories.
46
Carbon dioxide
Carbon dioxide is the dominant greenhouse gas in Australia. In 1990, net carbon dioxide emissions were estimated to be around 80 per cent of Australia’s total greenhouse emissions. The main sources of carbon dioxide are combustion of fossil fuels for energy (including transport) and industrial processes. Clearing of vegetation to provide additional land for agriculture also appears important. Details of Australia’s carbon dioxide sources and sinks are set out in the previous chapter.
Around 50 per cent of all carbon dioxide emissions are related to stationary (non-transport) energy use. Fossil fuels provide most of Australia’s energy needs as Australia has no nuclear energy capacity and only limited supplies of hydro-electric energy. Renewable energy sources make a small but growing contribution to total energy supply. Use of fuels for transport contribute around 45 per cent and land use change and forestry around 30 per cent.
Strategies, programs and measures have been introduced or are being developed for all sectors of the economy including energy and transformation, transport, land use and forestry.
The Commonwealth Government’s approach to energy management is effected through the National Energy Management Program. The program relates to all major energy-using sectors and is directed towards the generation of energy management improvements that are cost-effective for energy users and therefore have a real prospect of economic benefits, while also contributing to the goal of reducing greenhouse gases.
Promoting energy efficiency is a shared responsibility between the Commonwealth and the States and Territories. An effective consultative and implementation framework is required particularly where consistent nationwide approaches are warranted. The Australian and New Zealand Minerals and Energy Council which comprises
Policies and measures
4
Commonwealth, State, Territory and New Zealand ministers responsible for minerals and energy, provides this framework.
While governments can lead by example, the responsibility for, and the benefits of, an energy efficient economy is the responsibility of the entire community. Links with industry organisations and community groups are crucial to the success of efforts to increase energy efficiency. In the design of energy management programs, therefore, governments in Australia work in consultation and collaboration with professional, business and community organisations wherever it is possible to do so.
While the main focus of greenhouse emission reduction measures are directed at carbon dioxide, many measures reduce emissions of other gases as well. Similarly, measures developed for other sectors can have implications for emissions originating in the energy sector. For example, capture and use of coal seam methane to generate electricity reduces total methane emissions and also displaces electricity demand, saving carbon dioxide emissions.
Key elements of these sectoral strategies are set out below.
Energy and transformation sectorAs part of the National Greenhouse Response Strategy, Australian governments agreed that first phase measures would give particular attention to energy transformation, distribution and use, given:
• the major share that these sectors contribute to greenhouse gas emissions
• the clearer understanding of the emission mechanisms in these areas
• the scope for taking ‘no regrets’ actions
• the measurability of emissions and reduction measures.
A range of energy measures are being introduced or are under consideration by the government. These include:
• structural reform of the electricity sector including an integrated least-cost approach to energy planning
• removal of impediments to free and fair trade in natural gas in Australia
• pricing energy to better reflect economic, social and environmental costs
• promoting greater use of co-generation schemes in energy supply
• setting minimum energy performance standards for appliances and equipment in the household, industrial and commercial sectors
• improving fuel efficiency in new motor vehicles
• providing information for energy users (covered in Chapter 5).
Electricity supply industry groups are closely involved in the development and implementation of government measures as well as taking the initiative to develop industry strategies to assist the nation in meeting emission reduction objectives.
Electricity supply industry reform
Electricity is the main source of energy in the residential and commercial sectors and an important source of energy for some energy intensive industries such as aluminium production.
Specific electricity supply industry reform measures are one element of broader economic reforms which are aimed at introducing a higher level of economic efficiency in private and public sector business enterprises.
All sections of the electricity supply industry in Australia have been subject to some degree of restructuring over the past decade. To varying degrees, reforms have been introduced into individual State electricity supply industries which have improved competition, productivity and service quality. For example, State governments
47
Policies and measures
have taken steps to ensure that utilities set electricity tariffs at levels which make allowance for government taxes and charges which would be payable if the utility was a private company.
The reform efforts of individual State governments and utilities themselves have been reinforced by the decision of the Council of Australian Governments to implement major structural reform of the electricity supply industry.
Heads of government are committed to the implementation of a competitive market from 1 July 1995 with, at its core, the separation of generation from transmission and competition at the generation level. The fully competitive market will allow direct customer to generator access; non-discriminatory access to the electricity grid; open entry for new participants in generation and retail supply; and no barriers to interstate or intrastate trade.
The move to a competitive market should lead to a change in the roles of demand management and energy efficiency as consumers and industry become more directly exposed to the true costs of energy through improved metering and market arrangements.
The move to a competitive electricity industry structure allows a range of specific energy efficiency benefits to be realised:
• a more cost-reflective pricing regime should result in increased efficiency of power use as customers respond to price signals by shifting load or investing in energy efficient plant and equipment
• a more competitive electricity market can produce incentives to promote electricity conservation where such measures are more cost-effective than building additional capacity
• removal of existing capital subsidies and cross subsidies embedded in tariffs will lead to more sensible patterns of energy use and promote a greater use of renewable energy sources, particularly in remote localities where renewable sources are already cost competitive
48
• appropriate grid access and pricing policies will encourage greater use of co-generation, renewables and remote area power systems where these are cost effective
• the development of an integrated national grid along the east and south of Australia will allow for the sharing of reserve capacity and fuel efficiency will be naturally encouraged by market forces
• an integrated grid will also provide for greater utilisation of gas with resultant emission benefits.
Significant gains have already been achieved in terms of improved thermal efficiency of generation and improved efficiency of the capital invested in the generation and distribution of electricity.
Natural gas reform
Australian governments are committed to a natural gas reform program to facilitate the further development of interstate trade in gas. Use of natural gas is likely to expand further as a result of a more competitive natural gas supply industry.
Natural gas currently provides around 17 per cent of Australia’s total energy requirement compared with around 11 per cent in 1980–81 and the trend for increased market share is expected to continue. This includes increased use of gas to generate electricity, particularly co-generation projects.
Co-generation
Co-generation is the combined use of power and heat from one primary energy source. Conversion efficiency of co-generation plant can exceed 70 per cent compared with a conventional electricity-only plant with thermal efficiencies around 35 per cent. Co-generation options result in a more efficient use of energy. Co-generated electricity reduces reliance on electricity supplied through the grid and, at times, privately generated electricity may be sold into the grid system to supplement public generation.
Policies and measures
4
Governments facilitate co-generation schemes by ensuring their utilities address co-generation options in their planning activities and provide appropriate buy-back arrangements for the purchase of surplus electricity. Under the proposed competitive electricity market now being developed by the National Grid Management Council, eligible co-generators will be subject to the same rules and conditions as other market participants. Electricity utilities encourage investment in co-generation as part of their demand management strategies.
There are a number of small and large co-generation projects either installed or under construction. There is considerable potential to expand the use of co-generation in Australia and capacity could reach 1000 megawatts over the next decade. Each megawatt of co-generation capacity could save around 5000 tonnes of carbon dioxide emissions.
Renewable energy
Renewable energy sources include biomass, hydro-electricity, wind and solar energy. The use of renewable energy which displaces fossil fuels provides an immediate saving of carbon dioxide emissions. Renewable energy technologies are already competitive in some niche markets in Australia, particularly household solar water heating and stand alone power supply systems in remote and rural areas.
Renewable energy stand alone power supply systems are widely used in Australia. Many thousands of individual telecommunication systems, large numbers of water pumping and household power supply systems and some dozens of small communities rely on renewable energy for their power supplies. Telecom Australia has since the early 1980s used photovoltaic technologies which were developed in Australia to provide telecommunication services throughout Australia.
Sales of solar water heaters have stabilised at approximately 16–17 000 a year. On an Australia-wide average, the solar component of a solar water heater meets about 70 per cent of a household’s needs for hot water, with the remainder being
supplied by supplementary gas or electric boosting. There is a sales tax exemption for the solar collector component of the systems. Solar pool strip collectors are also sales tax exempt.
Electricity utilities in South Australia, Western Australia and Victoria encourage renewable energy use by offering a 10 per cent loading on normal buy-back rates for generation projects based on renewable energy sources.
Training and accreditation schemes for installers and maintainers of renewable energy stand alone power supply systems have been introduced and a range of mobile and fixed displays and demonstrations are used to show potential consumers how these technologies can meet their energy needs, and the dissemination of publicity material. State and local governments also offer a range of financial incentives for the use of cost-effective stand alone power supply systems with a significant renewable energy component.
The Commonwealth, in cooperation with financial institutions, utilities, local governments and the industry, has developed innovative means of financing customer purchase of solar hot water heaters. For example, the EnergyCard is a low-interest credit card available to customers for the purchase of solar water heaters, heat pumps and other renewable energy technologies.
Local government authorities throughout Australia have actively responded to the challenge of climate change by implementing an extensive range of measures focused on reducing greenhouse emissions. Some examples of measures introduced by local governments to encourage use of solar water heaters are set out in the box below.
In the short term, the effect of increased use of renewable energy on carbon dioxide emissions may be relatively small. However, it is a base for the larger scale use of renewable energy with potential to significantly reduce emissions in the longer term.
49
Policies and measures
Local government actions to promote solar energy use
• New England Council provides interest-free loans to consumers of solar water systems.
• Shepparton Council provides consumers with a A$500 rebate on solar water heater purchases.
• Brunswick City Council Project Aurorah is a grid connected renewable energy sys-tem. Community members purchase solar panels which are then connected to the wind/solar system. Electricity provided to the system is purchased or credited against the person’s electricity bill.
Residential and commercial sectorsThe residential and commercial sectors are diverse, containing many thousands of individual consumer units ranging from small households to large office buildings. These consumers also require the widest range and combinations of energy services such as lighting, heating and cooling, hot water, cooking and refrigeration.
These two sectors account for around 12 per cent of total final energy consumption but because of their high share of electricity consumption they account for around 25 per cent of domestic carbon dioxide emissions associated with energy use.
Measures which facilitate demand management and promote energy conservation in the residential and commercial sectors are an important component of Australia’s carbon dioxide emission reduction strategy. Most measures require close cooperation between levels of government, energy utilities and consumers. Measures to stimulate cost-effective demand management are being developed by each level of government.
Improvement in the efficiency with which energy is used in the residential and commercial sectors is dependent on many factors such as the rate of new house and building construction, renovation rate of existing buildings and incentives for the take up of energy saving options. Government and electricity supply industry measures influence the rate of take up of more energy efficient options in a variety of ways. The rate of take up of energy saving options also depends on other factors including individuals’ awareness of options and potential cost savings. Information dissemination programs are discussed in Chapter 5.
Key measures in residential and commercial sectors
• Labelling and consideration of minimum energy performance of electrical appliances used in the residential and commercial sectors
• National House Energy Rating Scheme
• Energy Audit program for private and government commercial buildings
• National Commercial Building Energy Code
Labelling and minimum energy performance of appliances
Major domestic appliance labelling has been introduced in most Australian States. Under the National Greenhouse Response Strategy, governments are developing, in consultation with manufacturing industry, a national scheme for mandatory energy labelling for major domestic appliances. The scheme is to be implemented as soon as practicable.
50
Policies and measures
4
As part of the National Greenhouse Response Strategy, governments are also committed to the development, in consultation with the manufacturing industry, of minimum energy performance standards for domestic electrical appliances.
Efficient and cost-effective operation of appliance energy efficiency measures is supported by all parties including industry and consumer groups.
House Energy Rating Scheme
Governments have recently agreed to adopt a consistent nationwide House Energy Rating Scheme. The effectiveness of the national scheme will depend on factors which vary from region to region, such as local climate and heating requirements as well as additional building costs which affect take-up rates in different regions.
The national scheme will be coordinated to ensure consistency with State-based rating schemes like the Victorian House Energy Rating Scheme which has been developed for both new and existing houses.
Energy audit programs
Programs of energy auditing have been introduced. These programs include auditing private sector and government buildings to achieve optimum energy savings and reduce costs.
Audits help consumers to understand and target areas to save energy. The Energy Audits Program is supported by the electricity utilities. For example, the Northern Queensland Electricity Board distrib-uted 4000 home energy audit kits to customers.
Measures to save energy in government buildings have been introduced. These initiatives save the government money and also provide a demonstration of energy efficient building opportunities for the community. In 1992, the Prime Minister announced targets (15 per cent increased efficiency within five years and 25 per cent within 10 years) for improved energy efficiency in buildings owned or occupied by the Commonwealth Government.
Governments are also implementing an EcoOffice Scheme, which emphasises reducing and reusing resources, including energy, in the workplace. When purchasing household electrical appliances, federal agencies are now required to buy products with at least a four star rating where available.
National Commercial Building Energy Code
Energy efficiency in commercial buildings will be enhanced through the introduction of a national building energy code. The code will promote further improvement in all aspects of the design and operation of commercial buildings including the heating, cooling and lighting systems which determine overall energy demand.
In some States, energy conservation plans are required for prescribed categories of buildings. The purpose of these plans is to assess the building’s energy efficiency in order to promote the efficient use of energy and, where possible, to provide substitutes for non-renewable resources.
Local government programs have also been introduced. For example, the Brunswick City Council introduced a Community Buildings Energy Improvement Service in 1991 to support energy auditing and retrofitting of community buildings.
Industrial sectorA small share of total carbon dioxide emissions, less than 1 per cent, are directly attributed to industrial processes such as steelmaking and aluminium smelting. Manufacturing accounts for about a third of Australia’s total energy consumption. Energy use, primarily electricity, is an important source of emissions from the industrial sector.
Compared to other OECD economies, the Australian manufacturing sector has higher rates of energy consumption because of the concentration of resource processing and other energy intensive industries. Energy intensive industries, including aluminium, basic metal products, iron and steel,
51
Policies and measures
pulp and paper, chemicals and cement, account for approximately 27 per cent of all carbon dioxide emissions from fossil fuels in Australia.
Key measures related to industry include:
• voluntary industry measures
• demand management programs
• Energy Audits Program
• Cleaner Production Program
• Better Business by Environmental Management
• revised taxation measures to encourage equipment upgrading and specific investments in environmentally friendly goods and services
• cooperative government–industry agreements to achieve environmental goals.
Voluntary industry measures
Energy costs are a significant part of overall costs in many Australian industries. It is in these firms’ own interests to be as energy efficient as possible in order to maintain their competitiveness. Many firms already have in place cost-effective energy efficiency programs. Measures to improve the energy efficiency in the industrial sector also require close cooperation between levels of government, energy utilities and industry.
Members of industry groups including the Electricity Supply Association of Australia, the Aluminium Development Council, the Business Council of Australia and the Australian Coal Association are taking measures to assist Australia meet its environmental goals. These measures include supporting government programs and other initiatives which have a more direct benefit for the industry as well contributing to mitigation of carbon dioxide emissions.
For example, the Australian Coal Association has undertaken to support government efforts to meet international and domestic greenhouse objectives amongst other things by actively encouraging members to undertake energy audits, to investigate opportunities to increase reafforestation as part of
minesite rehabilitation and encouraging and supporting research and development of technologies which will, among other things, reduce greenhouse gas emissions.
Industry group efforts often include measures to deal with other greenhouse gases as well as carbon dioxide. Examples are given in the sections on methane, nitrous oxide and other gases.
The average amount of energy needed to produce a tonne of aluminium in Australia has fallen by around 2 per cent over the last five years. The Australian aluminium industry has put in place plans to achieve a further 2 per cent improvement in energy efficiency over the next five years.
Demand management
Demand management initiatives undertaken by electricity utilities are directed at all consumer sectors including industry. The following are two examples of the savings that have been achieved through demand management initiatives. The Demand Management Action Plan, developed by the State Electricity Commission of Victoria, has resulted in the investment of A$33 million in energy efficiency measures for Victorian businesses. While this action plan has recently ceased, it is estimated that electricity use by Victorian business has been reduced by around 100 megawatt-hours per year.
The Government Energy Management Plan in South Australia has delivered energy saving of A$8 million per year and is now being extended to the private sector.
As noted above, demand management is an integral part of reforms in the electricity sector. Support for effective demand management is shared between governments and electricity utilities.
Industrial equipment labelling and performance standards
Considerable potential exists to conserve energy in manufacturing by improving the energy efficiency of commercial and industrial equipment. Saving energy reduces carbon dioxide emissions and at the
52
Policies and measures
4
same time reduces production costs including electric motors.
Governments are developing energy labelling and minimum energy efficiency standards for industrial equipment.
Enterprise Energy Audit Program
The Commonwealth Government’s Enterprise Energy Audit Program has grown considerably and, during the course of 1993–94, subsidisation of audits amounted to nearly A$1 million. Prospective benefits from the implementation of audit proposals are significant. To facilitate this and similar energy audit programs, the Commonwealth Government has commissioned the Institution of Engineers, Australia to manage a register of accredited energy auditors. Approximately 200 auditing organisations are currently registered.
Data from the Energy Audit Program is collected and reviewed to enable auditors, firms and government to better understand and target significant areas to save energy and reduce costs.
Energy auditing has wide support within the electricity supply industry. Many utilities offer firms an initial free screening energy audit backed up with incentives to implement energy efficiency measures.
Cleaner production is the use of better management practices and production processes to minimise harmful environmental impacts from the beginning to the end of production processes—this includes energy efficiency. The Commonwealth Environment Protection Agency runs the Cleaner Production Program which promotes the concept of cleaner production and a whole-life-cycle approach to production research. The program includes enlisting firms to participate in demonstrations with before and after energy audits guided by energy consultants.
Better Business by Environmental Management is a program that provides financial assistance to eligible firms to undertake an environmental examination and prepare an environmental management plan.
The program offers organisations up to A$5000 per examination or 50 per cent of the cost of the
examination, whichever is the lesser amount. The firm’s contribution may be fully tax deductible under the Income Tax Assessment Act.
Although energy efficiency is not a primary target of the program, environmental management plans often result in energy efficiency gains. As the program focuses on regulated air emissions, there may also be reductions in some of the non-carbon dioxide greenhouse gas emissions such as nitrous oxide.
Taxation arrangements
The Australian Government has recently put in place new taxation arrangements that encourage industry to invest in new plant and equipment and, in one instance, environmental expenditure. In terms of reducing emissions, these arrangements will principally be beneficial by the increased uptake of new technology which is more energy efficient.
Recent revisions to federal tax legislation provide for substantial acceleration of depreciation deductions for plant and equipment. Acceleration of the depreciation schedules has the effect of reducing the effective tax rate on domestic investment in plant and equipment. Older assets are more quickly replaced with cleaner, more energy efficient equipment.
Changes to the tax system in the 1992–93 Budget allow for the inclusion of new plant and equipment specifically introduced to improve environmental outcomes as a tax deductible item. The Commonwealth Government also allows taxpayers a deduction for capital expenditure incurred primarily and principally in undertaking an environmental impact study.
Transport sectorEnergy use for transport contributes around 15 per cent of total carbon dioxide emissions.
Australian governments recognise the need to integrate transport policies carefully to achieve the objectives of promoting efficient and environmentally friendly transport. Measures
53
Policies and measures
adopted aim to improve the technical and commercial efficiency of the Australian land transport industry and result in lower levels of carbon dioxide emissions than would otherwise have been the case.
Specific government measures with potential to save energy and reduce carbon dioxide emissions include rail reform, road upgrades, road transport reform, promotion of technical innovation, control of vehicle emissions, a national bicycle strategy, improving the efficiency of public transport and car fleets, use of alternative fuels, urban planning and design, and travel demand strategies.
National Transport Policy Framework
In June 1993, transport ministers from all Australian governments, making up the Australian Transport Council, agreed to support the development of a National Transport Policy Framework, with the goal of ensuring that the transport system more effectively underpins the nation’s economic, social and environmental goals. The National Transport Policy Framework will seek to better coordinate policy and investment strategies, leading to improved transport efficiency.
Road transport reform
Direct road funding by the Commonwealth Government is focused on the National Highway. As of 1 January 1994, the National Highway was extended to include urban routes, linking the National Highway across the major cities.
The National Road Transport Commission was formally established on 15 January 1992. It is charged with the development of national motor vehicle emission standards in conjunction with the Commonwealth Environment Protection Agency and the monitoring of the use of alternative fuels. The commission’s initiatives complement the establishment of the National Rail Corporation and increased rail infrastructure investment. The resulting land transport efficiency improvements will have positive environmental effects.
54
Improving the efficiency of national transportation systems
In 1992, the Commonwealth Government, in collaboration with several State governments, established National Rail. National Rail has been established to operate interstate rail freight on a commercial basis without subsidy from governments. Combined with the implementation of the One Nation rail infrastructure package, this measure is expected to increase freight market share for rail and reduce the rate of growth of road transport, decrease energy consumption per tonne of freight, and thus reduce the emission of carbon dioxide and other greenhouse gases. It is expected that the relative energy efficiency of rail will mean that greenhouse emissions will be less for an equivalent task.
The One Nation statement announced additional funding of A$1.1 billion for upgrading, extending and maintaining road and rail infrastructure. The Prime Minister also announced that the Commonwealth Government will extend and make more generous the depreciation treatment of infrastructure assets and allow private investors to issue non-deductible and non-assessable bonds to finance the development and operation of new public land transport infrastructure.
The Commonwealth Government has amended road transport legislation to allow for the operation of B-doubles along designated routes across Australia. A B-double is a combination road freight vehicle consisting of a prime mover and two semi-trailers, each supported by a turntable. These vehicles have a road safety record better than conventional freight vehicles and higher levels of cartage efficiency than single articulated trucks, resulting in lower emissions per tonne/kilometre of freight carried. Their contribution to reducing greenhouse gases will depend on the extent of their access to the road network.
Shipping reform, a major component of the Commonwealth Government’s transport reform agenda, is allowing the introduction of modern, technologically advanced, fuel efficient ships generally able to handle greater quantities of cargo more efficiently.
Policies and measures
4
National Bicycle Strategy
A National Bicycle Strategy is to build on State programs, such as the Victorian-sponsored Bike to Work program, to encourage greater use of bicycles in place of less environmentally friendly modes of transport. The strategy aims to encourage cycling, particularly commuter cycling, and to integrate this mode more fully within transport planning. The strategy will form the basis of future work within and between all three levels of government to further encourage and promote cycling.
The National Bicycle Strategy has been supported by a A$3.72 million program of federally funded demonstration bicycle path projects. Under the program, A$3 million was provided for bicycle paths in all Australian capital cities and an additional A$720 000 was allocated to bicycle paths in provincial centres. Capital city projects were selected for funding primarily on the basis of their ability to encourage commuters to shift from private motor vehicles to bicycles.
Fleet management
Governments are adopting measures to reduce fuel consumption and improve fuel efficiency of vehicle fleets. These measures include rationalising government vehicle travel and developing car pool programs. An energy audit of the Commonwealth Government vehicle fleet in 1992 provided the basis for concerted action to increase fuel efficiency in the fleet.
Alternative fuels
Governments at federal, State and Territory levels are actively encouraging the use of less greenhouse intensive fuels than petrol and diesel through a range of measures.
Liquefied petroleum gas and natural gas are exempt from Commonwealth excise. In any future reviews of fuel charges and taxes, governments have agreed to take account of the fact that the current excise exemption for alternative transport fuels such as liquefied petroleum gas and natural gas is an important factor in industry decisions to use those
fuels. They have also agreed that some predictability for investment decisions in this area is desirable.
Governments are fostering alternative fuels in some classes of government vehicles where there is a potential for carbon dioxide and other greenhouse gas abatement and it is economic and practicable to do so. Governments are also taking steps towards the demonstration in government fleets of other alternative fuels such as compressed natural gas and blended alcohol fuels, where practicable.
As an additional incentive for users to convert vehicles to liquified petroleum gas or natural gas, the necessary equipment is sales tax exempt.
Governments also recognise the importance of ensuring that policies effected for a particular environmental benefit are not overshadowed by associated adverse environmental impacts. As a precautionary measure in fostering alternative fuels, the Commonwealth Government is developing a National Environmental Standard for Petrol. Implicit in this exercise is weighing-up the potential adverse and beneficial environmental effects of using alternative fuels, changing fuel composition and the trade-offs inherent in taking action to increase fuel security and the efficiency of fuel production and use including related changes in evaporative and exhaust emissions.
55
Policies and measures
Ethanol fuel industry
The Commonwealth Government has recognised the advantages of fostering an ethanol fuel industry in Australia. Following from the Prime Minister’s 1992 Environment Statement, A$2 million is being provided, on a dollar-for-dollar basis in partnership with industry, to demonstrate new technologies producing ethanol from woody fibres and waste organic material.
In the context of the passage of the 1993–94 Budget and as part of the Lead Abatement Package, the Commonwealth Government agreed to fund an ethanol initiative, consisting of:
• a A$25 million fuel ethanol bounty scheme from 1994–95 to 1996–97
• a A$3.94 million ethanol research and development program from 1994–95 to 1995–96.
Urban planning and design
Governments are developing design principles for new urban neighbourhoods and residential developments to incorporate in planning codes to reduce fossil fuel use from transport. In 1990, Australian governments agreed to examine more efficient and equitable patterns of urban settlement, and in July 1991 agreed to the promotion, planning and support of urban consolidation; the adoption of an intergovernmental approach to provision, charging and financing of urban infrastructure; and improvement in government mechanisms for planning and coordination of urban development.
In September 1991, the Planning Ministers Confer-ence, recognising the need to reduce demand for fringe urban growth and to achieve higher densities whilst promoting affordability and equity, agreed to a range of measures designed to improve efficiency in land supply and infrastructure provision.
Strategic plans for major new urban developments, residential infill and major redevelopment of existing areas will incorporate higher density requirements, providing opportunities to reduce travel distances. Strategic planning, including integration of transport links with employment centres and with concentrations of higher density and affordable housing, will also be implemented or adopted in each State and Territory.
General policy emphasis towards more efficient urban forms and structures will help to ease pressures on transport and therefore carbon dioxide and other greenhouse gas emissions. A national model code for higher housing density has been completed.
The Building Better Cities Program, announced in the 1991–92 Federal Budget, is providing up to A$816 million over five years to finance urban reform strategies in selected areas. A number of these projects will include steps that will provide more efficient use of existing urban infrastructure and provide new infrastructure where necessary, improve urban management and reduce urban development costs. Projects will also improve the use of urban land, reduce pollution and congestion costs from traffic, and increase housing choice and affordability.
Public transport
Governments are currently upgrading urban public transport including the introduction of alternative fuels (compressed natural gas) for buses; rehabilitation and development of urban rail systems; integration and coordination of other modes of transport, and improving service quality. They are also implementing measures to improve the efficiency of the operations of their urban road networks through, among other things, coordinated traffic signalling; transit lanes; bus lanes; driver information systems; network upgrading; driver training and education.
Travel demand measures have been introduced and further improved by both Commonwealth and State governments to move towards integrated land use and transport planning. Park and ride programs
56
Policies and measures
4
are used in many metropolitan cities to encourage greater public transport use.
State and Territory governments are also investigating and implementing measures to reduce travel through various demand management techniques such as car pooling and parking policy.
The fringe benefits tax is a tax imposed on most employers in respect of the total taxable value of non-cash fringe benefits provided to employees. From 1993, the tax has been levied on car parking benefits for employees provided by employers on the business premises or associated premises. This may also have the effect of encouraging greater use of public transport.
Fuel consumption
A national fuel labelling scheme for new cars, light commercial and four-wheel drive vehicles has been introduced following extensive consultation with the Australia motor vehicle industry.
Negotiations with the Australian vehicle industry for a national average fuel consumption target for new passenger cars are completed and the Commonwealth Government is expected to make an announcement shortly on new arrangements. The fuel consumption target will be included in code of practice with the vehicle industry. A similar code for four-wheel drive and light commercial vehicles will be negotiated with the vehicle industry following final agreement on the target for new passenger cars.
Land use change and forestryThe rate of land use change, particularly clearing of vegetation to provide additional land for agricultural use, and the stock of forest resources have important implications for net carbon dioxide emissions. Land clearing is estimated, with a high degree of uncertainty, to contribute around 30 per cent to total carbon dioxide emissions each year.
Measures to manage land clearing and enhance the soil, native vegetation and forests as carbon dioxide
sinks are a part of Australia’s carbon dioxide mitigation program.
Key measures include:
• managing both government and private land sustainably, including reduced vegetation clearance in marginal areas
• establishing native vegetation retention and rehabilitation programs and conservation reserves
• promoting animal husbandry practices which maintain the effectiveness of the soil as a sink for greenhouse gases
• the One Billion Trees Program.
Managing land clearing
The early approach of Australian governments to land use included policies which promoted the removal of native vegetation as a means of increasing the area available for economic or agricultural activity. However, this approach is changing, particularly at the State level.
Improving the effectiveness and coverage of mechanisms used to control the authorisation of clearing in each State and Territory is the primary method of minimising the carbon dioxide released during the clearing of vegetation.
In New South Wales controls exist for the clearing of protected native vegetation in the most sensitive areas of the State. In areas not subject to legislative constraints, there is an increasing responsibility and awareness developing among landholders as a consequence of Landcare and total catchment management initiatives.
A review of tree clearing on leasehold land in Queensland is currently being undertaken. The review is examining the current tree clearing practices in Queensland and other States, land degradation, biodiversity issues and nature conservation issues, with the aim of preparing controls for tree clearing that will ensure that lessees prepare and implement tree management plans. The review is intended to ensure that tree clearing is consistent with sound resource management
57
Policies and measures
principles including the maintenance of ecological processes.
Victoria has land use controls on the clearance of native vegetation and is continuing research and monitoring of native vegetation clearance through the use of remote sensing techniques. A project mapping changes to native vegetation is being undertaken. This builds on previous research on forest cover changes and carbon dioxide emissions.
Broadscale clearance of vegetation in South Australia was prohibited in 1983 and since then measures have been put in place to safeguard 530 000 acres of native vegetation. The vegetation on private land is protected by heritage agreements between the landholder and the government and, in return for financial assistance and advice, the landholder is responsible for its management.
The Intergovernmental Agreement on the Environment (May 1992) and the National Strategy for Ecologically Sustainable Development are important further vehicles for coordination of sustainable land use policies in Australia.
For example, the Intergovernmental Agreement on the Environment includes a schedule which requires governments to review relevant legislation relating to clearing, and to ensure criteria for assessing land clearance applications integrate enhancement of productivity of all lands with biodiversity conservation, land protection, water management and landscape values.
The National Strategy for Ecologically Sustainable Development includes commitments by governments to:
• assess the current rate of native vegetation clearing on a national basis, including the development of national inventories of native vegetation
• cooperatively develop a range of measures, including financial incentives, cost reimbursements and rate rebates, to encourage land managers to improve protection of native vegetation.
58
A range of other national and regional strategies will contribute to emission reduction and sink enhancement and conservation. These include the National Strategy for Rangeland Management and the Cape York Peninsula Land Use Strategy, both of which are scheduled to be finalised in 1994 or early 1995.
National Landcare Program
The National Landcare Program provides an inte-grated approach to natural resource management by integrating land, water and vegetation programs administered by the Commonwealth Government, in conjunction with the States and Territories. It has been characterised by cooperative action between all levels of government, the community and the agricultural sector.
The period 1990–1999 has been declared the Decade of Landcare. Over this period the Commonwealth Government has made a commitment to provide at least A$420 million over 10 years for Landcare and related tree planting and remnant vegetation programs. Current estimates suggest that the Commonwealth Government will spend more than A$1000 million on land, water and related vegetation programs by the end of the decade.
At the grass roots level are the community Landcare groups, who are partially funded by the National Landcare Program. These groups work on a small community basis and focus on the development of ecologically sustainable farming systems. Measures adopted by Landcare groups include rehabilitation and revegetation, which will increase the level of organic carbon in the soil and provide a valuable carbon sink for atmospheric carbon dioxide.
Landcare programs promote improved soil and pasture management techniques to minimise carbon loss from cultivation. Minimum tillage practices, stubble retention and the use of crop rotation using widely separated species to assist weed control can contribute significantly to the maintenance of organic matter in soils subject to cultivation.
Policies and measures
4
One Billion Trees and Save the Bush
Further initiatives implemented under the umbrella of the National Landcare Program are the Save the Bush and One Billion Trees programs. Both these programs aim to restore levels of vegetation on Australian land by conserving remnant native vegetation, and pursuing programs of natural regeneration, direct seeding and tree planting.
The Australian Nature Conservation Agency has contracted a non-profit community organisation, Greening Australia, to implement the One Billion Trees program. It is estimated that approximately 550 million trees and shrubs have either been planted or saved through assistance to natural revegetation or protective fencing over the first four years of the program. An estimated 100 million trees and shrubs are to be established or protected each year.
Over the life of the project, some 1.3 billion trees and shrubs will have been established or protected making a major annual contribution to reducing net carbon dioxide emissions.
Forestry
Forests are a crucial part of many of the ecological processes which enable life to continue on earth, including the oxygen, carbon, nutrient and water cycles. They play a role in modifying climate at a local and global level, and have a role to play in reducing emissions of carbon dioxide and the enhanced greenhouse effect.
The main mechanism that Australia employs to ensure the sustainable use of and conservation and enhancement of forests as sinks is the National Forest Policy Statement.
Governments, with the exception of Tasmania, agreed to the National Forest Policy Statement of 1992. The policy statement promotes the ecologically sustainable management of Australia’s public forests. The National Forest Policy
Statement includes codes of practice for all commercial and high impact forest uses of public forests. Education programs deal with the issues of ecologically sustainable management and clearly relate these to management requirements for conservation and to the codes of forest practice governing activities in both public and private forests.
Forest products for building
The National Association of Forest Industries promotes the use of timber and other wood products as building materials, including developing more appropriate building standards that take better account of the properties of timber and wood products. These measures will help to reduce dependence on the use of materials manufactured from more energy-intensive processes.
The National Forest Inventory compiles information on the wood and non-wood values of Australia’s forests (across all land tenures) and identifies significant gaps in the existing information. It covers biotic, economic and cultural characteristics and will assist in providing information useful for assessing current and future greenhouse sink capabilities.
A State of the Forests report is to be prepared every five years, which will include State and Territory reports on the implementation of policies in the National Forest Policy Statement. The report will include data on the total forest area, which will be useful for the National Greenhouse Gas Inventory of emissions and sinks.
59
Policies and measures
State and Territory forest agencies and the private sector currently establish some 300 square kilometres of new forest plantations each year. This is already making a small but useful contribution to enhancing Australia’s sink capacity.
Measures primarily directed at other sectors also have implications for forests. For example, programs to increase the rate of paper recycling reduce the domestic wood harvest.
Methane
Methane emissions are much smaller than carbon dioxide emissions. However, methane is a much stronger greenhouse gas. Methane emissions contribute around 20 per cent to total greenhouse gas emissions.
Methane is released to the atmosphere from a number of anthropogenic sources: gas drilling, venting and transmission; coal mining; landfills and animal wastes; rice paddies; the burning of vegetation; and the digestive processes of ruminant animals.
Policies and measures adopted and implemented in Australia are focused towards these sources of methane emissions.
Energy and transformation sectorLeakage of methane from gas pipelines is being reduced by rehabilitation of low pressure gas reticulation pipelines which will result in better than 20 per cent reduction in leakage by 1995, with up to 80 per cent reduction in some areas.
Methane emissions from a number of landfill sites is
60
captured and used to generate electricity. In some cases, excess electricity is sold to state electricity grids. Options for the collection and conversion of methane from landfill sites as an alternative energy source are being encouraged by state governments and implemented by some local governments around Australia.
Residential and commercial sectorsLandfill operations are a significant source of methane emissions. Implications for methane emissions are considered in the formulation of household recycling and waste disposal plans.
Australian governments have agreed to a national target of 50 per cent reduction of waste going to landfill by the year 2000. Most States have or are developing waste minimisation and reuse strategies like the National Waste Minimisation and Recycling Strategy.
Options to reduce disposal of organic waste materials (garden wastes and wood wastes) which produce methane gas in landfills are under continual investigation. Landfill standards to ensure the recovery and utilisation of methane gas from major landfill sites is being considered.
Local governments and the waste industry will be consulted in the development phase of environmental standards for waste disposal facilities. A community composting-training pilot program is nearing completion. It is being carried out in conjunction with local councils.
Policies and measures
4
Assistance is being provided to a number of local government authorities to formulate community education programs on kerbside collection, household recycling and mulching schemes.
Industry has introduced measures to reduce methane emissions. The following are two examples of such measures.
Coal bed methane
A project to use coal seam methane to generate up to 94 mega watts of electricity is to be undertaken by the Broken Hill Petroleum Pty Ltd at its Appin and Tower mines south of Sydney. The project will see a 50 per cent reduction in methane emissions to the atmosphere. All mine gas produced during methane drainage operations will be utilised. Another project to generate 12 mega watts of electricity from coal seam methane will be undertaken by Oceania Coal at its Taralbra colliery near Newcastle.
Liquefaction of natural gas
Development and implementation of new technology has reduced methane emissions during liquefaction of natural gas.
In the case of Australia’s largest natural gas project, greenhouse gas emissions will be 10 per cent lower in 1995 compared with the original plant design. Initiatives are being assessed which have the potential to reduce emissions by a further 19 per cent. These reductions are largely due to measures which reduce methane emissions.
Land use sectorAs part of the National Strategy for Ecologically Sustainable Development, governments are promoting increased efficiency of production of animal products. This will reduce methane emissions from animals and the whole agricultural system. Enteric fermentation is the main source of livestock methane emissions.
Specific measures include:
• an enhanced extension program in rangeland systems
• new animal waste processing systems for intensive livestock holdings which use either aerobic digestion or the capture of methane from anaerobic digesters for use as an energy source.
Nitrous oxide and other gases
Nitrous oxide and other greenhouse gases make up a relatively small part, less than 1 per cent, of Australia’s total greenhouse emissions.
Land use sectorAnthropogenic sources of nitrous oxide emissions include biomass burning, land clearing, leguminous pastures, nitrogen fertilised crops, animal manures and urine, and fossil fuels. Enteric fermentation is the main source of livestock methane emissions. Emission levels depend on feed type.
The addition of nitrate and ammonium fertilisers to soils is another source of nitrous oxide closely associated with soil processes and agricultural practices. Major industrial sources of nitrous oxide appear to be associated with the manufacture of nylon and nitric acid. Emissions from cars may also be significant.
By world standards Australian use of nitrogenous fertilisers is very low per hectare, giving little scope for lowering usage, especially in broadacre crops. Some nitrous oxide also comes from nitrogen fixed by legumes, which are extensively planted in rotation and in perennial and annual pastures. However, considerations of ecological sustainability
61
Policies and measures
suggest little scope for replacing this generally desirable practice.
Improved efficiency of nitrogen uptake from legume nitrogen and nitrogen-based chemical fertilisers reduces the need to replace nutrients lost from the soil with chemical fertilisers. These fertilisers raise greenhouse gas emissions through energy-intensive manufacture and release of nitrous oxide when in use.
Industrial sector
Perfluorocarbons
Tetrafluoromethane and hexafluoroethane are perfluorocarbons that are strong greenhouse gases. A major source of perfluorocarbons is the aluminium industry. Perfluorocarbons are formed during certain transient operating conditions, called the anode effect, in the production of aluminium.
An assessment of the role of perfluorocarbons as greenhouse gases, sponsored by the international aluminium industry, was carried out by the Centre for International Climate and Energy Research—Oslo.
62
The incidence of the anode effect varies with different aluminium production technologies and operating practices. The international aluminium industry has established that the fundamental strategy for the reduction in perfluorocarbon emissions is to reduce the anode effect time per day cell. Each smelter has to develop a strategy for its particular operational constraints.
The Australian aluminium industry has achieved major reductions in the anode effect per day cell through improvements in equipment performance and reliability, job redesign and training of smelter operators. Anode effect time has been reduced to less than one-third 1990 levels.
Australian smelters are continuing to work on process improvements. The rate of improvement will reduce as the factors which determine the anode effect and energy efficiency approach the practical limits for each smelter.
5
Chapter Five
Education and information activities
The Framework Convention on Climate Change emphasises the important role that education, public participation and public awareness will need to play in achieving an effective response to potential anthropogenic global warming. Activities outlined in the Convention include education and public awareness programs on climate change, public access to information on climate change and its effects, public participation in addressing climate change and its potential effects, and training of scientific, technical and managerial personnel.
Australia considers education and information-related actions to be an important building block in our overall approach to greenhouse response.
Greenhouse education and information approaches in AustraliaAction to achieve Australia’s greenhouse response is not simply a responsibility of government. Australia recognises that some of the greatest contributions can be made by the actions of individuals, community-based organisations, businesses and professional groups such as architects and engineers.
At the same time, it is recognised that the capacity to make a contribution (at both the government and non-governmental level) is often hindered by lack of information on the available courses of action or a lack of understanding about the issue being addressed.
In the light of this, Australia’s approach to greenhouse-related education and information activities has been developed at two levels. The first level aims to develop activities which are accessible to the entire community. The second level involves activities which are specifically targeted at business, schools and universities, professional groups, non-governmental organisations and the various agencies and personnel at all levels of government.
However, regardless of the level, all education and information activities have been designed to:
• influence and support community attitudes and increase motivation to take action
• educate the community on available options
• redress market failure in the pricing system
• tell people how successful their actions have been
• inform government what has been done and what needs to be done.
The National Greenhouse Response Strategy places a strong emphasis on the need to systematically address the information needs of the Australian community. The first phase of response measures includes research and review studies, and education and adaptation measures and, as a matter of priority, the provision of information for energy users.
63
Education and information activities
In addition, individual education and information actions have been developed for different sectors of the Australian community. These actions cover a wide range of different social dimensions. For example, they include:
• improving access to information on energy performance in relation to domestic and commercial buildings, domestic and commercial appliances, motor vehicle fuel consumption, as well as removing barriers to users and encouraging more informed choices about energy use
• using information services to encourage the use of best practice energy efficient technologies
• developing information programs which take account of the role that women often play as key decision-makers in the household sector
• ensuring that information programs address the activities of local government, community groups, education institutions, and the business sector.
The National Greenhouse Response Strategy contains a special section dealing specifically with community information. Its objectives are to:
• promote a better appreciation and understanding by the community, industry and business of the enhanced greenhouse effect and related issues (including the costs and benefits of response measures)
• improve awareness by these groups of how they contribute to greenhouse emissions and modify sinks and how they might be affected by the enhanced greenhouse effect
• achieve greater acceptance by these groups of their responsibility for taking action, and a better understanding of the positive roles that they can play.
A range of measures is being implemented to achieve the above objectives. Research is being conducted into the most effective means of raising community awareness and improving understanding of the greenhouse issue. The aim is
to use this research to develop and implement information and education programs that are balanced, factual and scientifically sound. In particular, these measures are being designed to take into account the role of key groups and build on programs already under way, including in schools, local government and community organisations.
Australia also recognises that a two-way exchange of information is required between the community and government. Accordingly, the strategy includes mechanisms for involving the community in its implementation and further development. The involvement includes participation in action and management programs; support for information exchange and data gathering; and contributing to policy formulation.
Governments in Australia have also established the National Greenhouse Advisory Panel as a small but broad-based advisory body, including representatives of scientific, technical, industrial, administrative and conservation interests. One of the panel’s roles is to advise Australian governments on issues related to the National Greenhouse Response Strategy.
Summary of materials produced in AustraliaBefore the adoption of the National Greenhouse Response Strategy, most attention in Australia had been paid to increasing public understanding of the science and implications of climate change. A considerable proportion of the early work was carried out by non-government organisations and the media.
The adoption of the strategy has given a strategic shape to the direction of development of information materials and programs, and to the formulation of objectives they are to achieve.
The provision of governmental grant schemes has resulted in the production of a wide range of written materials, carefully targeted at different groups including primary and secondary students, ethnic groups, women’s groups, householders,
64
Education and information activities
5
office workers, the business sector and professional teaching and engineering associations. This material is coupled with some electronic media products (such as video tapes and audio programs), and a range of local action projects. Some States have also funded Train the Trainer programs to achieve a multiplier effect in disseminating information and community capacity building.
As a result, a broad spectrum of information materials relating to global climate change have been produced.
The Australian and New Zealand Environment and Conservation Council has carried out a systematic review of greenhouse educational and information materials produced in Australia between 1988 and 1993. As part of its work, the review has established a database of over 700 items produced from government and non-government sources in the period. This database gives details of each item, including its author, title, an abstract (where available) and details of its current availability.
Federal Government initiativesAt the federal level, major greenhouse information responsibilities have been assigned to the Department of the Environment, Sport and Territories and the Department of Primary Industries and Energy.
Activities of the Department of the Environment, Sport and Territories range from introductory material about greenhouse, such as Inside the Greenhouse, to commissioned papers dealing with a wide range of relevant issues. These more focused materials cover a spectrum of key issues: from tradeable emissions, opportunities for reducing greenhouse gas emissions through technology transfers and the potential of solar and wind energy, to the impact of climate change on weather hazards and on fisheries, and the costs and benefits of meeting greenhouse emission targets.
Over time, activities have moved from producing publications intended for widespread use, to more precisely targeted publications designed to meet the specific needs of groups with significant leverage on
emissions reductions. Members of these groups include architects, engineers, designers, health and medical professionals, educationalists, town planners, building surveyors, builders and local government.
The Department of Primary Industries and Energy provides information about specific measures for energy saving (with consequent implications for greenhouse gas emission reduction). These products are usually directed at specific audiences—for example, a particular part of the manufacturing industry or buyers of new cars—or a particular energy issue. The Bureau of Resource Sciences of the Department of Primary Industries and Energy produces a quarterly Climate Newsletter which aims to inform government agencies and scientists of developments in greenhouse science and policies.
State and Territory programsSome States and Territories have also put in place greenhouse strategies which contain specific measures to develop and implement information programs.
Public awareness
Improving general public awareness is seen as an important component of the National Greenhouse Response Strategy. The initiatives taken vary from State to State depending on what is seen to be the most urgent need. For example, in the Northern Territory, the Environment Protection Unit of the Conservation Commission is responsible for responding to information requests, visiting schools, and disseminating available publications.
Energy information centres
Some States have made good use of energy information centres to distribute material on how energy savings may be made which can help reduce greenhouse gas emissions. These centres give advice on specific issues such as housing plans and cater for general community information needs, schools’ visits and, to a lesser but growing extent, business interests. Centres are investigating ways of
65
Education and information activities
networking among themselves to extend their overall impact as community service providers.
Energy utilities
Energy utilities (such as the State Electricity Commission of Victoria, Pacific Power in NSW and the ACT Electricity and Water Authority) have developed and distributed videos and pamphlets dealing with climate change, developed energy conservation promotional campaigns, conducted building energy management seminars and provided consumer advice and conservation leaflets. Energy agencies in Victoria have developed environmental management strategies for schools which take a whole-school approach and match school operations to their teaching.
One useful initiative has been to develop new residential and commercial account formats which allow customers to compare average daily consumption for the current period with the corresponding period in the previous year.
Targeted strategies
Consistent with the National Greenhouse Response Strategy, a considerable proportion of information materials that have been developed are intended for use by targeted audiences. The government of Victoria has been a particularly active participant and has produced a wide range of materials. These include the Greenhouse Saver Program, which has been in operation for three years and has resulted in a series of materials targeted to the household and business sector.
In New South Wales, the Office of Energy is developing programs targeted at reducing the use of greenhouse gas-emitting household, commercial and industrial energy. Programs include promoting co-generation, developing pricing and related policy for renewable energy use, and funding greenhouse-related renewable energy development, energy efficiency and fuel substitution projects.
The Greenhouse Scorecard, developed by the Victorian Government, is an interactive computer program which can assess individual household
greenhouse gas emissions. Given the success of the Scorecard it is now being redeveloped for use nationally.
Schools
Addressing potential climate change is an issue not only for Australians of today, but also for future generations. The provision of information and the incorporation of greenhouse and other environmental topics into school curriculum courses, whether at primary or secondary level, is particularly important as these people are the decision-makers of the future. Governments have produced information materials for use in schools and distribution to the general public. Teaching curriculum materials have been designed for senior secondary students for maths, science, geography, English and environmental studies course work. The School Greenhouse Saver provides practical advice for students and teachers to reduce greenhouse gas emissions.
Local governmentLocal government also has an important role to play in Australia in climate change response. The way in which local governments are encouraged to respond, and do respond, varies greatly depending on local priorities.
There is considerable interest in greenhouse issues in local government areas. For example, some of Australia’s coastal councils have been active in disseminating information on greenhouse issues associated with the problem of sea-level rise.
Research, funded by the Department of the Environment, Sport and Territories, is currently under way to identify the experience globally, of how climate change may affect the functions and activities undertaken by local government, and the extent to which local government is dealing with these issues.
The Department of the Environment, Sport and Territories has also played a useful role in developing information exchange at the level of local government through its Local Government
66
Education and information activities
5
Environmental Information Exchange Scheme. The use of environment resource officers in each State and Territory and the provision of CouncilNet (a computer-based electronic communication network) are two notable products.
The Victorian Government has initiated a Local Government Energy Efficiency Program which has undertaken detailed energy auditing of local government buildings. This has resulted in the establishment of an Energy Consumption Database and associated reporting capacity for local governments.
ConclusionThe basic strategic approach to education and information activities in Australia and the objectives that underpin this approach are, and will continue to be:
• to move towards active community involvement in the development of Australia’s greenhouse policies
• to ensure that all key players are fully committed to taking positive action to limit greenhouse gas emissions, protect and enhance sinks, and provide support to measures taken to address greenhouse issues.
67

Education and information activities
68
6
Chapter Six
Projections and impacts of measures
On present estimates, if no greenhouse gas measures were taken, Australia’s greenhouse gas emissions would grow from 572 million tonnes of carbon dioxide equivalent in 1990 to 654 million tonnes in 2000. That represents an increase of 82 million tonnes, or 14 per cent. This estimate is, however, dependent on the present accuracy and continuing validity of a number of assumptions, such as oil prices, population growth rates, agricultural markets and technological changes.
Measures already in place, if continued at the current rate of application, would produce an emission reduction of about 44 million tonnes of carbon dioxide equivalent in the year 2000. Of this, measures aimed at reducing emissions from sources contribute 29 million tonnes and measures aimed at sink enhancement contribute the remaining 15 million tonnes.
With current measures taken into account, Australia’s greenhouse gas emissions in the year 2000 are projected to be 610 million tonnes of carbon dioxide equivalent, which is 38 million tonnes, that is, 7 per cent, above 1990 levels.
Further reductions in greenhouse gas emissions could be obtained by extending existing measures or by introducing new measures. These options are discussed in Chapter 9.
IntroductionThis chapter considers projections of carbon dioxide, methane, nitrous oxide and other greenhouse gases. For each of the gases, projections of emissions for the year 2000 and assessments of effects of measures on greenhouse gas emissions and removals are separately presented, sector by sector.
Measures analysed are those already being implemented, as presented in Chapter 4. Measures have been assessed individually, but are presented here as the aggregated effects of measures for a particular sector or subsector, due to difficulties in isolating individual impacts and the fact that the measures have interacting and overlapping effects. The assessments in this chapter refer to the impact of measures at current or ‘committed to’ rates of implementation.
The approach adopted in most cases in this chapter is first to generate an emissions projection under a ‘no measures’ scenario, and then to make an assessment of the impact of measures on net emissions. A ‘with measures’ scenario can then be inferred from the difference between the two sets of data.
Confidence assessmentInformation in this chapter is sourced from the most recent studies available. Most of the studies involve the application of models. The approach, assumptions and input data for such works are documented in the cited references and they are not repeated here except for illustrative purposes. However, a small part of the required data has had to be generated from scratch; in these cases, less sophisticated approaches have been adopted.
Each model approach has its inherent degree of error due to a range of factors such as simplifying assumptions, limited availability of current data and the algorithms used. The output from each model therefore has an error range which is often difficult to define, although in some cases sensitivity analyses provide an indication of the magnitude of errors. The situation is often compounded by the fact that
69
Projections and impacts of measures
a scenario can also be simulated by another model using quite different methodology, for example, the ‘bottom up’ and ‘top down’ approaches for energy analyses. The availability of more than one model will result in different outcomes. The range of those outcomes (quite apart from their respective error range) can be quite significant.
Considering the current state of knowledge, the most useful way to interpret the numerical values quoted in this chapter is to obtain an appreciation of the order of magnitude of the issues. That is, to draw out their qualitative inferences rather than to apply a rigorous mathematical analysis.
Apart from the need to take into account the limitations of models and to reconcile the use of different methodologies, the piecing together of a national picture necessarily involves the integration of a variety of work which cannot be expected to be uniform in their basic data. For example, several investigators have worked on the basis of earlier drafts of the inventory of greenhouse gas emissions and sinks than that of Chapter 3. Reconciliation is necessary to reduce the starting point of the various works to a common basis.
A systematic, objective approach has been adopted in this consolidation task. Inevitably, in some cases it has been necessary to apply value judgements Nevertheless, this chapter represents the best efforts made to date in compiling Australia’s greenhouse gas emission trends and the effects of measures taken to date.
70
Carbon dioxide
Carbon dioxide emissions and sinks are dealt with under three main sectors: energy, biosphere and industry.
EnergyThe energy sector is considered under two sub-categories:
• emissions from mobile sources, and
• emissions from stationary sources which include combustion activities as well as the production, storage and transportation of energy.
‘No measures’ projections
Stationary sources
Two major recent reports on future emissions from the energy sector are:
• Energy demand and supply projections, Australia, 1992–93 to 2004–05 [1]
• Reductions in Greenhouse Gas Emissions from the Australian Energy System: A Report on Modelling Experiments Using ABARE’s MENSA Model [2].
The first study uses a long-standing methodology involving a mix of ‘top down’ and ‘bottom up’ approaches. It projects that carbon dioxide emissions from stationary sources over the ten year period to the financial year 1999–2000 would grow by 54.5 million tonnes, that is, by some 25 per cent. This study was published in early 1993 and since then new information has become available. For example, a new population projection has been
Projections and impacts of measures
6
released which projects lower population growth in Australia. Wilkenfeld [3] reviewed the Australian Bureau of Agricultural and Resource Economics projections [1] and found that, had such recent information been taken into account, the study would have indicated emission growth of 44.5 million tonnes from stationary sources over the period in question, under a ‘no measures’ scenario.
The MENSA study [2] incorporates the most recent revised set of data, particularly in the domestic energy sector. MENSA adopts a ‘bottom up’ approach and it assumes perfect information and foresight for energy consumers and suppliers in their choice of options to satisfy their energy service demands at minimum cost.
MENSA is not a forecasting model but MENSA simulations can be used to provide bounds to estimates of the potential for measures to reduce emissions. In this study [2], various scenarios were compared using specific assumptions about the adoption of efficient technologies and increases in underlying efficiency. In this way MENSA can assist in evaluating potential changes to ‘business as usual’ projections.
It has been suggested that an estimate of increase in carbon dioxide emissions under a ‘without measures’ scenario can be made from this MENSA study. Using this approach, this increase over the decade to the year 2000 has been estimated to be 44.1 million tonnes.
In light of the discussion above on the interpretation of multiple results from different model approaches, to facilitate presentation and to avoid undue difficulties in having to deal with ranges in every sector, a single estimate of 50 million tonnes of growth (without measures) has been adopted for the stationary sources energy sector. A similar approach is adopted in other parts
of this chapter where multiple values are available.
Adding the increase to the 1990 values of Chapter 3 gives the projected emissions shown in Table 6.1.
Transport
For this sector, the work of the Bureau of Transport and Communications Economics has been used as the primary source of information [4].
Each of the transport modes has its specific emission and demand characteristics. Accordingly, a separate model is used by the Bureau of Transport and Communications Economics for the projection for changes in greenhouse gas emissions for each of the six categories: cars, buses, road freight, aviation (domestic only), rail, and shipping (coastal shipping only).
The models take into account expected changes in population, service demand, flow of new and hence different fuel consumption vehicles through the fleet, scrappage rates of older vehicles, and other relevant parameters to arrive at an estimate of fuel consumption in the year 2000. The forecast consumption of the various fuels are then used to compile the corresponding greenhouse gas emissions. The models and their assumptions, approaches and input parameters are documented in detail in Transport Emissions to 2015 [4].
Figures 6.1 and 6.2 show the general trend in emissions from the transport sector under ‘no measures’ scenarios. The graphs show that emissions from trucks will overtake those from cars by early next century and that emissions from aviation are also expected to continue to climb over the next few decades.
Table 6.1 shows that emissions of carbon dioxide from the transport sector are forecast to be 68.8 million tonnes in the year 2000, in the absence of greenhouse measures.
71
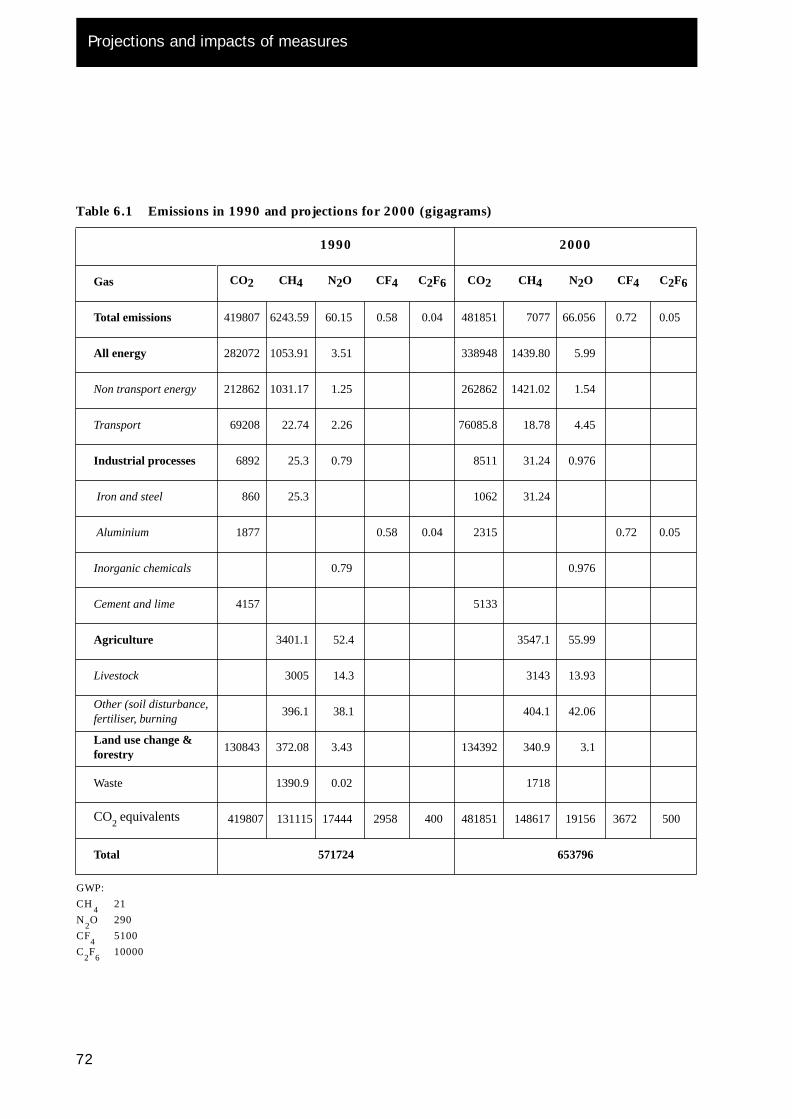
Projections and impacts of measures
72
Table 6.1 Emissions in 1990 and projections for 2000 (gigagrams)
1990 2000
Gas CO2 CH4 N2O CF4 C2F6 CO2 CH4 N2O CF4 C2F6
Total emissions
419807 6243.59 60.15 0.58 0.04 481851 7077 66.056 0.72 0.05
All energy
282072 1053.91 3.51 338948 1439.80 5.99
Non transport energy
212862 1031.17 1.25 262862 1421.02 1.54
Transport
69208 22.74 2.26 76085.8 18.78 4.45
Industrial processes
6892 25.3 0.79 8511 31.24 0.976
Iron and steel
860 25.3 1062 31.24
Aluminium
1877 0.58 0.04 2315 0.72 0.05
Inorganic chemicals
0.79 0.976
Cement and lime
4157 5133
Agriculture
3401.1 52.4 3547.1 55.99
Livestock
3005 14.3 3143 13.93
Other (soil disturbance, fertiliser, burning
396.1 38.1 404.1 42.06
Land use change & forestry
130843 372.08 3.43 134392 340.9 3.1
Waste 1390.9 0.02 1718
CO
2
equivalents
419807 131115 17444 2958 400 481851 148617 19156 3672 500
Total 571724 653796
GWP:CH
4
21N
2
O 290CF
4
5100C
2
F
6
10000
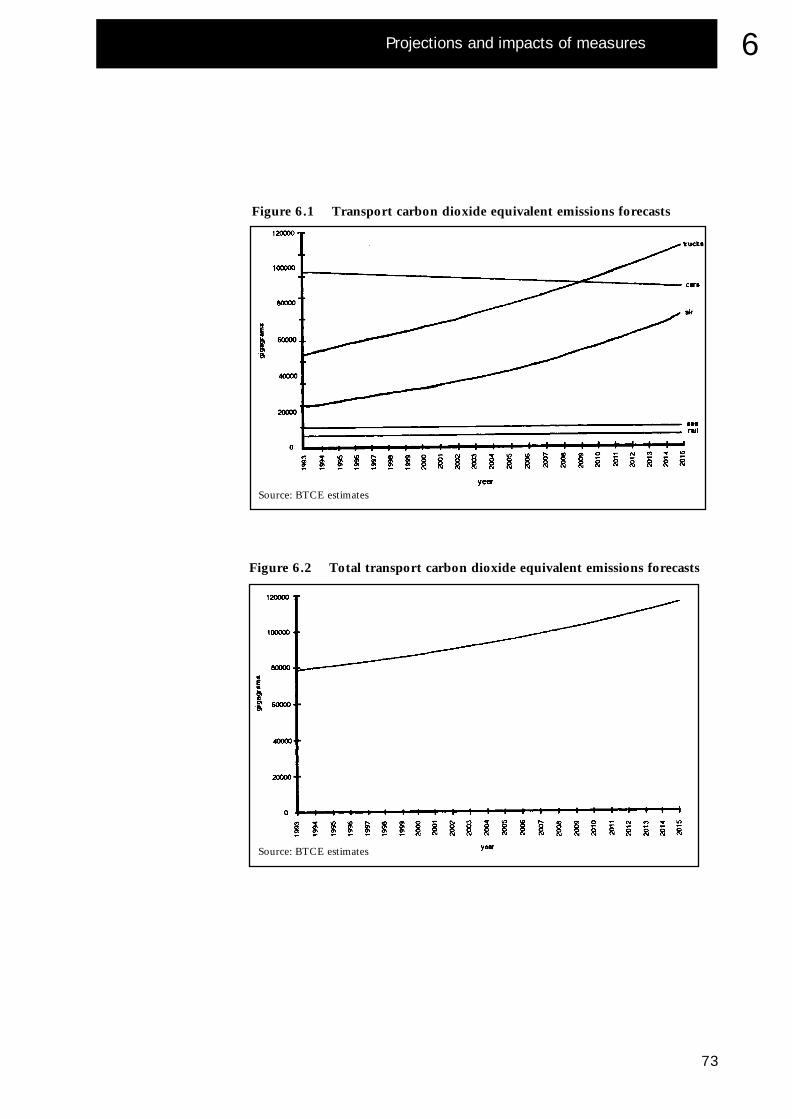
Projections and impacts of measures
73
6
Figure 6.1 Transport carbon dioxide equivalent emissions forecasts
Source: BTCE estimates
Figure 6.2 Total transport carbon dioxide equivalent emissions forecasts
Source: BTCE estimates
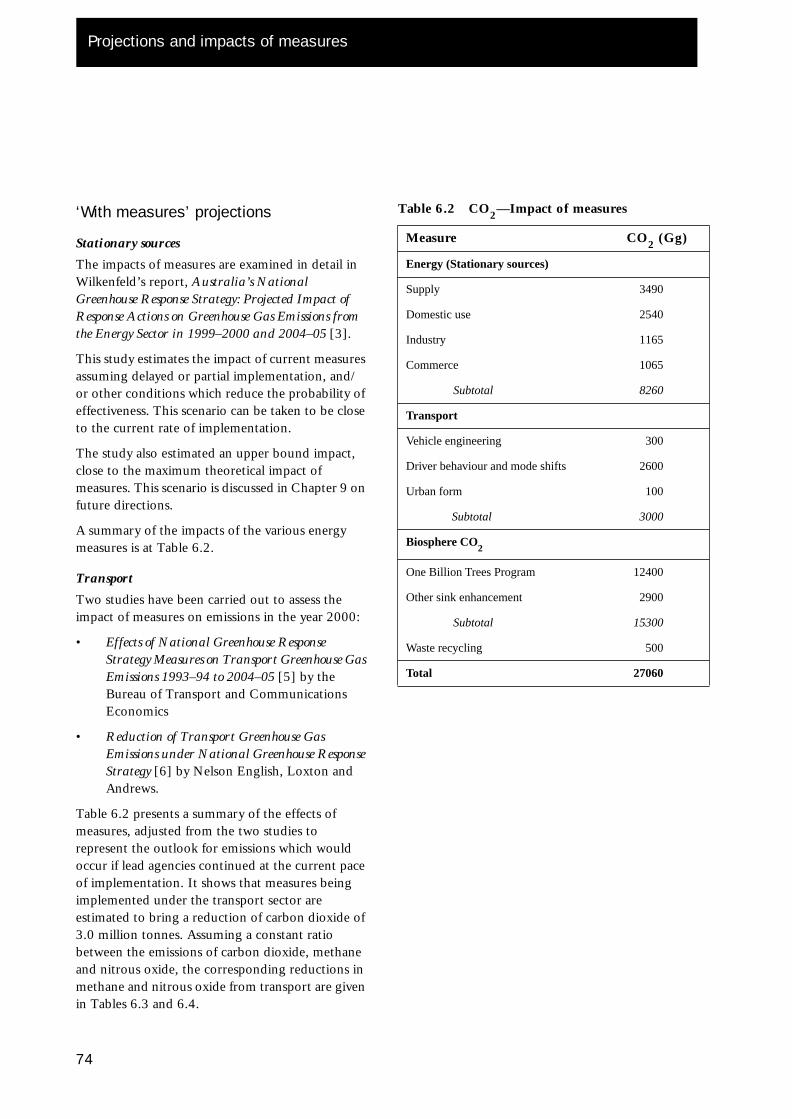
Projections and impacts of measures
Table 6.2 CO
2
—Impact of measures
Measure CO
2
(Gg)
Energy (Stationary sources)
Supply 3490
Domestic use 2540
Industry 1165
Commerce 1065
Subtotal 8260
Transport
Vehicle engineering 300
Driver behaviour and mode shifts 2600
Urban form 100
Subtotal 3000
Biosphere CO
2
One Billion Trees Program 12400
Other sink enhancement 2900
Subtotal 15300
Waste recycling 500
Total 27060
‘With measures’ projections
Stationary sources
The impacts of measures are examined in detail in Wilkenfeld’s report, Australia’s National Greenhouse Response Strategy: Projected Impact of Response Actions on Greenhouse Gas Emissions from the Energy Sector in 1999–2000 and 2004–05 [3].
This study estimates the impact of current measures assuming delayed or partial implementation, and/or other conditions which reduce the probability of effectiveness. This scenario can be taken to be close to the current rate of implementation.
The study also estimated an upper bound impact, close to the maximum theoretical impact of measures. This scenario is discussed in Chapter 9 on future directions.
A summary of the impacts of the various energy measures is at Table 6.2.
Transport
Two studies have been carried out to assess the impact of measures on emissions in the year 2000:
• Effects of National Greenhouse Response Strategy Measures on Transport Greenhouse Gas Emissions 1993–94 to 2004–05 [5] by the Bureau of Transport and Communications Economics
• Reduction of Transport Greenhouse Gas Emissions under National Greenhouse Response Strategy [6] by Nelson English, Loxton and Andrews.
Table 6.2 presents a summary of the effects of measures, adjusted from the two studies to represent the outlook for emissions which would occur if lead agencies continued at the current pace of implementation. It shows that measures being implemented under the transport sector are estimated to bring a reduction of carbon dioxide of 3.0 million tonnes. Assuming a constant ratio between the emissions of carbon dioxide, methane and nitrous oxide, the corresponding reductions in methane and nitrous oxide from transport are given in Tables 6.3 and 6.4.
74
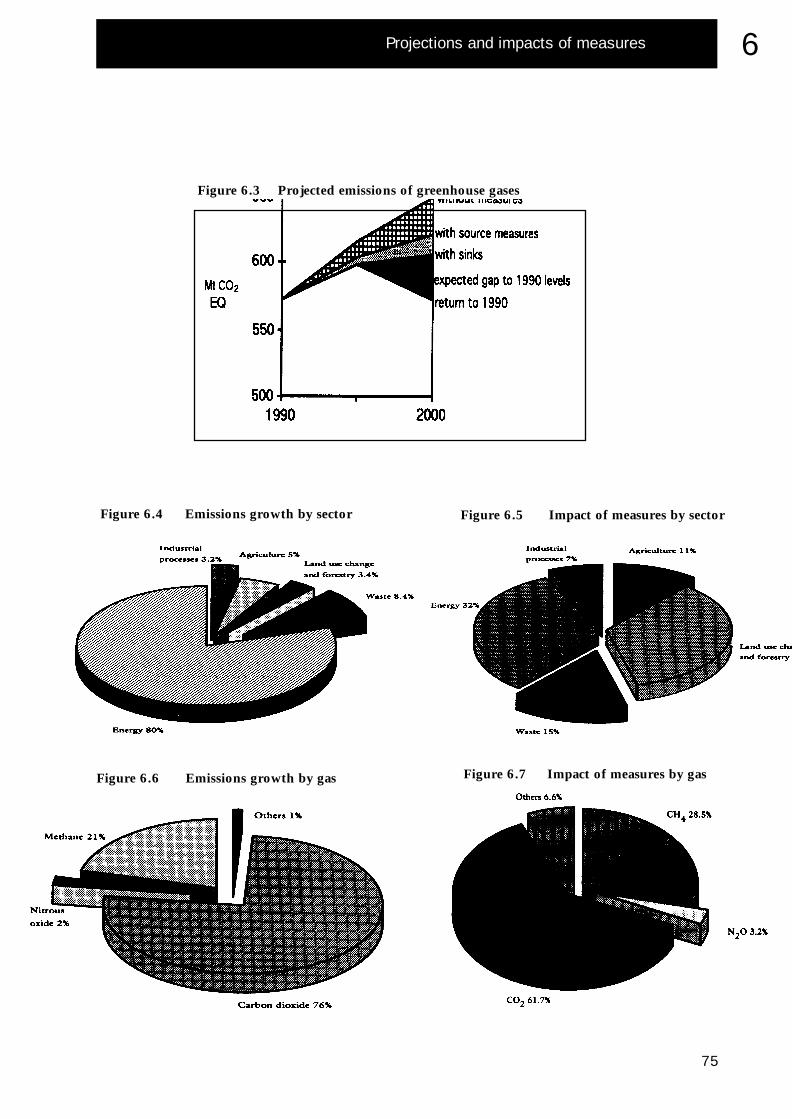
Projections and impacts of measures
75
6
Figure 6.3 Projected emissions of greenhouse gases
Figure 6.4 Emissions growth by sector Figure 6.5 Impact of measures by sector
Figure 6.6 Emissions growth by gas Figure 6.7 Impact of measures by gas

Projections and impacts of measures
7
Table 6.3 Methane—Impact of measures
Measure CH
4
(Gg)
Energy sector (Stationary) 118
Transport 1
Biosphere 3
Livestock 175
Waste Minimisation Strategy 300
Total 597
(Mt CO
2
equivalent) 12.54
Table 6.4 Nitrous oxide—Impacts of measures
Measure N
2
O (Gg)
Agricultural soils 4.65
Energy (non-leakage) 0.13
Transport 0.20
Total 4.98
(Mt CO
2
equivalent) 1.444
Biosphere
‘No measures’ projections
As the inventory in Chapter 3 shows, managed forests and grassland conversion (pasture improvement) activities in Australia were sinks for carbon dioxide in 1990. However, the land use and forestry sector as a whole was a net source due to large amounts of emissions from land clearing activities. This general picture is expected to be maintained, according to the projections prepared by the Expert Working Group on Carbon Dioxide Emissions from the Biosphere [7]. This expert group, which was also responsible for developing an Australian inventory methodology and compiling an inventory for this sector, comprised members from government, research institutes, industry and conservation groups with an expertise in the specific area. Expert groups of similar composition were also established for other areas, as described in Chapter 3.
Without measures, activity levels are projected to remain at similar levels over the period 1990 to 2000. Thus net emissions of carbon dioxide from the land use and forestry sector are forecast to change only slightly from 131 million tonnes in 1990 to 134 million tonnes by the year 2000 (Table 6.1). The change is mainly due to a projected slight reduction in sink capacities. Note that these numerical estimates are both subject to the large uncertainties discussed in Chapter 3.
‘With measures’ projections
A summary of the estimates of impacts of measures in the report Effect of Various Greenhouse Response Strategies on Carbon Dioxide Emissions associated with Agriculture and Forestry in Australia [8] is at Table 6.2. The reduction in net carbon dioxide emissions due to the application of the measures is expected to be 15.3 million tonnes, though there are uncertainties associated with this estimate.
The measure with the largest impact is the One Billion Trees program, which is expected to add some 12.4 million tonnes annually to Australia’s carbon dioxide sinks.
6
Another of the measures outlined in Chapter 4 is improved soil management through reduced tillage techniques, stubble retention, use of rotation involving widely separated species to assist weed control and no unnecessary tillage. The assessment takes into consideration limitations on such practices due to soil characteristics and seasonal rain patterns.
Plantation expansion is expected to be mainly achieved in the hardwood areas. Wastepaper recycling capacity is expected to rise from 28 per cent in 1990 to 55 per cent by the year 2000. However, any increase above this level is considered to be difficult to achieve due to economic and technical constraints.
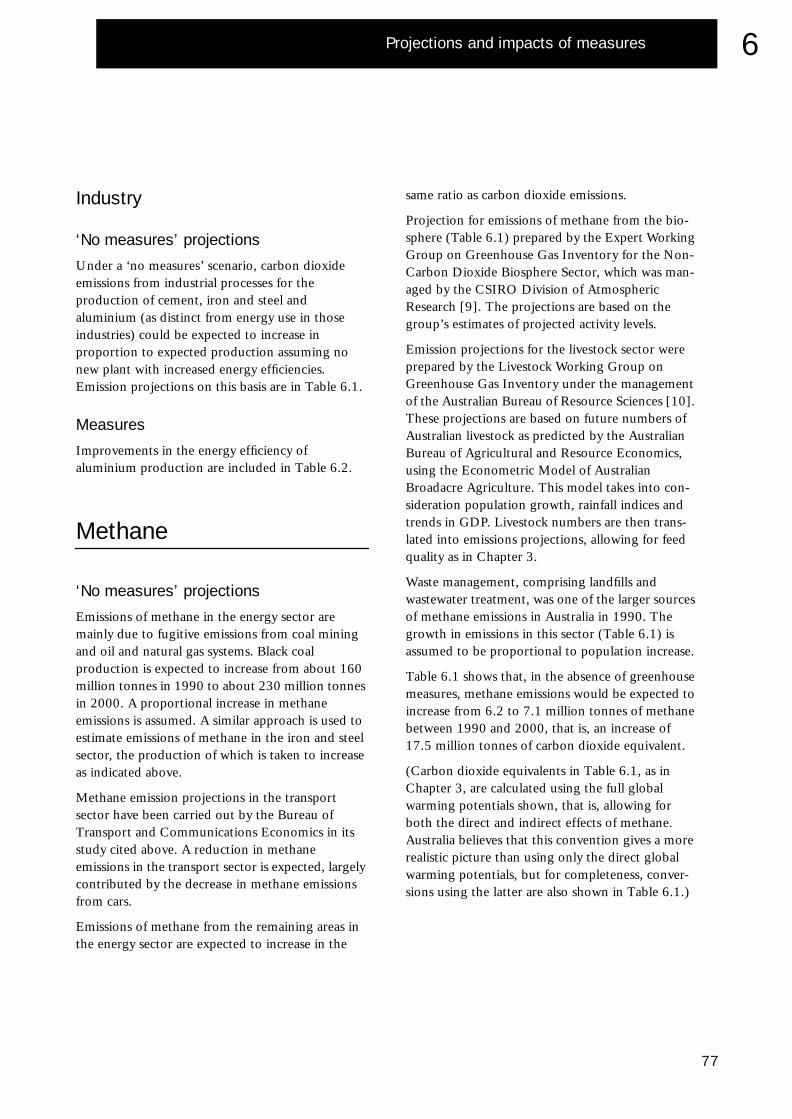
Projections and impacts of measures
6
Industry
‘No measures’ projections
Under a ‘no measures’ scenario, carbon dioxide emissions from industrial processes for the production of cement, iron and steel and aluminium (as distinct from energy use in those industries) could be expected to increase in proportion to expected production assuming no new plant with increased energy efficiencies. Emission projections on this basis are in Table 6.1.
Measures
Improvements in the energy efficiency of aluminium production are included in Table 6.2.
Methane
‘No measures’ projections
Emissions of methane in the energy sector are mainly due to fugitive emissions from coal mining and oil and natural gas systems. Black coal production is expected to increase from about 160 million tonnes in 1990 to about 230 million tonnes in 2000. A proportional increase in methane emissions is assumed. A similar approach is used to estimate emissions of methane in the iron and steel sector, the production of which is taken to increase as indicated above.
Methane emission projections in the transport sector have been carried out by the Bureau of Transport and Communications Economics in its study cited above. A reduction in methane emissions in the transport sector is expected, largely contributed by the decrease in methane emissions from cars.
Emissions of methane from the remaining areas in the energy sector are expected to increase in the
same ratio as carbon dioxide emissions.
Projection for emissions of methane from the bio-sphere (Table 6.1) prepared by the Expert Working Group on Greenhouse Gas Inventory for the Non-Carbon Dioxide Biosphere Sector, which was man-aged by the CSIRO Division of Atmospheric Research [9]. The projections are based on the group’s estimates of projected activity levels.
Emission projections for the livestock sector were prepared by the Livestock Working Group on Greenhouse Gas Inventory under the management of the Australian Bureau of Resource Sciences [10]. These projections are based on future numbers of Australian livestock as predicted by the Australian Bureau of Agricultural and Resource Economics, using the Econometric Model of Australian Broadacre Agriculture. This model takes into con-sideration population growth, rainfall indices and trends in GDP. Livestock numbers are then trans-lated into emissions projections, allowing for feed quality as in Chapter 3.
Waste management, comprising landfills and wastewater treatment, was one of the larger sources of methane emissions in Australia in 1990. The growth in emissions in this sector (Table 6.1) is assumed to be proportional to population increase.
Table 6.1 shows that, in the absence of greenhouse measures, methane emissions would be expected to increase from 6.2 to 7.1 million tonnes of methane between 1990 and 2000, that is, an increase of 17.5 million tonnes of carbon dioxide equivalent.
(Carbon dioxide equivalents in Table 6.1, as in Chapter 3, are calculated using the full global warming potentials shown, that is, allowing for both the direct and indirect effects of methane. Australia believes that this convention gives a more realistic picture than using only the direct global warming potentials, but for completeness, conver-sions using the latter are also shown in Table 6.1.)
77
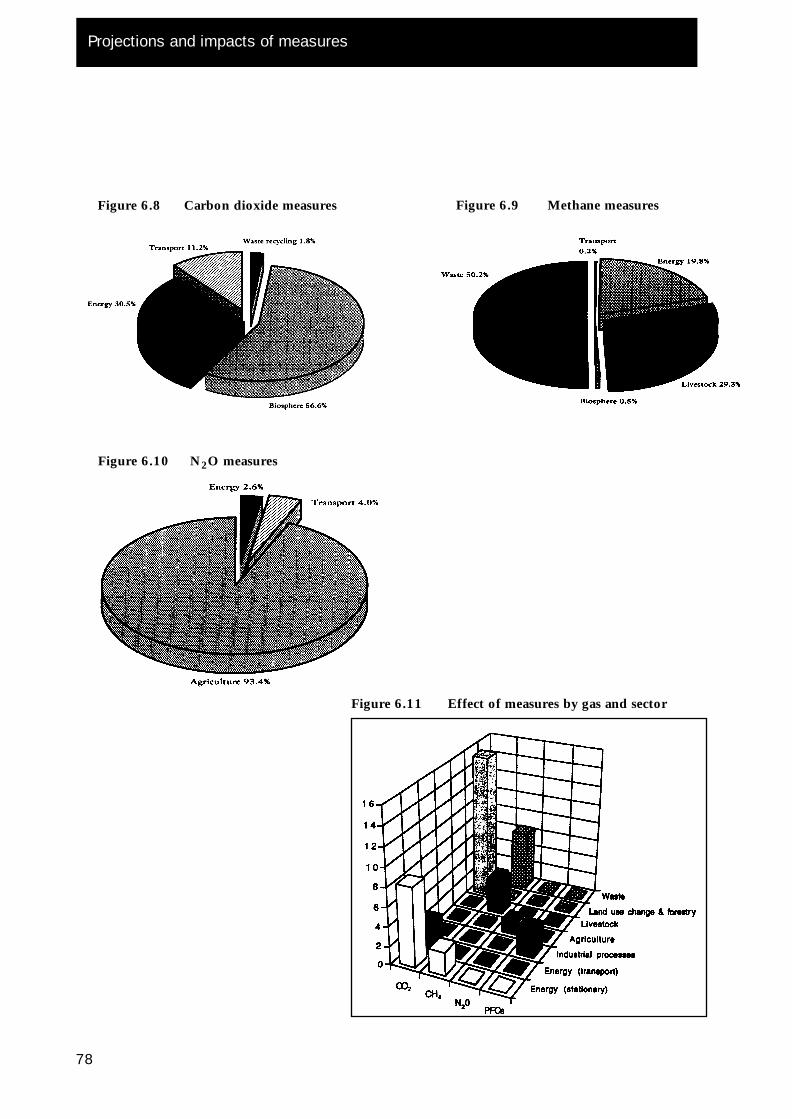
Projections and impacts of measures
78
Figure 6.8 Carbon dioxide measures Figure 6.9 Methane measures
Figure 6.10 N
2
O measures
Figure 6.11 Effect of measures by gas and sector
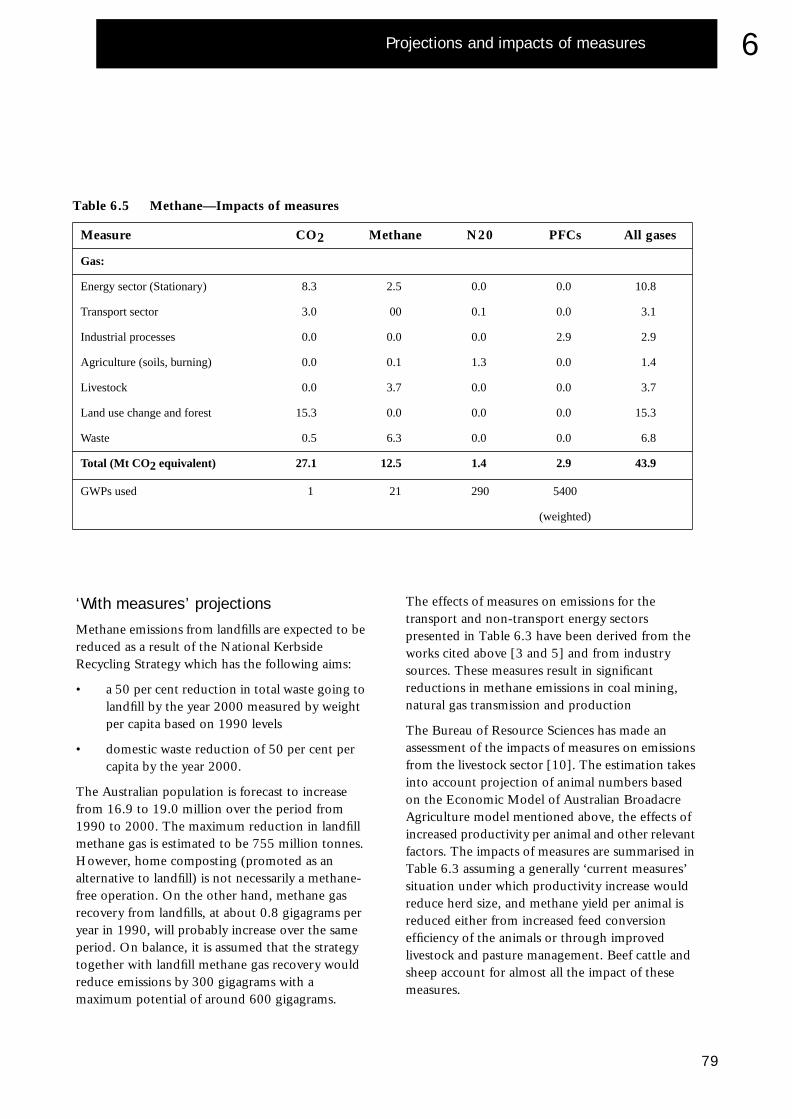
Projections and impacts of measures
6
Table 6.5 Methane—Impacts of measures
Measure CO2 Methane N20 PFCs All gases
Gas:
Energy sector (Stationary) 8.3 2.5 0.0 0.0 10.8
Transport sector 3.0 00 0.1 0.0 3.1
Industrial processes 0.0 0.0 0.0 2.9 2.9
Agriculture (soils, burning) 0.0 0.1 1.3 0.0 1.4
Livestock 0.0 3.7 0.0 0.0 3.7
Land use change and forest 15.3 0.0 0.0 0.0 15.3
Waste 0.5 6.3 0.0 0.0 6.8
Total (Mt CO 2 equivalent) 27.1 12.5 1.4 2.9 43.9
GWPs used 1 21 290 5400
(weighted)
‘With measures’ projections
Methane emissions from landfills are expected to be reduced as a result of the National Kerbside Recycling Strategy which has the following aims:
• a 50 per cent reduction in total waste going to landfill by the year 2000 measured by weight per capita based on 1990 levels
• domestic waste reduction of 50 per cent per capita by the year 2000.
The Australian population is forecast to increase from 16.9 to 19.0 million over the period from 1990 to 2000. The maximum reduction in landfill methane gas is estimated to be 755 million tonnes. However, home composting (promoted as an alternative to landfill) is not necessarily a methane-free operation. On the other hand, methane gas recovery from landfills, at about 0.8 gigagrams per year in 1990, will probably increase over the same period. On balance, it is assumed that the strategy together with landfill methane gas recovery would reduce emissions by 300 gigagrams with a maximum potential of around 600 gigagrams.
The effects of measures on emissions for the transport and non-transport energy sectors presented in Table 6.3 have been derived from the works cited above [3 and 5] and from industry sources. These measures result in significant reductions in methane emissions in coal mining, natural gas transmission and production
The Bureau of Resource Sciences has made an assessment of the impacts of measures on emissions from the livestock sector [10]. The estimation takes into account projection of animal numbers based on the Economic Model of Australian Broadacre Agriculture model mentioned above, the effects of increased productivity per animal and other relevant factors. The impacts of measures are summarised in Table 6.3 assuming a generally ‘current measures’ situation under which productivity increase would reduce herd size, and methane yield per animal is reduced either from increased feed conversion efficiency of the animals or through improved livestock and pasture management. Beef cattle and sheep account for almost all the impact of these measures.
79
Projections and impacts of measures
The Commonwealth Scientific and Industrial Research Organisation Division of Atmospheric Research has reported on its assessment of the effects of measures on methane emissions from the biosphere [9]. The results are in Table 6.3. Measures are assumed to be implemented at the present rate with no new emission reduction technology introduced.
Nitrous oxide
‘No measures’ projections
Nitrous oxide emission projections were developed in conjunction with those for carbon dioxide and methane for the biosphere [9], transport [4] and the livestock sectors [10] for the year 2000. Emissions in other areas are relatively small and are assumed to increase in proportion to increases in carbon dioxide emissions in the energy sector. All projections are summarised in Table 6.1.
‘With measures’ projections
The impact on emissions of measures in the biosphere [9], transport [5] and livestock sectors [10] are summarised in Table 6.4. All are small in terms of carbon dioxide equivalents; the biggest impact is on emissions from agricultural soils.
Perfluorocarbons
‘No measures’ projections
Emissions of perfluorocarbons from aluminium production are assumed, in the absence of meas-ures, to be proportional to aluminium production. Production is projected to increase from 1.23 mil-lion tonnes of aluminium in 1990 to 1.60 million tonnes in 2000. Perfluorocarbon emissions would thus increase from 3.3 to 4.4 million tonnes of car-bon dioxide equivalent, as indicated in Table 6.1.
(Note that although the ratios of all the figures quoted here for perfluorocarbon emissions are rea-sonably reliable, the absolute values depend on an emission coefficient 0.47 which is uncertain by plus or minus 50 per cent.)
‘With measures’ projections
Modifications to aluminium processing operations have reduced these emissions per tonne of aluminium by almost two-thirds since 1990, according to the Commonwealth Scientific and Industrial Research Organisation Division of Atmospheric Research. Making the conservative assumption that no further process improvements are introduced, these measures will reduce projected emissions in 2000 from 4.4 million tonnes of carbon dioxide equivalent to 1.5 million tonnes, a saving of 2.9 million tonnes of carbon dioxide equivalent.
ConclusionTable 6.1 summarises the inventory for 1990 and the projected emissions for 2000 under a ‘no measures’ scenario. It shows that a reduction of 82 million tonnes of carbon dioxide equivalent is required to reduce greenhouse gas emissions in 2000 to their 1990 levels (see also Figure 6.3).
The effects of measures for reducing emissions and for the enhancement of sinks are summarised in carbon dioxide equivalents in Table 6.5 and Figure 6.4. In accordance with Australia’s comprehensive approach to greenhouse response, the measures are spread across all gases and sectors, and cover both sources and sinks. If existing measures continue at the current rate of implementation and if there are no further measures, emissions for the year 2000 are expected to increase to 38 million tonnes carbon dioxide equivalent above the 1990 level, as indicated in Figure 6.3.
80
Projections and impacts of measures
6
References[1] Bush, S., Leonard, M., Bowen, B., Jones, B., Donaldson, K. and Ho Trieu, L. (1993) Energy Demand and Supply Projections, Australia, 1992–93 to 2004–05, Australian Bureau of Agricultural and Resource Economics, Canberra, Australia.
[2] Naughten, B., Pakravan, P., Dlugosv, J. and Dickson, A (1994) Reductions in Greenhouse Gas Emissions from the Australian Energy System: A Report on Modelling Experiments using ABARE’s MENSA Model, undertaken for Department of the Environment, Sport and Territories, Australian Bureau of Agricultural and Resource Economics, Canberra, Australia.
[3] Wilkenfeld, G. (1994) Australia’s National Greenhouse Response Strategy: Projected Impact of Response Actions on Greenhouse Gas Emissions from the Energy Sector in 1999–2000 and 2004–05, Department of the Environment, Sport and Territories, Canberra, Australia.
[4] Bureau of Transport and Communications Economics (1994) Transport Emissions to 2015, Report to the Department of the Environment Sport and Territories, Canberra, Australia.
[5] Bureau of Transport and Communications Economics (1994) Effects of National Greenhouse Response Strategy Measures on Transport Greenhouse Gas Emissions 1993–94 to 2004–05, Department of the Environment, Sport and Territories, Canberra, Australia.
[6] Nelson English, Loxton & Andrews (1994) Reduction of Transport Greenhouse Gas Emissions under National Greenhouse Response Strategy, Department of the Environment, Sport and Territories, Canberra, Australia.
[7] National Greenhouse Gas Inventory Committee (1994) Australian Greenhouse Gas Inventory: Projections for 2000, Australian Inventory for the Estimation of Greenhouse Gas Emissions: Carbon Dioxide from the Biosphere, Canberra, Australia.
[8] Lloyd, J. (1994) Effect of Various Greenhouse Response Strategies on Carbon Dioxide Emissions associated with Agriculture and Forestry in Australia, Environmental Biology Group, Australian National University, Department of the Environment, Sport and Territories, Canberra, Australia.
[9] Division of Atmospheric Research, CSIRO (1994) Projections of Non-Carbon Dioxide Greenhouse Gas Emissions from the Biosphere Melbourne, Australia.
[10] Howden, S., (1994) Estimation of the Impact of Response Actions listed in the NGRS on Emissions from the Australian Livestock Industry. Canberra, Australia.Emissions projections for the livestock sector were prepared by the Livestock Working Group on Greenhouse Gas Inventory under the management of the Australian Bureau of Resource Sciences.
[11] Bureau of Resource Sciences, (1994) Estimations of the impact of Response Actions listed in the National Greenhouse Response Strategy on Emissions from the Australian Livestock Industries, Canberra, Australia.The Bureau of Resource Sciences has made an assessment of the impacts of measures on emissions from the livestock sector.
[13] Division of Atmospheric Research, CSIRO (1994) Impact of the National Greenhouse Response Strategy and Other Measures on Non-Carbon Dioxide Emissions from the Biosphere in the year 1999–2000, Melbourne, Australia.The CSIRO Division of Atmospheric Research has reported on its assessment of measures on methane emissions from the biosphere.
81

Projections and impacts of measures
82
7
Chapter Seven
Research, development and observation on climate change
A key element of Australia’s response to climate change is to improve our scientific and socio-economic knowledge and understanding of climate change, and the potential impacts of climate change and response options. To best advance this important goal, Australia has adopted a broad approach which includes the following strategies:
• achieve and maintain adequate national climate and sea-level monitoring, analysis and databank facilities
• undertake research directed towards understanding and assessing climate and climate change processes, mechanisms for sources and sinks of greenhouse gases, and the potential national and regional impacts of climate change
• conduct sound economic modelling and related studies to assess the costs and benefits of climate change response measures
• cooperate and collaborate with international activities in monitoring, research, modelling, training and impacts studies.
IntroductionThere is growing evidence that human activity is leading to increased atmospheric concentrations of greenhouse gases and enhanced global warming. The potential impacts of global warming may include, among other things, rising sea levels and changed rainfall patterns. However, there are still many uncertainties surrounding our knowledge of the potential impacts of climate change.
The Framework Convention on Climate Change recognises the importance of reducing scientific uncertainty and increasing understanding of the causes, effects, magnitude and timing of climate change and requires Parties to promote and cooperate in efforts to achieve a better understanding of anthropogenic climate change.
Australia’s national science approachAustralia also recognises the importance of climate change research and systematic observations. The National Greenhouse Response Strategy has as one of its objectives that there should be a focus on scientific activities that:
obtain a better understanding of the timing, magnitude and regional patterns of climate change, and provide a sound scientific basis for planning response measures.
This objective provides the overall parameters for Australia’s scientific research.
National Greenhouse Advisory Committee
The Federal Government established the National Greenhouse Advisory Committee in 1989, with a membership including some of Australia’s pre-eminent climate change scientific researchers and other relevant experts. The committee provides expert advice on greenhouse issues, research priorities, international greenhouse activities, and promotes the dissemination of authoritative information on climate change to the public.
83
Research, development and observation on climate change
Australian research
Australian scientists, particularly in the Commonwealth Scientific and Industrial Research Organisation, the Bureau of Meteorology and the universities, have been active in climate change research (including research into climate and climate variability) for several decades.
Research programs
Core Research Program
In 1989, the Federal Government began funding a Core (climate change) Research Program and in 1990 extended it for a further three years. The program builds on many years of established research into climate and the greenhouse effect. It aims to investigate many of the fundamental aspects of climate change.
The Core Research Program is conducted by the Commonwealth Scientific and Industrial Research Organisation, the Bureau of Meteorology and the National Tidal Facility. These organisations provide significant additional funds from their own resources to complement the core climate change work. State governments and authorities have also supported work aimed at developing better regional scenarios. The main focus of the Core Research Program is:
• expansion of the modelling of the climate system, including improving the modelling capabilities of the Commonwealth Scientific and Industrial Research Organisation and the Bureau of Meteorology
• research into important regional climate change processes, including investigation of sources and sinks of greenhouse gases, poleward transport of heat by oceans, interactions among the hydrologic system, the atmosphere and earth surface characteristics, extreme events (storms, cyclones), and sea-level rise
• monitoring of the climate system to identify special regional characteristics, including analysis of greenhouse gases trapped in
Antarctic ice cores, measurement of the thermal structure of oceans around Australia and the use of satellites to monitor characteristics of the physical environment
• establishment and maintenance of sea-level monitoring stations at appropriate sites around Australia
• examination of the response of plants to increased carbon dioxide and ground water availability under different climate scenarios.
National Energy Management Program
These programs include a range of studies to improve energy efficiency covering all major energy-using sectors—industry, commerce, transport, commercial and residential buildings, use of energy in households, and the Commonwealth’s own use of energy.
The following are sub-programs under the National Energy Management Program.
Residential
A review of the industry-sponsored gas appliance labelling program is nearing completion.
A review of the standards of performance and methods-of-test of energy consumption for major electrical appliances is well advanced.
A study to determine the most effective ways of improving energy efficiency in existing dwellings will be commissioned shortly for subsequent consideration by governments.
A National Appliance Energy Efficiency Advisory Panel (comprising industry, importing, utility, consumer and standard-setting interests) continues to provide valuable advice to governments on appliance energy efficiency issues.
A review of existing energy information programs directed at community needs will be finalised shortly and will provide a useful input to efforts in coordination of communication components between governments.
84
Research, development and observation on climate change
7
The Commonwealth has commissioned the preparation of an energy efficient site planning handbook, the primary audience for which will be the people and organisations involved in the planning of residential blocks and the positioning of residences on them.
Industrial and commercial
Following completion of technical and economic studies and consultations with major industry and professional interests (the latter being facilitated by the formation of a National Advisory Panel), work is about to commence on the development of a draft national commercial buildings energy code. When completed in 1995, the draft code will be released for public comment and subsequently considered by governments.
A study has been commissioned into the collection and presentation of energy use data to prospective tenants and purchasers of commercial buildings, as well as related obligations for disclosure of the data.
Based on a study which identified opportunities for the development and implementation of energy labelling programs and energy performance standards for industrial and commercial equipment, governments agreed to proposals that further development in relation to electric motors, fluorescent lamp ballasts, office equipment and packaged air conditioners be considered.
A review of energy auditing and energy management training support programs will be completed shortly as a basis for review by governments and key industry organisations of the most effective means of providing these services on a longer term basis, and ways in which they can be used to encourage switching to cost-effective energy sources with low greenhouse gas emissions. The issue of whether subsidies under audit schemes should be tied to the uptake of cost-effective options is also being considered.
The Commonwealth Government is also actively encouraging investigations into the opportunities for addressing energy saving opportunities in
particular industries, coupled with the adoption of measures to effect improvements. Four studies are current.
Transport
A study of alternative forms of point-of-sale material (including labelling) relating to the fuel efficiency of new motor vehicles has been completed and the Commonwealth Government is consulting with the motor vehicle industry as a basis for the government’s consideration of appropriate measures.
In support of provision of accurate fuel consumption information for new cars and similar vehicles, the Commonwealth Government will shortly complete a program of verification of fuel consumption data provided by the industry. This data is used in an annual fuel consumption guide which provides comparative information to new car buyers to help them consider selection of the most fuel efficient vehicle suited to their needs.
The government has also recently commissioned a study to obtain an estimate of the in-service fuel consumption of passenger cars and their derivatives as a basis for comparison with the corresponding data obtained under laboratory conditions in accordance with the Australian Standard test. The study will help identify technology and other factors which influence the difference between test results and actual in-service fuel consumption.
Government
Within the Commonwealth sector, major initiatives have been taken to improve energy efficiency. Broadly, Commonwealth agencies are required to prepare and implement annual energy management plans and to report annually on progress and achievements. Training is provided to relevant officials to enable them to both plan for energy efficiency improvements and manage the implementation of measures.
In relation to buildings, steps have been taken to enhance access to energy consumption data. A
85
Research, development and observation on climate change
major program of energy audits of occupied buildings has been completed recently and a related energy efficiency advisory service will be implemented shortly to help agencies give effect to audit recommendations and other efficiency improvements. These measures will help agencies meet the target of reducing energy use in Commonwealth-occupied buildings by 15 per cent within five years and 25 per cent within 10 years (based on 1992–93 consumption).
In relation to vehicles, an energy audit of the Commonwealth vehicle fleet in 1992 provided the basis for concerted action to plan for fuel efficiency gains in the fleet. Since July 1993, fuel-inclusive lease arrangements ceased, and agencies are now required to pay the actual cost of the fuel they use. It is the responsibility of individual agencies to examine options to reduce total fleet fuel consumption, and improve energy efficiency. DASFLEET provides assistance to agencies through the provision of fuel monitoring reports (including fleet reviews covering size, composition and use) and information to assist in vehicle selection. Enhancement of access to reliable data has received considerable attention and has been supplemented by the introduction of driver training courses. The government is to further consider the removal of the fuel excise exemption currently applicable to Budget-funded agencies and review remuneration packages for relevant employees to promote fuel efficiency.
In support of provision of accurate fuel consumption information for new cars and similar vehicles, the Commonwealth Government is undertaking a program of verification of fuel consumption data provided by the industry. This data is used in an annual fuel consumption guide which provides comparative information to new car buyers to help them consider selection of the most fuel efficient vehicle suited to their needs.
The Government has also recently commissioned a study to obtain an estimate of the in-service fuel consumption of passenger cars and their derivatives as a basis for comparison with the corresponding data obtained under laboratory conditions in accordance with the Australian Standard test. The
study will help identify technology and other factors which influence the difference between test results and actual in-service fuel consumption.
Broad sector
A major study has been completed which has examined the feasibility and scope for developing an enhanced national energy-use database incorporating both energy consumption data and determinant (technical, economic and social) data by sector and by region. Consideration is currently being given to the many dimensions which the database may encompass, and priorities are to be established to enable further development to proceed.
The Commonwealth Government has supported the establishment of an integrated energy management centre in Hobart. The objective of the centre is to provide services and information to improve energy efficiency for a wide range of uses, irrespective of the type of energy involved.
Dedicated Research Program
A major task of the National Greenhouse Advisory Committee was to establish the Dedicated Greenhouse Research Grants Scheme. The scheme, which commenced in 1990–91, complements existing research in the Core Research Program and other existing grants schemes. There are three main areas of activity considered as priority activities for consideration of grants under this scheme. These are:
• increasing the understanding of the scientific processes which underlie climate change
• advancing understanding of the sensitivity of human activities and natural ecosystems to climate change
• developing effective mitigation and adaptation responses.
Impacts research
Australia has extensive experience in the development and operation of national, regional and local strategies for responding to the natural variability of its climate. These strategies include the
86
Research, development and observation on climate change
7
operation of surveillance and warning systems for fire, flood, storm and drought, and a range of other structural and non-structural disaster avoidance and post-disaster management systems.
However, research into ways of adapting to climate change is at an early stage, because of the current lack of precision in predicting the impacts of climate change. In order to better underpin adaptation policy, Australia attaches considerable importance to improving our understanding of the possible impacts of climate change. As a result, a growing body of research on impact assessment is being undertaken. Studies include:
• hydrology and water resources—estimates of the impacts on hydrology and water resources of changes to the climate and its variability. Because of Australia’s low rainfall, the impact of climate change and variability has a particularly significant effect on the availability of water resources
• agriculture—research into the impact of rainfall variability and drought irrigation, growth and management of rain-fed crops, livestock, horticulture, pastures and range, pests and diseases; and the economic impacts of rainfall variability on the agricultural sector
• forests—the development of a general forest model to quantify carbon fluxes and enable prediction of the impacts of climate change on forests, and a study of the effects of carbon dioxide concentrations on photosynthesis in tropical trees are being pursued
• natural ecosystems—including flora and fauna at the species and ecosystem scales, land cover, endangered species, native species distribution and abundance, and protection of nature conservation values
• coasts and marine environments—including coastal systems, inter-tidal areas, near-shore and offshore, coral reefs, fisheries, sediment transport, and vulnerability assessment techniques
• snow cover—modelling of the potential changes in snow cover in the Victorian Alps, simulated for best and worst case scenarios, taking into account the natural variability of snow falls in the area
• the impacts of changes in the frequency of extreme weather events, particularly drought, and changes in the frequency of extreme rainfall events
• human health—including research into heat stress, respiratory illness, infectious diseases, and demographic trends.
International, regional and bilateral research cooperationAustralian scientists are recognised internationally for their achievements in climate change research. They are substantial contributors to the work of the Intergovernmental Panel on Climate Change and they participate in research projects under the World Meteorological Organisation, the United Nations Environment Program (UNEP), the Intergovernmental Oceanographic Commission and the International Council of Scientific Unions.
The Intergovernmental Panel on Climate Change
Australian scientists played a substantial and effective role in the production of the First Assessment Report of the Intergovernmental Panel on Climate Change.
Australian climate models contributed to the supplementary report to the IPCC Scientific Assessment.
The important contribution of Australian scientists is also recognised in the production of the IPCC’s Special Report, now under way so that it can be presented to the First Conference of Parties to the Convention as well as to the Second Assessment Report. At least 12 Australian experts have accepted
87
Research, development and observation on climate change
invitations to be lead authors. Their contributions will cover issues of relevance to all areas of the Second Assessment Report.
Examples of other international activities
Australia hosts the international project office of the core International Geosphere–Biosphere Programme (IGBP) Project, Global Change and Terrestrial Ecosystems, which aims to predict the effects of changes in climate, atmospheric composition and land use on terrestrial ecosystems, including agricultural and production forestry systems, and to determine how these effects lead to feedbacks to the physical climate system.
Australia participates in the International Global Atmospheric Chemistry project, with particular emphasis in the East Asian–North Pacific Regional Study and the Deposition of Biogeochemically Important Trace Species project.
Australia is also undertaking activities that include:
• active involvement in the programs of the World Climate Research Program such as the World Ocean Circulation Experiment, the Tropical Ocean–Global Atmosphere program and the Global Energy and Water Cycle Experiment which aim to reduce the uncertainties in the ability to understand and predict the climate system
• participation in GAIM (a component of the IGBP) in developing a representation of the global terrestrial biosphere in a climate model to improve the usefulness of predictions about the potential impact of a doubling of atmospheric carbon dioxide
• research into the effects of enhanced carbon dioxide on the biosphere ranging from experimental studies on plants of agricultural importance to models of carbon sequestration by the biosphere on both continental and global scales
88
• participation in a tripartite agreement between Australia, the United Kingdom and New Zealand which focuses on investigations into the biological removal of atmospheric carbon dioxide, land-surface processes and hydrology, and on developing a high quality data set for the South-West Pacific region and the Southern Ocean.
More detailed information
Given space requirements, it is impossible to provide a complete picture of Australian climate change science activities. The following publications provide a comprehensive treatment of relevant activities: Climate Change Activities in Australia—1993; Climate Change—Projects 1993–94, the Commonwealth Scientific and Industrial Research Organisation Research Program; and Tomorrow’s Answer—A Report on Greenhouse Research, NGAC.
Greenhouse response options researchA wide range of studies on the effects of various response options to climate variability and change have been undertaken. Such studies include:
• in the energy sector, assessments of technology options for meeting greenhouse gas emission targets, for example assessing the efficiency of various methods of energy production and examining efficient energy use in a range of applications
• investigations of the costs and possibilities for reducing emissions from agriculture and assessments of the likely responses of various aspects of the agricultural sector to climate variation and change. Management strategies and policy options for sustainable irrigated agriculture have also been under consideration
Research, development and observation on climate change
7
• in the forestry sector, the use of trees as carbon sinks. Forestry faces a particular problem in responding to climate change and variability and associated changes in trade, costs and prices because of the slow growth of the crop and the uncertainties of future regional and local climates, making adaptive decisions difficult
• developing strategies to minimise public health problems which may possibly arise from climate change, based on studies to identify social groups and regions most vulnerable to climate and at high risk from climate change and variability
• the examination of the externalities of transport systems, the development of sustainable urban systems for the mitigation of greenhouse impacts and adaptation to climate change, and improving building designs to reduce energy consumption and to cope with tropical cyclones.
The Australian Bureau of Agricultural and Resource Economics is carrying out a number of research programs focused on greenhouse. The bureau’s MARKAL-MENSA model of the Australian energy system is being extensively developed. Projects completed using MENSA range from analyses of the benefits of gas and electricity interconnections to least-cost options in the transport sector. The bureau’s MENSA model has also been used in assessing the energy sector costs of meeting targets and timetables. The Australian Bureau of Agricultural and Resource Economics provides a lead in Australia’s contribution to international modelling work, examining the international trade and welfare effects of policies to address climate change. This has included the development of a multi-region, multi-commodity, computable general equilibrium model—MEGABARE.
Energy research, development and demonstration
Governments support energy research, development and demonstration, particularly on renewable energies and energy efficiency, including a flexible approach to industry support for pre-competitive research, development and demonstration. Annual expenditure on pre-competitive research, development and demonstration in 1990–91 was around A$108 million. Total energy-related research, development and demonstration was around A$218 million.
Governments fund a range of research organisations such as the Commonwealth Scientific and Industrial Research Organisation, universities and cooperative research centres. A number of research projects undertaken by these institutions relate to energy and greenhouse emissions.
Energy and transformation sector
Competitive or applied research, development and demonstration by industry has led to the adoption of a range of energy-related new technologies in the areas of fossil fuel extraction, electricity production and energy use.
Direct support is provided for non-coal energy research, development and demonstration through the Energy Research Development Corporation which was established in 1990. Projects funded include: thermal solar; photovoltaic solar cells; solar water heater systems, storage of solar energy and wind power, biomass and coal seam methane to generate electricity, hydro-electric power stations using existing water storage, and hybrid systems consisting of diesel generators, solar panels and batteries.
Australia participates in a number of International Energy Agency programs including as a member of the International Energy Agency Coal Research Organisation, which undertakes research into a wide range of issues, including coal technologies and greenhouse.
89
Research, development and observation on climate change
Research is being conducted into externalities in the energy sector, to better understand the full cost of energy service provision and national methodological issues involved in identifying and quantifying the externalities associated with particular energy technologies as well as the economic, environmental and social impacts of incorporating externalities into energy prices.
A study into the potential development of coal seam methane electricity generation has been undertaken. Funding has been provided for the coal seam methane drainage program of the Australian Cooperative Research Centre. Two coal companies in the Southern Sydney Basin are continuing to generate electricity from methane drained from coal seams.
The Electricity Supply Association of Australia promotes research relevant to the electricity supply industry. Research activities related to climate include measuring the economic impact of reducing greenhouse emissions, and model evaluation for climate assessment.
Transport—promoting technical innovation
The government is assisting increased efficiency (including fuel efficiency) in road transport through the promotion of technical innovation, for example Intelligent Vehicle Highway Systems. Intelligent Vehicle Highway Systems Australia, a body which also includes State and private (technology sector) representatives, is developing an Australian standard for these systems.
The Bureau of Transport and Communications Economics is undertaking a comprehensive analysis of the range of possible measures for reducing
90
greenhouse gas emissions in the transport sector. The bureau recently examined the costs to society of the use of alternative fuels and their economic viability. A more comprehensive analysis to identify the most socially and greenhouse cost-effective fuels is continuing.
There has also been a major study undertaken on Victorian transport externalities which identifies a number of ‘no regrets’ actions for the transport sector. There will be a further national study on transport externalities which will build and expand on the results of the Victorian study.
Industry
The Australian Bureau of Industry Economics has undertaken a number of studies into potential industry sector related greenhouse response measures. Some of the more recent studies include:
• a study entitled Energy Labelling and Standards for Industrial Motors: Implications for Energy Efficiency and Greenhouse Gas Emissions.—the study investigates the benefits and costs associated with such labelling
• a study into the impediments to increased use of cement extenders, in particular slag, in Australia. Cement extenders are materials that can be used to replace or supplement cement in concrete mixes. One of the major consequences of increased extender would be lower greenhouse gas emissions attributable to cement production.
The Australian Bureau of Agricultural and Resource Economics has completed studies on the economics of natural gas as a vehicle fuel.
Research, development and observation on climate change
7
Research and development
The Australian Government provides support for industry research and development, and although no specific areas are targeted, some of the work will result in more energy efficient industrial processes and technologies.
Tax concessions
Tax concessions up to 150 per cent for eligible expenditure incurred on research and development are available to firms when lodging corporate tax returns. Eligible research and development activities must involve innovation or technical risk.
Industry grants
Financial assistance is provided to firms undertaking market-driven research and development. It encourages research and development between industry and research organisations, and collaboration between technology developers and potential customers.
Agriculture sector
Governments have developed and transferred improved technology to enable the agricultural sector to improve productivity while tackling major forms of ecological degradation. A wide range of initiatives and research are under way in areas such as soil and nutrient management, plant breeding and agronomic research, grazing management, pasture budgeting and pasture improvement.
Recent studies completed by the Australian Bureau of Agricultural and Resource Economics include:
• Reducing Greenhouse Gas Emissions from the Agricultural Sector
• Survey of Landcare and Land Management Practices: 1992–93.
Socio-economic impacts of climate changeAustralia has undertaken a range of preliminary research activities to investigate the possible benefits and costs to Australia of the potential impacts of climate change, as well as the impacts of international and national responses. As part of the National Greenhouse Response Strategy, there is a continuing commitment to increasing our knowledge and understanding of the socio-economic impacts of climate change. Information on some of the activities to date is as follows.
• The Australian Industry Commission’s major report on the Costs and Benefits of Reducing Greenhouse Gas Emissions (1991), and as part of that work the commission has developed and refined some economic models. These models have been useful in the preparation of Australia’s National Greenhouse Response Strategy.
• The Australian Bureau of Agricultural and Resource Economics is involved in examining the likely impacts of greenhouse gas emissions policies at the sectoral level. One example of this sectoral approach is the bureau’s investigation into the Australian aluminium industry from a greenhouse perspective.
• The Bureau of Industry Economics has produced a paper, Comments on Various Estimates of the Costs of Meeting Greenhouse Gas Emission Targets. The paper critically examines four Australian and three overseas forecasting models dealing with the cost and impact of meeting greenhouse emission targets. The paper questions the GDP effects, provides a theoretical analysis of partial and general equilibrium modelling, and reviews various pitfalls which can arise when trying to estimate commercial costs.
91

Research, development and observation on climate change
92
8
Chapter Eight
Australian assistance todeveloping countries
Australia, along with other developed country Parties, has commitments under the Convention to provide new and additional resources to meet the incremental costs for developing countries of measures covered in Article 4.1, and the full costs of measures undertaken under Article 12.1 of the Convention. Australia also has a commitment to provide resources in accordance with Articles 4.4 and 4.5 of the Convention. Australia’s financial assistance to developing countries will be provided through the financial mechanism of the Convention, and through bilateral, regional and other multilateral channels.
IntroductionThe Australian Government, through the Australian International Development Assistance Bureau, as well as other departments and governmental agencies, encourages and provides support for activities in developing countries which are supportive of the Convention.
The overriding goal of the Australia Development Cooperation Program is to assist developing countries in their equitable and environmentally sustainable economic development. As part of this goal, we recognise that Australia will make an important contribution in assisting these countries to meet their commitments under the Convention, consistent with their national priorities.
All elements of the aid program will continue to be planned and implemented within a framework which integrates economic, ecological and social concerns within a long-term perspective. The Australian aid program will focus on promoting economic growth on the basis of equity, efficiency and long-term sustainability; on maintaining and enhancing ecological systems; and on improving quality of life through access to health services, education, a range of basic human rights, and participation of all groups in sustainable development.
Multilateral cooperation
The Global Environment Facility
The Global Environment Facility (GEF) was established in 1990 as a pilot program to fund climate change and other activities to assist in the protection of the global environment and assist in countries’ environmentally sound and sustainable economic development.
The World Bank, the United Nations Development Programme (UNDP) and UNEP are the implementing agencies for the Global Environment Facility, with the World Bank acting as trustee.
Article 21 of the Convention designates an appropriately restructured Global Environment
93
Australian assistance to developing countries
Facility as the interim financial mechanism to provide new and additional resources to developing countries.
During the pilot phase of the GEF, participants endorsed 115 projects worth approximately US$730 million. The allocation of funds was to four focal areas, those being: 40 per cent of resources to climate change projects, 42 per cent to biodiversity projects, 17 per cent to international waters projects and 1 per cent to ozone projects. A recent GEF discussion paper proposed that 40 per cent to 50 per cent of GEF resources in the next phase (1994–96) should be allocated for climate change activities.
Agreement was reached in March 1994 on the restructuring and replenishment of the Global Environment Facility. This agreement was guided by the principles agreed in the GEF participants’ meeting of May 1992, and the requirements of Agenda 21, the Framework Convention on Climate Change and the Biodiversity Convention.
The restructured GEF has universal membership, an open and transparent governance that is democratic, in terms of decision-making, guaranteeing a balanced and equitable representation of the interests of developing countries, as well as giving due weight to the funding efforts of donor countries.
Donors have pledged over US$2 billion to the first replenishment of the GEF, which will cover lending in the three-year period July 1994–June 1997. Australia indicated that it will make a contribution of A$42.73 million to this first replenishment, and that these contributions will be made on a ‘new and additional’ basis.
In the pilot phase, Australia provided A$30 million to the GEF, which consisted of the co-financing of two GEF projects, one in the area of climate change and one in biodiversity, with the remainder of the Australian contribution being made through the GEF core fund.
The GEF climate change project co-financed by Australia is the Promotion of Electric Energy Efficiency Program in Thailand.
Other multilateral sources of assistanceIn addition to Australia’s contribution through the GEF, Australia also provides funding to other multilateral organisations that assist in funding climate change activities.
• Through the Commonwealth Department of the Environment’s Climate Change Program, Australia provided A$50 000 in 1994 to the UN General Trust Fund for administrative purposes in support of the INC negotiating process for the Convention.
• As part of the same Climate Change Program, Australia provides substantial funding to the IPCC for a range of activities, including participation by developing countries at IPCC meetings and workshops, and capacity building activities. Over the last eighteen months, from June 1993, this assistance has been in the order of A$200 000.
• Australia provides assistance to Pacific Island countries to enable them to attend Climate Change INCs through the South Pacific Regional Environment Program (SPREP). Before INC 6, the Australian International Development Assistance Bureau provided a total of A$128 000 through the South Pacific Regional Environment Program to support Pacific Island countries’ participation at Climate Change INCs. The Australian International Development Assistance Bureau has recently established within the South Pacific Regional Environment Program a fund valued at A$125 000 per annum to support Pacific Island countries’ attendance at meetings related to the major post-UNCED conventions, including Climate Change.
• The Australian Centre for International Agricultural Research provides core funding to the International Rice Research Institute which is actively researching the potential impacts of climate change on rice production. The International Rice Research Institute is also studying the factors affecting emissions of
94
Australian assistance to developing countries
8
methane and nitrous oxides from rice paddies. The Australian Centre for International Agricultural Research also funds the Centre for International Forestry Research and the International Centre for Research on Agroforestry; these centres aim to conserve natural tropical forests by developing technologies that provide alternative sources of fuelwood and other timber products. The bilateral forestry research program of the Australian Centre for International Agricultural Research, which is concentrated in Asia and the Pacific, also addresses the deforestation problem.
• In addition to the core budget support, Australia has contributed $1.5 million to the United Nations Industrial Development Organisation (UNIDO), for the establishment of the Centre for Applications of Solar Energy in Perth. The objective of the centre is to bridge the gap between research and development organisations, innovative enterprises and the market-place within developing countries to stimulate appropriate application of solar energy technologies and solar energy-related industrial development within developing countries. The centre in Perth is the first of several such centres worldwide.
• Under the Environment Assistance Program, Australia provided a total of $244 000 to the International Tropical Timber Organisation in the financial year 1993–94, being for assessed membership costs and funding for their activities. This funding is provided to the International Tropical Timber Organisation for its efforts to achieve sustainable managed forests.
• Australia is one of a number of co-sponsors of a major study on global environment issues designed to address the problem of climate change in the Asia–Pacific region. Other co-sponsors are the Asian Development Bank, Norway, and the project is being undertaken in cooperation with the IPCC, the Economic and Social Commission for Asia and the
Pacific (ESCAP), UNEP and UNDP. The aim of the project is to assist developing countries to:
—establish a common framework for country studies on climate change and will include socio-economic impacts of climate change, policy options and propose national response strategies
—execute country studies to prepare national response strategies
—prepare a regional strategy to cope with climate change.
• Australia, through the Australian International Development Assistance Bureau, has contributed A$500 000 to the project for activities in Indonesia, the Philippines and Vietnam. In addition, the Australian International Development Assistance Bureau conducted a Symposium on Climate Impact Assessment for Asia and the Pacific in March 1993 as an adjunct to this project.
• At the 1989 Commonwealth Heads of Government Meeting in Malaysia, Australia made a commitment for development cooperation in the field of agroclimatology. Over four years, from 1991, Australia is providing A$3 million to the Climate Impact Assessment and Management Program (COMCIAM). Some 33 countries are participating in the program through regional workshops, study tours, student placement in Australia, or short-term specialist courses in Australia. COMCIAM addresses climatic database development, crop modelling and coastal zone management.
Bilateral cooperationIn pursuing the aims of the Australia Development Cooperation Program the government is committed to the continuing integration of environment concerns into all aspects of the development cooperation program.
The continuing implementation of Australia’s
95
Australian assistance to developing countries
ecologically sustainable development policy will involve a greater emphasis on activities which focus primarily on the environment. There has already been a substantial increase in the environmental focus of the aid program through activities aimed at the environment or conservation and this will continue.
Australia is well placed to assist countries in our region to bring about ecologically sustainable patterns of development. Given the rapid urban growth in the Asian region, Australia’s programs will also focus on urban environment issues. Assistance may be provided in areas such as the transfer of efficient energy technologies, best practice technologies to minimise industrial pollution, and urban planning.
Australia has provided assistance to a number of projects in a number of countries in the Asia–Pacific region that are broadly related to climate change.
Activities include the following.
• Funding the ASEAN–Australia Marine Science (Tides) Project to the extent of A$3.3 million over the next two years, a total of A$5.4 million since 1988. The project is linked to the Pacific and Australian studies, and monitors sea level and current flows as well as tidal dynamics. A feasibility study has been carried out for a similar project in the Indian Ocean and a project for the Maldives.
• The ASEAN Australia Economic Cooperation Program was established in 1974 to support regional cooperation among ASEAN countries and to strengthen ASEAN–Australian relations through economic cooperation activities. The program, worth about A$7 million annually, focuses on science, technology, food and agriculture which are issues with strong linkages to climate change impacts and response actions.
• In Australia, the Environment Industry Association of Australia and its export arm, the Australian Environment Management Export Corporation, work closely with the government on the transfer of environment
management capability, particularly to the South-East and East Asia regions.
• Funding the World Meteorological Organisation to carry out a Climate Monitoring and Impacts Study in the South Pacific. This study considered integrated climate monitoring and climate change needs in the South Pacific. It identified about A$20 million in projects.
• Funding a feasibility study for a wind and weather radar at Nadi, Fiji, to track weather patterns in the Pacific. The project is likely to proceed and will eventually cost around A$20 million.
• The Australian Bureau of Meteorology is currently providing technical assistance to meteorological offices in the region (for example, Vanuatu, Fiji, Cambodia). Training for meteorological officers and managers is also provided.
• The Australian Bureau of Meteorology provides bilateral operational and training support to a number of national meteorological services in the region. Together with the New Zealand Institute for Water and Atmospheric Research Ltd it has also established the monthly bulletin South Pacific Climate Monitor, including predictions of droughts and cyclones, covering the south-west Pacific.
Capacity buildingAs part of its ecologically sustainable development policy, Australia places emphasis on helping developing countries to establish appropriate planning and institutional frameworks, with a focus on capacity building. This includes strengthening developing countries’ institutions responsible for the environment.
Examples of capacity building activities that Australia has undertaken include a A$24 million project to extend the capabilities of the Indonesian Environment Planning Agency, core funding to the South Pacific Regional Environment Program and
96
Australian assistance to developing countries
8
assistance to the Electricity Generating Authority of Thailand, including an emphasis on environmental management. Other capacity building projects that receive Australian contributions are listed below.
South Pacific Regional Environment Program
Australia provides an annual contribution to the South Pacific Regional Environment Program’s core budget as well as funding extra budget activities. This assists SPREP to maintain and improve the Pacific Island countries’ shared environment and to enhance the islands’ capacity to provide a present and future resource base to support the needs and maintain the quality of life of Pacific people. In 1993–94 Australia’s estimated contribution to SPREP is $1.2 million.
South Pacific Sea Level and Climate Monitoring Project
The project aims to help Pacific Island countries and their governments understand the scale and implications of changing sea levels and climate. Drawing on Australian and regional scientific and financial resources, the project aims to accurately record variation in the long-term sea levels in the South Pacific. Australia’s estimated contribution to the project is A$8.25 million.
Training activitiesA significant proportion of the Australia Development Cooperation Program is provided through training. In 1992, approximately 11 400 students from developing countries received assistance through scholarships or fee subsidies under the development cooperation program. Over 700 of these students were studying environment-related subjects in 1992, an increase of 25 per cent over the previous year.
Australia is providing training through various mechanisms to make countries aware of issues related to the impact of climate change on the environment. A particular example of past activities in this area was the Climate Impact Assessment and Management Program for Commonwealth Countries which aims to highlight the importance of scientifically measuring the impact of climate change, and to ensure that countries have the necessary technology to do this. It is planned that all countries involved in the program will ultimately work collaboratively with scientific organisations in other countries, contributing to the global knowledge and understanding of bioclimatology. Australia’s estimated contribution to the project is A$3 million.
During the period 1992–1994, Australia provided a total of A$10.636 million to the Steel Authority of India Training Project. The aim of the project is to increase operational efficiency and decrease any adverse environmental effects of mine and steel plant operations, by implementing a skills upgrading program. The project will provide training for 454 personnel, covering a wide range of practical aspects of mine and steel plant operations and environmental management.
Australia has contributed towards attendance by Asian regional experts at conferences related to climate change including conferences on technologies to reduce greenhouse gas emissions, policy instruments to reduce greenhouse gas emissions, coastal zone management, and scientific impacts modelling.
Australia is currently providing technical assistance to meteorological offices in the region (for example, Vanuatu, Fiji, Cambodia). It also provides training fellowships for meteorological officers and managers.
Australia is assisting in the strengthening of the ASEAN Specialised Meteorological Centre in Singapore by actively facilitating scientific exchange within the ASEAN–Australian region.
97
Australian assistance to developing countries
ForestryAustralia is providing assistance to countries in developing environmentally sound management of forestry resources. Such assistance is being provided to the Solomon Islands, Vanuatu, Fiji, Papua New Guinea, Nepal, Sri Lanka, and the South-East Asian region. The Participatory Forestry Project in Sri Lanka is being co-financed with the Asian Development Bank. Activities include preparation of inventories of forest resources, and capacity building to monitor and properly manage logging operations.
Australia will provide a contribution of nearly A$10 million between 1991–1996 to the Nepal–Australia Community Forestry Program in Nepal. The current phase of the project aims to assist the government of Nepal to increase community welfare and self-reliance through the development and implementation of forest management systems. The aim is to increase the availability of forest resources while ensuring that the resources are used on a sustainable basis.
98
Improving energy efficiencyAustralia has provided funding for activities that improve the energy efficiency of activities as well as reducing air pollution. In China, funding has been provided to support the development of modern coal gasification plants which have significant environmental benefits in terms of reduced air pollution, energy savings and reduced greenhouse gas emissions. As well, funding has been provided to assist in the manufacture of a range of renewable energy and waste disposal technologies. Australia’s contribution to these activities is over A$8.3 million.
In India, funding of A$7.4 million will be provided between 1994 and 1997 to support the upgrading of the Ghatsila Smelter Complex using the Australian-developed Sirosmelt technology. The project will reduce the emissions that accompany the more efficient extraction process and the reduction of end products.
9
Chapter Nine
Future directions
The National Greenhouse Response Strategy forms the main framework for Australia’s greenhouse response. The present day strategy is a first phase strategy, one specifically designed to be dynamic and hence one that is evolving. For these reasons, the The National Greenhouse Response Strategy, in addition to containing many first phase measures that will affect Australia’s emission trends, outlines many processes which involve studies, policy development and procedural arrangements as an adjunct or prelude to further concrete action.
The range of actions undertaken in Australia is continually expanding and has expanded since the 1992 adoption of the The National Greenhouse Response Strategy.
IntroductionSpeaking in the Australian Parliament on 16 March 1994, the then federal Environment Minister noted that the first phase of the National Greenhouse Response Strategy was only an initial range of actions and that ‘more can be done, more is being done, and more will be done.’ This chapter explores the range of actions and approaches being pursued within Australia to improve its national greenhouse response.
Australian governments have been evaluating implementation of the strategy thus far, and working to identify any areas where further or modified action could be considered. These will be defined further over the course of the next 12 months. The need, timing, detail and funding for the implementation of any such measures have yet to be settled. However, it is likely that the emphasis of the strategy will continue to be on ‘no regrets’ measures.
The focus for the future is on action, at the governmental level and in industry and community spheres of activity, that will lead to significant greenhouse gas emission reductions and sink conservation and enhancement.
Activities to develop the National Greenhouse Response Strategy will be developed and implemented within the framework of the set of principles and goals governing the strategy.
The development of the National Greenhouse Response StrategyThe first step to identifying potential new measures is to review the priority areas outlined in the strategy and identify appropriate areas on which to concentrate efforts. The likely areas for detailed consideration include:
• energy services, covering energy transformation, distribution and use
• urban and infrastructure development
• transport
99
Future directions
• commerce and industry
• sink conservation and enhancement.
For these key areas there are six main sources of information from which proposed measures may be drawn.
Existing measures
This area of investigation encompasses measures that have been already identified in various policy development processes but have yet to be implemented, thus having a high probability of acceptance.
Measures arising from studies in the first phase of the strategy
Implementing the first phase of the strategy has involved conducting a number of major reviews and studies into a diverse range of greenhouse related issues: studies of externalities in the energy sector; studies of energy standards for industrial and commercial equipment; studies of electric motors; and reviews of existing programs including the National Landcare Program. There are many potential measures which flow from the studies and reviews which have been completed to date.
The ecologically sustainable development process
As part of Australia’s ecologically sustainable development process, a special greenhouse report was published in early 1992. That report drew together and summarised the options from the nine sectoral working groups that could have an impact on Australian greenhouse gas emissions. A number of these recommendations on ecologically sustainable development have yet to be adopted by governments for a range of reasons; some recommendations may no longer be relevant. These outstanding recommendations are being reconsidered as part of the development of the National Greenhouse Response Strategy.
Initiatives in other countries
While some of Australia’s economic, environmental and social characteristics mean that some measures adopted by other countries may not be suitable or even relevant to Australia’s greenhouse response,
100
there are opportunities for the development of Australia’s response to be informed by the actions of other countries.
Indeed, in Australia’s view, one of the real values of the Convention’s national reporting commitment will be to facilitate an ever-broadening menu of measures for consideration by Parties to the Convention.
The National Greenhouse Gas Inventory
One of the primary policy purposes for a national greenhouse gas inventory is to provide direction for the development of policies to mitigate the threat of global warming. The Australian inventory will provide useful insight into areas of the Australian economy where future response measures could be targeted. One potential area for measures is in land clearing. Before the completion of the inventory, this sector was assumed to be insignificant with respect to Australian greenhouse gas emissions. With the release of the National Greenhouse Gas Inventory, a clear signal has been given that this is an area that warrants attention in reducing uncertainties in the data and in developing additional response measures.
Other ideas
Of course Australia has much to learn from existing processes and measures which can assist the development of the The National Greenhouse Response Strategy. Nevertheless, addressing net emissions of greenhouse gases is a challenge which will require, among other things, innovative and new solutions. Technologies only now being developed will increase the possibilities of moving to a greenhouse sustainable future, as will a better understanding of the range of economic instruments available to governments. The Commonwealth Government is committed to examining the entire range of possible options to address the issue in an effective and efficient manner.
Future directions
9
Mechanisms to drive the development of the National Greenhouse Response Strategy
The Intergovernmental Committee for Ecologically Sustainable Development is responsible for advancing the development of the strategy at an intergovernmental level and making recommendations to the heads of the federal, State and Territory governments. In order to assist the committee, a number of mechanisms exist, including the National Greenhouse Advisory Panel and a newly established Commonwealth, State and Territory working group of senior government officials.
National Greenhouse Advisory Panel
The National Greenhouse Advisory Panel was established by the heads of Australian governments as a small but broad-based advisory body, including representatives of scientific, technical, industrial, administrative and conservation interests. One of the key roles identified for the panel is to provide advice on the implementation and further development of the The National Greenhouse Response Strategy.
Officials working group
In mid-1994, a working group of Commonwealth, State and Territory government officials was established with the specific aims of examining issues surrounding the current The National Greenhouse Response Strategy, dealing with any impediments to the implementation of existing measures, and advancing and extending the package of measures. This work should be completed at a time sufficient to have Australian governments consider any outcomes before the end of 1994.
The Commonwealth Government appreciates that key stakeholders, given the importance of their contribution to effective action, need to be engaged to ensure joint ownership of measures.
International measuresIn addition to domestic activities, Australia considers that an open and flexible joint implementation regime will assist countries in the pursuit of cost-effective opportunities for reducing global greenhouse gas emissions. We anticipate benefits to both host and investor countries from participating in joint implementation projects. Host countries will gain access to additional technology and expertise and investor countries will be able to draw on private sector resources.
Australia recognises there is some international misunderstanding as to the benefits of an open joint implementation regime. We have therefore consistently argued for a completely voluntary regime, beginning with a pilot phase, that contains projects which are consistent with the national priorities of the host and with the principles of sustainable development, which complement domestic action by the investor and which bring about real and measurable greenhouse gas reductions.
Australia is currently exploring opportunities for suitable activities in the Asia–Pacific region that could act as pilot joint implementation projects. The intention of such activities would be to practically test how arrangements might work and to build on these experiences in further developing the joint implementation concept. We expect to report on the results of these activities in future national communications.
ConclusionOver the next couple of years, the Australian federal, State and Territory governments, together with local government, industry and the wider community, aim to achieve:
• a substantial national effort to abate net greenhouse gas emissions
• increased international acceptance of the need for effective global action to achieve the objective of the Framework Convention on Climate Change.
101