Embed Size (px)
DESCRIPTION
Overview of 2013 Accountability. August 27, 2013. Diana Hood, Coordinator of Assessment, Accountability and Research. 2013 Accountability Ratings. The following table outlines the accountability ratings and distinction designations that were assigned on August 8, 2013. Student Achievement - PowerPoint PPT Presentation
Citation preview

August 27, 2013
Diana Hood, Coordinator of Assessment, Accountability and Research
Overview of 2013 Accountability
2
The following table outlines the accountability ratings and distinction designations that were assigned on August 8, 2013.
2013 Accountability Ratings
Accountability Rating (Districts and Campuses)
Distinction Designations(Campuses Only)
Met StandardTop 25%: Student Progress and/orAcademic Achievement: Reading/ELA and/orAcademic Achievement: Mathematics
Met Alternative Standard(Assigned to charter operators and alternative education campuses evaluated under alternative education provisions)
N/A
Improvement Required N/A
Performance Index Framework3
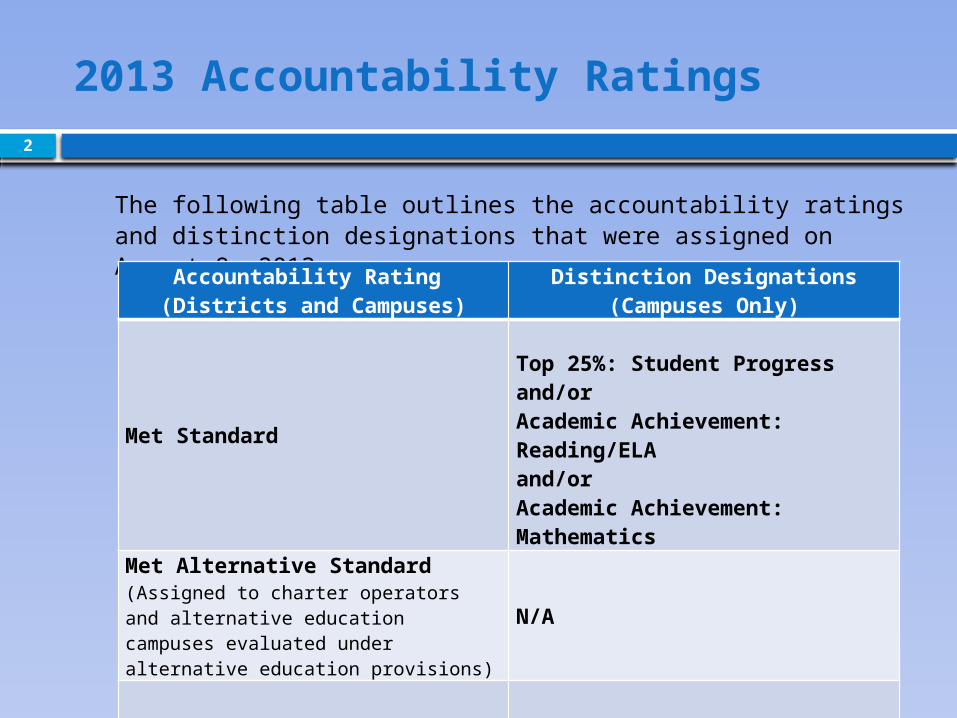
For 2013 and beyond, a framework of four Performance Indexes will include a broad set of measures that provide a comprehensive evaluation of the entire campus or district.
Accountability System
Student Achievement
Index I
Student ProgressIndex 2
Closing Performance
GapsIndex 3
Postsecondary Readiness
Index 4
Student Achievement
Index I
Student ProgressIndex 2
Closing Performance
GapsIndex 3
Postsecondary Readiness
Index 4

Index 1: Student Achievement4
Index 1: Student Achievement provides an overview of student performance based on satisfactory student achievement across all subjects for all students.
Subjects: Combined over Reading, Mathematics, Writing, Science, and Social Studies.
Student Groups: All Students only
Performance Standards: Phase-in 1 Level II (Satisfactory)

2013 Performance Index Targets5
2013 Index Targets for Non-AEA Campuses and Districts
To receive a Met Standard rating, non-AEA campuses and districts must meet the following accountability targets on all indexes for which they have performance data in 2013.
Performance Index Campuses Districts
Index 1: Student Achievement 50 50
Index 2: Student Progress
High Schools: 17
21Middle Schools: 29
Elementary Schools: 30
Index 3: Closing Performance Gaps 55 55
Index 4: Postsecondary Readiness 75 75
2013 Performance Index Targets6
2013 Index Targets for AEA Campuses and Charters
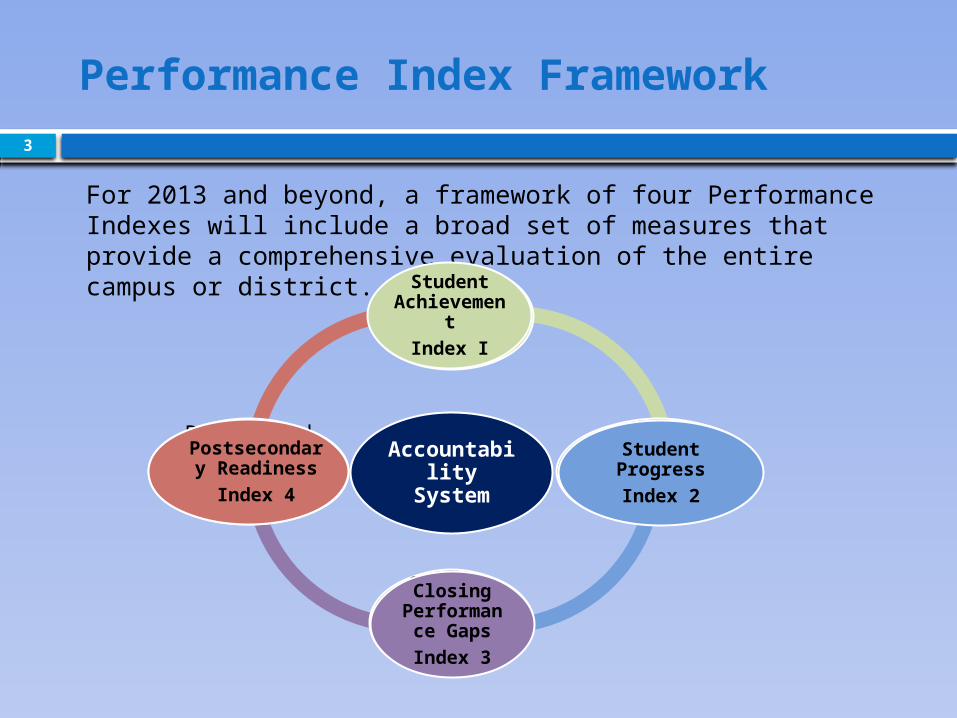
To receive a Met Alternative Standard rating, alternative education campuses and charter operators evaluated under AEA provisions must meet the following accountability targets on all indexes for which they have performance data in 2013.
Performance Index AEA Campuses Charters
Index 1: Student Achievement 25 25
Index 2: Student Progress 9 9
Index 3: Closing Performance Gaps 30 30
Index 4: Postsecondary Readiness 45 45

Index 1: Student Achievement7
BEDFORD H
EIGHTS
BELL M
ANOR
BELLAIRE
DONNA PARK
HARRISON LA
NE
HURST H
ILLS
LAKEW
OOD
MEADOW
CREEK
MID
WAY PARK
NORTH EULESS
OAKWOOD TERRACE
RIVER TRAILS
SHADY BROOK
SHADY O
AKS
SOUTH EULE
SS
SPRIN
G GARDEN
STONEGATE
WEST
HURST
WILS
HIRE0
10
20
30
40
50
60
70
80
90
100
INDEX 1

Index 1: Student Achievement8
BEDFORD JH CENTRAL JH EULESS JH HARWOOD JH HURST JH BELL HS TRINITY HS KEYS0
10
20
30
40
50
60
70
80
90
100INDEX 1

Index 1: Student Achievement9
STATE
H-E-B
BIRDVILLE
CARROLL
CONROE
GRAPEVINE COLL
EYVILLE
KATY
KELLER
NORTHWEST
RICHARDSON
0
10
20
30
40
50
60
70
80
90
100
INDEX 1

10
Index 2: Student Progress focuses on actual student growth independent of overall achievement levels for each race/ethnicity student group, students with disabilities, and English language learners.
By Subject Area: Reading, Mathematics, and Writing for available grades.
Credit based on weighted performance:
One point credit given for each percentage of students at the Met growth expectations level.
Two point credit given for each percentage of students at the Exceeded growth expectations level.
Index 2: Student Progress
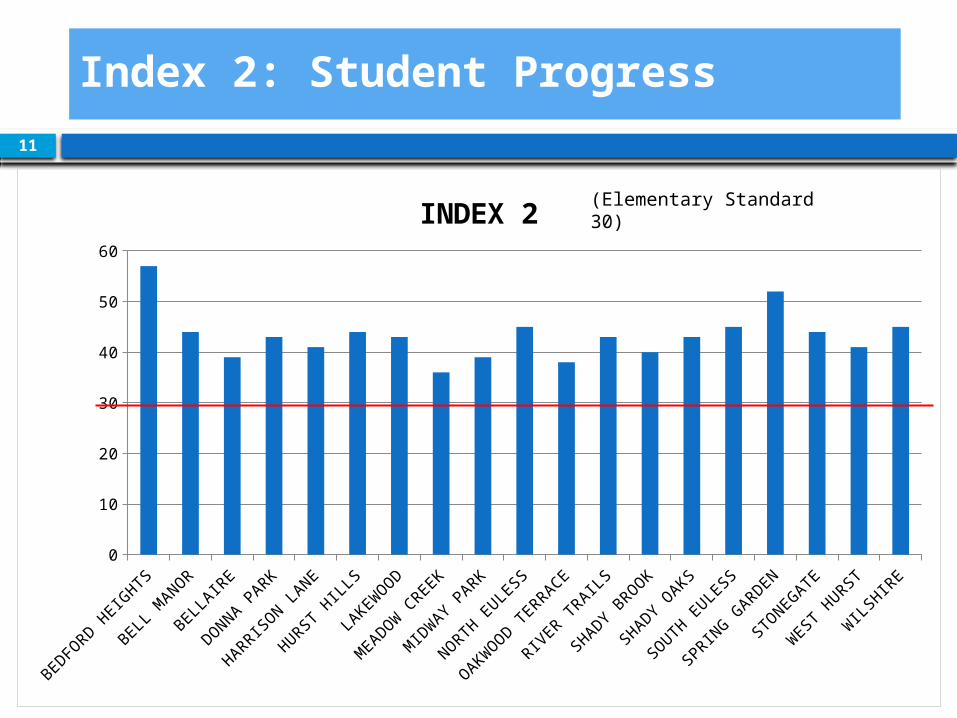
Index 2: Student Progress11
BEDFORD H
EIGHTS
BELL M
ANOR
BELLAIRE
DONNA PARK
HARRISON LA
NE
HURST H
ILLS
LAKEW
OOD
MEADOW
CREEK
MID
WAY PARK
NORTH EULESS
OAKWOOD TERRACE
RIVER TRAILS
SHADY BROOK
SHADY O
AKS
SOUTH EULE
SS
SPRIN
G GARDEN
STONEGATE
WEST
HURST
WILS
HIRE0
10
20
30
40
50
60
INDEX 2 (Elementary Standard 30)

Index 2: Student Progress12
BEDFORD JH CENTRAL JH EULESS JH HARWOOD JH HURST JH BELL HS TRINITY HS0
10
20
30
40
50
60INDEX 2
(Junior High Standard 29)(High School Standard 17)
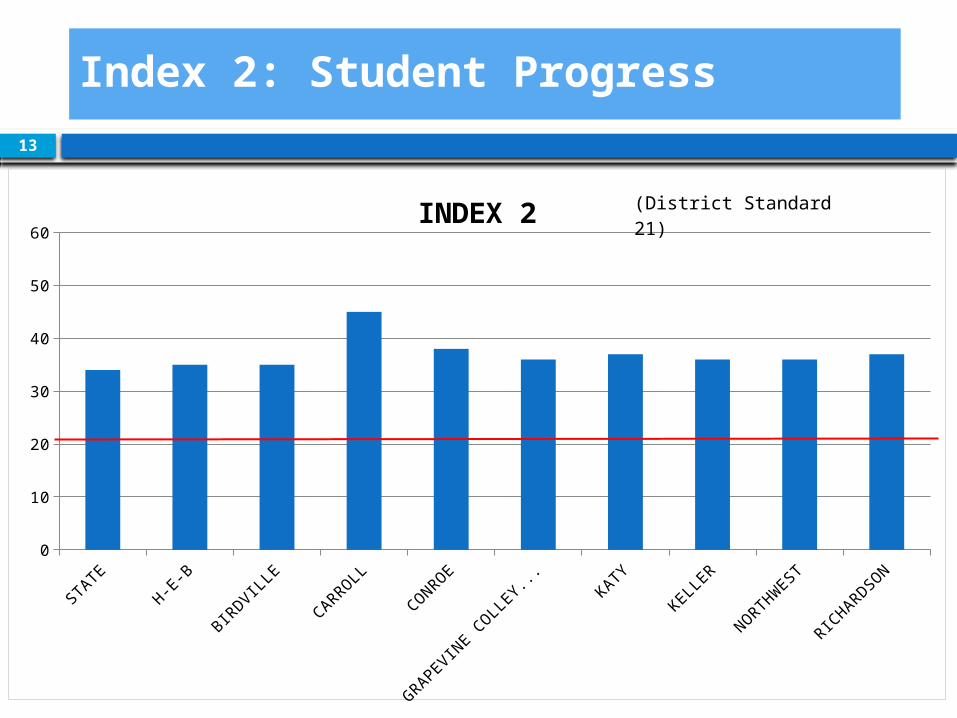
Index 2: Student Progress13
STATE
H-E-B
BIRDVILLE
CARROLL
CONROE
GRAPEVINE COLL
EYVILLE
KATY
KELLER
NORTHWEST
RICHARDSON
0
10
20
30
40
50
60INDEX 2 (District Standard 21)
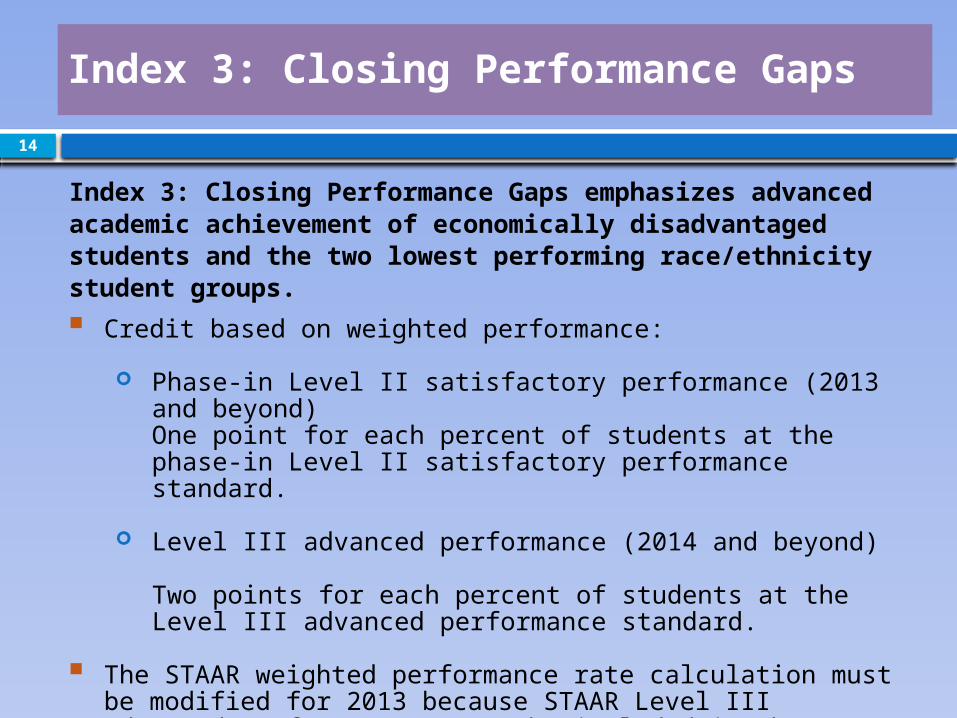
14
Credit based on weighted performance:
Phase-in Level II satisfactory performance (2013 and beyond) One point for each percent of students at the phase-in Level II satisfactory performance standard.
Level III advanced performance (2014 and beyond) Two points for each percent of students at the Level III advanced performance standard.
The STAAR weighted performance rate calculation must be modified for 2013 because STAAR Level III advanced performance cannot be included in the indicator until 2014.
Index 3: Closing Performance Gaps
Index 3: Closing Performance Gaps emphasizes advanced academic achievement of economically disadvantaged students and the two lowest performing race/ethnicity student groups.
Index 3: Closing Performance Gaps
15
By Subject Area: Reading, Mathematics, Writing, Science, and Social Studies.
Student Groups
Socioeconomic: Economically Disadvantaged
Lowest Performing Race/Ethnicity: The two lowest performing race/ethnicity student groups on the campus or district (based on prior-year assessment results).
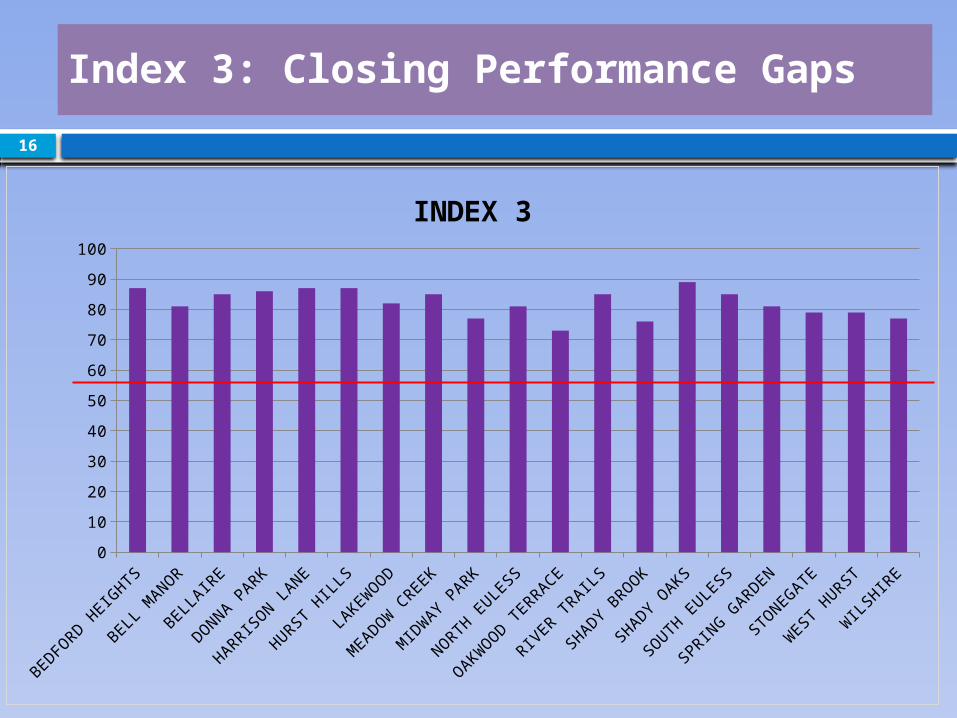
Index 3: Closing Performance Gaps
16
BEDFORD H
EIGHTS
BELL M
ANOR
BELLAIRE
DONNA PARK
HARRISON LA
NE
HURST H
ILLS
LAKEW
OOD
MEADOW
CREEK
MID
WAY PARK
NORTH EULESS
OAKWOOD TERRACE
RIVER TRAILS
SHADY BROOK
SHADY O
AKS
SOUTH EULE
SS
SPRIN
G GARDEN
STONEGATE
WEST
HURST
WILS
HIRE0
10
20
30
40
50
60
70
80
90
100
INDEX 3

Index 3: Closing Performance Gaps
17
BEDFORD JH CENTRAL JH EULESS JH HARWOOD JH HURST JH BELL HS TRINITY HS KEYS0
10
20
30
40
50
60
70
80
90
100
INDEX 3
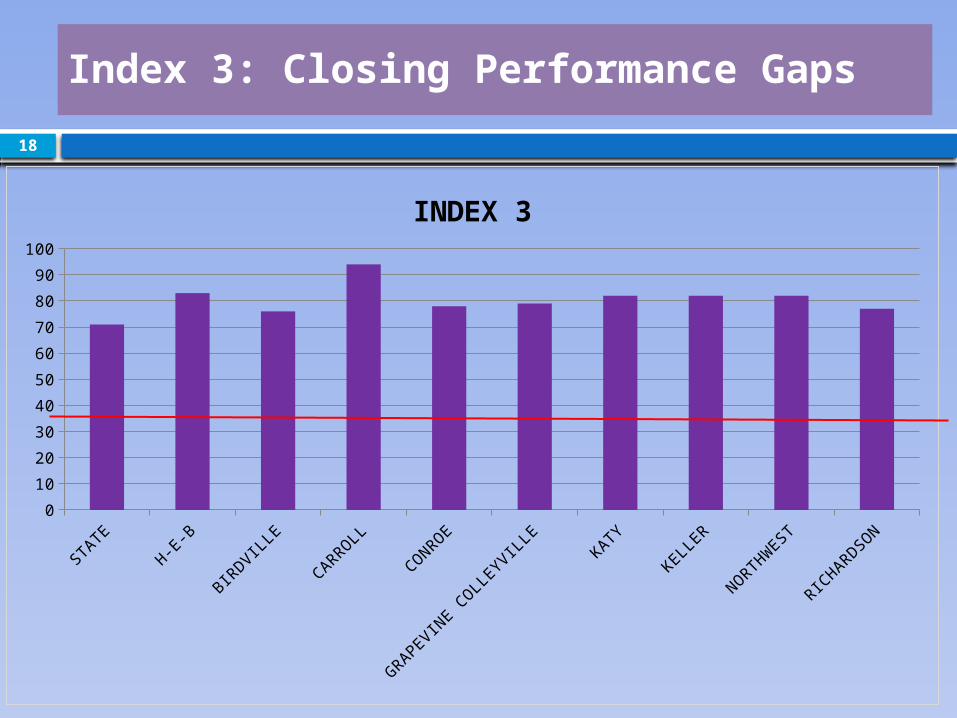
Index 3: Closing Performance Gaps
18
STATE
H-E-B
BIRDVILLE
CARROLL
CONROE
GRAPEVINE COLL
EYVILLE
KATY
KELLER
NORTHWEST
RICHARDSON
0
10
20
30
40
50
60
70
80
90
100
INDEX 3

Index 4: Postsecondary Readiness
19
Index 4: Postsecondary Readiness emphasizes the importance for students to receive a high school diploma that provides them with the foundation necessary for success in college, the workforce, job training programs, or the military; and the role of elementary and middle schools in preparing students for high school.
Graduation Score: Combined performance across the graduation and dropout rates for
Grade 9-12 Four-Year Graduation Rate for All Students and all student groups OR
Grade 9-12 Five-Year Graduation Rate for All Students and all student groups, whichever contributes the higher number of points to the index.
RHSP/DAP Graduates for All Students and race/ethnicity student groups
STAAR Score: STAAR Percent Met Final Level II on One or More Tests for All Students and race/ethnicity student groups (2014 and beyond)
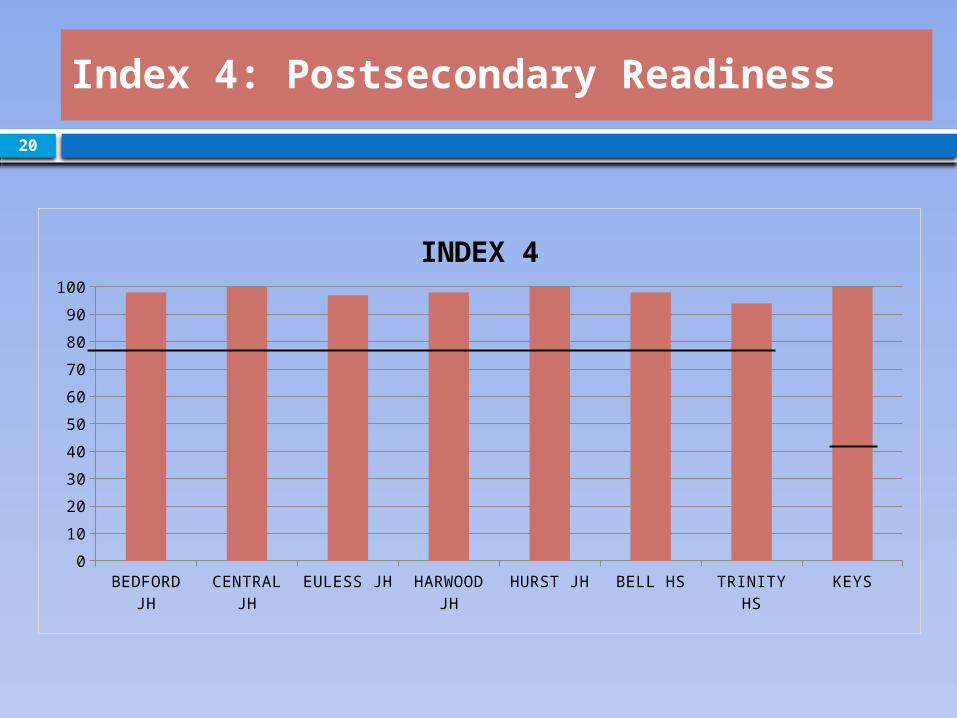
Index 4: Postsecondary Readiness
20
BEDFORD JH CENTRAL JH EULESS JH HARWOOD JH HURST JH BELL HS TRINITY HS KEYS0
10
20
30
40
50
60
70
80
90
100
INDEX 4
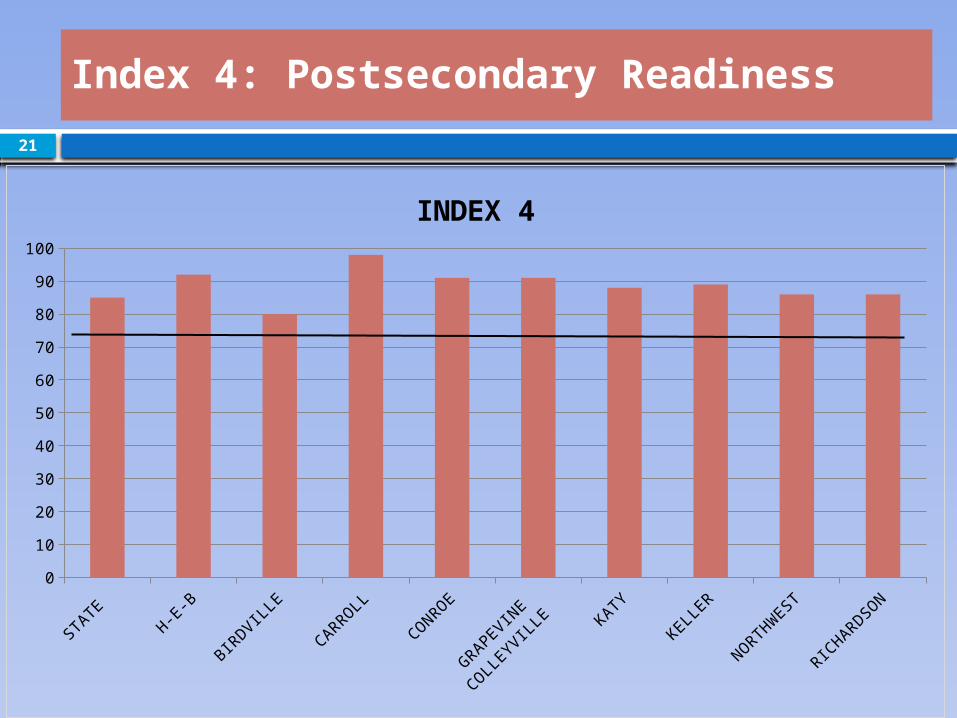
Index 4: Postsecondary Readiness
21
STATE H-E-B BIRDVILLE CARROLL CONROE GRAPEVINECOLLEYVILLE
KATY KELLER NORTHWESTRICHARDSON0
10
20
30
40
50
60
70
80
90
100
INDEX 4
Academic Achievement Distinction Designations
Academic Achievement Distinction Designations
23
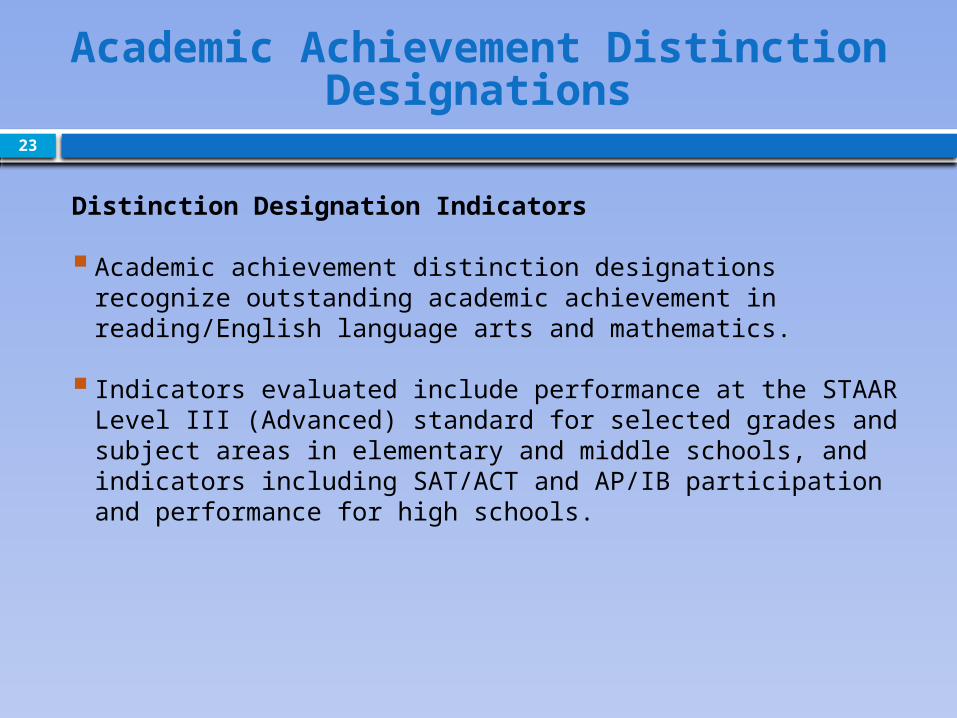
Distinction Designation Indicators
Academic achievement distinction designations recognize outstanding academic achievement in reading/English language arts and mathematics.
Indicators evaluated include performance at the STAAR Level III (Advanced) standard for selected grades and subject areas in elementary and middle schools, and indicators including SAT/ACT and AP/IB participation and performance for high schools.
Academic Achievement Distinction Designations
24
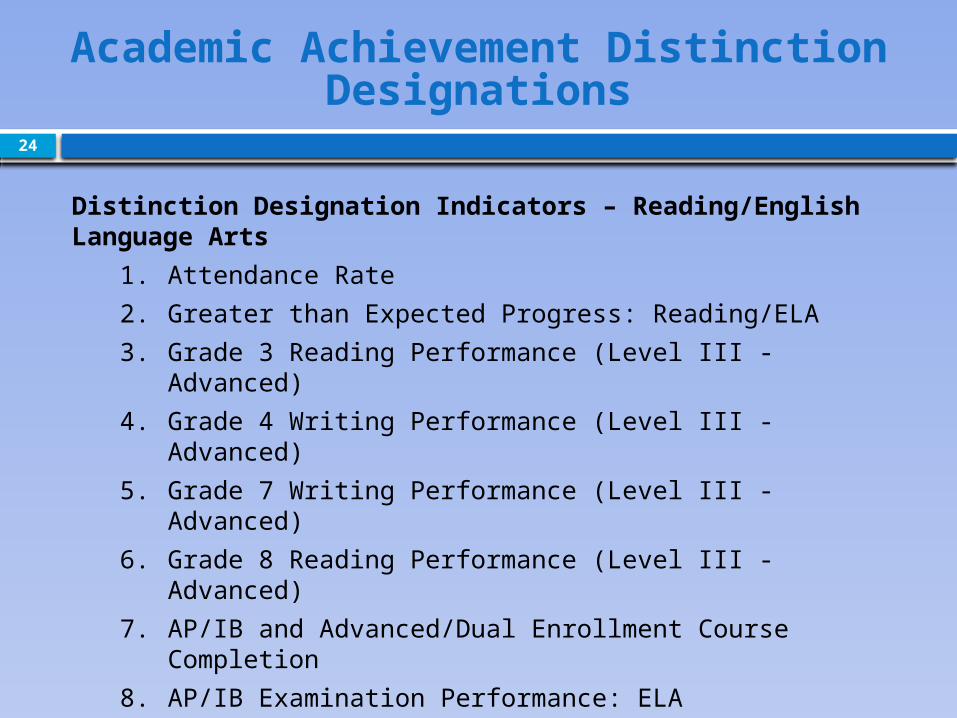
Distinction Designation Indicators – Reading/English Language Arts
1. Attendance Rate
2. Greater than Expected Progress: Reading/ELA
3. Grade 3 Reading Performance (Level III - Advanced)
4. Grade 4 Writing Performance (Level III - Advanced)
5. Grade 7 Writing Performance (Level III - Advanced)
6. Grade 8 Reading Performance (Level III - Advanced)
7. AP/IB and Advanced/Dual Enrollment Course Completion
8. AP/IB Examination Performance: ELA
9. SAT/ACT Participation
10. SAT Performance: ELA
11. ACT Performance: ELA

Academic Achievement Distinction Designations
25
Distinction Designation Indicators – Mathematics
1. Attendance Rate
2. Greater than Expected Progress: Mathematics
3. Grade 5 Mathematics Performance (Level III - Advanced)
4. Algebra I by Grade 8 – Participation
5. Algebra I by Grade 8 – Performance (Level III - Advanced)
6. AP/IB and Advanced/Dual Enrollment Course Completion
7. AP/IB Examination Performance: Mathematics
8. SAT/ACT Participation
9. SAT Performance: Mathematics
10. ACT Performance: Mathematics

Distinction Designation Framework Steps
The framework for distinction designations uses four steps to determine a campus distinction.
Step 1: Determine Campus Comparison GroupA campus comparison group of 40 campuses is selected for each campus. Campus performance on each distinction indicator, by subject, is reported. Comparison groups were provided to districts in June, 2013.
Step 2: Identify Top 25% By Indicator Relative to Comparison GroupFor each indicator, compare the performance of the target campus to the performance of the campuses in the comparison group. For example, Campus A is in the top 25% of campuses in the comparison group on a particular distinction indicator.
Academic Achievement Distinction Designations
26

Distinction Designation Framework Steps (continued)
Step 3: Evaluate Campus Outcomes by SubjectDetermine the percent of indicators in the top quartile by subject for each campus. For example, Campus A achieved the top 25% in three of the six (50%) mathematics distinction indicators that were evaluated for the campus.
Step 4: Apply Distinction Designations TargetIdentify the campuses that meet or exceed the distinction designations targets by subject. For example, elementary campuses that outperformed their peers on 50% or more of the mathematics distinction indicators evaluated are qualified to receive an academic distinction in mathematics.
Academic Achievement Distinction Designations
27
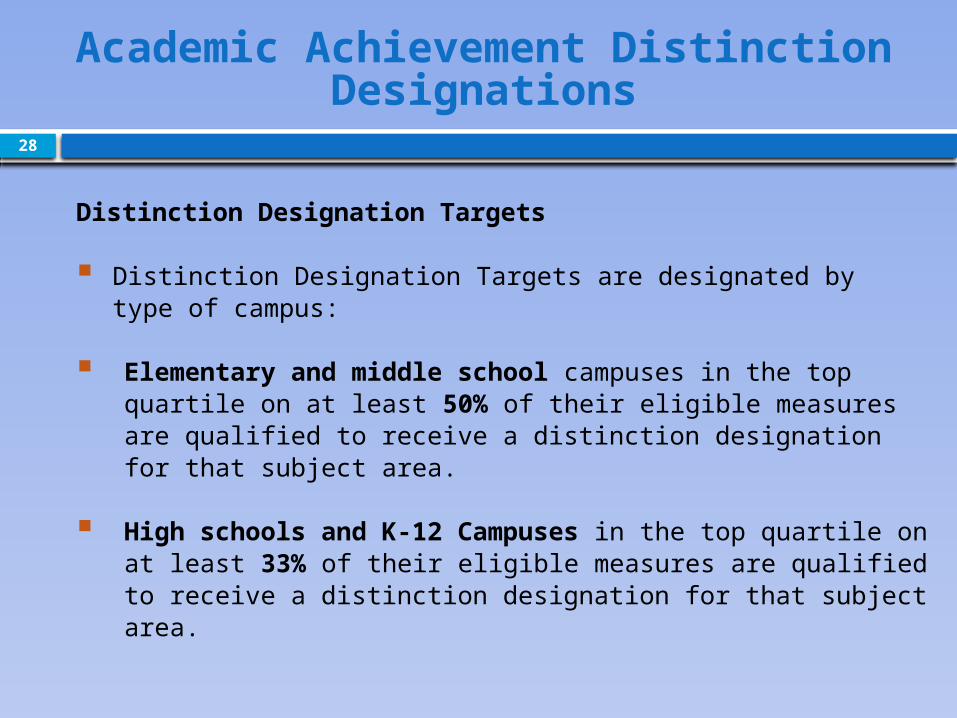
Distinction Designation Targets
Distinction Designation Targets are designated by type of campus:
Elementary and middle school campuses in the top quartile on at least 50% of their eligible measures are qualified to receive a distinction designation for that subject area.
High schools and K-12 Campuses in the top quartile on at least 33% of their eligible measures are qualified to receive a distinction designation for that subject area.
Academic Achievement Distinction Designations
28
Top 25% Student Progress Distinction
30
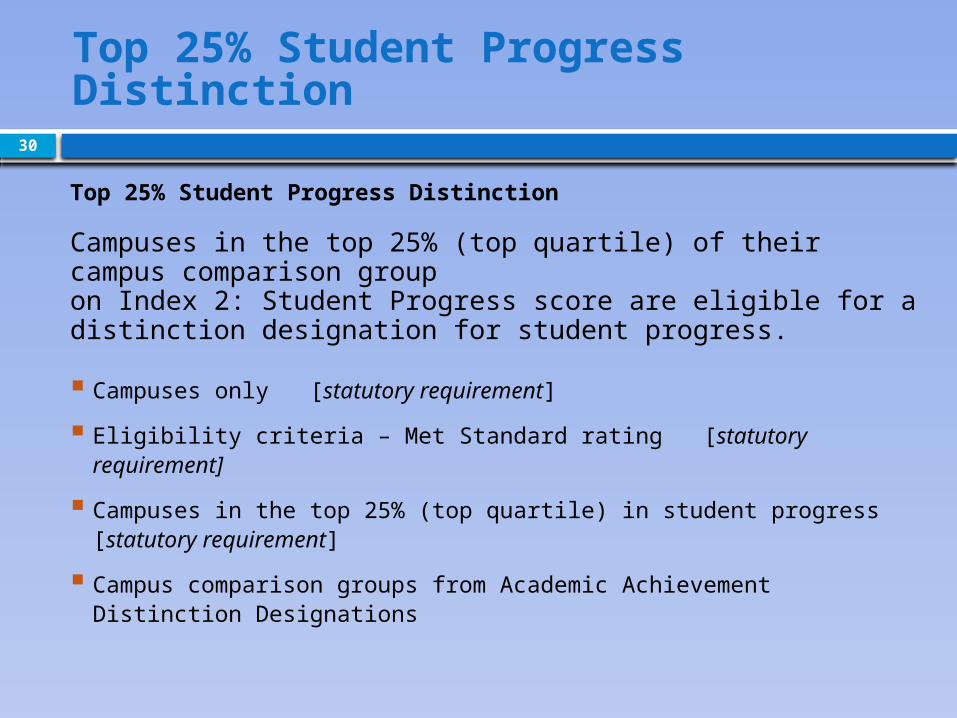
Top 25% Student Progress Distinction
Campuses in the top 25% (top quartile) of their campus comparison groupon Index 2: Student Progress score are eligible for a distinction designation for student progress.
Campuses only [statutory requirement]
Eligibility criteria – Met Standard rating [statutory requirement]
Campuses in the top 25% (top quartile) in student progress [statutory requirement]
Campus comparison groups from Academic Achievement Distinction Designations
Top 25% Student Progress Distinction
31
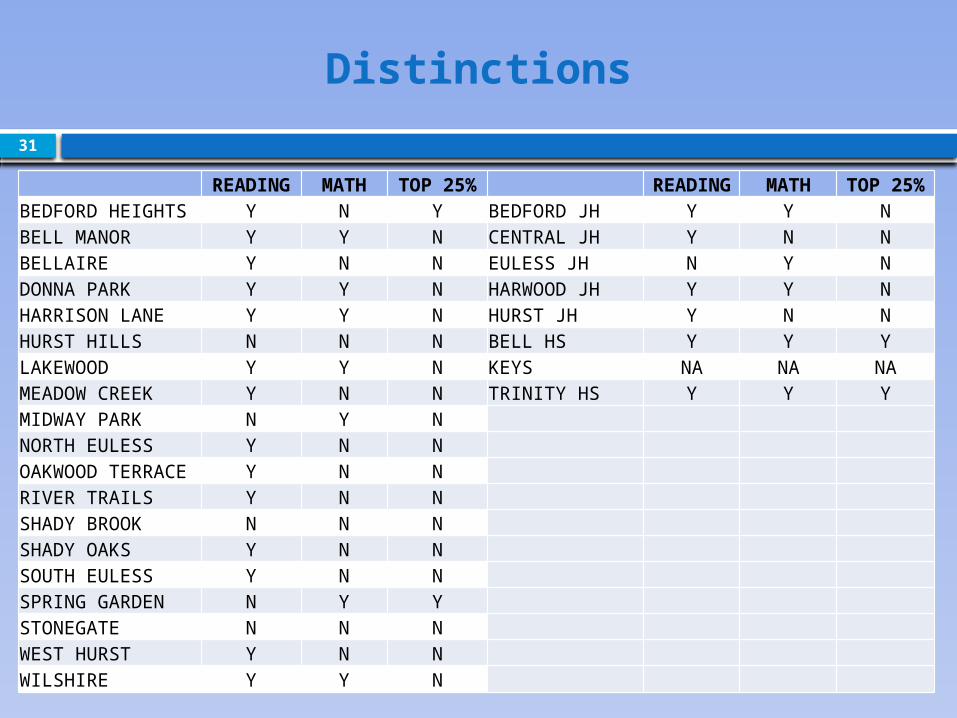
Distinctions
READING MATH TOP 25% READING MATH TOP 25%BEDFORD HEIGHTS Y N Y BEDFORD JH Y Y NBELL MANOR Y Y N CENTRAL JH Y N NBELLAIRE Y N N EULESS JH N Y NDONNA PARK Y Y N HARWOOD JH Y Y NHARRISON LANE Y Y N HURST JH Y N NHURST HILLS N N N BELL HS Y Y YLAKEWOOD Y Y N KEYS NA NA NAMEADOW CREEK Y N N TRINITY HS Y Y YMIDWAY PARK N Y NNORTH EULESS Y N NOAKWOOD TERRACE Y N NRIVER TRAILS Y N NSHADY BROOK N N NSHADY OAKS Y N NSOUTH EULESS Y N NSPRING GARDEN N Y YSTONEGATE N N NWEST HURST Y N NWILSHIRE Y Y N