Embed Size (px)
Citation preview

Shakey’sPizzaAsiaVentures,Inc.(PSE:PIZZA)
COMPANYPRESENTATION:August2017
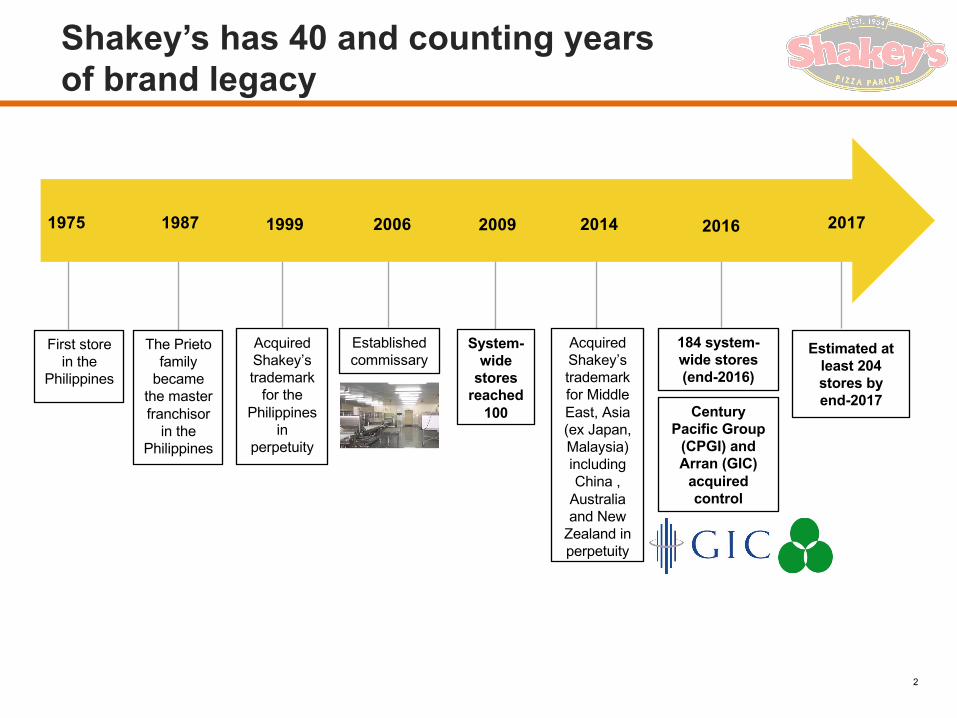
The Prieto family
became the master franchisor
in the Philippines
Acquired Shakey’strademark
for the Philippines
in perpetuity
Established commissary
Acquired Shakey’strademark for Middle East, Asia (ex Japan, Malaysia) including China ,
Australia and New
Zealand in perpetuity
1975 2016 20172006
System-wide
stores reached
100
184 system-wide stores (end-2016)
Estimated at least 204 stores by end-2017
1987
First store in the
Philippines
1999 2009 2014
Century Pacific Group
(CPGI) and Arran (GIC)
acquired control
2
Shakey’s has 40 and counting years of brand legacy

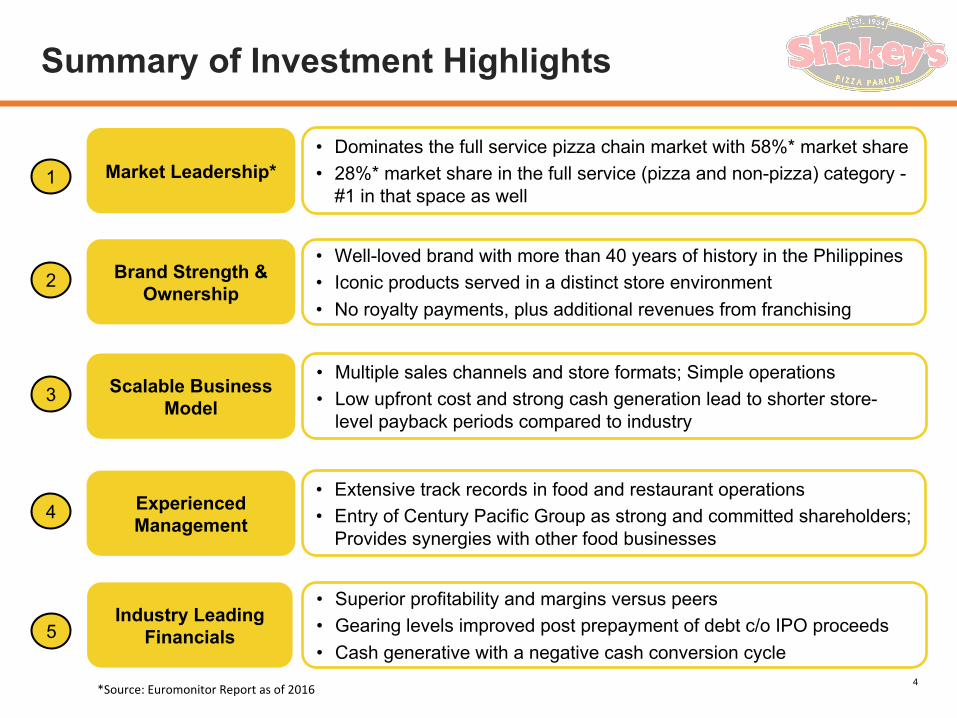
Summary of Investment Highlights
Market Leadership*
Scalable Business Model
Experienced Management
• Dominates the full service pizza chain market with 58%* market share• 28%* market share in the full service (pizza and non-pizza) category -
#1 in that space as well
• Multiple sales channels and store formats; Simple operations• Low upfront cost and strong cash generation lead to shorter store-
level payback periods compared to industry
• Extensive track records in food and restaurant operations• Entry of Century Pacific Group as strong and committed shareholders;
Provides synergies with other food businesses
Brand Strength & Ownership
• Well-loved brand with more than 40 years of history in the Philippines• Iconic products served in a distinct store environment• No royalty payments, plus additional revenues from franchising
1
2
3
4
Industry Leading Financials
• Superior profitability and margins versus peers• Gearing levels improved post prepayment of debt c/o IPO proceeds• Cash generative with a negative cash conversion cycle
5
*Source:EuromonitorReportasof2016 4
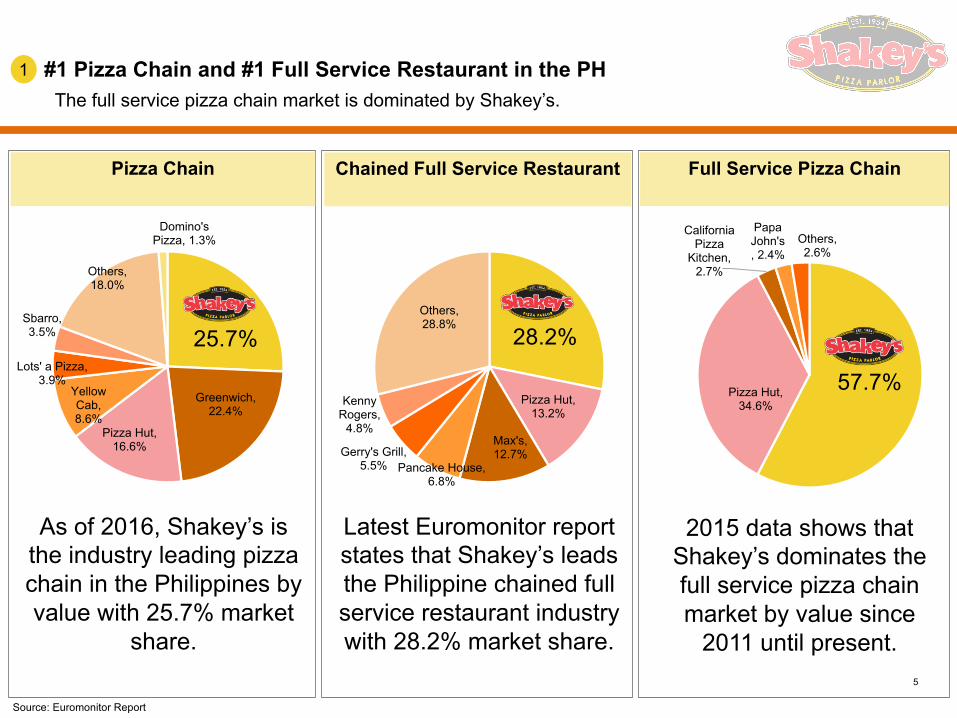
Pizza Hut, 13.2%
Max's, 12.7%
Pancake House, 6.8%
Gerry's Grill, 5.5%
Kenny Rogers,
4.8%
Others, 28.8%
Pizza Hut, 34.6%
California Pizza
Kitchen, 2.7%
Papa John's, 2.4%
Others, 2.6%
#1 Pizza Chain and #1 Full Service Restaurant in the PH
2015 data shows that Shakey’s dominates the full service pizza chain market by value since
2011 until present.
1
Full Service Pizza Chain
Latest Euromonitor report states that Shakey’s leads the Philippine chained full service restaurant industry with 28.2% market share.
Chained Full Service Restaurant
The full service pizza chain market is dominated by Shakey’s.
Pizza Chain
Greenwich, 22.4%
Pizza Hut, 16.6%
Yellow Cab, 8.6%
Lots' a Pizza, 3.9%
Sbarro, 3.5%
Others, 18.0%
Domino's Pizza, 1.3%
25.7%
As of 2016, Shakey’s is the industry leading pizza chain in the Philippines by value with 25.7% market
share.
28.2%
57.7%
5
Source: Euromonitor Report
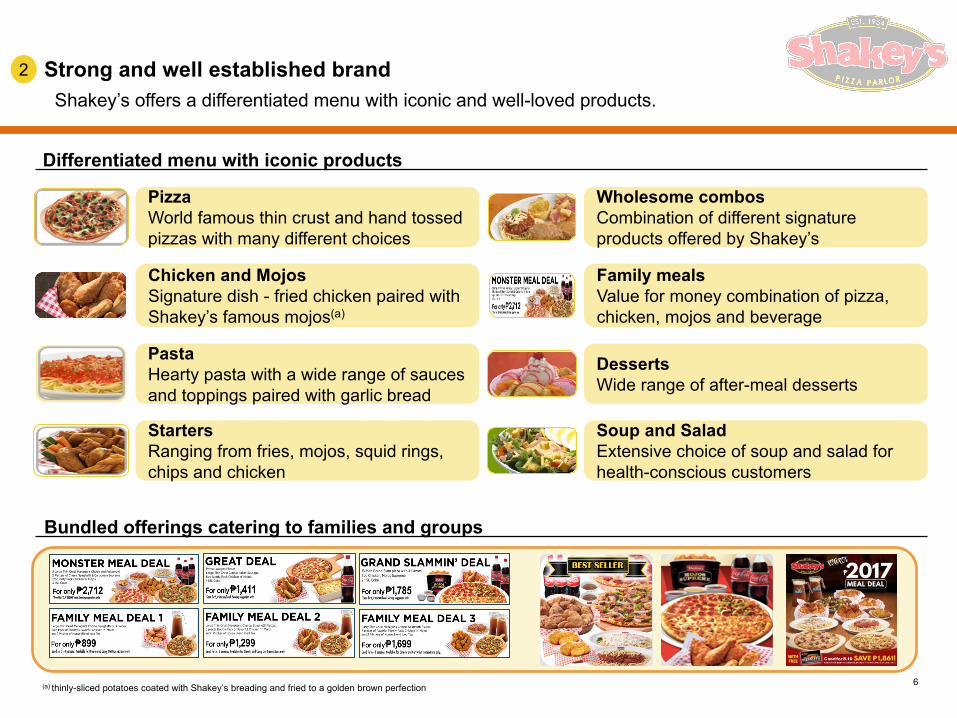
PizzaWorld famous thin crust and hand tossed pizzas with many different choices
Wholesome combosCombination of different signature products offered by Shakey’s
Chicken and MojosSignature dish - fried chicken paired with Shakey’s famous mojos(a)
Family mealsValue for money combination of pizza, chicken, mojos and beverage
PastaHearty pasta with a wide range of sauces and toppings paired with garlic bread
DessertsWide range of after-meal desserts
StartersRanging from fries, mojos, squid rings, chips and chicken
Soup and SaladExtensive choice of soup and salad for health-conscious customers
Bundled offerings catering to families and groups
Differentiated menu with iconic products
Strong and well established brand2
Shakey’s offers a differentiated menu with iconic and well-loved products.
(a) thinly-sliced potatoes coated with Shakey’s breading and fried to a golden brown perfection 6
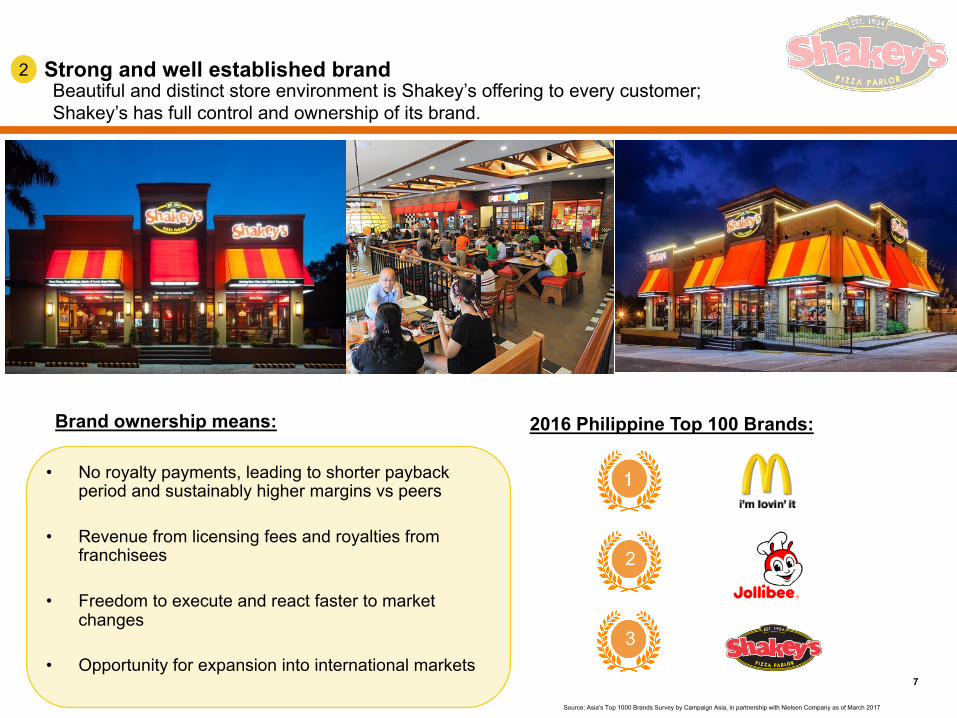
• No royalty payments, leading to shorter payback period and sustainably higher margins vs peers
• Revenue from licensing fees and royalties from franchisees
• Freedom to execute and react faster to market changes
• Opportunity for expansion into international markets
Strong and well established brand2Beautiful and distinct store environment is Shakey’s offering to every customer;Shakey’s has full control and ownership of its brand.
Brand ownership means: 2016 Philippine Top 100 Brands:
Source: Asia’s Top 1000 Brands Survey by Campaign Asia, in partnership with Nielsen Company as of March 2017
77
2
3
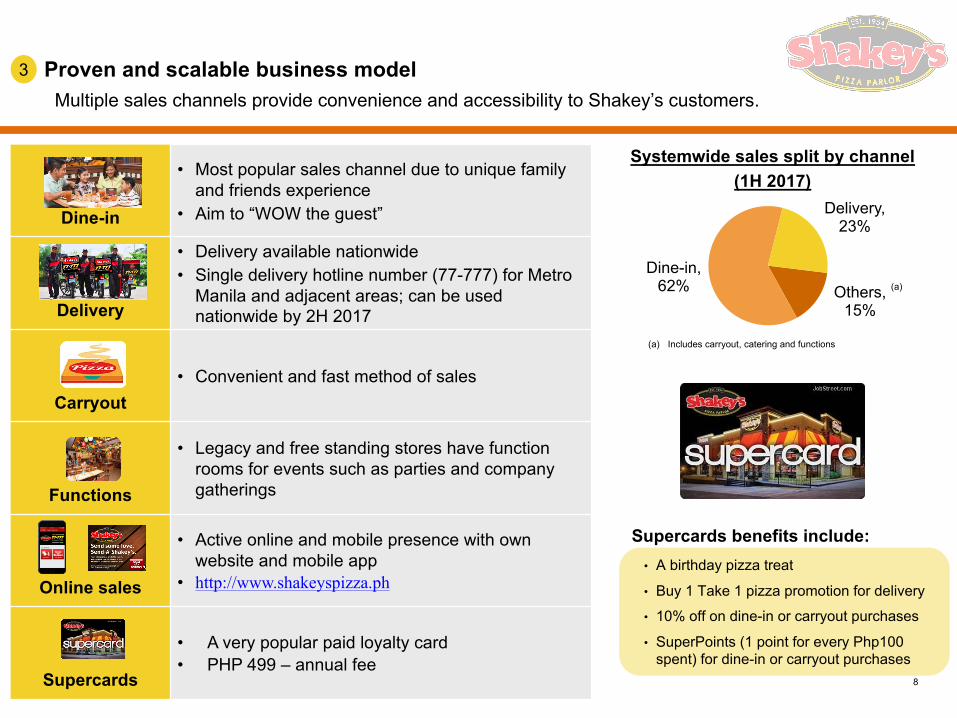
Others, 15%
Dine-in,62%
Delivery, 23%Dine-in
• Most popular sales channel due to unique family and friends experience
• Aim to “WOW the guest”
Delivery
• Delivery available nationwide• Single delivery hotline number (77-777) for Metro
Manila and adjacent areas; can be used nationwide by 2H 2017
Carryout• Convenient and fast method of sales
Functions
• Legacy and free standing stores have function rooms for events such as parties and companygatherings
Online sales
• Active online and mobile presence with own website and mobile app
• http://www.shakeyspizza.ph
Supercards
• A very popular paid loyalty card• PHP 499 – annual fee
(a) Includes carryout, catering and functions
Supercards benefits include:• A birthday pizza treat
• Buy 1 Take 1 pizza promotion for delivery
• 10% off on dine-in or carryout purchases
• SuperPoints (1 point for every Php100 spent) for dine-in or carryout purchases
Systemwide sales split by channel (1H 2017)
(a)
Proven and scalable business model Strong and well established brand3
Multiple sales channels provide convenience and accessibility to Shakey’s customers.
8
9
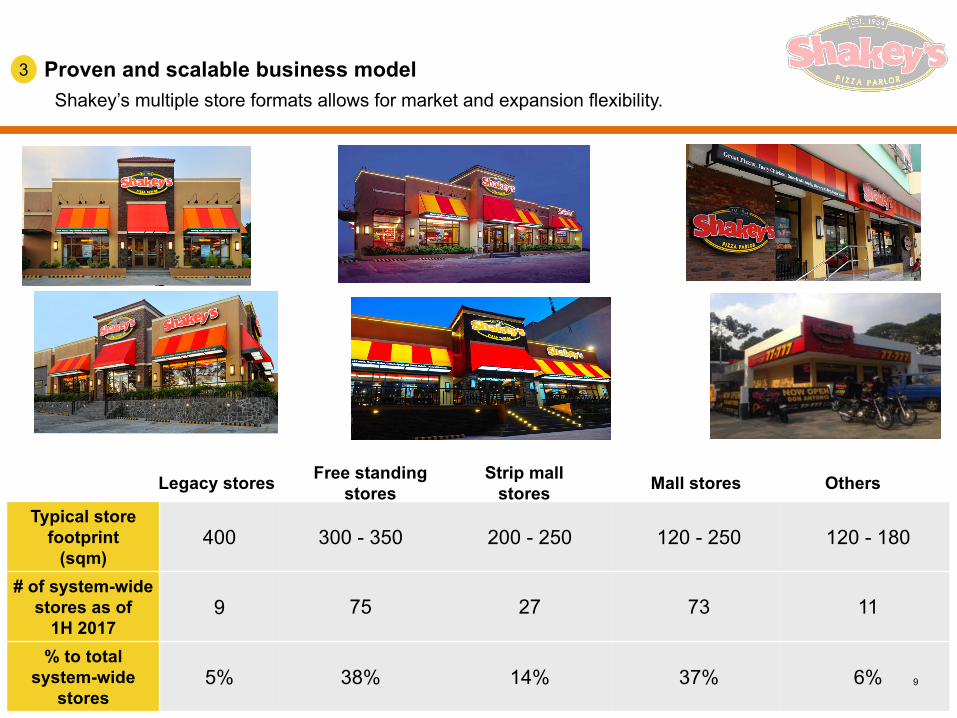
Legacy stores Free standing stores
Strip mall stores Mall stores Others
Typical storefootprint
(sqm)400 300 - 350 200 - 250 120 - 250 120 - 180
# of system-wide stores as of
1H 20179 75 27 73 11
% to total system-wide
stores5% 38% 14% 37% 6%
Proven and scalable business model3
Shakey’s multiple store formats allows for market and expansion flexibility.
9
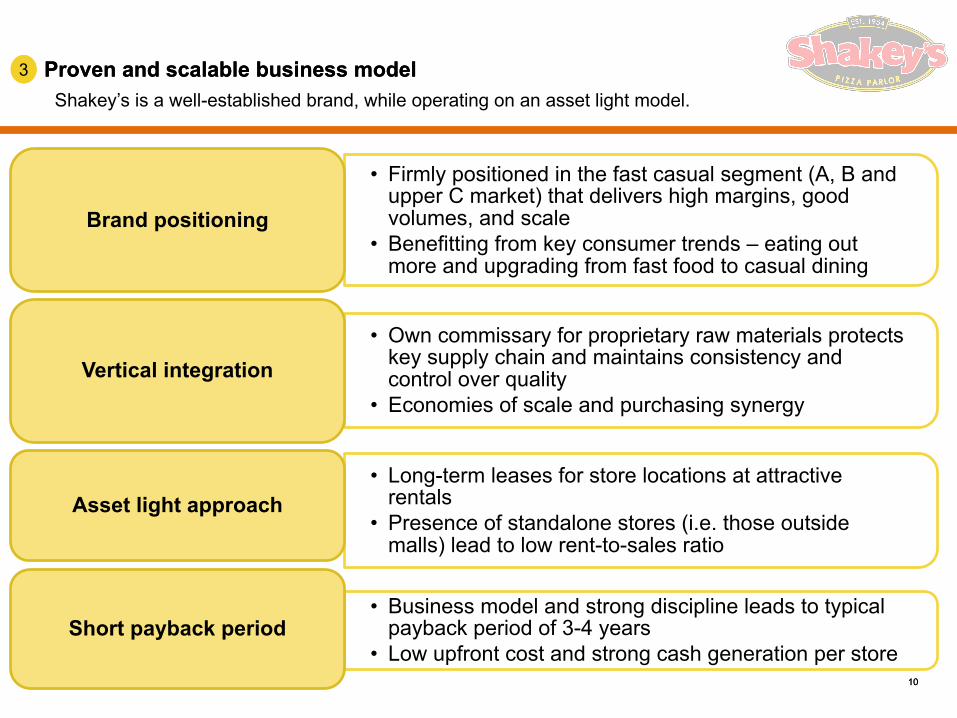
Proven and scalable business model3
• Firmly positioned in the fast casual segment (A, B and upper C market) that delivers high margins, good volumes, and scale
• Benefitting from key consumer trends – eating out more and upgrading from fast food to casual dining
Brand positioning
• Own commissary for proprietary raw materials protects key supply chain and maintains consistency and control over quality
• Economies of scale and purchasing synergyVertical integration
• Long-term leases for store locations at attractive rentals
• Presence of standalone stores (i.e. those outside malls) lead to low rent-to-sales ratio
Asset light approach
• Business model and strong discipline leads to typical payback period of 3-4 years
• Low upfront cost and strong cash generation per storeShort payback period
Proven and scalable business model3
Shakey’s is a well-established brand, while operating on an asset light model.
1010

Vicente L. Gregorio, President & Chief Executive Officer (Age: 51)• Over 30 years of successful experience in the food business• Started career in the first ever Shakey’s branch in the Philippines• Key driver of Shakey’s brand strategy, organisation culture, core values and mission since 2003• Proven management and leadership track record in foodservice retail set-up, expansion and turnaround management
Manuel Del Barrio, Vice-President & Chief Financial Officer (Age: 53)• Previously the Assistant Vice-President for Finance of Century Pacific Food Inc. (CNPF) and Pacific Meat, Inc.• Worked in accounting positions at several leading companies
Jorge Ma. Q. Concepcion, General Manager (Shakey’s Philippines) (Age: 61)• Over 30 years of experience in consumer related business• Significant experience in the US foodservice industry for about 10 years in numerous managerial positions
Alois Brielbeck, General Manager (Commissary) (Age: 56)• Over 30 years of experience in the foodservice business• Moved to Asia in 1986, taking up positions in pastry kitchens in Hong Kong and Tokyo• Moved to the Philippines in 2000 as Chief Operating Officer for Culinary Systems Specialists Incorporated• Appointed as Bakemasters General Manager in 2005
Joseph A. Remsa, Consultant – International Development• Previously the President & CEO of Shakey’s USA• Leading the development and operations of the Shakey’s brands in Asia, Middle East, Australia and New Zealand• Over 25 years of experience leading operations and franchising in top chained restaurants
3 Experienced Management Team4
VISION: to be the LEADING and PREFERRED full service pizza chain restaurant
1111


13
8%Same Store
Sales Growth
18%Systemwide Sales
Growth
120bpsExpansion in
Gross Profit Margin
14%EBITDA Growth
10%Net Income After
Tax Growth
For 1H 2017
*basedonrecurringfinancials
20%RevenueGrowth

In Php Mill
Pro Forma Conso
1H 2016
1H 2017Conso YoY
Total Revenue 2,804 3,377 20.4%
Cost of Sales (1,995) (2,362) 18.4%
Gross Profit 809 1,016 25.5%
Operating expenses (366) (422) 15.4%
Operating Income 444 594 33.9%
Other Income – Net 314 (7) -102.2%
EBITDA 863 676 -21.6%
Interest expense (7) (85) 1174.5%
Net Income 603 371 -38.4%
1H 2017 Summarized P&L
Driven by same store sales growth of 8% and increased
contribution of new stores
Includes build-up of organizational capabilities to
support business expansion
Includes (1) non-recurring items arising from corporate
restructuring & IPO and (2) change in accounting treatment
for service income
Impact of acquisition leveragedrawn on mid 2016
Synergies and price increase in anticipation of higher input costs
Recurring Numbers: Adjusted for one-offs (in Other Income-Net) arising from restructuring & IPO
EBITDA 610 697 14.4%
Net Income 350 386 10.3%*pro-formaassumesacquisitionofsubsidiariesonJan12016
14
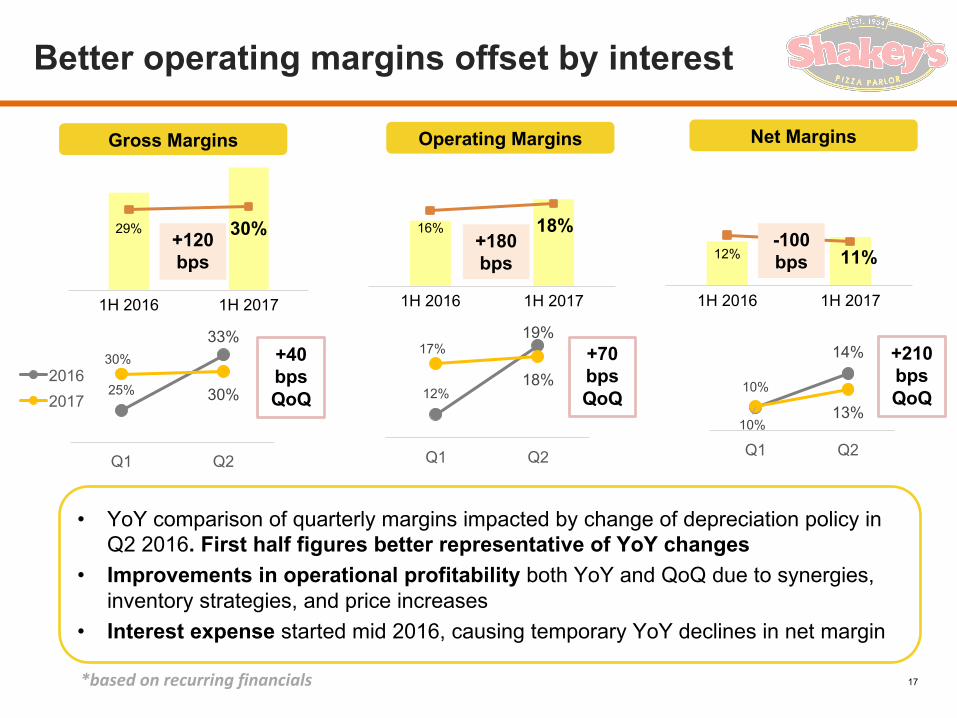
29% 30%
0% 10% 20% 30% 40% 50% 60% 70%
- 200400600800
1,0001,2001,4001,600
1H 2016 1H 2017
16% 18%
0% 5% 10% 15% 20% 25% 30% 35% 40% 45% 50%
- 200
400
600
800
1,000
1,200
1,400
1,600
1H 2016 1H 2017
12% 11%0%
10%
20%
30%
40%
50%
- 200400600800
1,0001,2001,4001,600
1H 2016 1H 2017
+120 bps
+180 bps
-100 bps
Better operating margins offset by interest
+210 bps QoQ
Gross Margins Operating Margins Net Margins
10%
14%
10%13%
Q1 Q2
12%
19%17%
18%
Q1 Q2
• YoY comparison of quarterly margins impacted by change of depreciation policy in Q2 2016. First half figures better representative of YoY changes
• Improvements in operational profitability both YoY and QoQ due to synergies, inventory strategies, and price increases
• Interest expense started mid 2016, causing temporary YoY declines in net margin
+40 bps QoQ
+70 bps QoQ
*basedonrecurringfinancials
25%
33%30%
30%
Q1 Q2
20162017
17

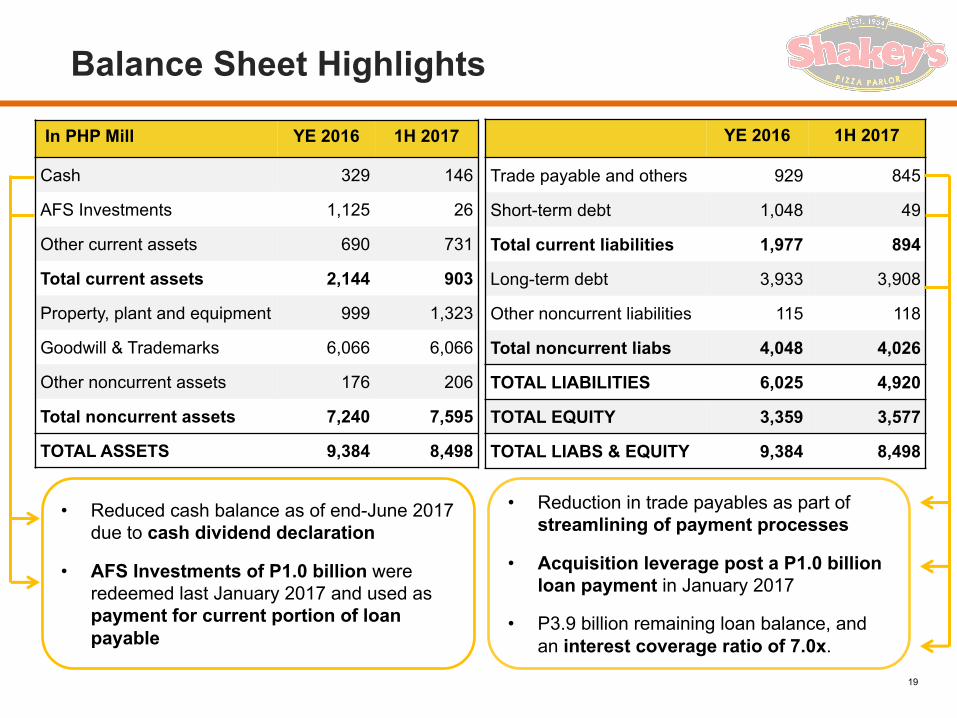
YE 2016 1H 2017
Trade payable and others 929 845
Short-term debt 1,048 49
Total current liabilities 1,977 894
Long-term debt 3,933 3,908
Other noncurrent liabilities 115 118
Total noncurrent liabs 4,048 4,026
TOTAL LIABILITIES 6,025 4,920
TOTAL EQUITY 3,359 3,577
TOTAL LIABS & EQUITY 9,384 8,498
In PHP Mill YE 2016 1H 2017
Cash 329 146
AFS Investments 1,125 26
Other current assets 690 731
Total current assets 2,144 903
Property, plant and equipment 999 1,323
Goodwill & Trademarks 6,066 6,066
Other noncurrent assets 176 206
Total noncurrent assets 7,240 7,595
TOTAL ASSETS 9,384 8,498
Balance Sheet Highlights
• Reduced cash balance as of end-June 2017 due to cash dividend declaration
• AFS Investments of P1.0 billion were redeemed last January 2017 and used as payment for current portion of loan payable
• Reduction in trade payables as part of streamlining of payment processes
• Acquisition leverage post a P1.0 billion loan payment in January 2017
• P3.9 billion remaining loan balance, and an interest coverage ratio of 7.0x.
19
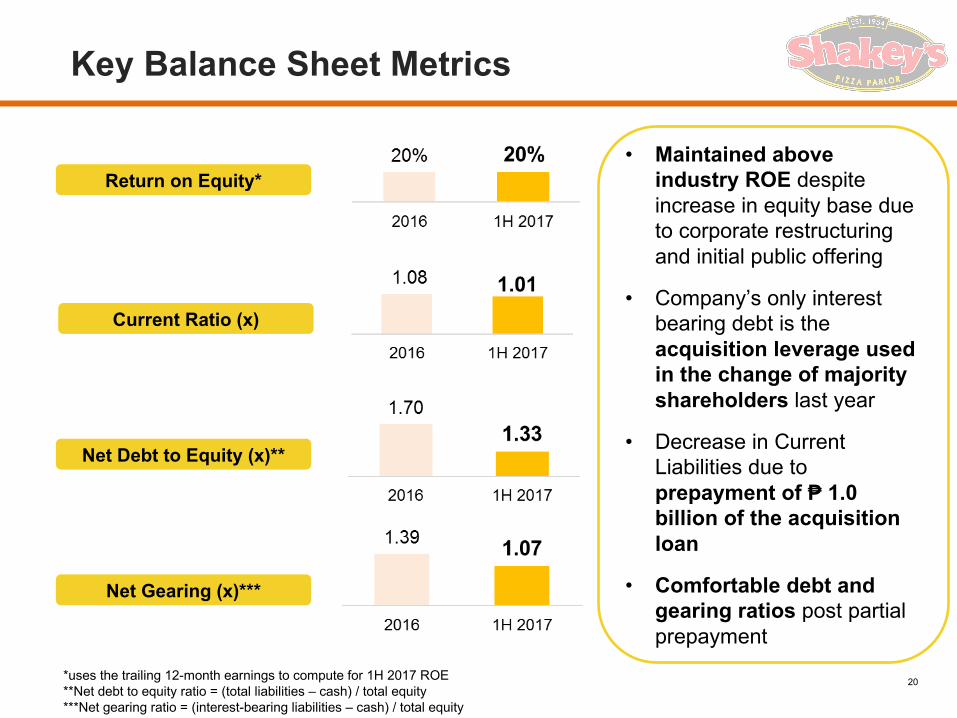
• Maintained above industry ROE despite increase in equity base due to corporate restructuring and initial public offering
• Company’s only interest bearing debt is the acquisition leverage used in the change of majority shareholders last year
• Decrease in Current Liabilities due to prepayment of ₱ 1.0 billion of the acquisition loan
• Comfortable debt and gearing ratios post partial prepayment
Key Balance Sheet Metrics
*uses the trailing 12-month earnings to compute for 1H 2017 ROE**Net debt to equity ratio = (total liabilities – cash) / total equity***Net gearing ratio = (interest-bearing liabilities – cash) / total equity
Return on Equity*
Current Ratio (x)
Net Debt to Equity (x)**
Net Gearing (x)***
20

Capital expenditures for construction of new
stores, a new corporate office and
an expandedcommissary
Cash Flow Highlights
Higher depreciation from store network
expansion, new commissary and HQ
IPO proceeds temporarily invested in money market funds used to prepay loan
In PHP Mill 1H 2016 1H 2017Income before income tax 505 502
Depreciation and amortization 58 89
Interest expense 6 85
Changes in working capital (24) (111)Others (102) (147)Net operating cash flow 444 419CAPEX (183) (413)Redemption of AFS investments 658 1,099 Restructuring Outflow (5,000) 0 Others 12 (15)Net investing cash flow (4,513) 671 Proceeds from / (payment of) loan 4,975 (1,025)Payment of interest 0 (94)Payment of dividends (*2016: pre-acquisition) (987) (153)Net financing cash flow 3,988 (1,272)Beginning Cash 389 329 Change in Cash (81) (182)Ending Cash 308 146 Free Cash Flow 261 5
Interest from P3.9 billion acquisition loan
balance
21
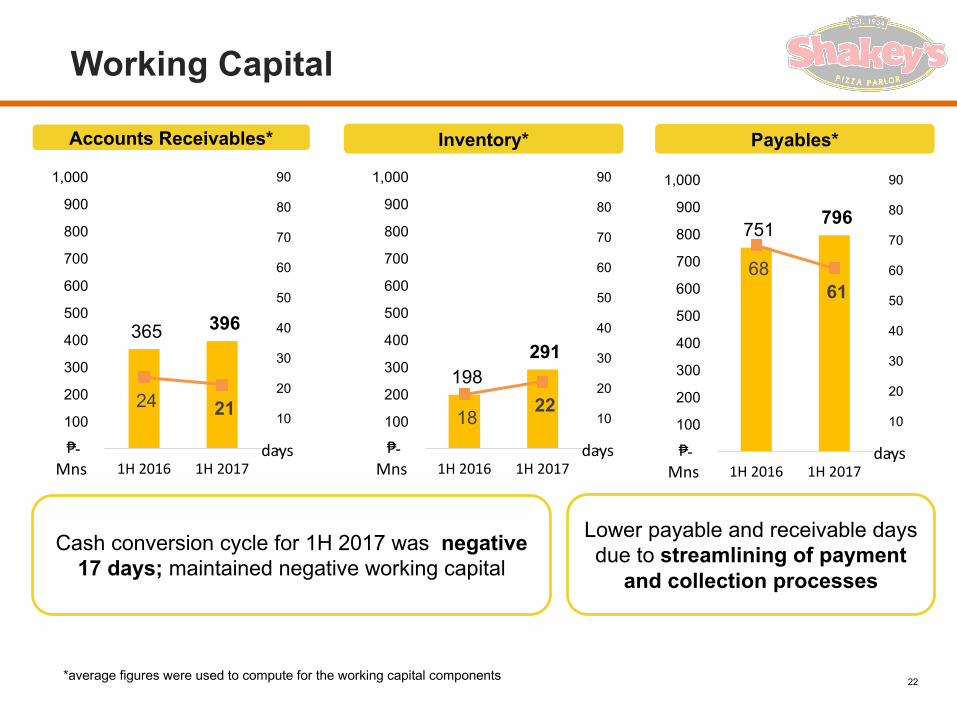
Working Capital
Payables*Inventory*Accounts Receivables*
Cash conversion cycle for 1H 2017 was negative 17 days; maintained negative working capital
Lower payable and receivable days due to streamlining of payment
and collection processes
*average figures were used to compute for the working capital components
365 396
24 21
-
10
20
30
40
50
60
70
80
90
-
100
200
300
400
500
600
700
800
900
1,000
1H2016 1H2017days₱
Mns
198 291
18 22
-
10
20
30
40
50
60
70
80
90
-
100
200
300
400
500
600
700
800
900
1,000
1H2016 1H2017days₱
Mns
751 796
68 61
-
10
20
30
40
50
60
70
80
90
-
100
200
300
400
500
600
700
800
900
1,000
1H2016 1H2017days₱
Mns
22

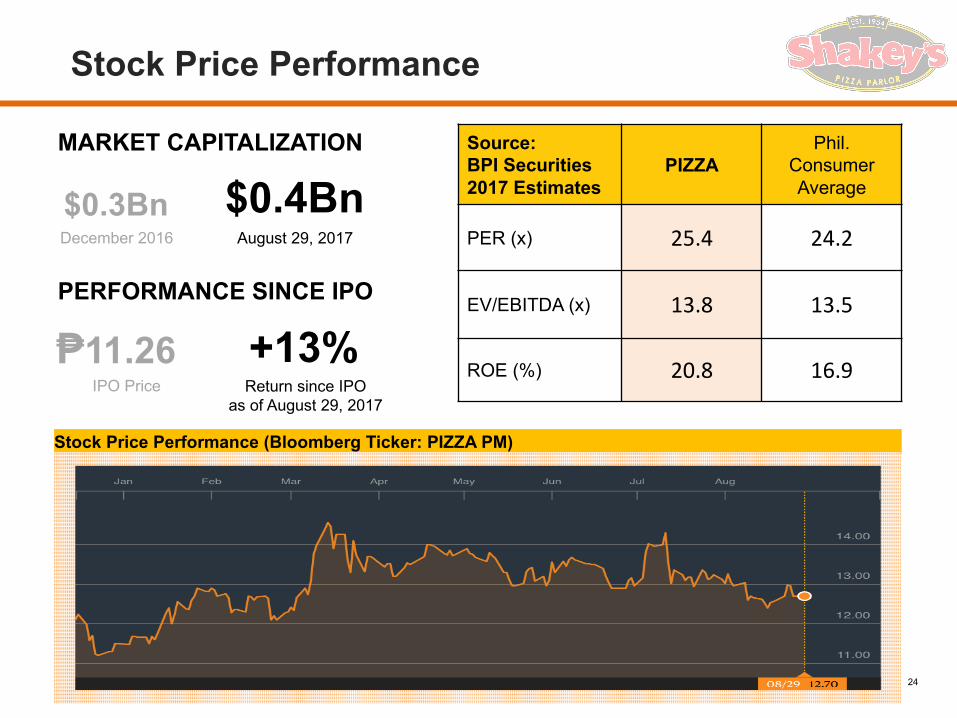
Stock Price Performance
Stock Price Performance (Bloomberg Ticker: PIZZA PM)
Source: BPI Securities2017 Estimates
PIZZAPhil.
Consumer Average
PER (x) 25.4 24.2
EV/EBITDA (x) 13.8 13.5
ROE (%) 20.8 16.9
MARKET CAPITALIZATION
$0.3BnDecember 2016
$0.4BnAugust 29, 2017
PERFORMANCE SINCE IPO
₱11.26IPO Price
+13%Return since IPO
as of August 29, 2017
24
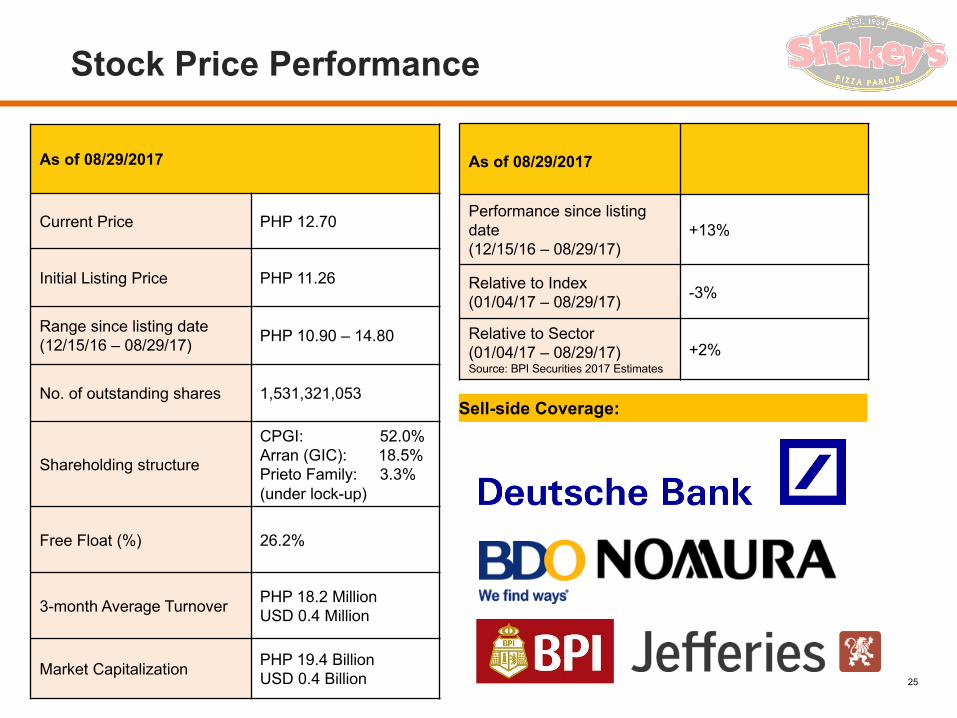
Stock Price Performance
As of 08/29/2017
Current Price PHP 12.70
Initial Listing Price PHP 11.26
Range since listing date (12/15/16 – 08/29/17) PHP 10.90 – 14.80
No. of outstanding shares 1,531,321,053
Shareholding structure
CPGI: 52.0%Arran (GIC): 18.5%Prieto Family: 3.3%(under lock-up)
Free Float (%) 26.2%
3-month Average Turnover PHP 18.2 MillionUSD 0.4 Million
Market Capitalization PHP 19.4 BillionUSD 0.4 Billion
Sell-side Coverage:
As of 08/29/2017
Performance since listing date(12/15/16 – 08/29/17)
+13%
Relative to Index (01/04/17 – 08/29/17) -3%
Relative to Sector(01/04/17 – 08/29/17)Source: BPI Securities 2017 Estimates
+2%
25

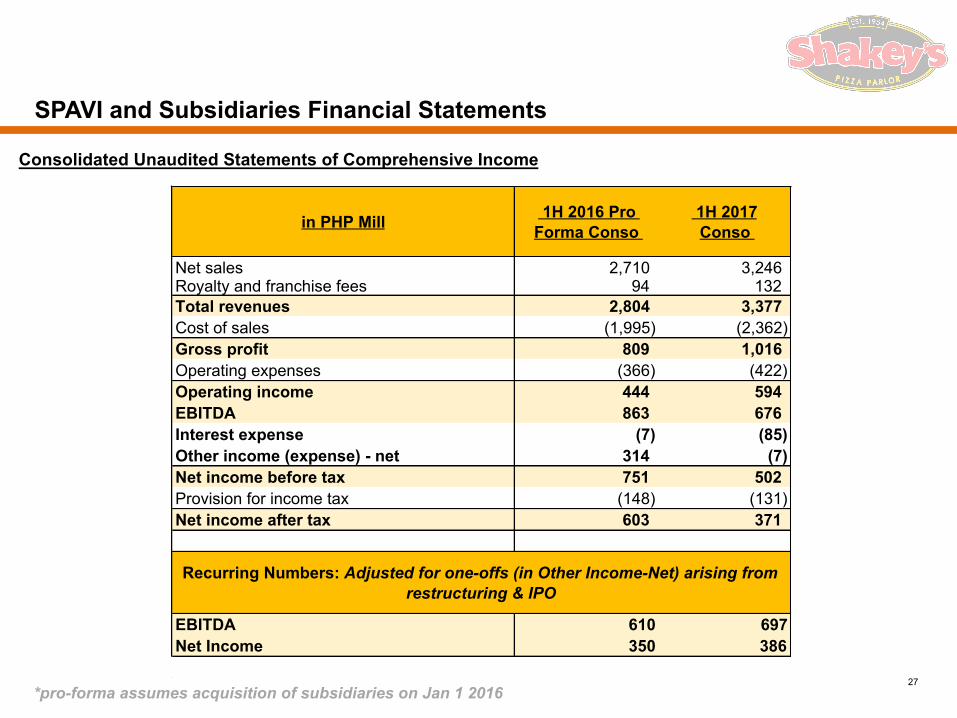
SPAVI and Subsidiaries Financial Statements
Consolidated Unaudited Statements of Comprehensive Income
in PHP Mill 1H 2016 Pro Forma Conso
1H 2017Conso
Net sales 2,710 3,246 Royalty and franchise fees 94 132 Total revenues 2,804 3,377 Cost of sales (1,995) (2,362) Gross profit 809 1,016 Operating expenses (366) (422) Operating income 444 594 EBITDA 863 676 Interest expense (7) (85) Other income (expense) - net 314 (7) Net income before tax 751 502 Provision for income tax (148) (131) Net income after tax 603 371
EBITDA 610 697Net Income 350 386
Recurring Numbers: Adjusted for one-offs (in Other Income-Net) arising from restructuring & IPO
27*pro-forma assumes acquisition of subsidiaries on Jan 1 2016
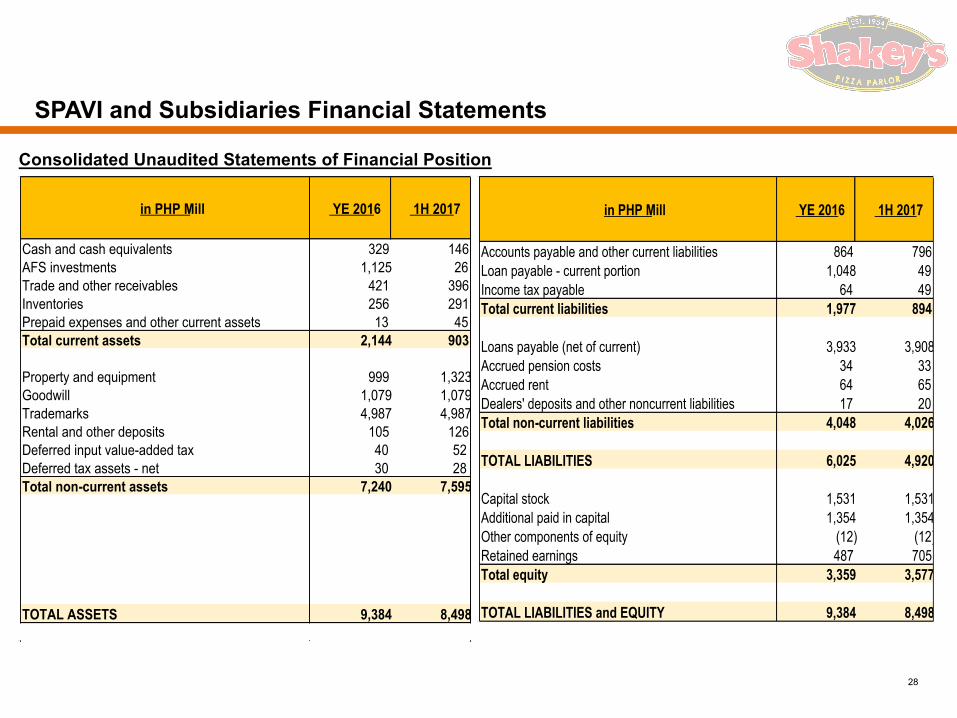
SPAVI and Subsidiaries Financial Statements
Consolidated Unaudited Statements of Financial Position
in PHP Mill YE 2016 1H 2017
Cash and cash equivalents 329 146 AFS investments 1,125 26 Trade and other receivables 421 396 Inventories 256 291 Prepaid expenses and other current assets 13 45 Total current assets 2,144 903
Property and equipment 999 1,323 Goodwill 1,079 1,079 Trademarks 4,987 4,987 Rental and other deposits 105 126 Deferred input value-added tax 40 52Deferred tax assets - net 30 28Total non-current assets 7,240 7,595
TOTAL ASSETS 9,384 8,498
in PHP Mill YE 2016 1H 2017
Accounts payable and other current liabilities 864 796 Loan payable - current portion 1,048 49 Income tax payable 64 49 Total current liabilities 1,977 894
Loans payable (net of current) 3,933 3,908 Accrued pension costs 34 33 Accrued rent 64 65 Dealers' deposits and other noncurrent liabilities 17 20 Total non-current liabilities 4,048 4,026
TOTAL LIABILITIES 6,025 4,920
Capital stock 1,531 1,531 Additional paid in capital 1,354 1,354 Other components of equity (12) (12) Retained earnings 487 705 Total equity 3,359 3,577
TOTAL LIABILITIES and EQUITY 9,384 8,498
28
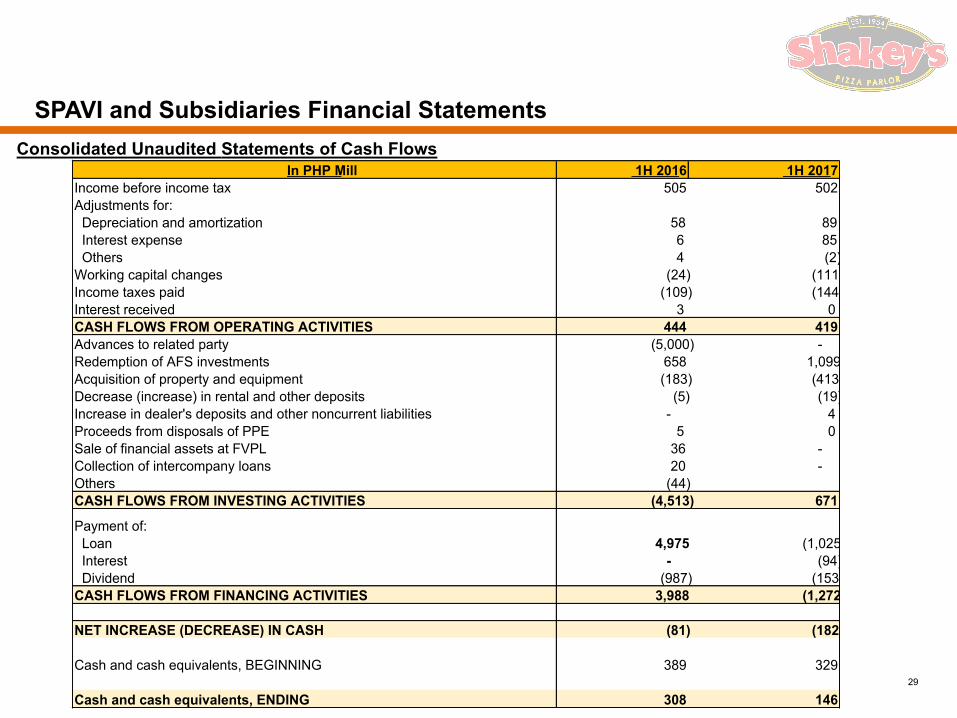
SPAVI and Subsidiaries Financial StatementsConsolidated Unaudited Statements of Cash Flows
29
SirMannySPAVIMancom#s
In PHP Mill 1H 2016 1H 2017 Income before income tax 505 502 Adjustments for: Depreciation and amortization 58 89 Interest expense 6 85 Others 4 (2) Working capital changes (24) (111) Income taxes paid (109) (144) Interest received 3 0 CASH FLOWS FROM OPERATING ACTIVITIES 444 419 Advances to related party (5,000) - Redemption of AFS investments 658 1,099 Acquisition of property and equipment (183) (413) Decrease (increase) in rental and other deposits (5) (19) Increase in dealer's deposits and other noncurrent liabilities - 4 Proceeds from disposals of PPE 5 0 Sale of financial assets at FVPL 36 - Collection of intercompany loans 20 - Others (44) CASH FLOWS FROM INVESTING ACTIVITIES (4,513) 671
Payment of: Loan 4,975 (1,025) Interest - (94) Dividend (987) (153) CASH FLOWS FROM FINANCING ACTIVITIES 3,988 (1,272)
NET INCREASE (DECREASE) IN CASH (81) (182)
Cash and cash equivalents, BEGINNING 389 329
Cash and cash equivalents, ENDING 308 146

This document is highly confidential and being given solely for your information and for your use and may not be, or any portion thereof, shared, copied,reproduced or redistributed to any other person in any manner.
The statements contained in this document speak only as of the date which they are made, and the Company expressly disclaims any obligation orundertaking to supplement, amend or disseminate any updates or revisions to any statements contained herein to reflect any change in events, conditionsor circumstances on which any such statements are based. By preparing this presentation, none of the Company, its management, and their respectiveadvisers undertakes any obligation to provide the recipient with access to any additional information or to update this presentation or any additionalinformation or to correct any inaccuracies in any such information which may become apparent.
This presentation contains statements, including forward-looking statements, based on the currently held beliefs and assumptions of the management ofthe Company, which are expressed in good faith and, in their opinion, reasonable. Forward-looking statements in particular involve known and unknownrisks, uncertainties and other factors, which may cause the actual results, financial condition, performance, or achievements of the Company or industryresults, to differ materially from the results, financial condition, performance or achievements expressed or implied by such forward-looking statements.Given these risks, uncertainties and other factors, recipients of this document are cautioned not to place undue reliance on these forward-lookingstatements.
Any reference herein to "the Company" shall mean, collectively, Shakey’s Pizza Asia Ventures Inc. and its subsidiaries.
SHAKEY’S PIZZA ASIA VENTURES INC.
www.shakeyspizza.ph
http://edge.pse.com.ph/companyInformation/form.do?cmpy_id=664
+632-839-0156
Taguig City, Philippines
30