Embed Size (px)
Citation preview

August 2016
TAB
LE O
F C
ON
TE
NT
S
APS Transportation Demand Management Plan | 3
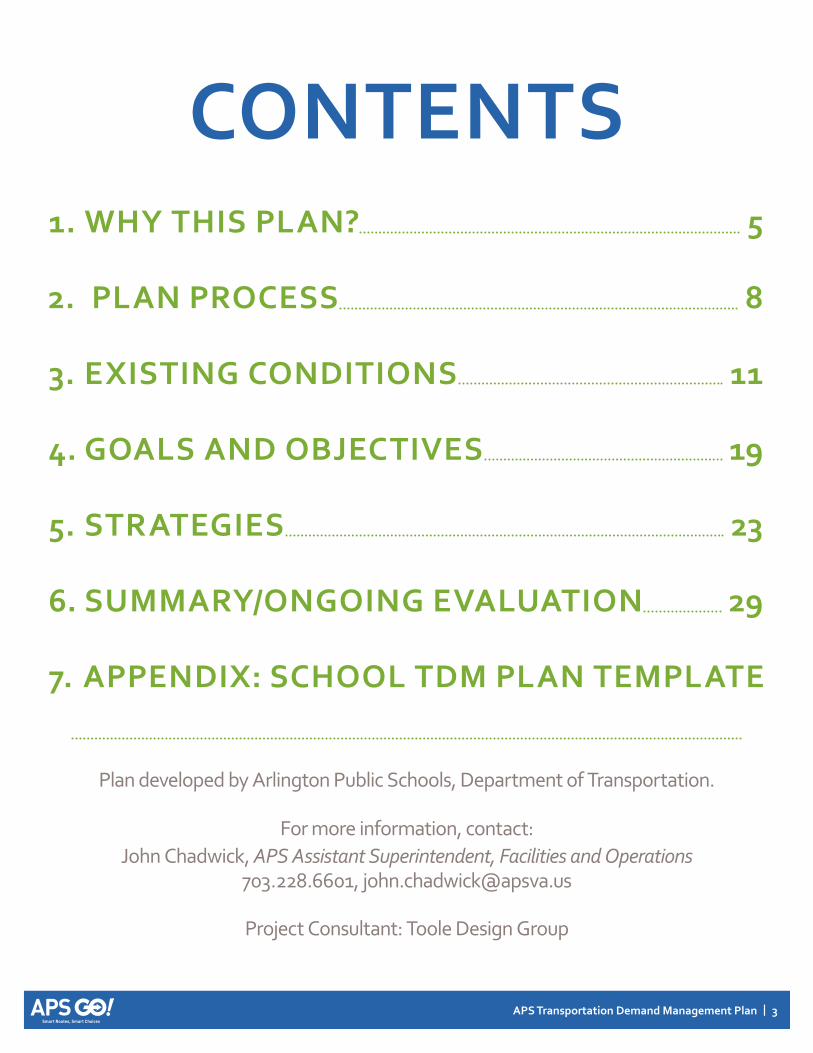
CONTENTS 1. WhY ThiS PLAN? 5
2. PLAN PROCESS 8
3. ExiSTiNg CONDiTiONS 11
4. gOALS AND OBjECTivES 19
5. STRATEgiES 23
6. SUMMARY/ONgOiNg EvALUATiON 29
7. APPENDix: SChOOL TDM PLAN TEMPLATE
Plan developed by Arlington Public Schools, Department of Transportation.
For more information, contact:John Chadwick, APS Assistant Superintendent, Facilities and Operations
703.228.6601, [email protected]
Project Consultant: Toole Design Group
iNT
RO
DU
CT
iON
APS Transportation Demand Management Plan | 5
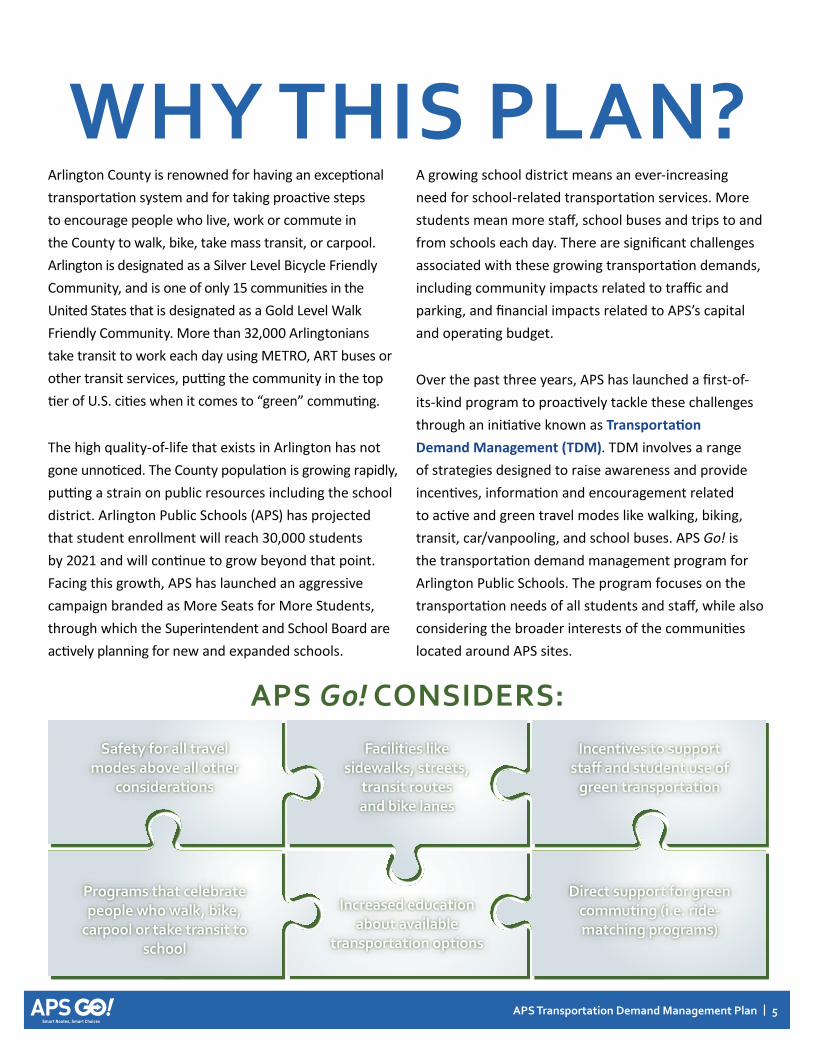
A growing school district means an ever-increasing need for school-related transportation services. More students mean more staff, school buses and trips to and from schools each day. There are significant challenges associated with these growing transportation demands, including community impacts related to traffic and parking, and financial impacts related to APS’s capital and operating budget.
Over the past three years, APS has launched a first-of-its-kind program to proactively tackle these challenges through an initiative known as Transportation Demand Management (TDM). TDM involves a range of strategies designed to raise awareness and provide incentives, information and encouragement related to active and green travel modes like walking, biking, transit, car/vanpooling, and school buses. APS Go! is the transportation demand management program for Arlington Public Schools. The program focuses on the transportation needs of all students and staff, while also considering the broader interests of the communities located around APS sites.
WhY ThiS PLAN?Arlington County is renowned for having an exceptional transportation system and for taking proactive steps to encourage people who live, work or commute in the County to walk, bike, take mass transit, or carpool. Arlington is designated as a Silver Level Bicycle Friendly Community, and is one of only 15 communities in the United States that is designated as a Gold Level Walk Friendly Community. More than 32,000 Arlingtonians take transit to work each day using METRO, ART buses or other transit services, putting the community in the top tier of U.S. cities when it comes to “green” commuting.
The high quality-of-life that exists in Arlington has not gone unnoticed. The County population is growing rapidly, putting a strain on public resources including the school district. Arlington Public Schools (APS) has projected that student enrollment will reach 30,000 students by 2021 and will continue to grow beyond that point. Facing this growth, APS has launched an aggressive campaign branded as More Seats for More Students, through which the Superintendent and School Board are actively planning for new and expanded schools.
APS Go! CONSiDERS:
Safety for all travel modes above all other
considerations
Programs that celebrate people who walk, bike,
carpool or take transit to school
Facilities like sidewalks, streets,
transit routes and bike lanes
increased education about available
transportation options
incentives to support staff and student use of
green transportation
Direct support for green commuting (i.e. ride-matching programs)

6 | APS Transportation Demand Management Plan
Arlington Public Schools views transportation as an integral component of its mission, which is to “instill a love of learning in its students and prepare them to be responsible and productive global citizens.” APS Go! is also aligned with several of APS’s core values, including:
Collaboration. We support relationships among students, staff, families and the community that ensure effective communication and promote opportunities to benefit our students.
Accountability. We take responsibility for our progress through transparent evaluation of student success, staff quality and management of the community’s resources.
Sustainability. We practice stewardship of economic and environmental resources, meeting our current needs without compromising the ability of future generations to meet their needs.
APS Go! is also a reflection of the strong partnership that exists between APS and Arlington County. APS works closely with Arlington County staff and the community to evaluate the transportation system surrounding school sites and to identify possible improvements focused on access and safety. Also, consistent with the County’s Master Transportation Plan, Arlington County requires a site-specific TDM plan as part of each new school design and construction project. APS Go! provides a strategic framework for the entire school district that can inform individual school TDM Plans as well as future programs and projects. It aims to help APS prioritize opportunities related to TDM at a district level, and to prevent each school from having to reinvent the wheel related to TDM plan and program requirements.
APS Transportation Demand Management Plan | 7
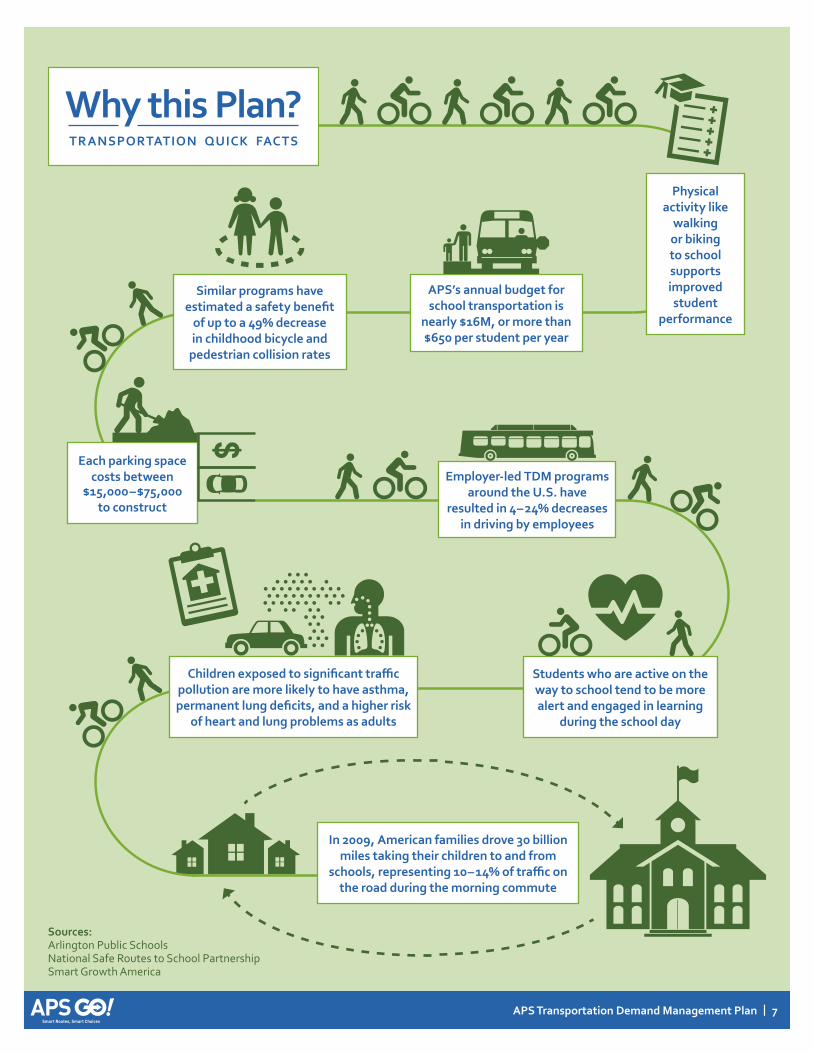
Why this Plan? TR ANSPORTATiON QUiCk FACTS
Sources: Arlington Public Schools National Safe Routes to School Partnership Smart Growth America
Physical activity like
walking or biking to school supports improved student
performance
APS’s annual budget for school transportation is
nearly $16M, or more than $650 per student per year
Similar programs have estimated a safety benefit
of up to a 49% decrease in childhood bicycle and
pedestrian collision rates
Each parking space costs between
$15,000–$75,000 to construct
Employer-led TDM programs around the U.S. have
resulted in 4–24% decreases in driving by employees
Students who are active on the way to school tend to be more alert and engaged in learning
during the school day
Children exposed to significant traffic pollution are more likely to have asthma, permanent lung deficits, and a higher risk
of heart and lung problems as adults
in 2009, American families drove 30 billion miles taking their children to and from
schools, representing 10–14% of traffic on the road during the morning commute

8 | APS Transportation Demand Management Plan
The APS Go! Plan and resulting program were developed through a data-driven process that involved staff, students, parents, school administrators and community members. The first and most intensive phase of the project was an exhaustive analysis of transportation-related data, which was used for the existing conditions analysis presented in the next section. Findings from the existing conditions analysis were used to develop goals, objectives, performance measures and ultimately, recommended strategies. The section below provides more detail about key phases of the process.
1. Analysis of Existing Data and Site Conditions: The project team conducted field work at 41 sites including schools, special programs and administrative offices. Team members analyzed existing data related to school boundaries, arrival/dismissal times, Extended Day and other special programs, transportation budgets, and existing TDM programs.
2. Transportation Surveys of APS Students, Parents and Staff: Four separate surveys were conducted in 2013 and 2014, to gather data about the current travel habits and needs of the APS community. Surveys were administered in online and paper formats, in English and Spanish.
3. National Review of Best Practices: The project team researched other school district and employer-run TDM programs around the country to identify best practices from comparable communities.
4. Greenhouse Gas Emission Analysis: Existing
PLAN PROCESStransportation data was used to conduct a greenhouse gas emission inventory for APS schools and sites.
5. APS Policy Review: The project team reviewed school district policies and goals related to transportation, health, environmental sustainability and safety.
6. Development of Goals and Objectives and Performance Measures: Drawing on examples from other places, the team developed a framework that articulates the objectives of APS Go! and creates a process for tracking progress over time.
7. Development of Strategies: The project team worked closely with APS staff and other partners to identify strategies that will allow APS to accomplish the goals of APS Go!
More information and detailed findings from the phases 1 – 5 are available at https://www.apsva.us/aps-go/.
Project team conducting field work.
APS Transportation Demand Management Plan | 9
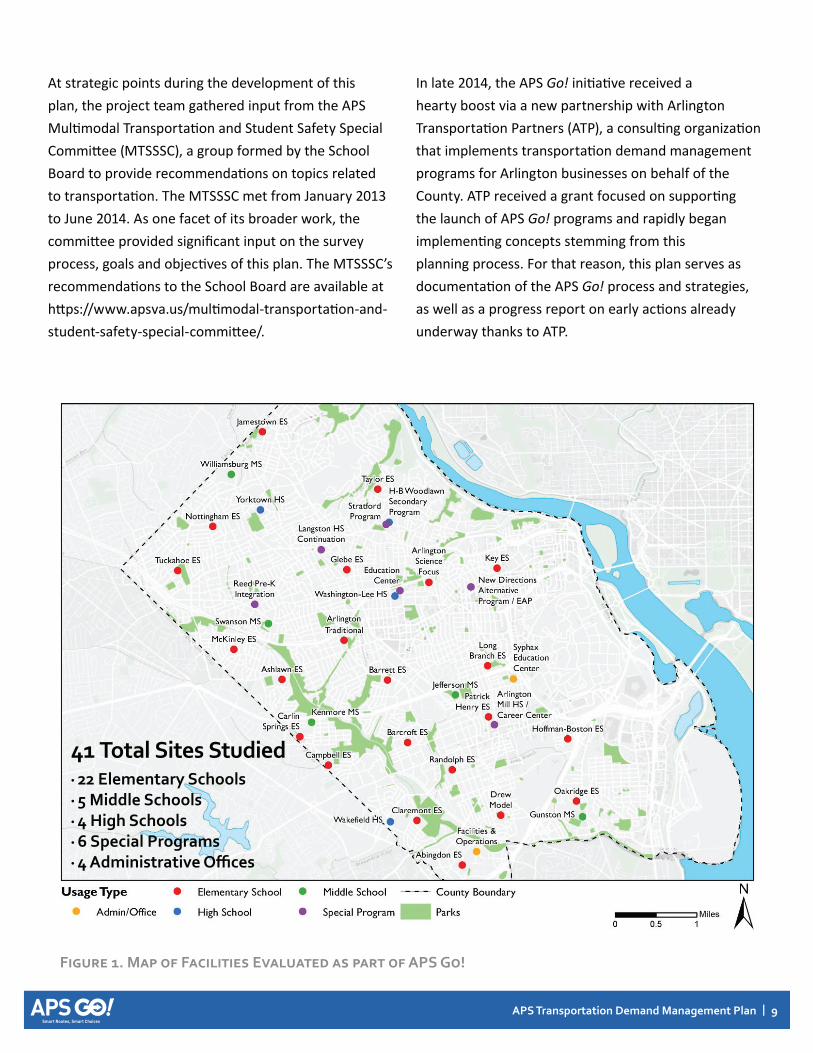
At strategic points during the development of this plan, the project team gathered input from the APS Multimodal Transportation and Student Safety Special Committee (MTSSSC), a group formed by the School Board to provide recommendations on topics related to transportation. The MTSSSC met from January 2013 to June 2014. As one facet of its broader work, the committee provided significant input on the survey process, goals and objectives of this plan. The MTSSSC’s recommendations to the School Board are available at https://www.apsva.us/multimodal-transportation-and-student-safety-special-committee/.
In late 2014, the APS Go! initiative received a hearty boost via a new partnership with Arlington Transportation Partners (ATP), a consulting organization that implements transportation demand management programs for Arlington businesses on behalf of the County. ATP received a grant focused on supporting the launch of APS Go! programs and rapidly began implementing concepts stemming from this planning process. For that reason, this plan serves as documentation of the APS Go! process and strategies, as well as a progress report on early actions already underway thanks to ATP.
41 Total Sites Studied• 22 Elementary Schools• 5 Middle Schools• 4 high Schools• 6 Special Programs• 4 Administrative Offices
Figure 1. Map of Facilities Evaluated as part of APS go!

Ex
iST
iNg
CO
ND
iTiO
NS
APS Transportation Demand Management Plan | 11
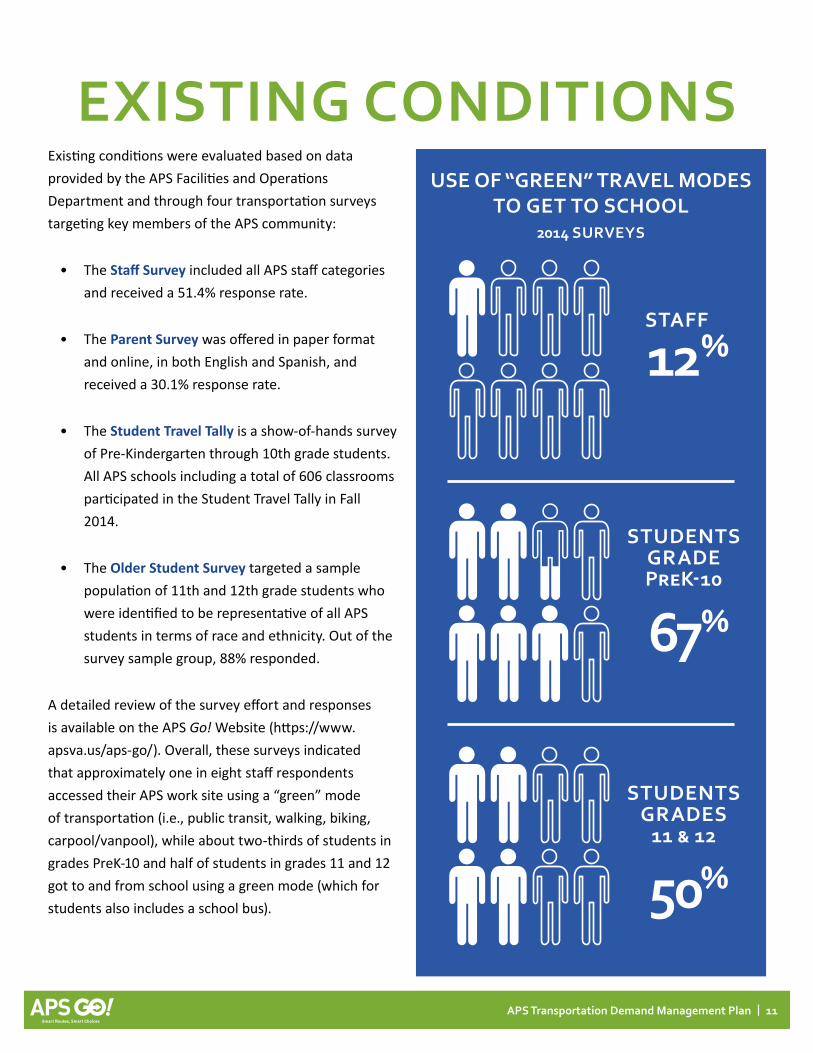
ExiSTiNg CONDiTiONS Existing conditions were evaluated based on data provided by the APS Facilities and Operations Department and through four transportation surveys targeting key members of the APS community:
• The Staff Survey included all APS staff categories and received a 51.4% response rate.
• The Parent Survey was offered in paper format and online, in both English and Spanish, and received a 30.1% response rate.
• The Student Travel Tally is a show-of-hands survey of Pre-Kindergarten through 10th grade students. All APS schools including a total of 606 classrooms participated in the Student Travel Tally in Fall 2014.
• The Older Student Survey targeted a sample population of 11th and 12th grade students who were identified to be representative of all APS students in terms of race and ethnicity. Out of the survey sample group, 88% responded.
A detailed review of the survey effort and responses is available on the APS Go! Website (https://www.apsva.us/aps-go/). Overall, these surveys indicated that approximately one in eight staff respondents accessed their APS work site using a “green” mode of transportation (i.e., public transit, walking, biking, carpool/vanpool), while about two-thirds of students in grades PreK-10 and half of students in grades 11 and 12 got to and from school using a green mode (which for students also includes a school bus).
USE OF “gREEN” TRAvEL MODES TO gET TO SChOOL
2014 SURvEYS
STAFF
STUDENTS gRADE Prek-10
STUDENTS gRADES
11 & 12
12%
67%
50%
12 | APS Transportation Demand Management Plan
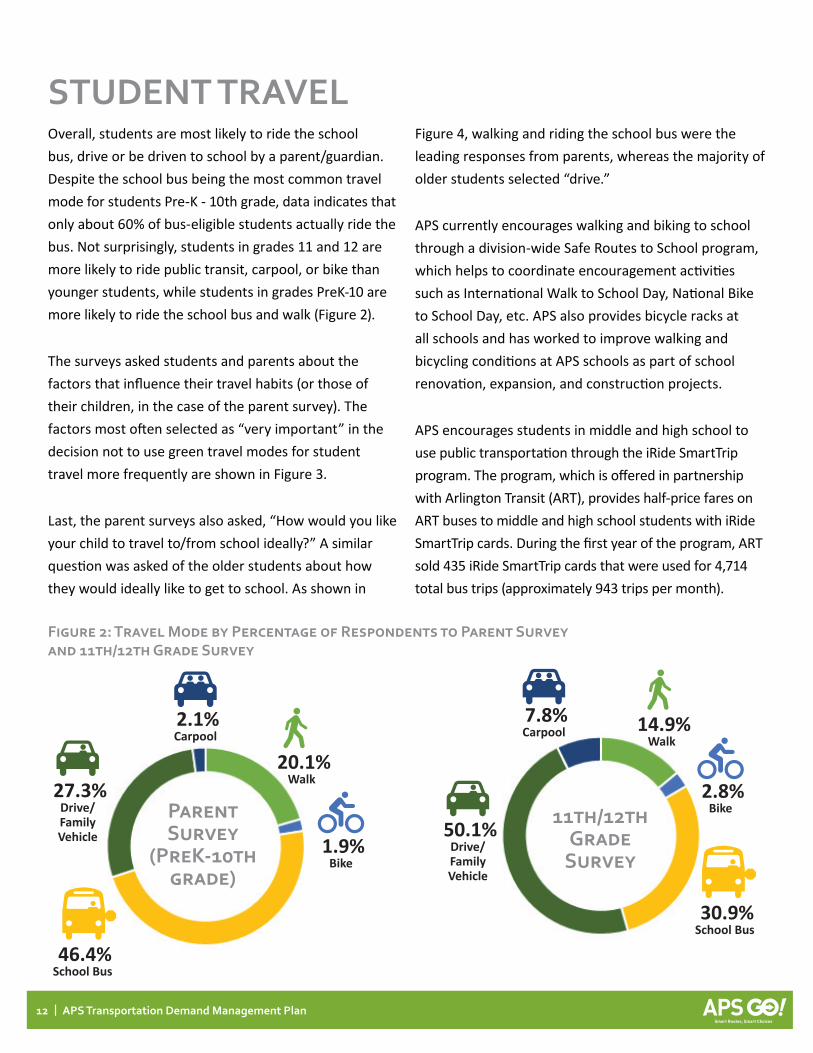
STUDENT TRAvELOverall, students are most likely to ride the school bus, drive or be driven to school by a parent/guardian. Despite the school bus being the most common travel mode for students Pre-K - 10th grade, data indicates that only about 60% of bus-eligible students actually ride the bus. Not surprisingly, students in grades 11 and 12 are more likely to ride public transit, carpool, or bike than younger students, while students in grades PreK-10 are more likely to ride the school bus and walk (Figure 2).
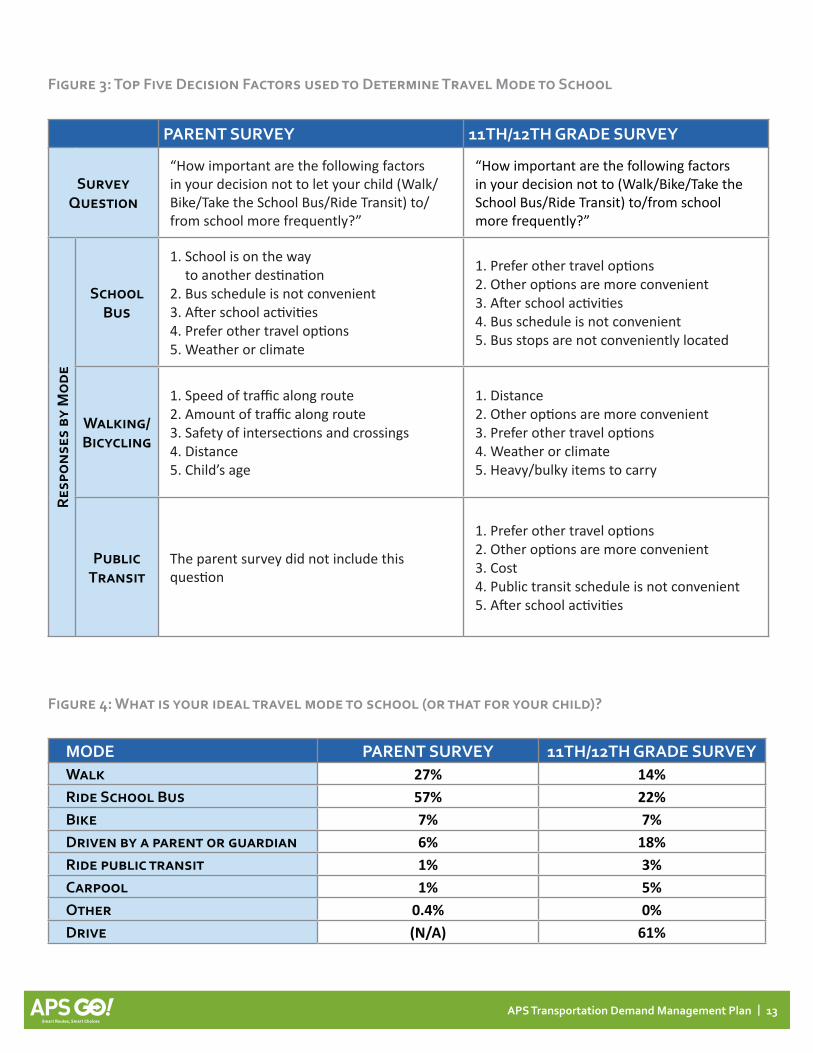
The surveys asked students and parents about the factors that influence their travel habits (or those of their children, in the case of the parent survey). The factors most often selected as “very important” in the decision not to use green travel modes for student travel more frequently are shown in Figure 3.
Last, the parent surveys also asked, “How would you like your child to travel to/from school ideally?” A similar question was asked of the older students about how they would ideally like to get to school. As shown in
Figure 4, walking and riding the school bus were the leading responses from parents, whereas the majority of older students selected “drive.”
APS currently encourages walking and biking to school through a division-wide Safe Routes to School program, which helps to coordinate encouragement activities such as International Walk to School Day, National Bike to School Day, etc. APS also provides bicycle racks at all schools and has worked to improve walking and bicycling conditions at APS schools as part of school renovation, expansion, and construction projects.
APS encourages students in middle and high school to use public transportation through the iRide SmartTrip program. The program, which is offered in partnership with Arlington Transit (ART), provides half-price fares on ART buses to middle and high school students with iRide SmartTrip cards. During the first year of the program, ART sold 435 iRide SmartTrip cards that were used for 4,714 total bus trips (approximately 943 trips per month).
Figure 2: Travel Mode by Percentage of Respondents to Parent Survey and 11th/12th grade Survey
11th/12th grade
Survey
Parent Survey
(Prek-10th grade)
20.1% Walk
14.9% Walk
1.9% Bike
2.8% Bike
46.4% School Bus
30.9% School Bus
27.3% Drive/ Family Vehicle 50.1%
Drive/ Family Vehicle
2.1% Carpool
7.8% Carpool
APS Transportation Demand Management Plan | 13
Figure 3: Top Five Decision Factors used to Determine Travel Mode to School
PARENT SURvEY 11Th/12Th gRADE SURvEY
Survey Question
“How important are the following factors in your decision not to let your child (Walk/Bike/Take the School Bus/Ride Transit) to/from school more frequently?”
“How important are the following factors in your decision not to (Walk/Bike/Take the School Bus/Ride Transit) to/from school more frequently?”
Res
pon
ses
by M
ode
School Bus
1. School is on the way to another destination
2. Bus schedule is not convenient3. After school activities4. Prefer other travel options5. Weather or climate
1. Prefer other travel options2. Other options are more convenient3. After school activities4. Bus schedule is not convenient5. Bus stops are not conveniently located
Walking/Bicycling
1. Speed of traffic along route2. Amount of traffic along route3. Safety of intersections and crossings4. Distance5. Child’s age
1. Distance2. Other options are more convenient3. Prefer other travel options4. Weather or climate5. Heavy/bulky items to carry
Public Transit
The parent survey did not include this question
1. Prefer other travel options2. Other options are more convenient3. Cost4. Public transit schedule is not convenient5. After school activities
Figure 4: What is your ideal travel mode to school (or that for your child)?
MODE PARENT SURvEY 11Th/12Th gRADE SURvEYWalk 27% 14%Ride School Bus 57% 22%Bike 7% 7%Driven by a parent or guardian 6% 18%Ride public transit 1% 3%Carpool 1% 5%Other 0.4% 0%Drive (N/A) 61%
14 | APS Transportation Demand Management Plan
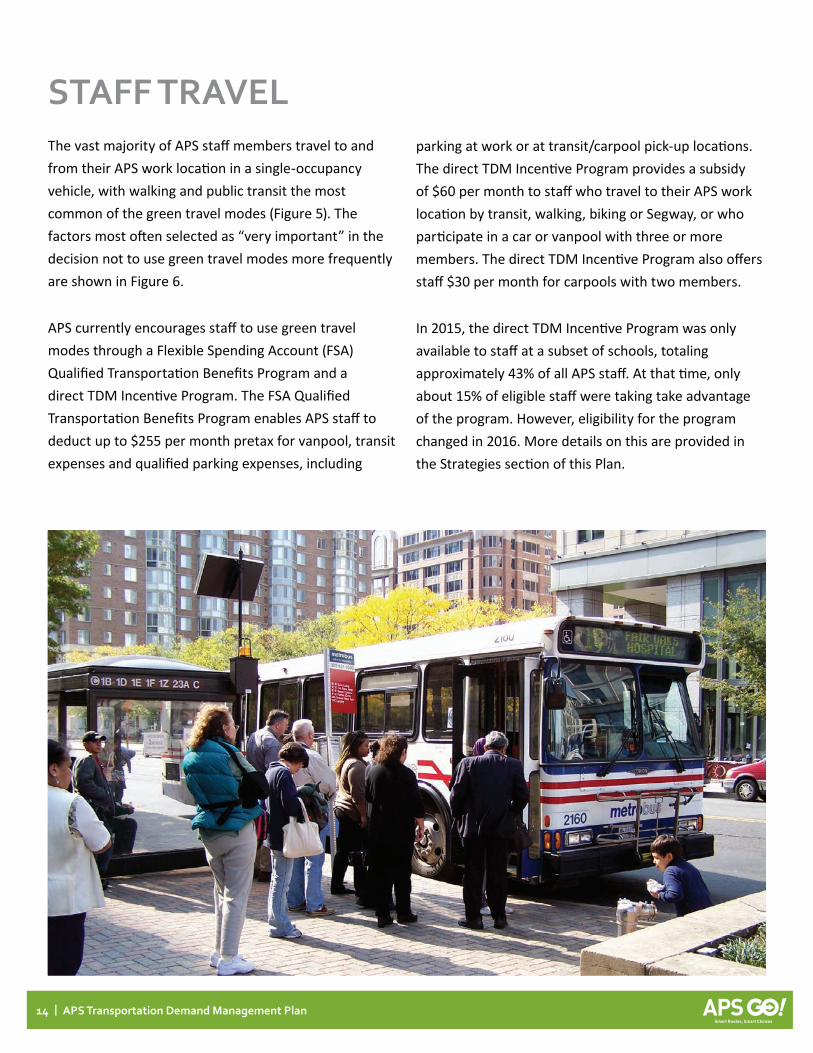
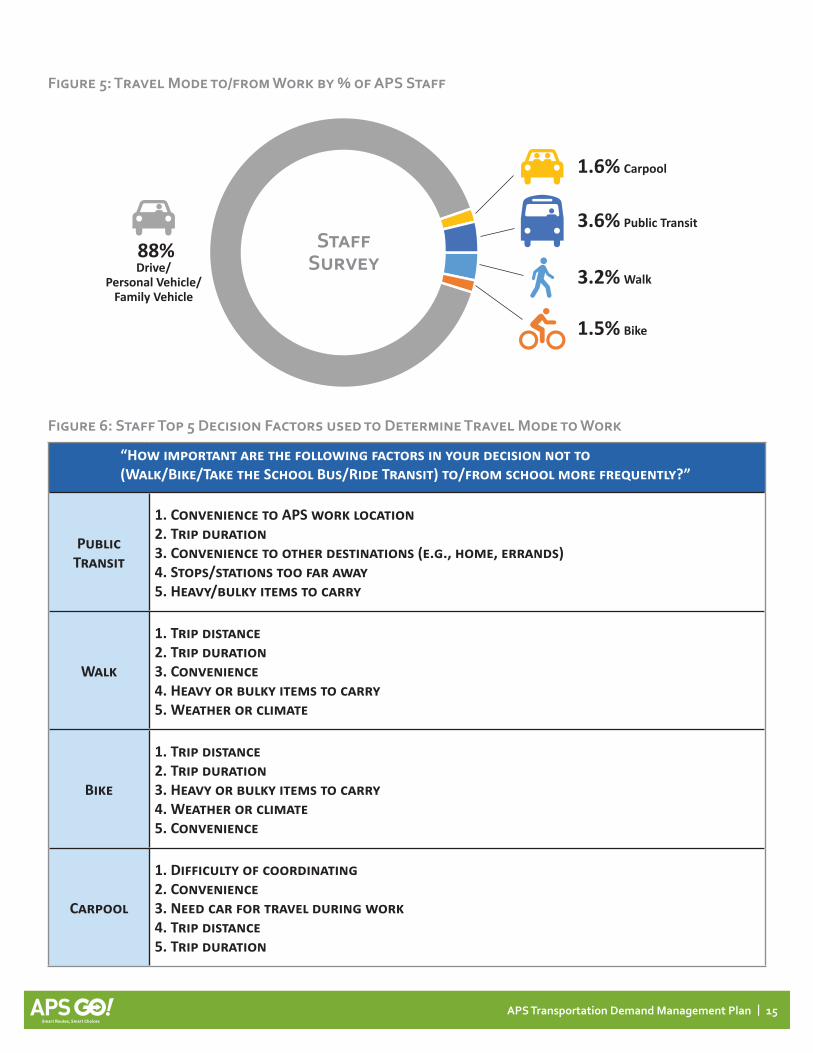
STAFF TRAvELThe vast majority of APS staff members travel to and from their APS work location in a single-occupancy vehicle, with walking and public transit the most common of the green travel modes (Figure 5). The factors most often selected as “very important” in the decision not to use green travel modes more frequently are shown in Figure 6.
APS currently encourages staff to use green travel modes through a Flexible Spending Account (FSA) Qualified Transportation Benefits Program and a direct TDM Incentive Program. The FSA Qualified Transportation Benefits Program enables APS staff to deduct up to $255 per month pretax for vanpool, transit expenses and qualified parking expenses, including
parking at work or at transit/carpool pick-up locations. The direct TDM Incentive Program provides a subsidy of $60 per month to staff who travel to their APS work location by transit, walking, biking or Segway, or who participate in a car or vanpool with three or more members. The direct TDM Incentive Program also offers staff $30 per month for carpools with two members.
In 2015, the direct TDM Incentive Program was only available to staff at a subset of schools, totaling approximately 43% of all APS staff. At that time, only about 15% of eligible staff were taking take advantage of the program. However, eligibility for the program changed in 2016. More details on this are provided in the Strategies section of this Plan.
APS Transportation Demand Management Plan | 15
Staff Survey
Walk
Bike
Drive/Personal Vehicle/Family Vehicle
Carpool
Public Transit
Figure 5: Travel Mode to/from Work by % of APS Staff
“How important are the following factors in your decision not to (Walk/Bike/Take the School Bus/Ride Transit) to/from school more frequently?”
Public Transit
1. Convenience to APS work location2. Trip duration3. Convenience to other destinations (e.g., home, errands)4. Stops/stations too far away5. Heavy/bulky items to carry
Walk
1. Trip distance2. Trip duration 3. Convenience4. Heavy or bulky items to carry5. Weather or climate
Bike
1. Trip distance2. Trip duration 3. Heavy or bulky items to carry4. Weather or climate5. Convenience
Carpool
1. Difficulty of coordinating2. Convenience3. Need car for travel during work4. Trip distance5. Trip duration
Figure 6: Staff Top 5 Decision Factors used to Determine Travel Mode to Work
Staff Survey 88%
Drive/ Personal Vehicle/
Family Vehicle3.2% Walk
1.5% Bike
1.6% Carpool
3.6% Public Transit
16 | APS Transportation Demand Management Plan
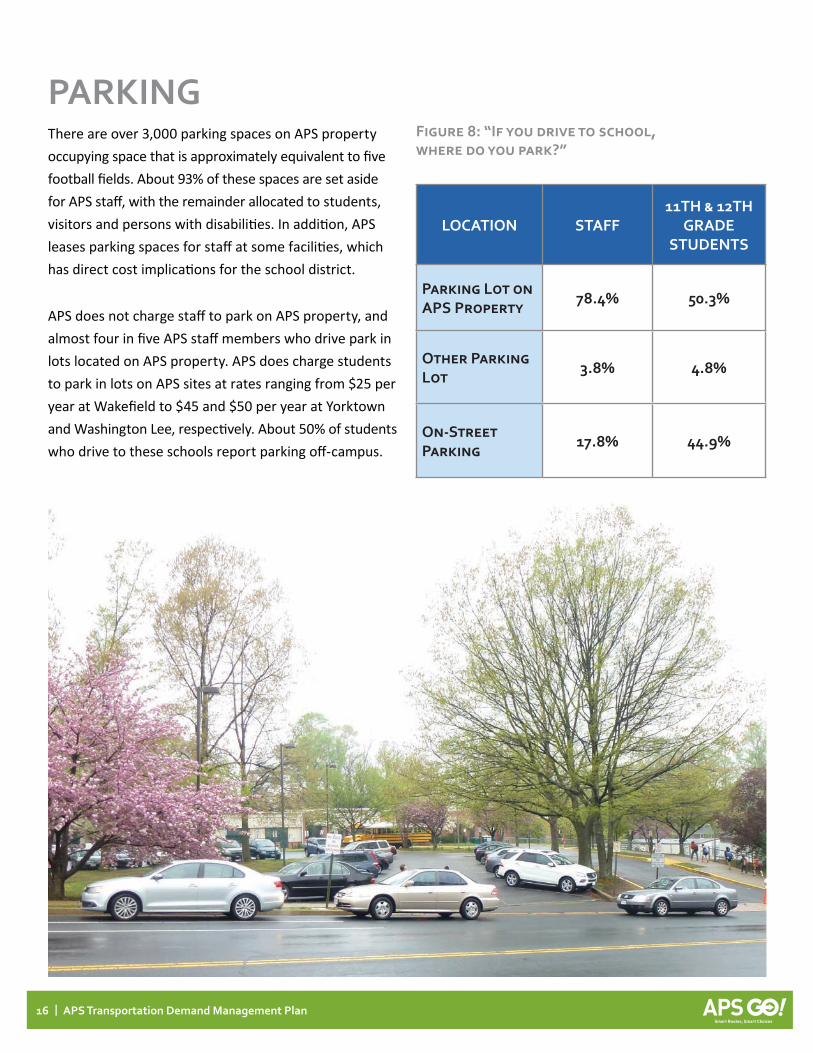
PARkiNgThere are over 3,000 parking spaces on APS property occupying space that is approximately equivalent to five football fields. About 93% of these spaces are set aside for APS staff, with the remainder allocated to students, visitors and persons with disabilities. In addition, APS leases parking spaces for staff at some facilities, which has direct cost implications for the school district.
APS does not charge staff to park on APS property, and almost four in five APS staff members who drive park in lots located on APS property. APS does charge students to park in lots on APS sites at rates ranging from $25 per year at Wakefield to $45 and $50 per year at Yorktown and Washington Lee, respectively. About 50% of students who drive to these schools report parking off-campus.
Figure 8: “if you drive to school, where do you park?”
LOCATiON STAFF11Th & 12Th
gRADE STUDENTS
Parking Lot on APS Property
78.4% 50.3%
Other Parking Lot
3.8% 4.8%
On-Street Parking
17.8% 44.9%

APS Transportation Demand Management Plan | 17
This page intentionally left Blank
gO
ALS
AN
D O
BjE
CTi
vES
APS Transportation Demand Management Plan | 19
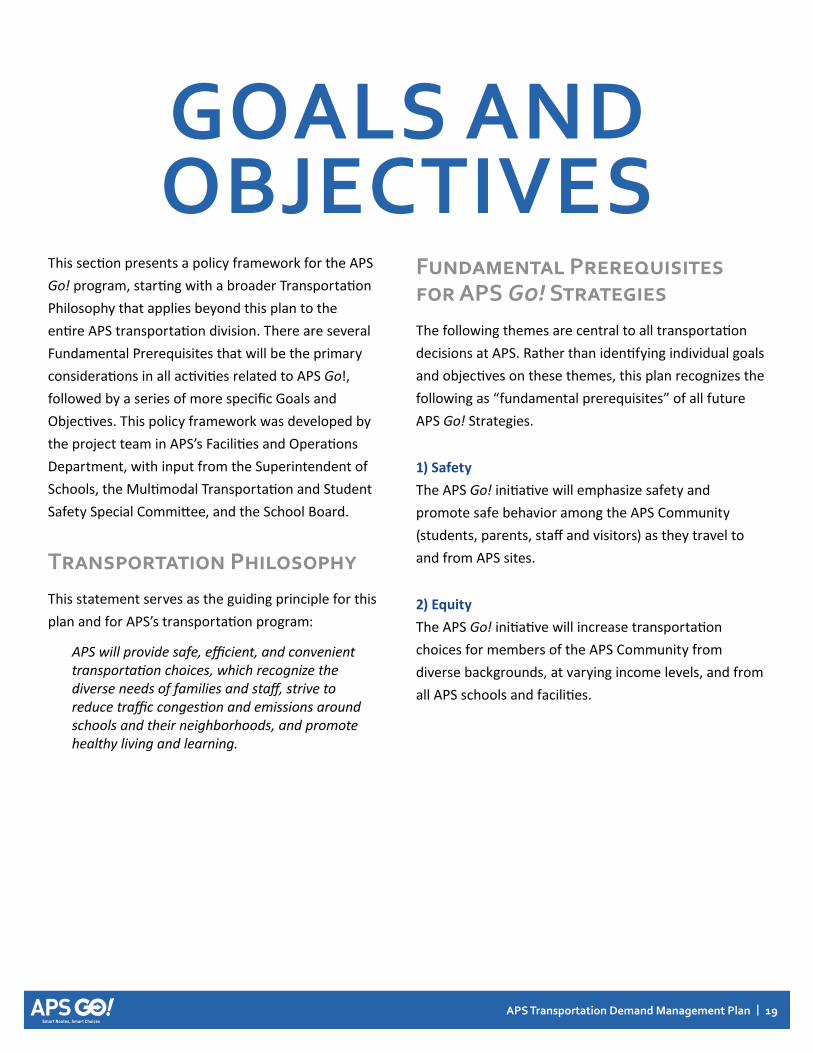
This section presents a policy framework for the APS Go! program, starting with a broader Transportation Philosophy that applies beyond this plan to the entire APS transportation division. There are several Fundamental Prerequisites that will be the primary considerations in all activities related to APS Go!, followed by a series of more specific Goals and Objectives. This policy framework was developed by the project team in APS’s Facilities and Operations Department, with input from the Superintendent of Schools, the Multimodal Transportation and Student Safety Special Committee, and the School Board.
Transportation PhilosophyThis statement serves as the guiding principle for this plan and for APS’s transportation program:
APS will provide safe, efficient, and convenient transportation choices, which recognize the diverse needs of families and staff, strive to reduce traffic congestion and emissions around schools and their neighborhoods, and promote healthy living and learning.
Fundamental Prerequisites for APS Go! StrategiesThe following themes are central to all transportation decisions at APS. Rather than identifying individual goals and objectives on these themes, this plan recognizes the following as “fundamental prerequisites” of all future APS Go! Strategies.
1) Safety The APS Go! initiative will emphasize safety and promote safe behavior among the APS Community (students, parents, staff and visitors) as they travel to and from APS sites.
2) Equity The APS Go! initiative will increase transportation choices for members of the APS Community from diverse backgrounds, at varying income levels, and from all APS schools and facilities.
gOALS AND OBjECTivES

20 | APS Transportation Demand Management Plan
goals and ObjectivesThe following goals are broad statements of what APS aims to achieve through APS Go! Objectives are measurable statements that break down goals into focused areas.
GOAl 1: Maximize sustainable transportation choices while minimizing single-family and single-occupancy vehicle travel.
Objective: Increase awareness of sustainable transportation choices among the APS Community.
Objective: Increase walking, biking and carpooling among those traveling to and from APS facilities.
Objective: Increase school bus utilization by bus-eligible students.
Objective: Increase the use of public transit for travel to and from APS facilities by staff and students.
GOAl 2: Support a culture of multimodal transportation and safe travel behavior.
Objective: Engage with the entire APS Community on transportation issues.
Objective: Increase awareness of and participation in Safe Routes to School programs at APS schools.
Objective: Increase awareness of and participation in staff TDM programs.
Objective: Maximize opportunities to establish lifelong skills and behavior related to sustainable transportation and safe travel.
Objective: Increase collaboration between APS, Arlington County and ART.
GOAl 3: Maximize the value of every dollar spent on transportation.
Objective: Decrease empty seats on school buses.
Objective: Continuously improve the value provided by the APS multimodal transportation system by using data to inform decision-making and planning.
Objective: Develop efficient, clear and measurable organizational practices related to APS Go!
Objective: Develop community partnerships to maximize the benefits and efficiency of the APS multimodal transportation system.
Objective: Reduce parking demand at APS facilities.

APS Transportation Demand Management Plan | 21
This page intentionally left blank
ST
RA
TE
giE
S
APS Transportation Demand Management Plan | 23
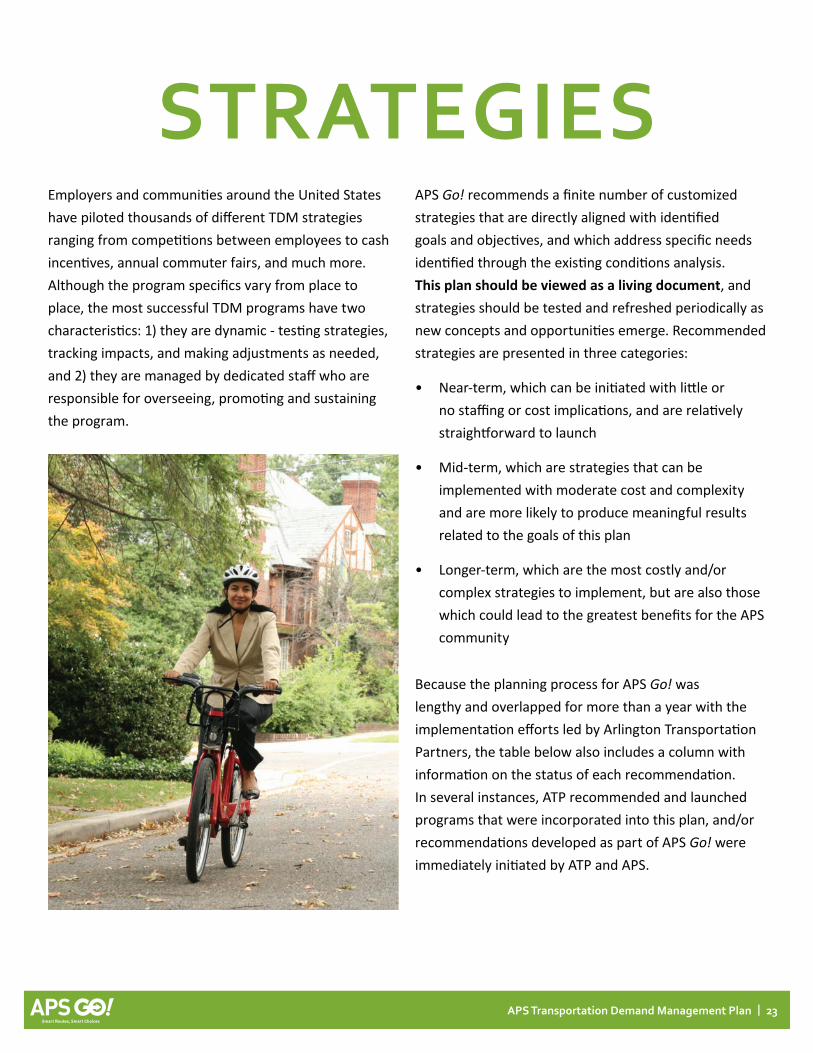
STRATEgiESEmployers and communities around the United States have piloted thousands of different TDM strategies ranging from competitions between employees to cash incentives, annual commuter fairs, and much more. Although the program specifics vary from place to place, the most successful TDM programs have two characteristics: 1) they are dynamic - testing strategies, tracking impacts, and making adjustments as needed, and 2) they are managed by dedicated staff who are responsible for overseeing, promoting and sustaining the program.
APS Go! recommends a finite number of customized strategies that are directly aligned with identified goals and objectives, and which address specific needs identified through the existing conditions analysis. This plan should be viewed as a living document, and strategies should be tested and refreshed periodically as new concepts and opportunities emerge. Recommended strategies are presented in three categories:
• Near-term, which can be initiated with little or no staffing or cost implications, and are relatively straightforward to launch
• Mid-term, which are strategies that can be implemented with moderate cost and complexity and are more likely to produce meaningful results related to the goals of this plan
• Longer-term, which are the most costly and/or complex strategies to implement, but are also those which could lead to the greatest benefits for the APS community
Because the planning process for APS Go! was lengthy and overlapped for more than a year with the implementation efforts led by Arlington Transportation Partners, the table below also includes a column with information on the status of each recommendation. In several instances, ATP recommended and launched programs that were incorporated into this plan, and/or recommendations developed as part of APS Go! were immediately initiated by ATP and APS.

24 | APS Transportation Demand Management Plan
Strategies: Near-TermNear-term strategies are low-to-no cost and focus on leveraging existing programs and resources. Strategies are sorted into categories in terms of relative cost and complexity (NONE, LOW, MED, HIGH) and relative potential to improve safety and/or reduce single-occupancy driving (LOW, MED, HIGH).
Recommended Near-Term TDM Strategies Cost/ Complexity
impact Category
2016 Status
Maintain and grow partnerships with Arlington Transporta-tion Partners and the Metropolitan Washington Council of Governments Commuter Connections program, so that APS employees are aware of and use the many TDM programs and tools already available
LOW MED Underway/ Ongoing
Broaden the eligibility for the existing staff TDM incentive program to include all staff on a first come first served basis (this can be done without increasing the annual budget for the program)
LOW MED Initiated in 2016
Provide support and training to parents on walking school buses and bike trains, with the goal of one at every school LOW HIGH Underway/
Ongoing
Work with ATP and Commuter Connections to develop a customized RideMatch website interface for APS commuters LOW MED Complete
Conduct an annual education effort with staff to promote the Guaranteed Ride Home and RideMatch program offered by Commuter Connections
LOW MED Completed in 2015/16
As part of the APS Safe Routes to School program, support annual participation in International Walk to School Day and Bike to School Day by all schools
LOW LOW Underway/ Ongoing
Ensure 100% participation by schools in the annual Student Travel Tally, which is a “show-of-hands” survey of students’ travel modes
LOW LOWMost schools
participate most years
Use existing communication channels (i.e., NewsCheck) to periodically feature a staff member who uses green travel modes
LOW LOW --
Work with ATP and Commuter Connections to develop a customized SchoolPool website interface for APS student/families looking to find a carpool or “walking school bus”
LOW MED Complete
Conduct an annual education effort with students/parents to promote the SchoolPool program offered by Commuter Connections
LOW MED Completed in 2015/16
Ensure that all schools have kiosks in their front lobby, main office or other prominent location with information on TDM programs for students and staff
LOW MED Partially complete
Partner with Arlington County Police Department to provide trained, uniformed crossing guards at critical school crossings LOW HIGH Underway/
Ongoing

APS Transportation Demand Management Plan | 25
Strategies: Mid-TermMid-term strategies can be implemented with modest cost and complexity, and have greater potential to support use of green transportation compared with near-term strategies. Strategies are sorted into categories in terms of relative cost and complexity and relative potential to improve safety and/or reduce single-occupancy driving.
Recommended Mid-Term TDM Strategies Cost/ Complexity
impact Category
2016 Status
Consider a stipend to support a TDM Coordinator at each APS facility, who would lead the development and implementa-tion of a site-specific TDM plan
MED MED --
Provide priority parking for car/vanpools at all APS sites MED MED Partially complete
Launch a School Champions program that rewards and recognizes schools that launch TDM programs, using a tiered (Silver, Gold, Platinum) award system
MED MED Underway
Partner with Arlington Transportation Partners or other groups to provide staff with educational materials on TDM programs and to offer “commute coaching” at all schools at the beginning of each school year
MED MED Underway
Conduct surveys of staff and parents every two years on travel habits and opinions, and produce a summary report showing changes over time
MED LOW Planned for Fall 2016
Support and expand Safe Routes to School programs at individual schools including walking school buses, bike trains, bike rodeos, etc.
LOW - MED MED Ongoing/ Underway
Consolidate the student parking pass program to improve management and consistency between schools; consider using a portion of revenues to support TDM programs
MED MED --
Partner with Arlington County staff to conduct walk audits at multiple APS schools each year, with the goal of identifying infrastructure improvements to increase pedestrian and bicycle safety (i.e. traffic calming, enhanced crosswalks, etc.)
MED HIGH --
Conduct an audit of bike parking needs for students and staff on all APS sites MED LOW - MED --
Ensure that all schools have a Multimodal Access Map posted on their website, identifying the walk zone, common walk routes, bike lanes and trails, transit stops and possible access barriers
MED LOW-MED Partially complete
Form a subcommittee of the Student Advisory Board to develop programs/campaigns that make green transportation “cool” and reduce the appeal of driving to school
MED LOW-MED --
Collaborate with Arlington County extend iRide cards to all APS students MED MED --

26 | APS Transportation Demand Management Plan
Strategies: Longer-TermLonger-term strategies have higher cost or greater complexity compared to other strategies, but also have significant potential to support increased walking, bicycling, transit/busing and carpooling at APS. Strategies are sorted into categories in terms of relative cost and relative potential to improve safety and/or reduce single-occupancy driving.
Recommended Longer-Term TDM Strategies Cost/ Complexity
impact Category
2016 Status
Hire a full-time TDM Coordinator to lead all promotional, pro-grammatic and data-collection efforts related to APS Go! HIGH HIGH --
As participation in the program grows, increase the budget for the staff TDM incentive program with the goal of supporting participation by 25% of staff and increasing the incentive levels to match that of Arlington County Government (currently twice as high as APS’s incentive amount)
MED – HIGH HIGH --
Consider safe opportunities for walking and biking to school when refining school attendance boundaries HIGH HIGH --
Pursue alignment with ART (Arlington Transit) and STAR (Specialized Transit for Arlington Residents) to support increased transit ridership and efficiency of routes and service
HIGH HIGH --
Form a work group to explore the potential pros and cons of paid parking on APS sites and/or a parking-based financial incentive program
HIGH HIGH --
Provide free bus/transit passes to all APS students HIGH HIGH --
Pursue grant funding and partnerships in order to adopt universal pedestrian and bicycle safety education and skills training as part of student physical education classes; consider classes tailored for Special Education students on transit use as part of Life Skills programming
MED – HIGH HIGH --
Collaborate with Arlington County to allow all APS students to ride ART busses free of charge HIGH HIGH --

APS Transportation Demand Management Plan | 27
This page intentionally left blank
SUM
MA
RY/
O
Ng
OiN
g E
vA
LUA
TiO
N
APS Transportation Demand Management Plan | 29
SUMMARY / ONgOiNg EvALUATiON
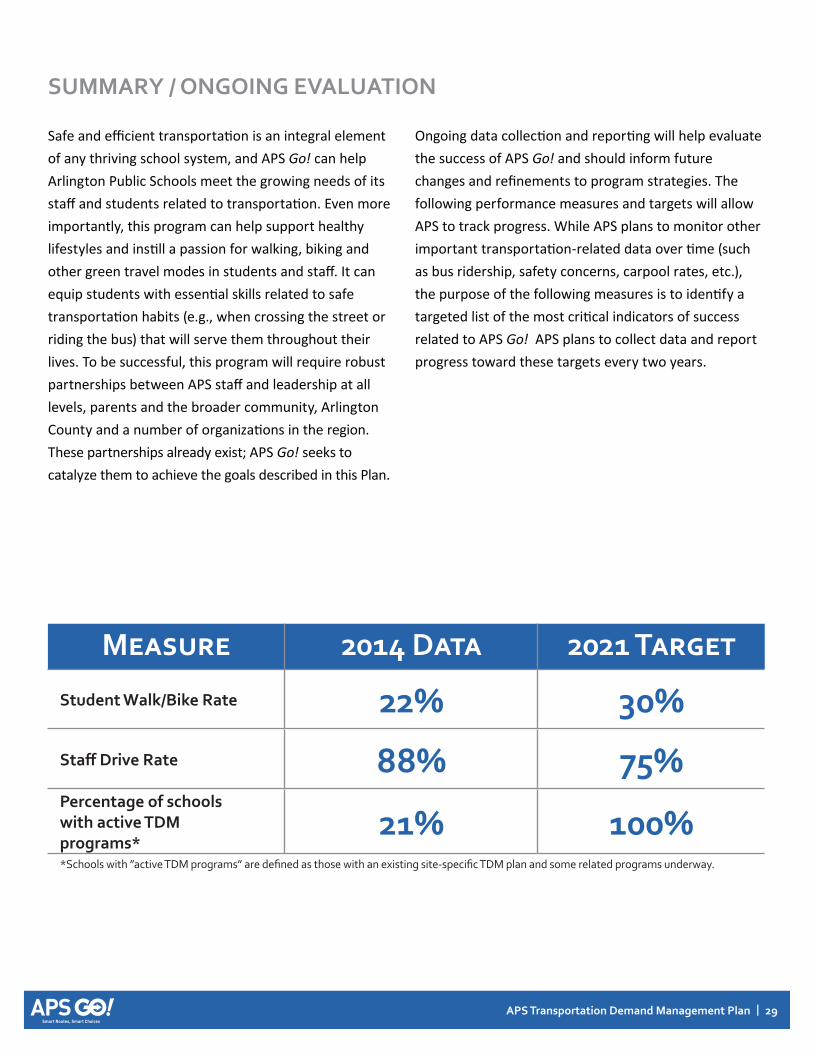
Safe and efficient transportation is an integral element of any thriving school system, and APS Go! can help Arlington Public Schools meet the growing needs of its staff and students related to transportation. Even more importantly, this program can help support healthy lifestyles and instill a passion for walking, biking and other green travel modes in students and staff. It can equip students with essential skills related to safe transportation habits (e.g., when crossing the street or riding the bus) that will serve them throughout their lives. To be successful, this program will require robust partnerships between APS staff and leadership at all levels, parents and the broader community, Arlington County and a number of organizations in the region. These partnerships already exist; APS Go! seeks to catalyze them to achieve the goals described in this Plan.
Ongoing data collection and reporting will help evaluate the success of APS Go! and should inform future changes and refinements to program strategies. The following performance measures and targets will allow APS to track progress. While APS plans to monitor other important transportation-related data over time (such as bus ridership, safety concerns, carpool rates, etc.), the purpose of the following measures is to identify a targeted list of the most critical indicators of success related to APS Go! APS plans to collect data and report progress toward these targets every two years.
Measure 2014 Data 2021 Target
Student Walk/Bike Rate 22% 30%Staff Drive Rate 88% 75%Percentage of schools with active TDM programs*
21% 100%*Schools with ”active TDM programs” are defined as those with an existing site-specific TDM plan and some related programs underway.