Embed Size (px)
Citation preview
In the following report, Hanover Research performs an analysis
of math course-taking patterns of middle and high school
students in Arlington Public Schools (APS).
MATH COURSE SEQUENCING ANALYSIS
Prepared for Arlington Public Schools
October 2019
Hanover Research | October 2019
© 2019 Hanover Research 2
TABLE OF CONTENTS
Executive Summary .......................................................................................................... 3
INTRODUCTION ........................................................................................................................... 3
KEY FINDINGS ............................................................................................................................. 4
Section I: Data Overview and Methodology ..................................................................... 5
DATA OVERVIEW ........................................................................................................................ 5
METHODOLOGY .......................................................................................................................... 7
Section II: Course Trajectory Analysis ............................................................................... 8
MAIN TAKEAWAYS ...................................................................................................................... 8
COMMON MATH TRAJECTORIES ..................................................................................................... 8
COURSE RE-TAKING AND 2-COURSE COMBINATIONS ........................................................................ 13
Section III: Academic Achievement Analysis ................................................................... 20
MAIN TAKEAWAYS .................................................................................................................... 20
MIDDLE SCHOOL TO HIGH SCHOOL MATH ...................................................................................... 20
ACHIEVEMENT BY DEMOGRAPHIC GROUP....................................................................................... 24
Section IV: English Learners and Special Education Students .......................................... 27
MAIN TAKEAWAYS .................................................................................................................... 27
MATH TRAJECTORY AND ACHIEVEMENT ......................................................................................... 27
Hanover Research | October 2019
© 2019 Hanover Research 3
EXECUTIVE SUMMARY
INTRODUCTION
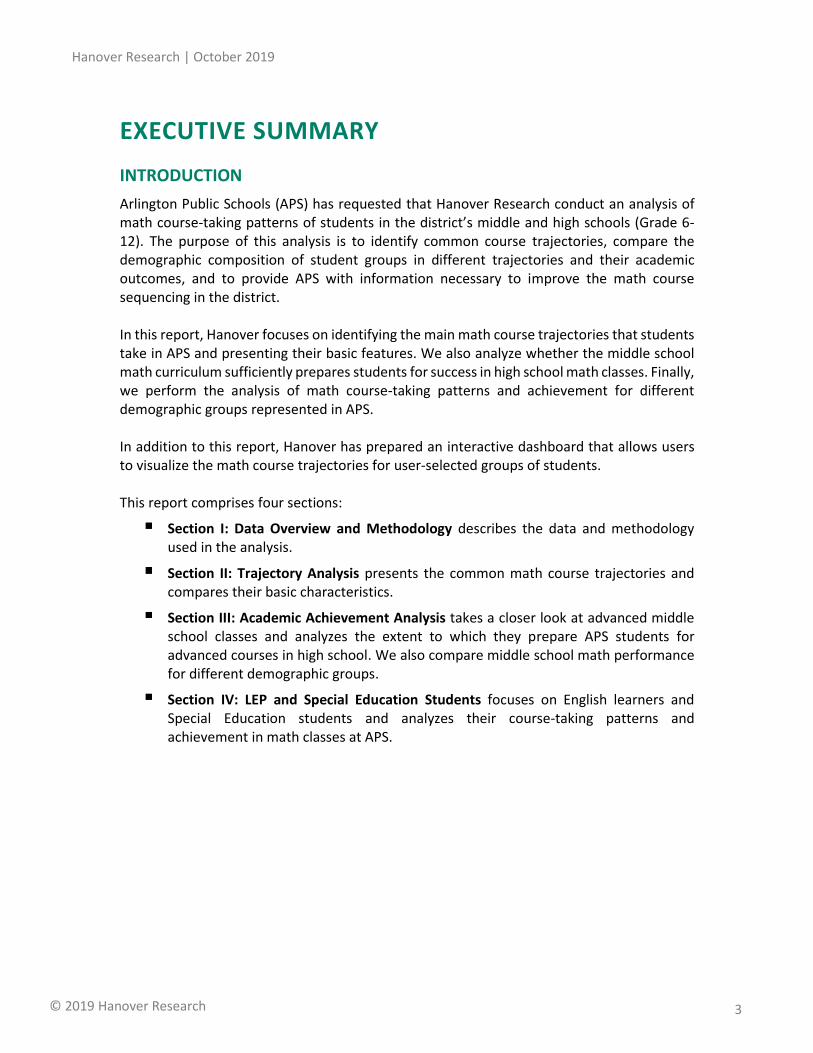
Arlington Public Schools (APS) has requested that Hanover Research conduct an analysis of math course-taking patterns of students in the district’s middle and high schools (Grade 6-12). The purpose of this analysis is to identify common course trajectories, compare the demographic composition of student groups in different trajectories and their academic outcomes, and to provide APS with information necessary to improve the math course sequencing in the district. In this report, Hanover focuses on identifying the main math course trajectories that students take in APS and presenting their basic features. We also analyze whether the middle school math curriculum sufficiently prepares students for success in high school math classes. Finally, we perform the analysis of math course-taking patterns and achievement for different demographic groups represented in APS. In addition to this report, Hanover has prepared an interactive dashboard that allows users to visualize the math course trajectories for user-selected groups of students. This report comprises four sections:
Section I: Data Overview and Methodology describes the data and methodology used in the analysis.
Section II: Trajectory Analysis presents the common math course trajectories and compares their basic characteristics.
Section III: Academic Achievement Analysis takes a closer look at advanced middle school classes and analyzes the extent to which they prepare APS students for advanced courses in high school. We also compare middle school math performance for different demographic groups.
Section IV: LEP and Special Education Students focuses on English learners and Special Education students and analyzes their course-taking patterns and achievement in math classes at APS.
Hanover Research | October 2019
© 2019 Hanover Research 4
KEY FINDINGS
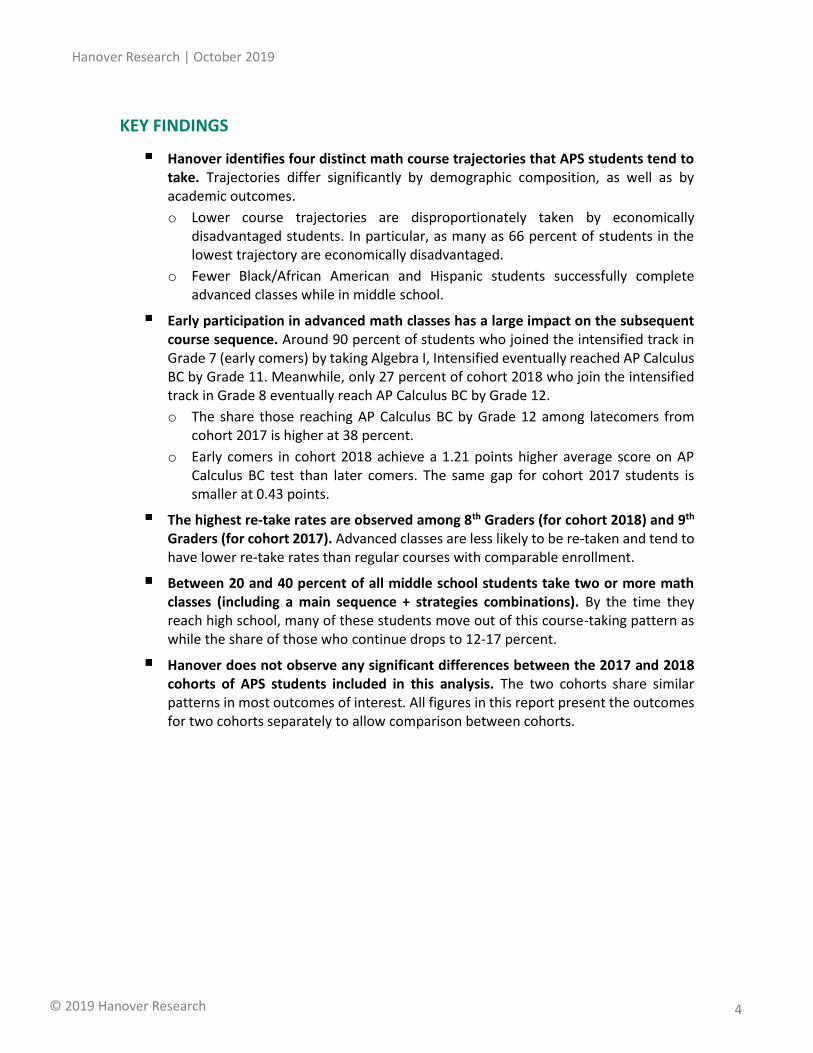
Hanover identifies four distinct math course trajectories that APS students tend to take. Trajectories differ significantly by demographic composition, as well as by academic outcomes.
o Lower course trajectories are disproportionately taken by economically disadvantaged students. In particular, as many as 66 percent of students in the lowest trajectory are economically disadvantaged.
o Fewer Black/African American and Hispanic students successfully complete advanced classes while in middle school.
Early participation in advanced math classes has a large impact on the subsequent course sequence. Around 90 percent of students who joined the intensified track in Grade 7 (early comers) by taking Algebra I, Intensified eventually reached AP Calculus BC by Grade 11. Meanwhile, only 27 percent of cohort 2018 who join the intensified track in Grade 8 eventually reach AP Calculus BC by Grade 12.
o The share those reaching AP Calculus BC by Grade 12 among latecomers from cohort 2017 is higher at 38 percent.
o Early comers in cohort 2018 achieve a 1.21 points higher average score on AP Calculus BC test than later comers. The same gap for cohort 2017 students is smaller at 0.43 points.
The highest re-take rates are observed among 8th Graders (for cohort 2018) and 9th Graders (for cohort 2017). Advanced classes are less likely to be re-taken and tend to have lower re-take rates than regular courses with comparable enrollment.
Between 20 and 40 percent of all middle school students take two or more math classes (including a main sequence + strategies combinations). By the time they reach high school, many of these students move out of this course-taking pattern as while the share of those who continue drops to 12-17 percent.
Hanover does not observe any significant differences between the 2017 and 2018 cohorts of APS students included in this analysis. The two cohorts share similar patterns in most outcomes of interest. All figures in this report present the outcomes for two cohorts separately to allow comparison between cohorts.
Hanover Research | October 2019
© 2019 Hanover Research 5
SECTION I: DATA OVERVIEW AND METHODOLOGY
In this section, Hanover describes the data provided by APS for this analysis, as well as the methodology employed to address the district’s research questions.
DATA OVERVIEW
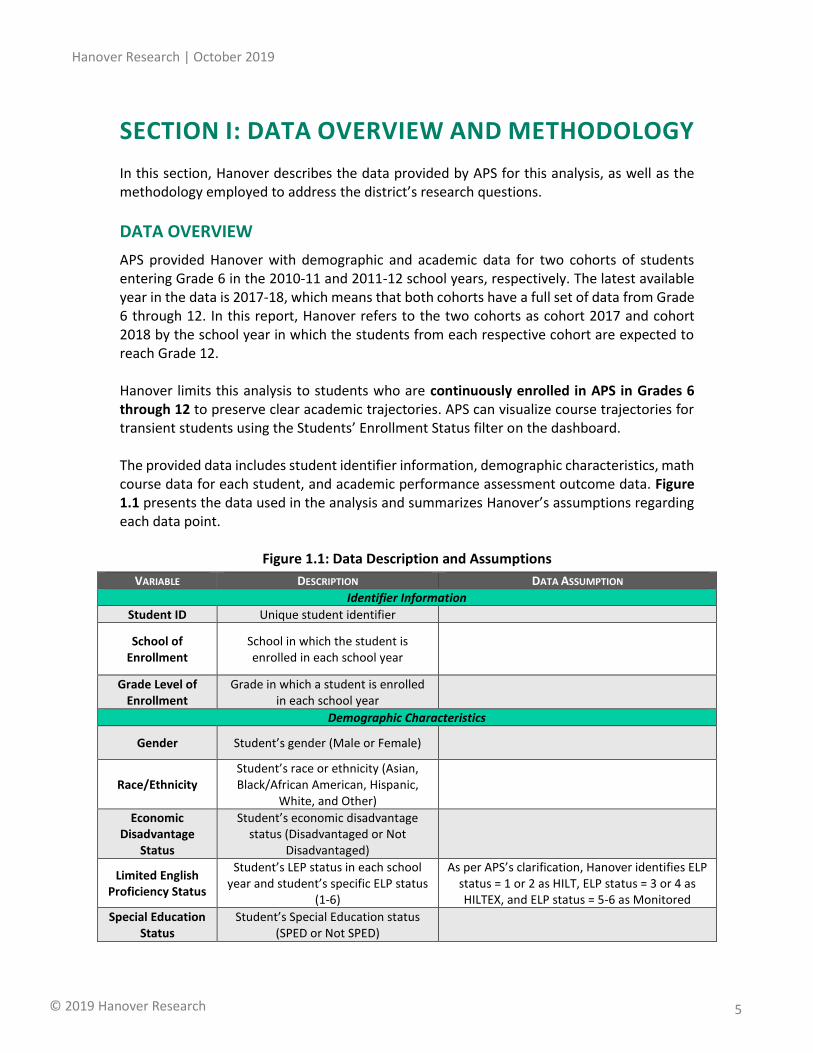
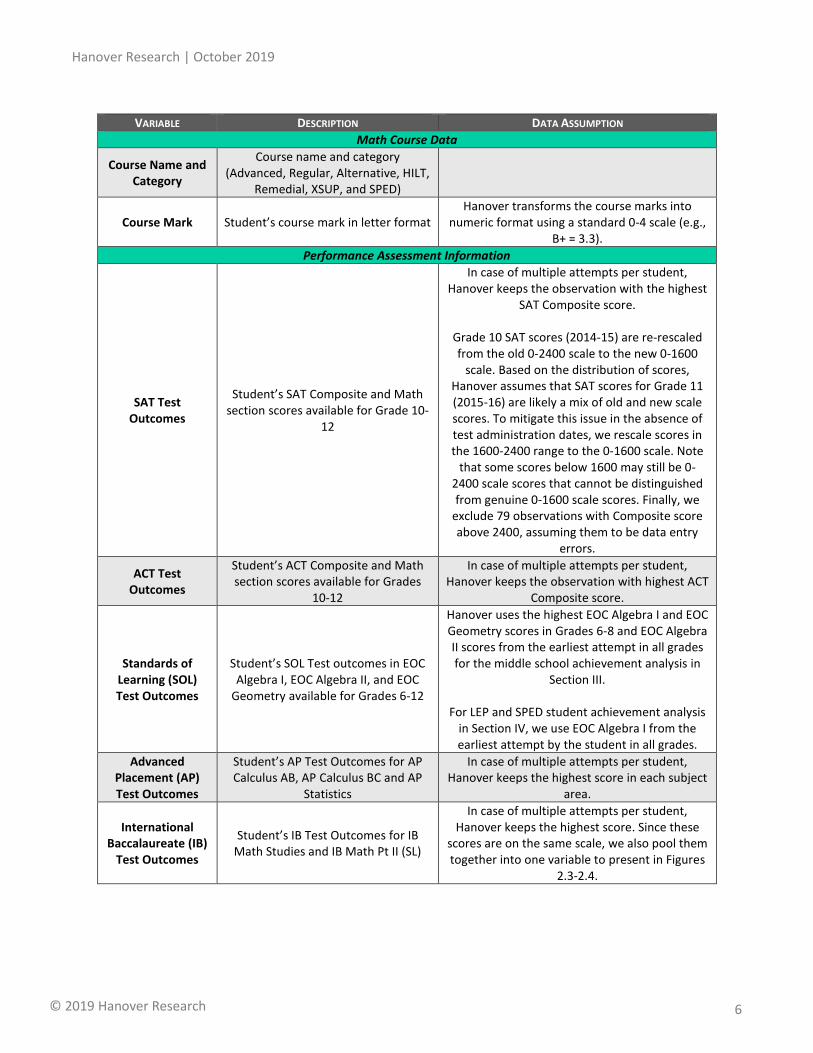
APS provided Hanover with demographic and academic data for two cohorts of students entering Grade 6 in the 2010-11 and 2011-12 school years, respectively. The latest available year in the data is 2017-18, which means that both cohorts have a full set of data from Grade 6 through 12. In this report, Hanover refers to the two cohorts as cohort 2017 and cohort 2018 by the school year in which the students from each respective cohort are expected to reach Grade 12. Hanover limits this analysis to students who are continuously enrolled in APS in Grades 6 through 12 to preserve clear academic trajectories. APS can visualize course trajectories for transient students using the Students’ Enrollment Status filter on the dashboard. The provided data includes student identifier information, demographic characteristics, math course data for each student, and academic performance assessment outcome data. Figure 1.1 presents the data used in the analysis and summarizes Hanover’s assumptions regarding each data point.
Figure 1.1: Data Description and Assumptions
VARIABLE DESCRIPTION DATA ASSUMPTION
Identifier Information
Student ID Unique student identifier
School of Enrollment
School in which the student is enrolled in each school year
Grade Level of Enrollment
Grade in which a student is enrolled in each school year
Demographic Characteristics
Gender Student’s gender (Male or Female)
Race/Ethnicity Student’s race or ethnicity (Asian, Black/African American, Hispanic,
White, and Other)
Economic Disadvantage
Status
Student’s economic disadvantage status (Disadvantaged or Not
Disadvantaged)
Limited English Proficiency Status
Student’s LEP status in each school year and student’s specific ELP status
(1-6)
As per APS’s clarification, Hanover identifies ELP status = 1 or 2 as HILT, ELP status = 3 or 4 as HILTEX, and ELP status = 5-6 as Monitored
Special Education Status
Student’s Special Education status (SPED or Not SPED)
Hanover Research | October 2019
© 2019 Hanover Research 6
VARIABLE DESCRIPTION DATA ASSUMPTION
Math Course Data
Course Name and Category
Course name and category (Advanced, Regular, Alternative, HILT,
Remedial, XSUP, and SPED)
Course Mark Student’s course mark in letter format Hanover transforms the course marks into
numeric format using a standard 0-4 scale (e.g., B+ = 3.3).
Performance Assessment Information
SAT Test Outcomes
Student’s SAT Composite and Math section scores available for Grade 10-
12
In case of multiple attempts per student, Hanover keeps the observation with the highest
SAT Composite score.
Grade 10 SAT scores (2014-15) are re-rescaled from the old 0-2400 scale to the new 0-1600
scale. Based on the distribution of scores, Hanover assumes that SAT scores for Grade 11 (2015-16) are likely a mix of old and new scale scores. To mitigate this issue in the absence of test administration dates, we rescale scores in the 1600-2400 range to the 0-1600 scale. Note
that some scores below 1600 may still be 0-2400 scale scores that cannot be distinguished from genuine 0-1600 scale scores. Finally, we
exclude 79 observations with Composite score above 2400, assuming them to be data entry
errors.
ACT Test Outcomes
Student’s ACT Composite and Math section scores available for Grades
10-12
In case of multiple attempts per student, Hanover keeps the observation with highest ACT
Composite score.
Standards of Learning (SOL) Test Outcomes
Student’s SOL Test outcomes in EOC Algebra I, EOC Algebra II, and EOC
Geometry available for Grades 6-12
Hanover uses the highest EOC Algebra I and EOC Geometry scores in Grades 6-8 and EOC Algebra II scores from the earliest attempt in all grades for the middle school achievement analysis in
Section III. For LEP and SPED student achievement analysis
in Section IV, we use EOC Algebra I from the earliest attempt by the student in all grades.
Advanced Placement (AP) Test Outcomes
Student’s AP Test Outcomes for AP Calculus AB, AP Calculus BC and AP
Statistics
In case of multiple attempts per student, Hanover keeps the highest score in each subject
area.
International Baccalaureate (IB)
Test Outcomes
Student’s IB Test Outcomes for IB Math Studies and IB Math Pt II (SL)
In case of multiple attempts per student, Hanover keeps the highest score. Since these
scores are on the same scale, we also pool them together into one variable to present in Figures
2.3-2.4.
Hanover Research | October 2019
© 2019 Hanover Research 7
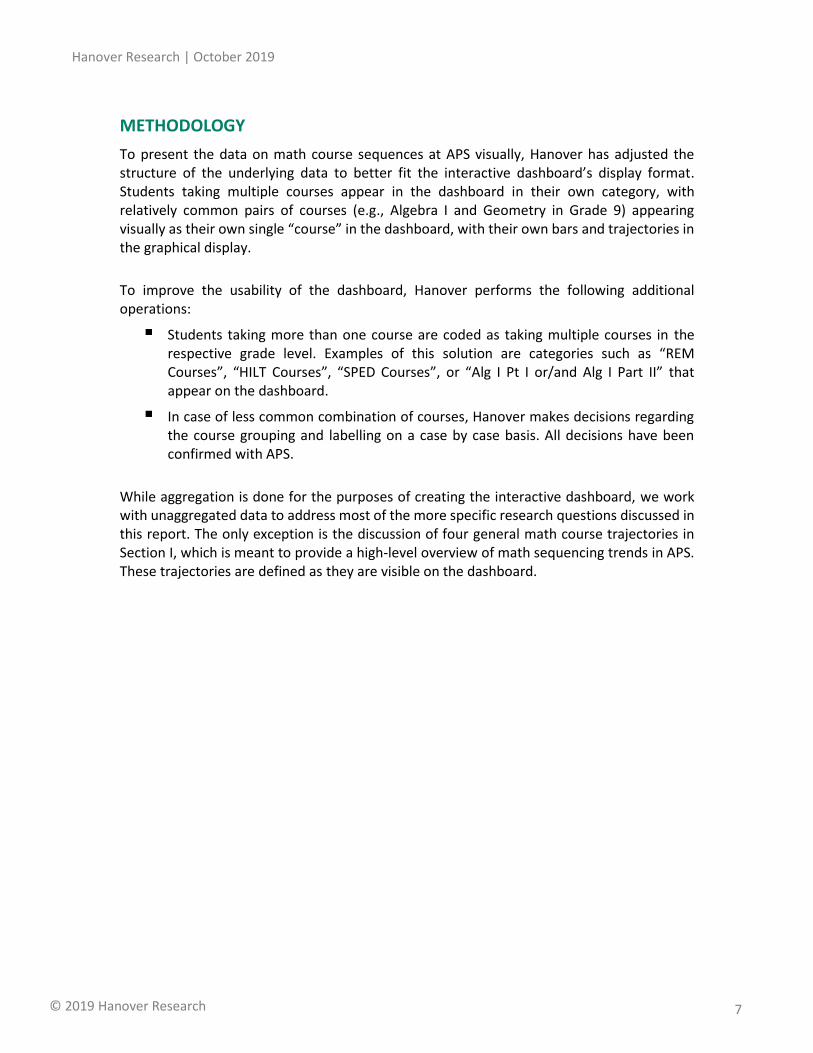
METHODOLOGY
To present the data on math course sequences at APS visually, Hanover has adjusted the structure of the underlying data to better fit the interactive dashboard’s display format. Students taking multiple courses appear in the dashboard in their own category, with relatively common pairs of courses (e.g., Algebra I and Geometry in Grade 9) appearing visually as their own single “course” in the dashboard, with their own bars and trajectories in the graphical display.
To improve the usability of the dashboard, Hanover performs the following additional operations:
Students taking more than one course are coded as taking multiple courses in the respective grade level. Examples of this solution are categories such as “REM Courses”, “HILT Courses”, “SPED Courses”, or “Alg I Pt I or/and Alg I Part II” that appear on the dashboard.
In case of less common combination of courses, Hanover makes decisions regarding the course grouping and labelling on a case by case basis. All decisions have been confirmed with APS.
While aggregation is done for the purposes of creating the interactive dashboard, we work with unaggregated data to address most of the more specific research questions discussed in this report. The only exception is the discussion of four general math course trajectories in Section I, which is meant to provide a high-level overview of math sequencing trends in APS. These trajectories are defined as they are visible on the dashboard.
Hanover Research | October 2019
© 2019 Hanover Research 8
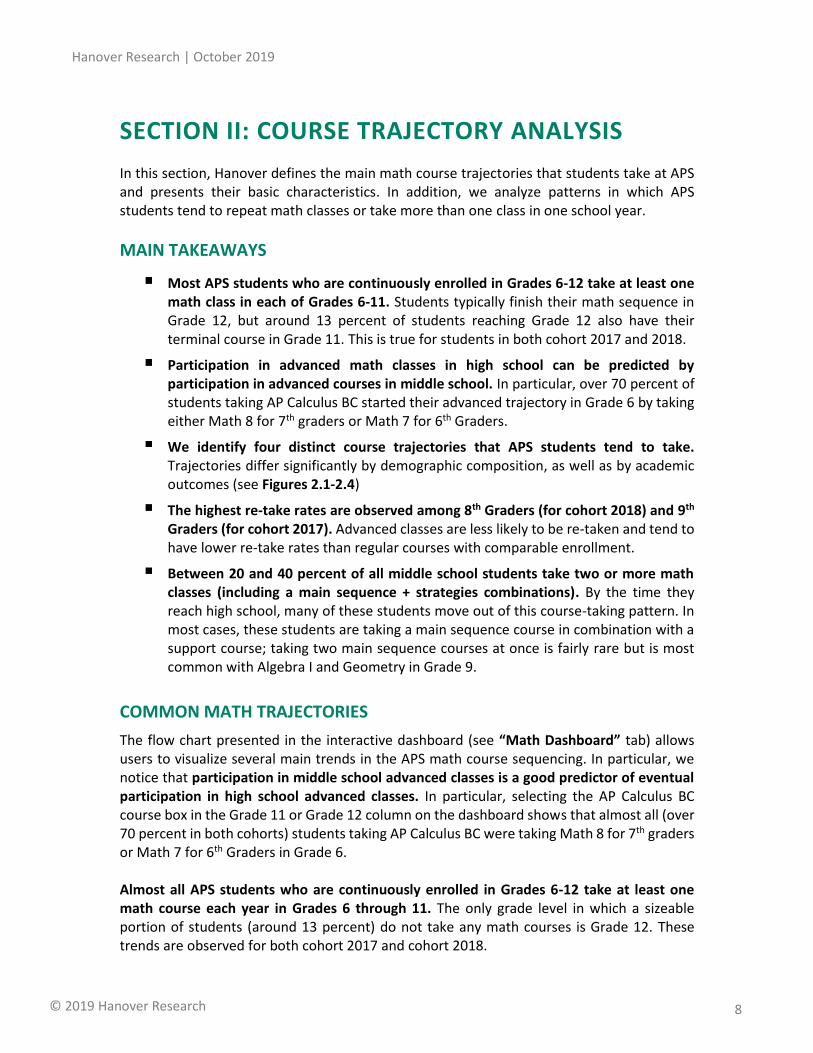
SECTION II: COURSE TRAJECTORY ANALYSIS
In this section, Hanover defines the main math course trajectories that students take at APS and presents their basic characteristics. In addition, we analyze patterns in which APS students tend to repeat math classes or take more than one class in one school year.
MAIN TAKEAWAYS
Most APS students who are continuously enrolled in Grades 6-12 take at least one math class in each of Grades 6-11. Students typically finish their math sequence in Grade 12, but around 13 percent of students reaching Grade 12 also have their terminal course in Grade 11. This is true for students in both cohort 2017 and 2018.
Participation in advanced math classes in high school can be predicted by participation in advanced courses in middle school. In particular, over 70 percent of students taking AP Calculus BC started their advanced trajectory in Grade 6 by taking either Math 8 for 7th graders or Math 7 for 6th Graders.
We identify four distinct course trajectories that APS students tend to take. Trajectories differ significantly by demographic composition, as well as by academic outcomes (see Figures 2.1-2.4)
The highest re-take rates are observed among 8th Graders (for cohort 2018) and 9th Graders (for cohort 2017). Advanced classes are less likely to be re-taken and tend to have lower re-take rates than regular courses with comparable enrollment.
Between 20 and 40 percent of all middle school students take two or more math classes (including a main sequence + strategies combinations). By the time they reach high school, many of these students move out of this course-taking pattern. In most cases, these students are taking a main sequence course in combination with a support course; taking two main sequence courses at once is fairly rare but is most common with Algebra I and Geometry in Grade 9.
COMMON MATH TRAJECTORIES
The flow chart presented in the interactive dashboard (see “Math Dashboard” tab) allows users to visualize several main trends in the APS math course sequencing. In particular, we notice that participation in middle school advanced classes is a good predictor of eventual participation in high school advanced classes. In particular, selecting the AP Calculus BC course box in the Grade 11 or Grade 12 column on the dashboard shows that almost all (over 70 percent in both cohorts) students taking AP Calculus BC were taking Math 8 for 7th graders or Math 7 for 6th Graders in Grade 6. Almost all APS students who are continuously enrolled in Grades 6-12 take at least one math course each year in Grades 6 through 11. The only grade level in which a sizeable portion of students (around 13 percent) do not take any math courses is Grade 12. These trends are observed for both cohort 2017 and cohort 2018.
Hanover Research | October 2019
© 2019 Hanover Research 9
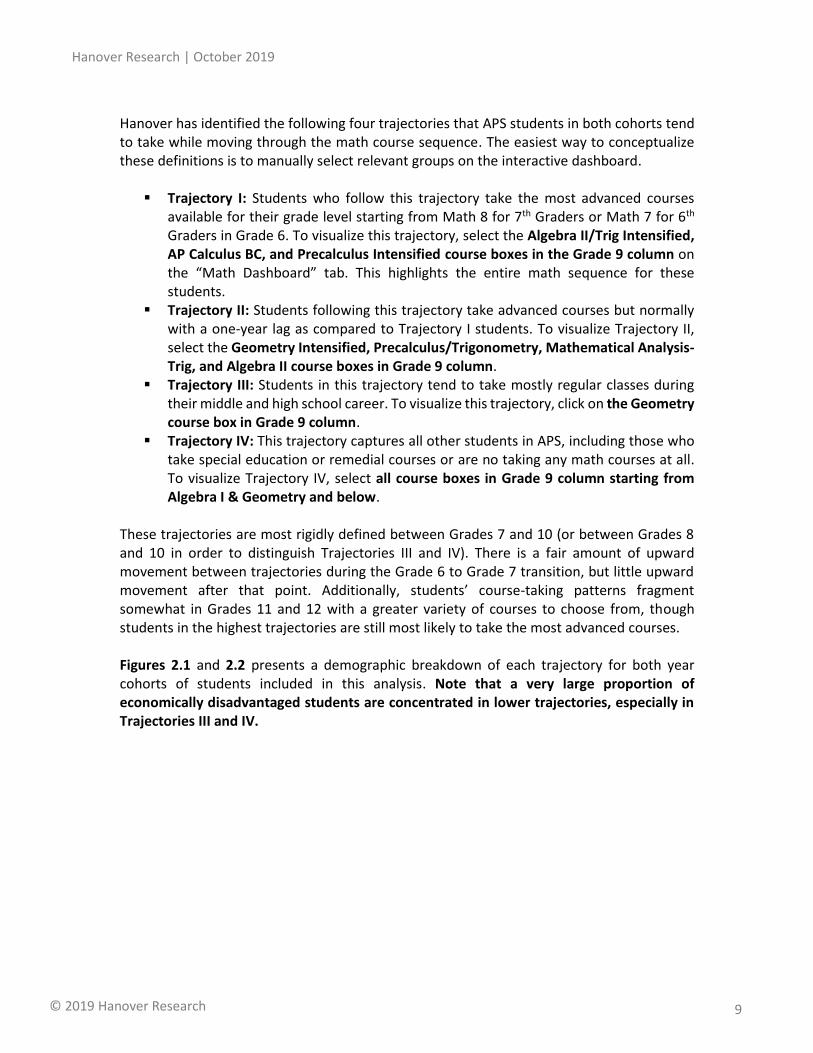
Hanover has identified the following four trajectories that APS students in both cohorts tend to take while moving through the math course sequence. The easiest way to conceptualize these definitions is to manually select relevant groups on the interactive dashboard.
▪ Trajectory I: Students who follow this trajectory take the most advanced courses available for their grade level starting from Math 8 for 7th Graders or Math 7 for 6th Graders in Grade 6. To visualize this trajectory, select the Algebra II/Trig Intensified, AP Calculus BC, and Precalculus Intensified course boxes in the Grade 9 column on the “Math Dashboard” tab. This highlights the entire math sequence for these students.
▪ Trajectory II: Students following this trajectory take advanced courses but normally with a one-year lag as compared to Trajectory I students. To visualize Trajectory II, select the Geometry Intensified, Precalculus/Trigonometry, Mathematical Analysis-Trig, and Algebra II course boxes in Grade 9 column.
▪ Trajectory III: Students in this trajectory tend to take mostly regular classes during their middle and high school career. To visualize this trajectory, click on the Geometry course box in Grade 9 column.
▪ Trajectory IV: This trajectory captures all other students in APS, including those who take special education or remedial courses or are no taking any math courses at all. To visualize Trajectory IV, select all course boxes in Grade 9 column starting from Algebra I & Geometry and below.
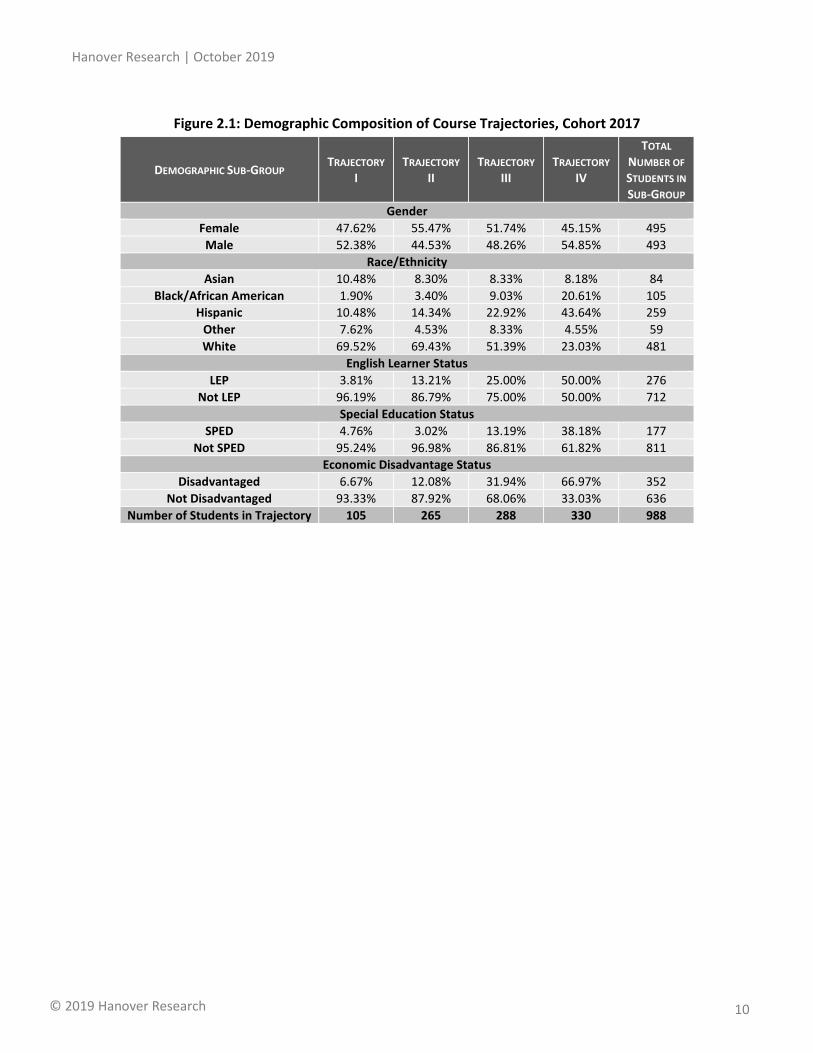
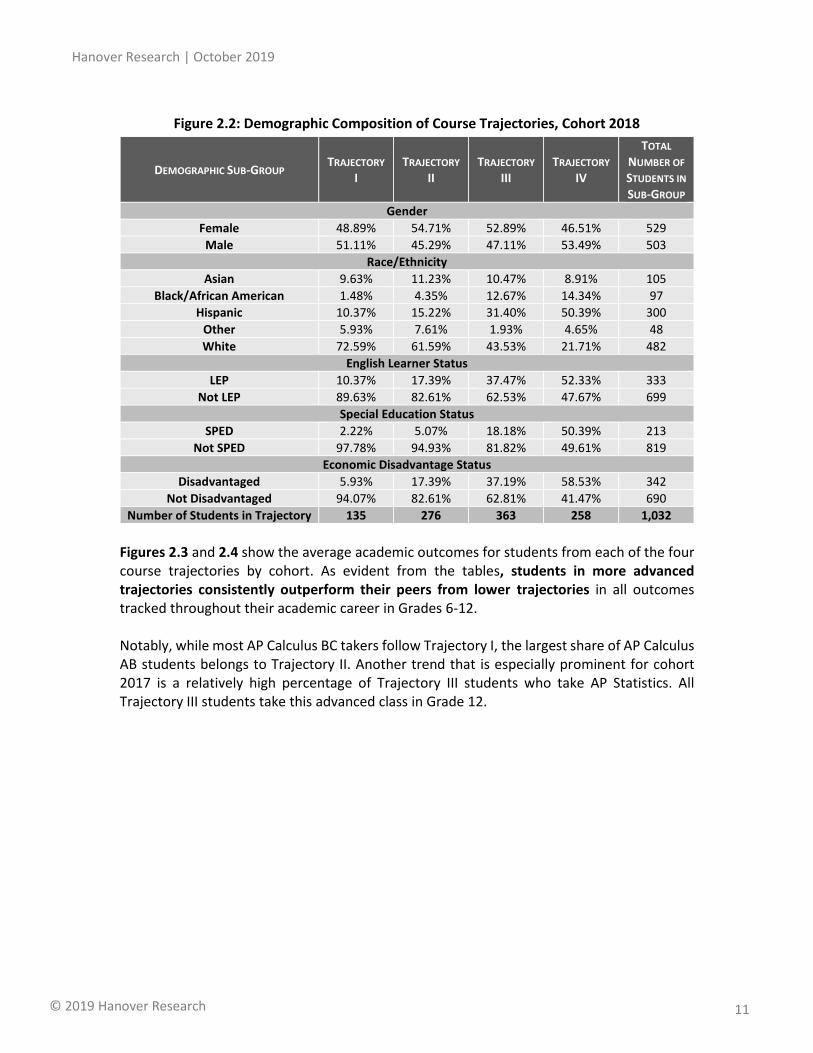
These trajectories are most rigidly defined between Grades 7 and 10 (or between Grades 8 and 10 in order to distinguish Trajectories III and IV). There is a fair amount of upward movement between trajectories during the Grade 6 to Grade 7 transition, but little upward movement after that point. Additionally, students’ course-taking patterns fragment somewhat in Grades 11 and 12 with a greater variety of courses to choose from, though students in the highest trajectories are still most likely to take the most advanced courses. Figures 2.1 and 2.2 presents a demographic breakdown of each trajectory for both year cohorts of students included in this analysis. Note that a very large proportion of economically disadvantaged students are concentrated in lower trajectories, especially in Trajectories III and IV.
Hanover Research | October 2019
© 2019 Hanover Research 10
Figure 2.1: Demographic Composition of Course Trajectories, Cohort 2017
DEMOGRAPHIC SUB-GROUP TRAJECTORY
I TRAJECTORY
II TRAJECTORY
III TRAJECTORY
IV
TOTAL
NUMBER OF
STUDENTS IN
SUB-GROUP
Gender
Female 47.62% 55.47% 51.74% 45.15% 495
Male 52.38% 44.53% 48.26% 54.85% 493
Race/Ethnicity
Asian 10.48% 8.30% 8.33% 8.18% 84
Black/African American 1.90% 3.40% 9.03% 20.61% 105
Hispanic 10.48% 14.34% 22.92% 43.64% 259
Other 7.62% 4.53% 8.33% 4.55% 59
White 69.52% 69.43% 51.39% 23.03% 481
English Learner Status
LEP 3.81% 13.21% 25.00% 50.00% 276
Not LEP 96.19% 86.79% 75.00% 50.00% 712
Special Education Status
SPED 4.76% 3.02% 13.19% 38.18% 177
Not SPED 95.24% 96.98% 86.81% 61.82% 811
Economic Disadvantage Status
Disadvantaged 6.67% 12.08% 31.94% 66.97% 352
Not Disadvantaged 93.33% 87.92% 68.06% 33.03% 636
Number of Students in Trajectory 105 265 288 330 988
Hanover Research | October 2019
© 2019 Hanover Research 11
Figure 2.2: Demographic Composition of Course Trajectories, Cohort 2018
DEMOGRAPHIC SUB-GROUP TRAJECTORY
I TRAJECTORY
II TRAJECTORY
III TRAJECTORY
IV
TOTAL
NUMBER OF
STUDENTS IN
SUB-GROUP
Gender
Female 48.89% 54.71% 52.89% 46.51% 529
Male 51.11% 45.29% 47.11% 53.49% 503
Race/Ethnicity
Asian 9.63% 11.23% 10.47% 8.91% 105
Black/African American 1.48% 4.35% 12.67% 14.34% 97
Hispanic 10.37% 15.22% 31.40% 50.39% 300
Other 5.93% 7.61% 1.93% 4.65% 48
White 72.59% 61.59% 43.53% 21.71% 482
English Learner Status
LEP 10.37% 17.39% 37.47% 52.33% 333
Not LEP 89.63% 82.61% 62.53% 47.67% 699
Special Education Status
SPED 2.22% 5.07% 18.18% 50.39% 213
Not SPED 97.78% 94.93% 81.82% 49.61% 819
Economic Disadvantage Status
Disadvantaged 5.93% 17.39% 37.19% 58.53% 342
Not Disadvantaged 94.07% 82.61% 62.81% 41.47% 690
Number of Students in Trajectory 135 276 363 258 1,032
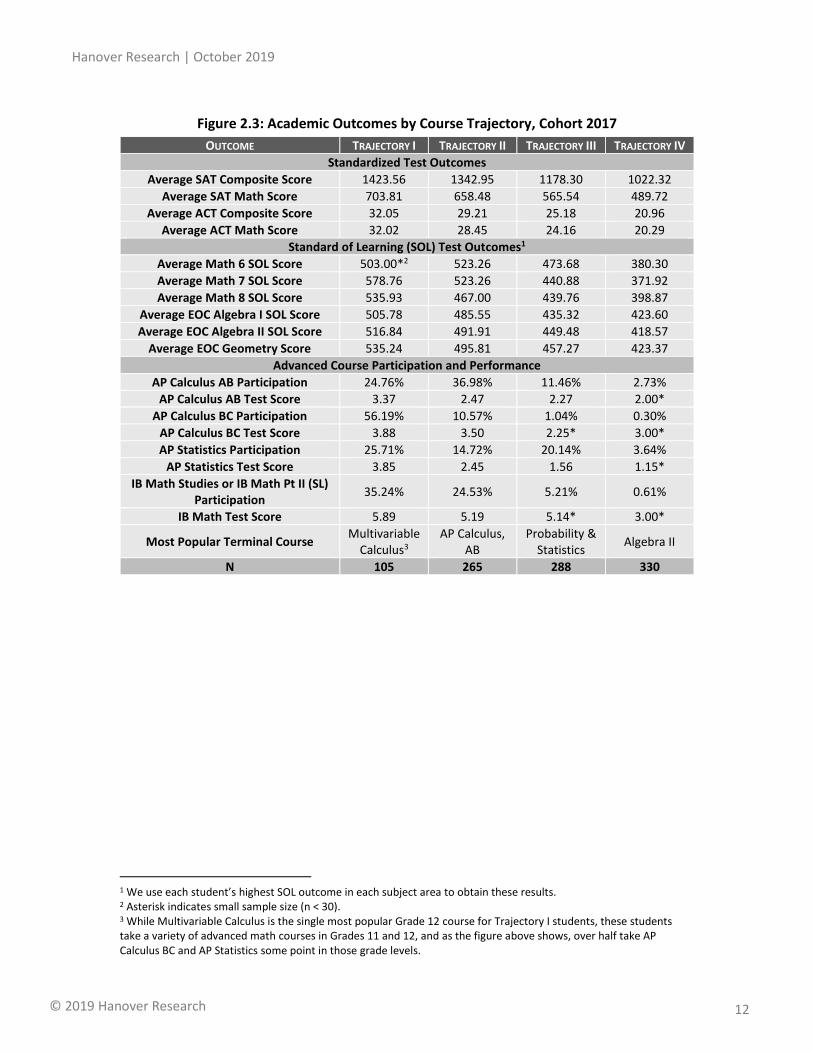
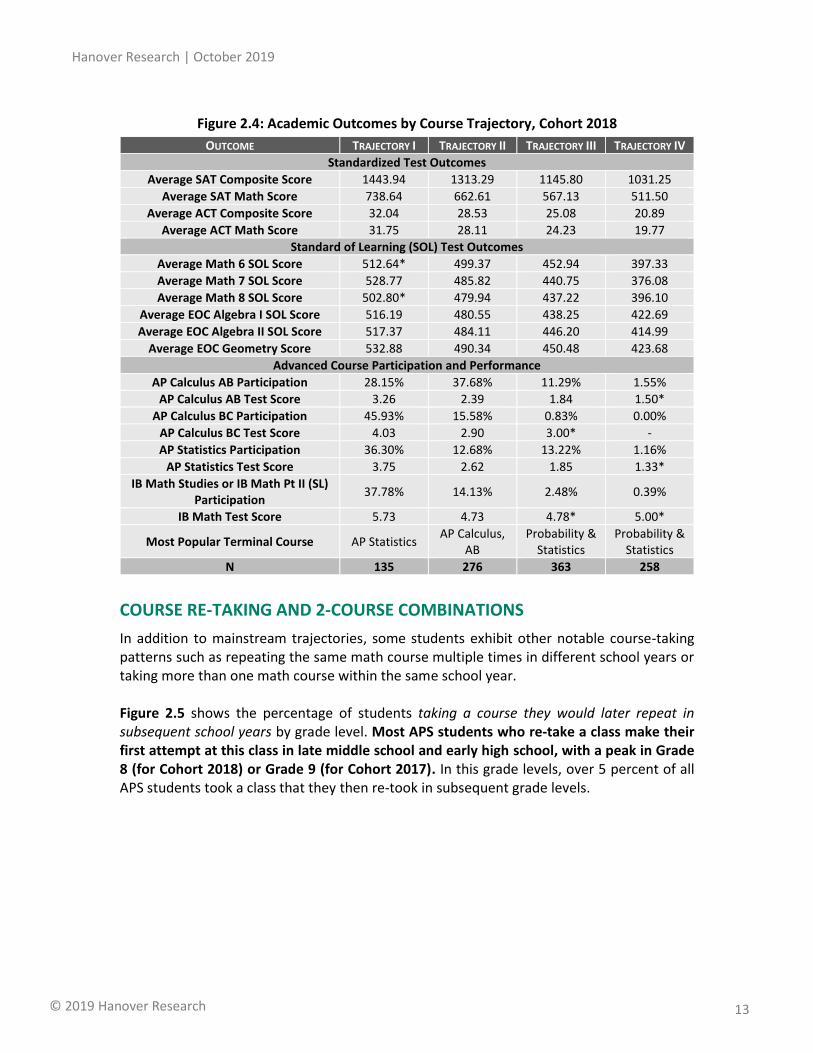
Figures 2.3 and 2.4 show the average academic outcomes for students from each of the four course trajectories by cohort. As evident from the tables, students in more advanced trajectories consistently outperform their peers from lower trajectories in all outcomes tracked throughout their academic career in Grades 6-12. Notably, while most AP Calculus BC takers follow Trajectory I, the largest share of AP Calculus AB students belongs to Trajectory II. Another trend that is especially prominent for cohort 2017 is a relatively high percentage of Trajectory III students who take AP Statistics. All Trajectory III students take this advanced class in Grade 12.
Hanover Research | October 2019
© 2019 Hanover Research 12
Figure 2.3: Academic Outcomes by Course Trajectory, Cohort 2017
OUTCOME TRAJECTORY I TRAJECTORY II TRAJECTORY III TRAJECTORY IV
Standardized Test Outcomes
Average SAT Composite Score 1423.56 1342.95 1178.30 1022.32
Average SAT Math Score 703.81 658.48 565.54 489.72
Average ACT Composite Score 32.05 29.21 25.18 20.96
Average ACT Math Score 32.02 28.45 24.16 20.29
Standard of Learning (SOL) Test Outcomes1
Average Math 6 SOL Score 503.00*2 523.26 473.68 380.30
Average Math 7 SOL Score 578.76 523.26 440.88 371.92
Average Math 8 SOL Score 535.93 467.00 439.76 398.87
Average EOC Algebra I SOL Score 505.78 485.55 435.32 423.60
Average EOC Algebra II SOL Score 516.84 491.91 449.48 418.57
Average EOC Geometry Score 535.24 495.81 457.27 423.37
Advanced Course Participation and Performance
AP Calculus AB Participation 24.76% 36.98% 11.46% 2.73%
AP Calculus AB Test Score 3.37 2.47 2.27 2.00*
AP Calculus BC Participation 56.19% 10.57% 1.04% 0.30%
AP Calculus BC Test Score 3.88 3.50 2.25* 3.00*
AP Statistics Participation 25.71% 14.72% 20.14% 3.64%
AP Statistics Test Score 3.85 2.45 1.56 1.15*
IB Math Studies or IB Math Pt II (SL) Participation
35.24% 24.53% 5.21% 0.61%
IB Math Test Score 5.89 5.19 5.14* 3.00*
Most Popular Terminal Course Multivariable
Calculus3 AP Calculus,
AB Probability &
Statistics Algebra II
N 105 265 288 330
1 We use each student’s highest SOL outcome in each subject area to obtain these results. 2 Asterisk indicates small sample size (n < 30). 3 While Multivariable Calculus is the single most popular Grade 12 course for Trajectory I students, these students take a variety of advanced math courses in Grades 11 and 12, and as the figure above shows, over half take AP Calculus BC and AP Statistics some point in those grade levels.
Hanover Research | October 2019
© 2019 Hanover Research 13
Figure 2.4: Academic Outcomes by Course Trajectory, Cohort 2018
OUTCOME TRAJECTORY I TRAJECTORY II TRAJECTORY III TRAJECTORY IV
Standardized Test Outcomes
Average SAT Composite Score 1443.94 1313.29 1145.80 1031.25
Average SAT Math Score 738.64 662.61 567.13 511.50
Average ACT Composite Score 32.04 28.53 25.08 20.89
Average ACT Math Score 31.75 28.11 24.23 19.77
Standard of Learning (SOL) Test Outcomes
Average Math 6 SOL Score 512.64* 499.37 452.94 397.33
Average Math 7 SOL Score 528.77 485.82 440.75 376.08
Average Math 8 SOL Score 502.80* 479.94 437.22 396.10
Average EOC Algebra I SOL Score 516.19 480.55 438.25 422.69
Average EOC Algebra II SOL Score 517.37 484.11 446.20 414.99
Average EOC Geometry Score 532.88 490.34 450.48 423.68
Advanced Course Participation and Performance
AP Calculus AB Participation 28.15% 37.68% 11.29% 1.55%
AP Calculus AB Test Score 3.26 2.39 1.84 1.50*
AP Calculus BC Participation 45.93% 15.58% 0.83% 0.00%
AP Calculus BC Test Score 4.03 2.90 3.00* -
AP Statistics Participation 36.30% 12.68% 13.22% 1.16%
AP Statistics Test Score 3.75 2.62 1.85 1.33*
IB Math Studies or IB Math Pt II (SL) Participation
37.78% 14.13% 2.48% 0.39%
IB Math Test Score 5.73 4.73 4.78* 5.00*
Most Popular Terminal Course AP Statistics AP Calculus,
AB Probability &
Statistics Probability &
Statistics
N 135 276 363 258
COURSE RE-TAKING AND 2-COURSE COMBINATIONS
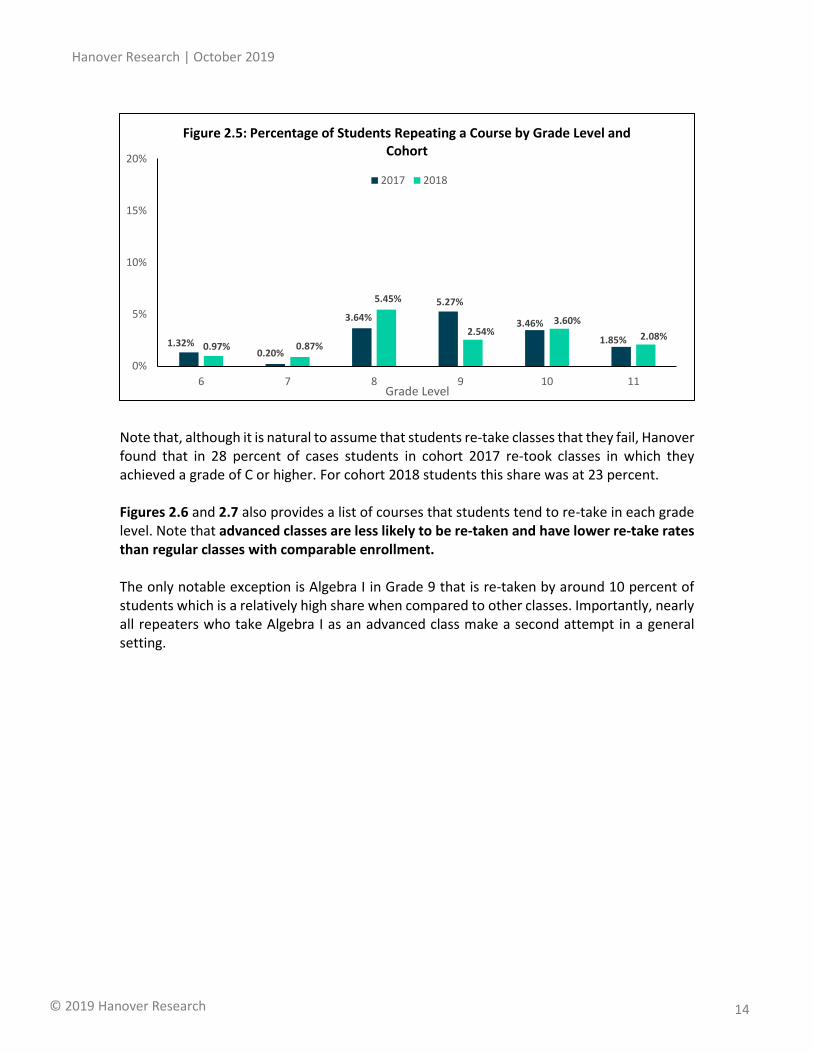
In addition to mainstream trajectories, some students exhibit other notable course-taking patterns such as repeating the same math course multiple times in different school years or taking more than one math course within the same school year. Figure 2.5 shows the percentage of students taking a course they would later repeat in subsequent school years by grade level. Most APS students who re-take a class make their first attempt at this class in late middle school and early high school, with a peak in Grade 8 (for Cohort 2018) or Grade 9 (for Cohort 2017). In this grade levels, over 5 percent of all APS students took a class that they then re-took in subsequent grade levels.
Hanover Research | October 2019
© 2019 Hanover Research 14
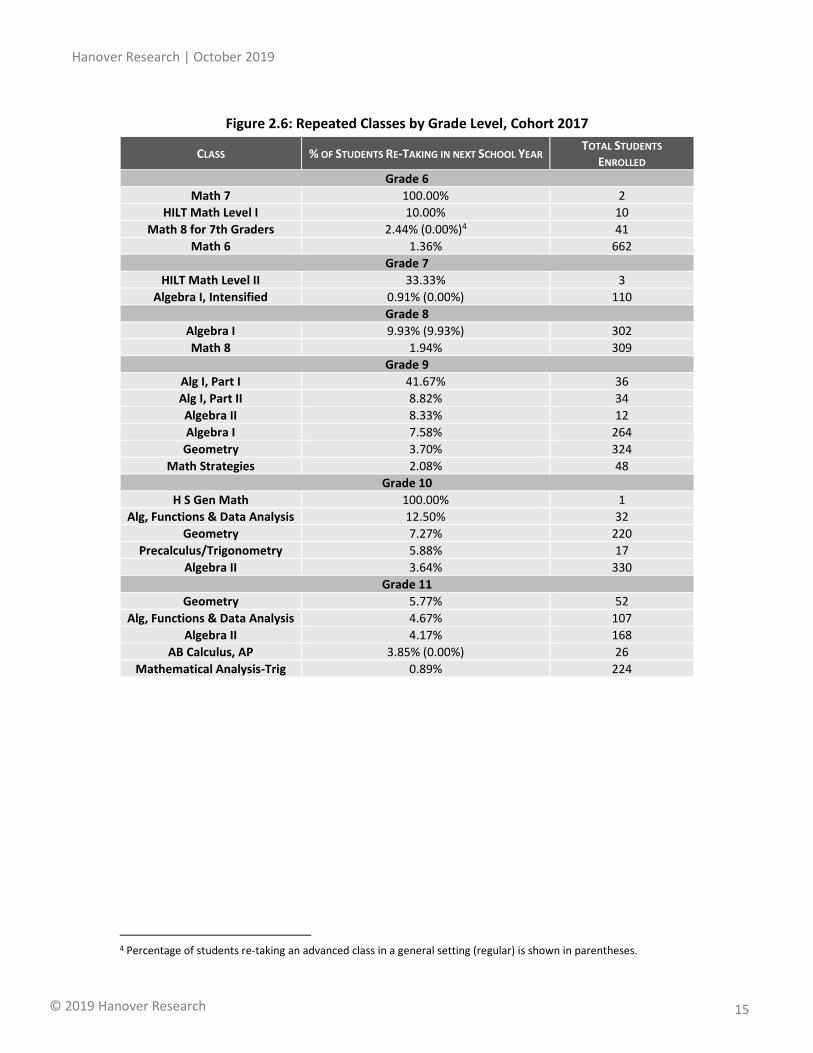
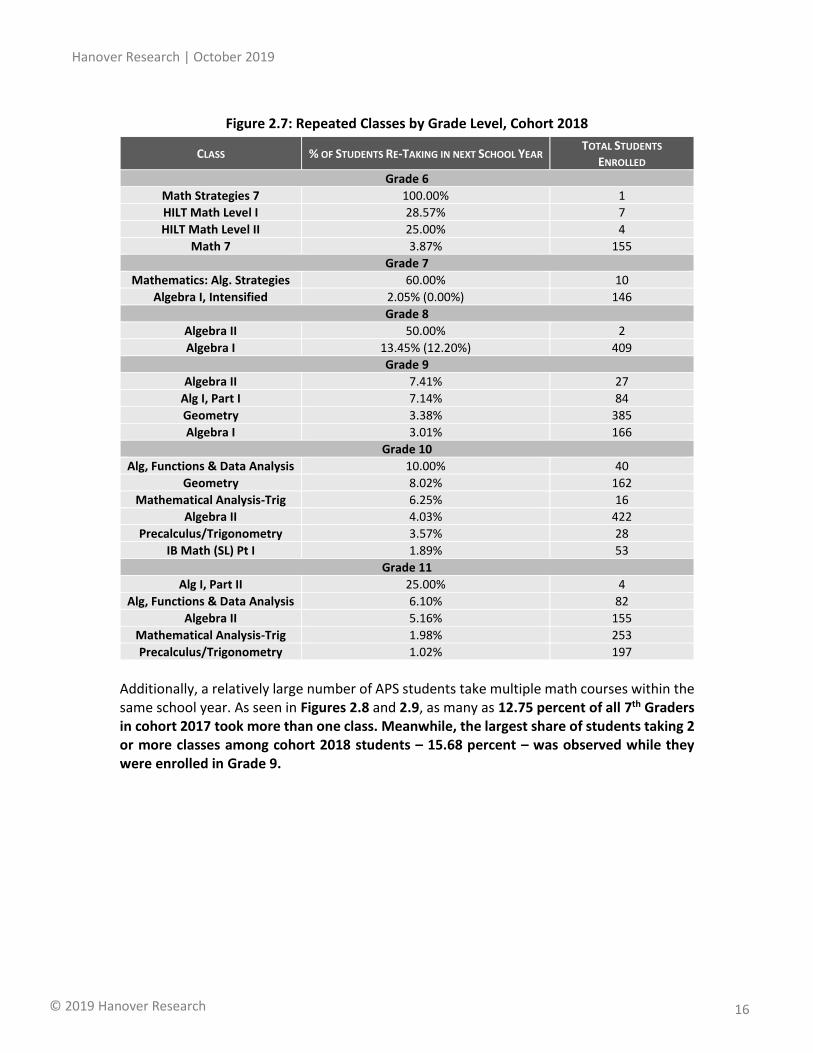
Note that, although it is natural to assume that students re-take classes that they fail, Hanover found that in 28 percent of cases students in cohort 2017 re-took classes in which they achieved a grade of C or higher. For cohort 2018 students this share was at 23 percent. Figures 2.6 and 2.7 also provides a list of courses that students tend to re-take in each grade level. Note that advanced classes are less likely to be re-taken and have lower re-take rates than regular classes with comparable enrollment. The only notable exception is Algebra I in Grade 9 that is re-taken by around 10 percent of students which is a relatively high share when compared to other classes. Importantly, nearly all repeaters who take Algebra I as an advanced class make a second attempt in a general setting.
1.32%0.20%
3.64%
5.27%
3.46%
1.85%0.97% 0.87%
5.45%
2.54%3.60%
2.08%
0%
5%
10%
15%
20%
6 7 8 9 10 11Grade Level
Figure 2.5: Percentage of Students Repeating a Course by Grade Level and Cohort
2017 2018
Hanover Research | October 2019
© 2019 Hanover Research 15
Figure 2.6: Repeated Classes by Grade Level, Cohort 2017
CLASS % OF STUDENTS RE-TAKING IN NEXT SCHOOL YEAR TOTAL STUDENTS
ENROLLED
Grade 6
Math 7 100.00% 2
HILT Math Level I 10.00% 10
Math 8 for 7th Graders 2.44% (0.00%)4 41
Math 6 1.36% 662
Grade 7
HILT Math Level II 33.33% 3
Algebra I, Intensified 0.91% (0.00%) 110
Grade 8
Algebra I 9.93% (9.93%) 302
Math 8 1.94% 309
Grade 9
Alg I, Part I 41.67% 36
Alg I, Part II 8.82% 34
Algebra II 8.33% 12
Algebra I 7.58% 264
Geometry 3.70% 324
Math Strategies 2.08% 48
Grade 10
H S Gen Math 100.00% 1
Alg, Functions & Data Analysis 12.50% 32
Geometry 7.27% 220
Precalculus/Trigonometry 5.88% 17
Algebra II 3.64% 330
Grade 11
Geometry 5.77% 52
Alg, Functions & Data Analysis 4.67% 107
Algebra II 4.17% 168
AB Calculus, AP 3.85% (0.00%) 26
Mathematical Analysis-Trig 0.89% 224
4 Percentage of students re-taking an advanced class in a general setting (regular) is shown in parentheses.
Hanover Research | October 2019
© 2019 Hanover Research 16
Figure 2.7: Repeated Classes by Grade Level, Cohort 2018
CLASS % OF STUDENTS RE-TAKING IN NEXT SCHOOL YEAR TOTAL STUDENTS
ENROLLED
Grade 6
Math Strategies 7 100.00% 1
HILT Math Level I 28.57% 7
HILT Math Level II 25.00% 4
Math 7 3.87% 155
Grade 7
Mathematics: Alg. Strategies 60.00% 10
Algebra I, Intensified 2.05% (0.00%) 146
Grade 8
Algebra II 50.00% 2
Algebra I 13.45% (12.20%) 409
Grade 9
Algebra II 7.41% 27
Alg I, Part I 7.14% 84
Geometry 3.38% 385
Algebra I 3.01% 166
Grade 10
Alg, Functions & Data Analysis 10.00% 40
Geometry 8.02% 162
Mathematical Analysis-Trig 6.25% 16
Algebra II 4.03% 422
Precalculus/Trigonometry 3.57% 28
IB Math (SL) Pt I 1.89% 53
Grade 11
Alg I, Part II 25.00% 4
Alg, Functions & Data Analysis 6.10% 82
Algebra II 5.16% 155
Mathematical Analysis-Trig 1.98% 253
Precalculus/Trigonometry 1.02% 197
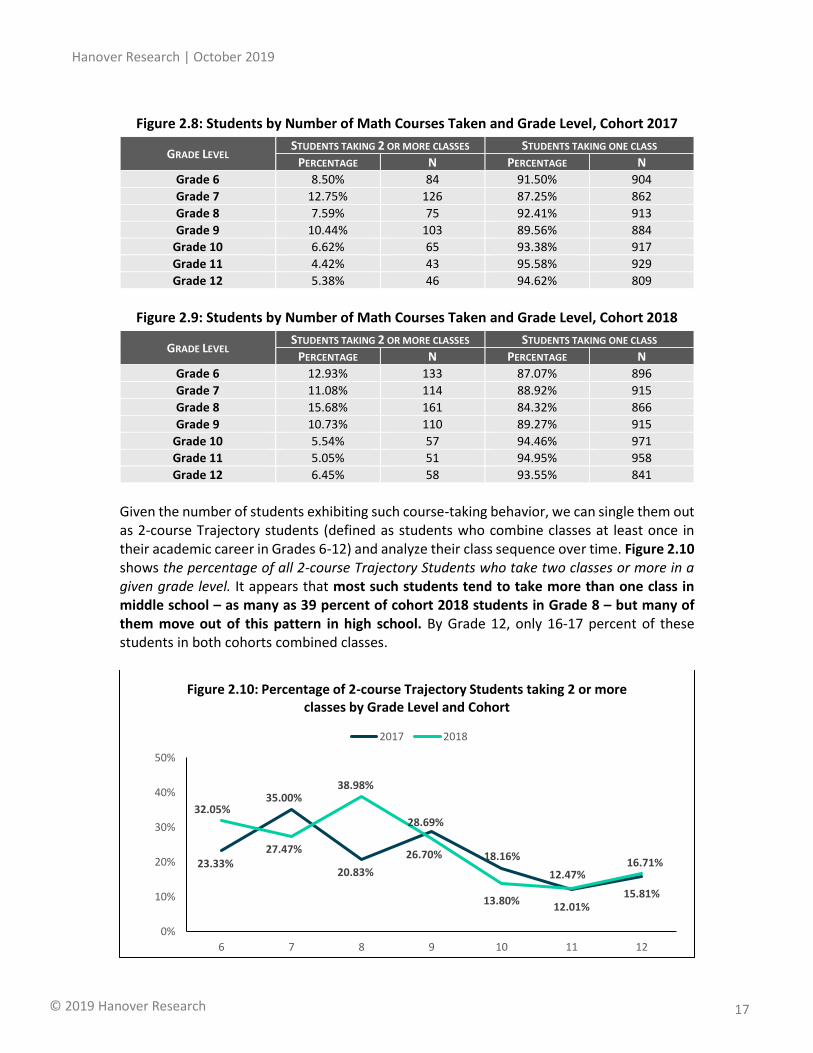
Additionally, a relatively large number of APS students take multiple math courses within the same school year. As seen in Figures 2.8 and 2.9, as many as 12.75 percent of all 7th Graders in cohort 2017 took more than one class. Meanwhile, the largest share of students taking 2 or more classes among cohort 2018 students – 15.68 percent – was observed while they were enrolled in Grade 9.
Hanover Research | October 2019
© 2019 Hanover Research 17
Figure 2.8: Students by Number of Math Courses Taken and Grade Level, Cohort 2017
GRADE LEVEL STUDENTS TAKING 2 OR MORE CLASSES STUDENTS TAKING ONE CLASS
PERCENTAGE N PERCENTAGE N
Grade 6 8.50% 84 91.50% 904
Grade 7 12.75% 126 87.25% 862
Grade 8 7.59% 75 92.41% 913
Grade 9 10.44% 103 89.56% 884
Grade 10 6.62% 65 93.38% 917
Grade 11 4.42% 43 95.58% 929
Grade 12 5.38% 46 94.62% 809
Figure 2.9: Students by Number of Math Courses Taken and Grade Level, Cohort 2018
GRADE LEVEL STUDENTS TAKING 2 OR MORE CLASSES STUDENTS TAKING ONE CLASS
PERCENTAGE N PERCENTAGE N
Grade 6 12.93% 133 87.07% 896
Grade 7 11.08% 114 88.92% 915
Grade 8 15.68% 161 84.32% 866
Grade 9 10.73% 110 89.27% 915
Grade 10 5.54% 57 94.46% 971
Grade 11 5.05% 51 94.95% 958
Grade 12 6.45% 58 93.55% 841
Given the number of students exhibiting such course-taking behavior, we can single them out as 2-course Trajectory students (defined as students who combine classes at least once in their academic career in Grades 6-12) and analyze their class sequence over time. Figure 2.10 shows the percentage of all 2-course Trajectory Students who take two classes or more in a given grade level. It appears that most such students tend to take more than one class in middle school – as many as 39 percent of cohort 2018 students in Grade 8 – but many of them move out of this pattern in high school. By Grade 12, only 16-17 percent of these students in both cohorts combined classes.
23.33%
35.00%
20.83%
28.69%
18.16%
12.01%15.81%
32.05%
27.47%
38.98%
26.70%
13.80%
12.47%16.71%
0%
10%
20%
30%
40%
50%
6 7 8 9 10 11 12
Figure 2.10: Percentage of 2-course Trajectory Students taking 2 or more classes by Grade Level and Cohort
2017 2018
Hanover Research | October 2019
© 2019 Hanover Research 18
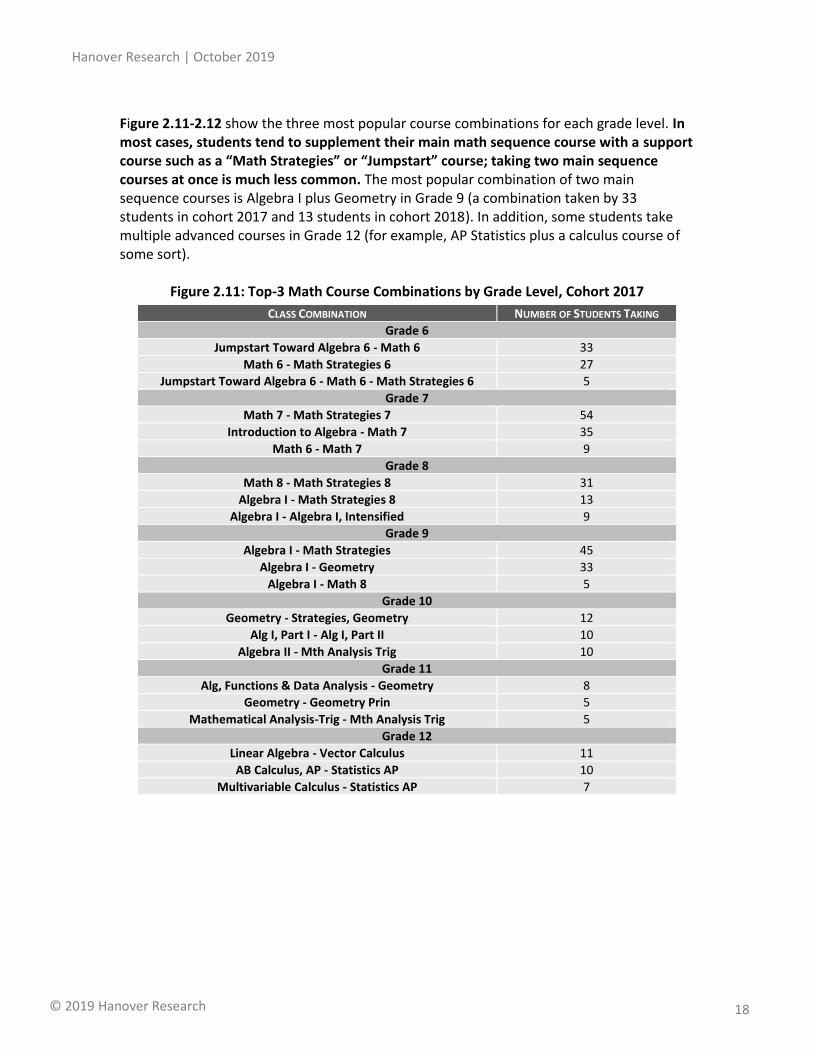
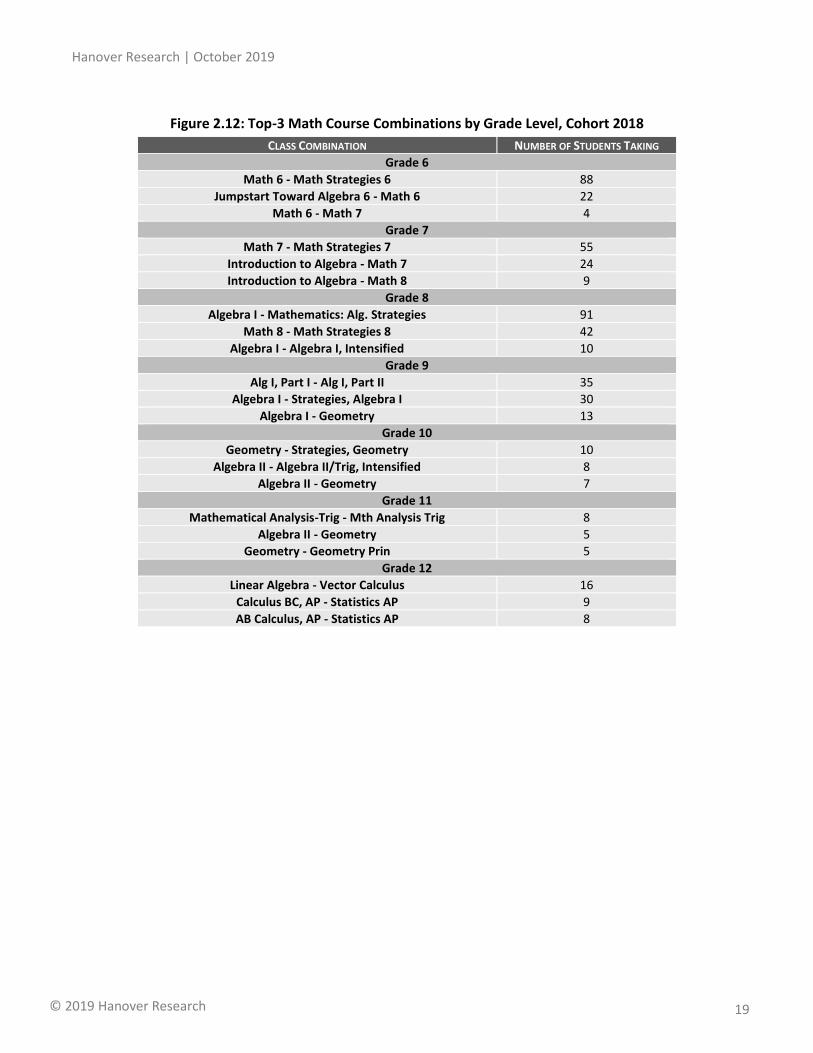
Figure 2.11-2.12 show the three most popular course combinations for each grade level. In most cases, students tend to supplement their main math sequence course with a support course such as a “Math Strategies” or “Jumpstart” course; taking two main sequence courses at once is much less common. The most popular combination of two main sequence courses is Algebra I plus Geometry in Grade 9 (a combination taken by 33 students in cohort 2017 and 13 students in cohort 2018). In addition, some students take multiple advanced courses in Grade 12 (for example, AP Statistics plus a calculus course of some sort).
Figure 2.11: Top-3 Math Course Combinations by Grade Level, Cohort 2017
CLASS COMBINATION NUMBER OF STUDENTS TAKING
Grade 6
Jumpstart Toward Algebra 6 - Math 6 33
Math 6 - Math Strategies 6 27
Jumpstart Toward Algebra 6 - Math 6 - Math Strategies 6 5
Grade 7
Math 7 - Math Strategies 7 54
Introduction to Algebra - Math 7 35
Math 6 - Math 7 9
Grade 8
Math 8 - Math Strategies 8 31
Algebra I - Math Strategies 8 13
Algebra I - Algebra I, Intensified 9
Grade 9
Algebra I - Math Strategies 45
Algebra I - Geometry 33
Algebra I - Math 8 5
Grade 10
Geometry - Strategies, Geometry 12
Alg I, Part I - Alg I, Part II 10
Algebra II - Mth Analysis Trig 10
Grade 11
Alg, Functions & Data Analysis - Geometry 8
Geometry - Geometry Prin 5
Mathematical Analysis-Trig - Mth Analysis Trig 5
Grade 12
Linear Algebra - Vector Calculus 11
AB Calculus, AP - Statistics AP 10
Multivariable Calculus - Statistics AP 7
Hanover Research | October 2019
© 2019 Hanover Research 19
Figure 2.12: Top-3 Math Course Combinations by Grade Level, Cohort 2018
CLASS COMBINATION NUMBER OF STUDENTS TAKING
Grade 6
Math 6 - Math Strategies 6 88
Jumpstart Toward Algebra 6 - Math 6 22
Math 6 - Math 7 4
Grade 7
Math 7 - Math Strategies 7 55
Introduction to Algebra - Math 7 24
Introduction to Algebra - Math 8 9
Grade 8
Algebra I - Mathematics: Alg. Strategies 91
Math 8 - Math Strategies 8 42
Algebra I - Algebra I, Intensified 10
Grade 9
Alg I, Part I - Alg I, Part II 35
Algebra I - Strategies, Algebra I 30
Algebra I - Geometry 13
Grade 10
Geometry - Strategies, Geometry 10
Algebra II - Algebra II/Trig, Intensified 8
Algebra II - Geometry 7
Grade 11
Mathematical Analysis-Trig - Mth Analysis Trig 8
Algebra II - Geometry 5
Geometry - Geometry Prin 5
Grade 12
Linear Algebra - Vector Calculus 16
Calculus BC, AP - Statistics AP 9
AB Calculus, AP - Statistics AP 8
Hanover Research | October 2019
© 2019 Hanover Research 20
SECTION III: ACADEMIC ACHIEVEMENT ANALYSIS
In this section, Hanover analyzes how important the success in middle school math sequence is for eventual success in high school advanced classes in APS. We also provide a comparison of middle school math course performance for different demographic groups of students.
MAIN TAKEAWAYS
Early participation in advanced classes in middle school is strongly associated with eventual progression to advanced courses in high school and on performance. Students who take Algebra I Intensified in Grade 7 are more likely to reach Algebra II Intensified, AP Calculus BC, and AP Calculus AB and achieve better results on respective AP exams.
Different demographic groups exhibit different levels of average academic achievement by the end of the middle school math sequence. In particular, fewer Black/African American and Hispanic students successfully complete Algebra I/Algebra I Intensified or Geometry Intensified while in middle school. Success rates are also lower for LEP, SPED, and economically disadvantaged students.
MIDDLE SCHOOL TO HIGH SCHOOL MATH
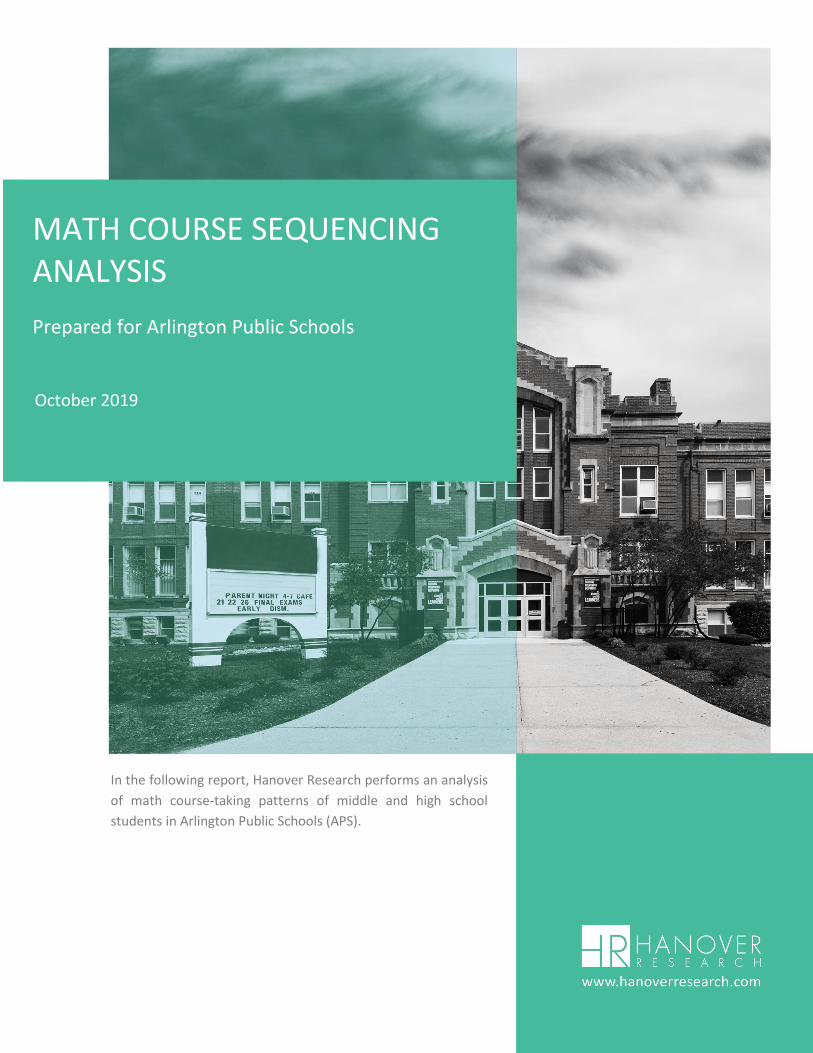
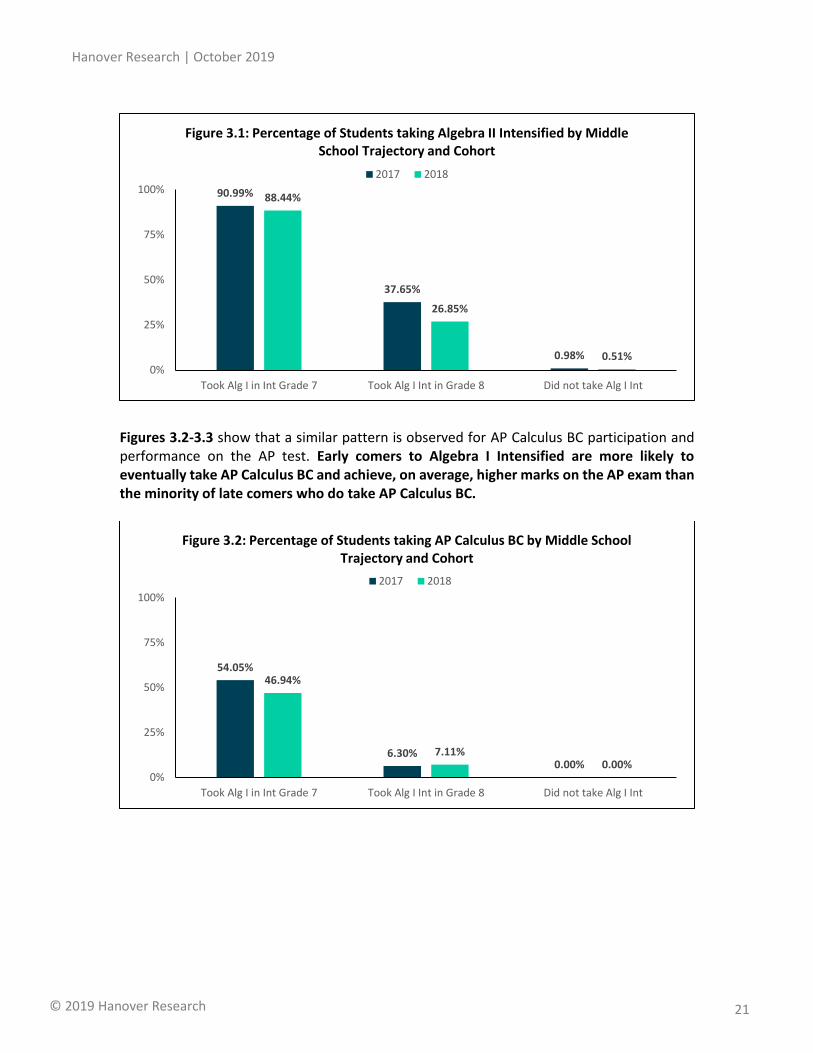
As discussed in Section II, participation in advanced math courses in middle school is highly predictive of participation in high-level classes in high school. In this part of analysis, we look at how variation of time of entry into the more intensified math trajectory affects the course participation in high school. Figure 3.1 compares students who enter the intensified track in Grade 7 by taking Algebra I Intensified to students who reach the same class only in Grade 8. The first group of students follows Trajectory I (as defined in Section II), while most of the students in the second group follow Trajectory II. The figure shows that this one-year lag in taking Algebra I Intensified has a significant effect on the subsequent course sequence. While around 90 percent of early comers eventually take Algebra II Intensified, only 27-38 percent of late comers proceed to this class.
Hanover Research | October 2019
© 2019 Hanover Research 21
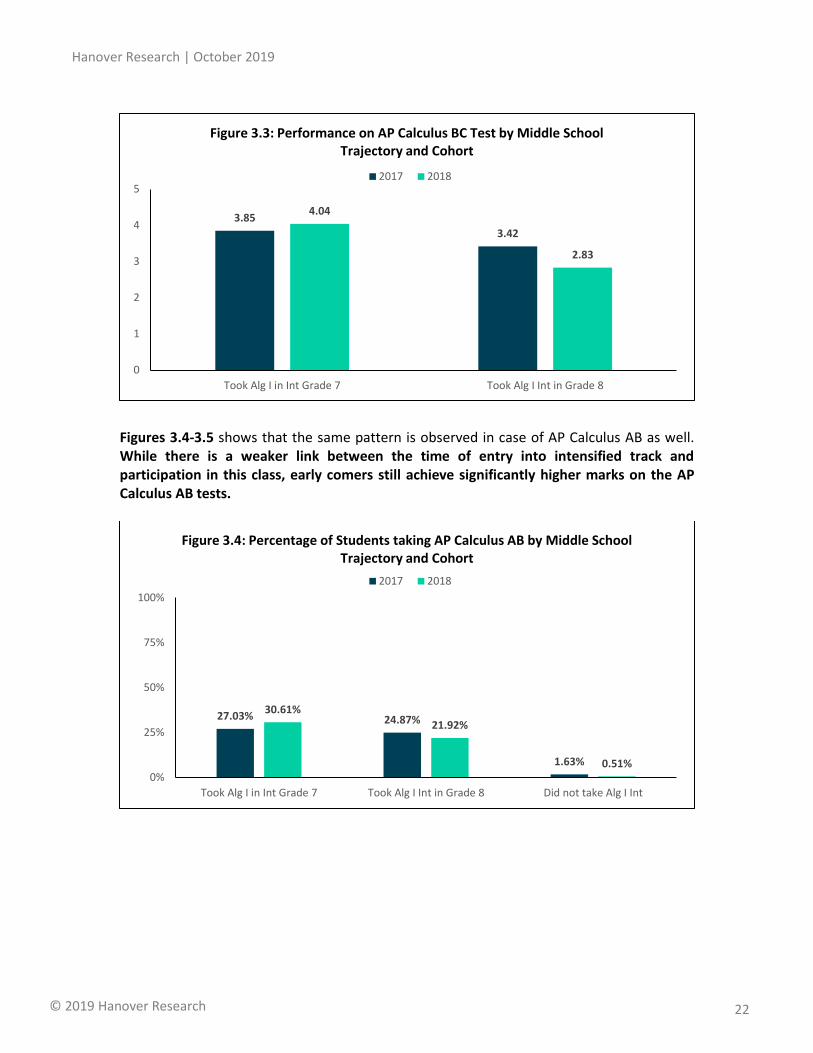
Figures 3.2-3.3 show that a similar pattern is observed for AP Calculus BC participation and performance on the AP test. Early comers to Algebra I Intensified are more likely to eventually take AP Calculus BC and achieve, on average, higher marks on the AP exam than the minority of late comers who do take AP Calculus BC.
90.99%
37.65%
0.98%
88.44%
26.85%
0.51%0%
25%
50%
75%
100%
Took Alg I in Int Grade 7 Took Alg I Int in Grade 8 Did not take Alg I Int
Figure 3.1: Percentage of Students taking Algebra II Intensified by Middle School Trajectory and Cohort
2017 2018
54.05%
6.30%0.00%
46.94%
7.11%0.00%
0%
25%
50%
75%
100%
Took Alg I in Int Grade 7 Took Alg I Int in Grade 8 Did not take Alg I Int
Figure 3.2: Percentage of Students taking AP Calculus BC by Middle School Trajectory and Cohort
2017 2018
Hanover Research | October 2019
© 2019 Hanover Research 22
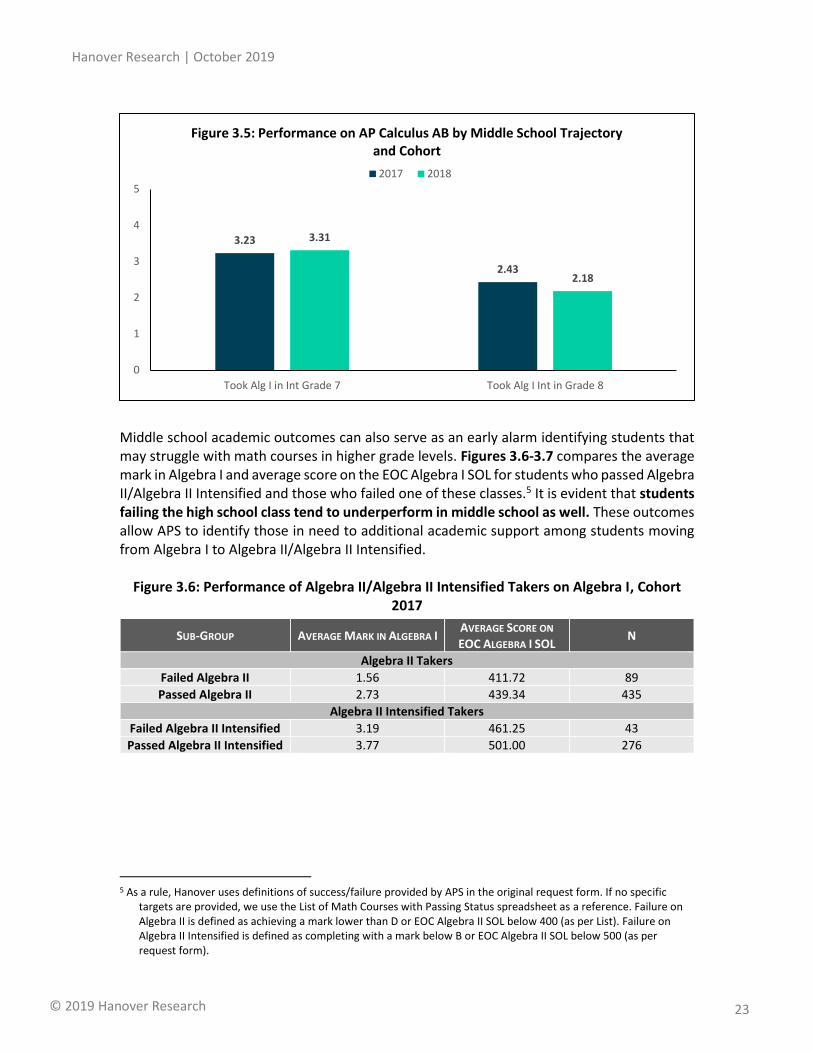
Figures 3.4-3.5 shows that the same pattern is observed in case of AP Calculus AB as well. While there is a weaker link between the time of entry into intensified track and participation in this class, early comers still achieve significantly higher marks on the AP Calculus AB tests.
3.85
3.42
4.04
2.83
0
1
2
3
4
5
Took Alg I in Int Grade 7 Took Alg I Int in Grade 8
Figure 3.3: Performance on AP Calculus BC Test by Middle School Trajectory and Cohort
2017 2018
27.03% 24.87%
1.63%
30.61%
21.92%
0.51%0%
25%
50%
75%
100%
Took Alg I in Int Grade 7 Took Alg I Int in Grade 8 Did not take Alg I Int
Figure 3.4: Percentage of Students taking AP Calculus AB by Middle School Trajectory and Cohort
2017 2018
Hanover Research | October 2019
© 2019 Hanover Research 23
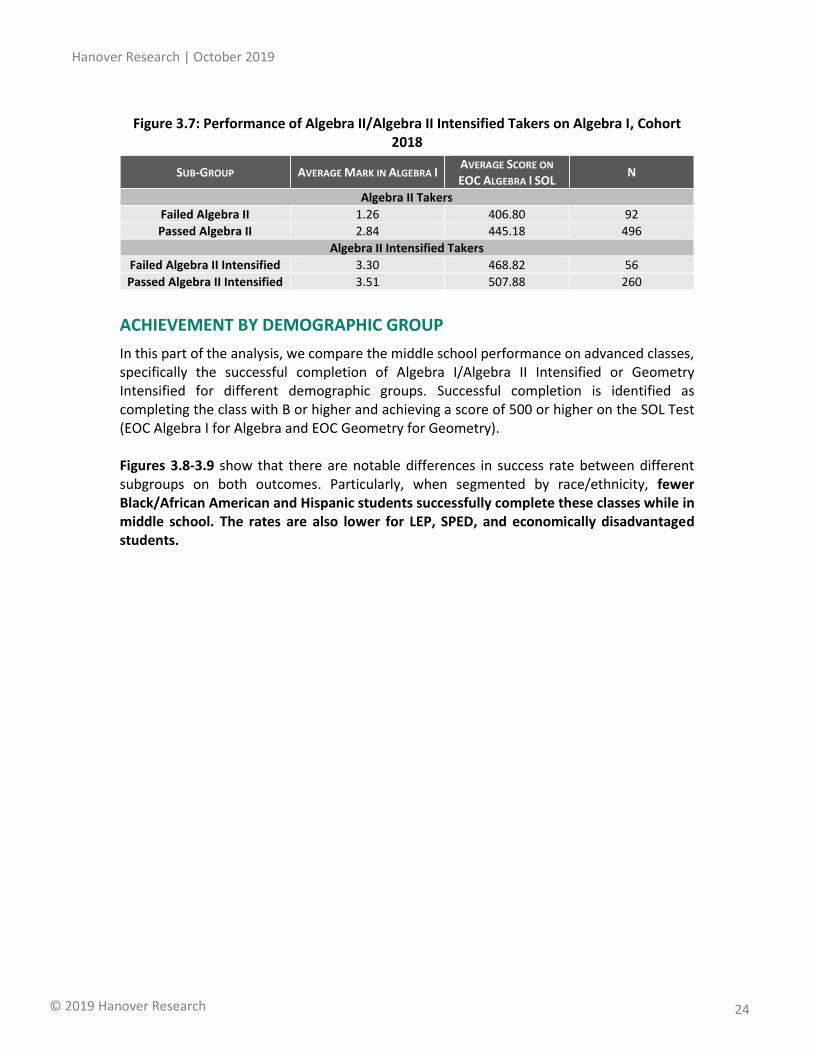
Middle school academic outcomes can also serve as an early alarm identifying students that may struggle with math courses in higher grade levels. Figures 3.6-3.7 compares the average mark in Algebra I and average score on the EOC Algebra I SOL for students who passed Algebra II/Algebra II Intensified and those who failed one of these classes.5 It is evident that students failing the high school class tend to underperform in middle school as well. These outcomes allow APS to identify those in need to additional academic support among students moving from Algebra I to Algebra II/Algebra II Intensified.
Figure 3.6: Performance of Algebra II/Algebra II Intensified Takers on Algebra I, Cohort 2017
SUB-GROUP AVERAGE MARK IN ALGEBRA I AVERAGE SCORE ON
EOC ALGEBRA I SOL N
Algebra II Takers
Failed Algebra II 1.56 411.72 89
Passed Algebra II 2.73 439.34 435
Algebra II Intensified Takers
Failed Algebra II Intensified 3.19 461.25 43
Passed Algebra II Intensified 3.77 501.00 276
5 As a rule, Hanover uses definitions of success/failure provided by APS in the original request form. If no specific
targets are provided, we use the List of Math Courses with Passing Status spreadsheet as a reference. Failure on Algebra II is defined as achieving a mark lower than D or EOC Algebra II SOL below 400 (as per List). Failure on Algebra II Intensified is defined as completing with a mark below B or EOC Algebra II SOL below 500 (as per request form).
3.23
2.43
3.31
2.18
0
1
2
3
4
5
Took Alg I in Int Grade 7 Took Alg I Int in Grade 8
Figure 3.5: Performance on AP Calculus AB by Middle School Trajectory and Cohort
2017 2018
Hanover Research | October 2019
© 2019 Hanover Research 24
Figure 3.7: Performance of Algebra II/Algebra II Intensified Takers on Algebra I, Cohort 2018
SUB-GROUP AVERAGE MARK IN ALGEBRA I AVERAGE SCORE ON
EOC ALGEBRA I SOL N
Algebra II Takers
Failed Algebra II 1.26 406.80 92
Passed Algebra II 2.84 445.18 496
Algebra II Intensified Takers
Failed Algebra II Intensified 3.30 468.82 56
Passed Algebra II Intensified 3.51 507.88 260
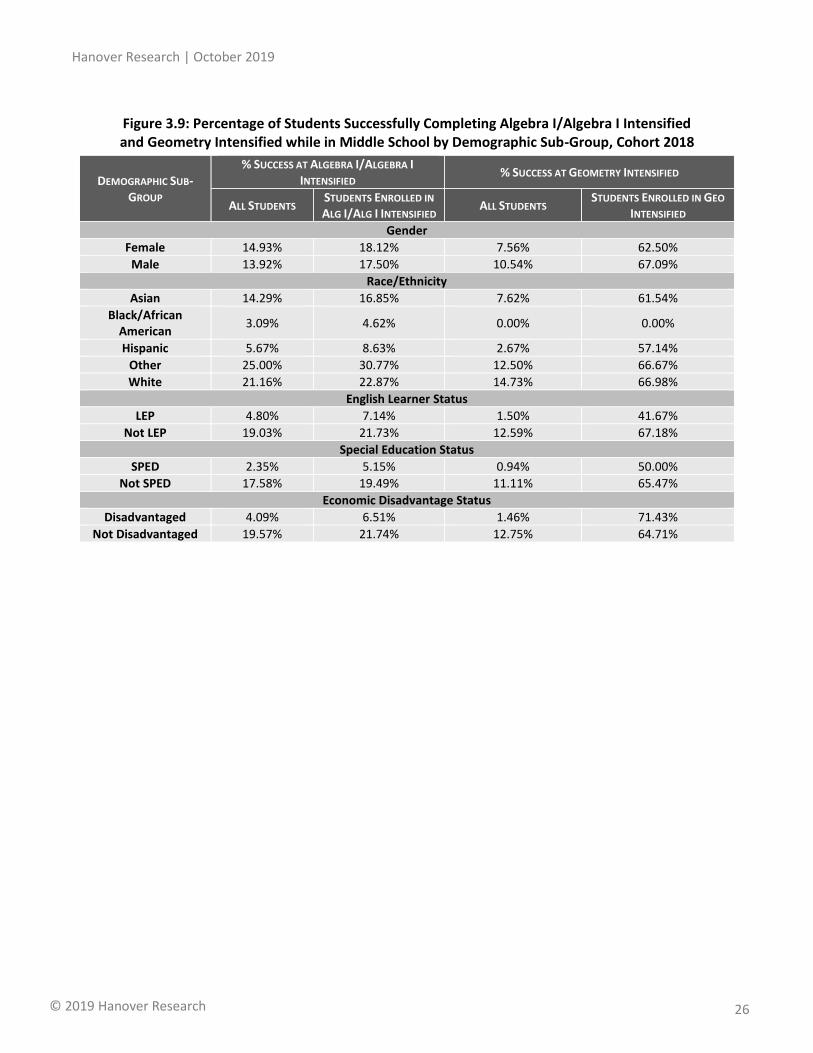
ACHIEVEMENT BY DEMOGRAPHIC GROUP
In this part of the analysis, we compare the middle school performance on advanced classes, specifically the successful completion of Algebra I/Algebra II Intensified or Geometry Intensified for different demographic groups. Successful completion is identified as completing the class with B or higher and achieving a score of 500 or higher on the SOL Test (EOC Algebra I for Algebra and EOC Geometry for Geometry). Figures 3.8-3.9 show that there are notable differences in success rate between different subgroups on both outcomes. Particularly, when segmented by race/ethnicity, fewer Black/African American and Hispanic students successfully complete these classes while in middle school. The rates are also lower for LEP, SPED, and economically disadvantaged students.

Hanover Research | October 2019
© 2019 Hanover Research 25
Figure 3.8: Percentage of Students Successfully Completing Algebra I/Algebra I Intensified and Geometry Intensified while in Middle School by Demographic Sub-Group, Cohort 2017
DEMOGRAPHIC SUB-GROUP
% SUCCESS AT ALGEBRA I/ALGEBRA I INTENSIFIED
% SUCCESS AT GEOMETRY INTENSIFIED
ALL STUDENTS STUDENTS ENROLLED IN ALG I/ALG I INTENSIFIED
ALL STUDENTS STUDENTS ENROLLED IN GEO
INTENSIFIED
Gender
Female 14.95% 20.73% 7.47% 69.81%
Male 11.16% 16.92% 6.90% 61.82%
Race/Ethnicity
Asian 10.71% 15.00% 8.33% 70.00%
Black/African American
2.86% 7.69% 0.00% 0.00%
Hispanic 6.56% 13.93% 1.54% 28.57%
Other 11.86% 15.22% 8.47% 62.50%
White 19.33% 22.41% 11.43% 74.32%
English Learner Status
LEP 3.99% 9.57% 0.72% 66.67%
Not LEP 16.57% 20.81% 9.69% 65.71%
Special Education Status
SPED 1.13% 3.77% 2.26% 80.00%
Not SPED 15.66% 20.19% 8.26% 65.05%
Economic Disadvantage Status
Disadvantaged 3.13% 7.91% 1.14% 44.44%
Not Disadvantaged 18.55% 21.73% 10.53% 67.68%
Hanover Research | October 2019
© 2019 Hanover Research 26
Figure 3.9: Percentage of Students Successfully Completing Algebra I/Algebra I Intensified and Geometry Intensified while in Middle School by Demographic Sub-Group, Cohort 2018
DEMOGRAPHIC SUB-GROUP
% SUCCESS AT ALGEBRA I/ALGEBRA I INTENSIFIED
% SUCCESS AT GEOMETRY INTENSIFIED
ALL STUDENTS STUDENTS ENROLLED IN ALG I/ALG I INTENSIFIED
ALL STUDENTS STUDENTS ENROLLED IN GEO
INTENSIFIED
Gender
Female 14.93% 18.12% 7.56% 62.50%
Male 13.92% 17.50% 10.54% 67.09%
Race/Ethnicity
Asian 14.29% 16.85% 7.62% 61.54%
Black/African American
3.09% 4.62% 0.00% 0.00%
Hispanic 5.67% 8.63% 2.67% 57.14%
Other 25.00% 30.77% 12.50% 66.67%
White 21.16% 22.87% 14.73% 66.98%
English Learner Status
LEP 4.80% 7.14% 1.50% 41.67%
Not LEP 19.03% 21.73% 12.59% 67.18%
Special Education Status
SPED 2.35% 5.15% 0.94% 50.00%
Not SPED 17.58% 19.49% 11.11% 65.47%
Economic Disadvantage Status
Disadvantaged 4.09% 6.51% 1.46% 71.43%
Not Disadvantaged 19.57% 21.74% 12.75% 64.71%
Hanover Research | October 2019
© 2019 Hanover Research 27
SECTION IV: ENGLISH LEARNERS AND SPECIAL EDUCATION STUDENTS
In this section, we take a closer look at English Learners and Special Education students, examine how fast they reach credit-bearing math classes, and summarize their performance in these classes.
MAIN TAKEAWAYS
Students who enter Grade 6 as Monitored LEP tend to reach credit-bearing math courses at APS in later grade levels as compared to those who enter as HILT or HILTEX students. At the same time, more Monitored students pass these classes at their first attempt.
Around 87-88 percent of Special Education students reach credit-bearing classes by Grade 9. At the same time, 62-69 percent of these students pass their first credit-bearing class at their first attempt.
MATH TRAJECTORY AND ACHIEVEMENT
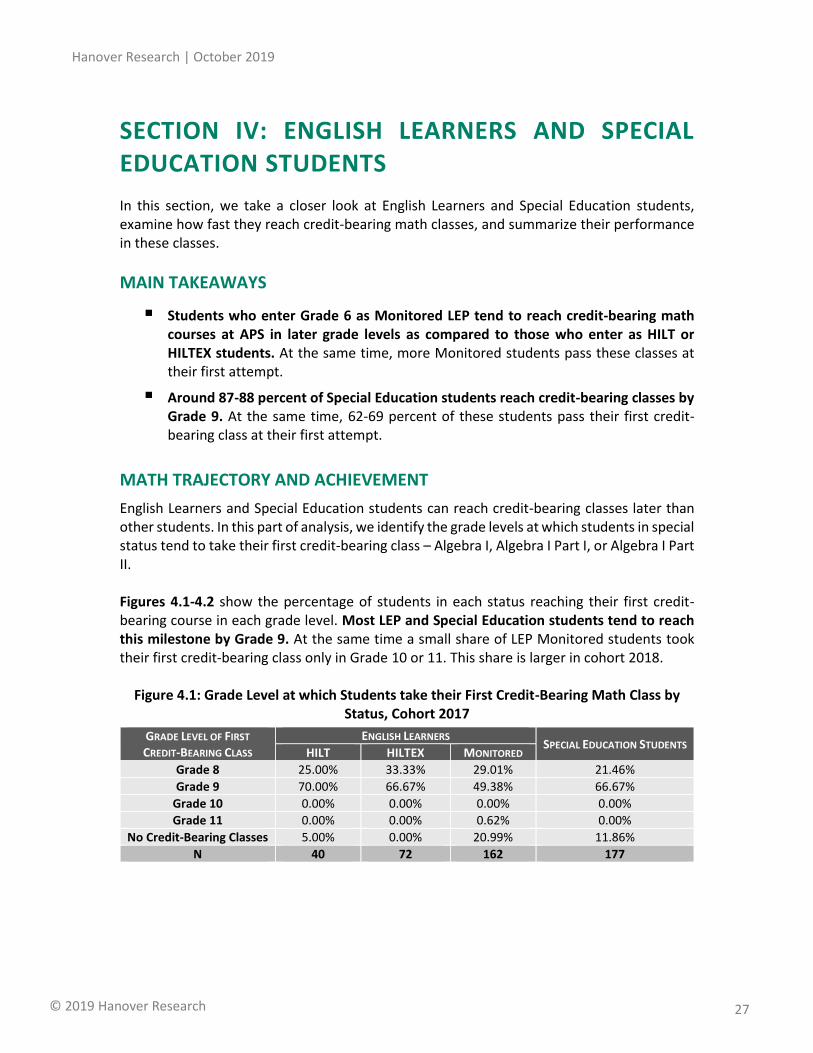
English Learners and Special Education students can reach credit-bearing classes later than other students. In this part of analysis, we identify the grade levels at which students in special status tend to take their first credit-bearing class – Algebra I, Algebra I Part I, or Algebra I Part II. Figures 4.1-4.2 show the percentage of students in each status reaching their first credit-bearing course in each grade level. Most LEP and Special Education students tend to reach this milestone by Grade 9. At the same time a small share of LEP Monitored students took their first credit-bearing class only in Grade 10 or 11. This share is larger in cohort 2018.
Figure 4.1: Grade Level at which Students take their First Credit-Bearing Math Class by Status, Cohort 2017
GRADE LEVEL OF FIRST
CREDIT-BEARING CLASS
ENGLISH LEARNERS SPECIAL EDUCATION STUDENTS
HILT HILTEX MONITORED
Grade 8 25.00% 33.33% 29.01% 21.46%
Grade 9 70.00% 66.67% 49.38% 66.67%
Grade 10 0.00% 0.00% 0.00% 0.00%
Grade 11 0.00% 0.00% 0.62% 0.00%
No Credit-Bearing Classes 5.00% 0.00% 20.99% 11.86%
N 40 72 162 177
Hanover Research | October 2019
© 2019 Hanover Research 28
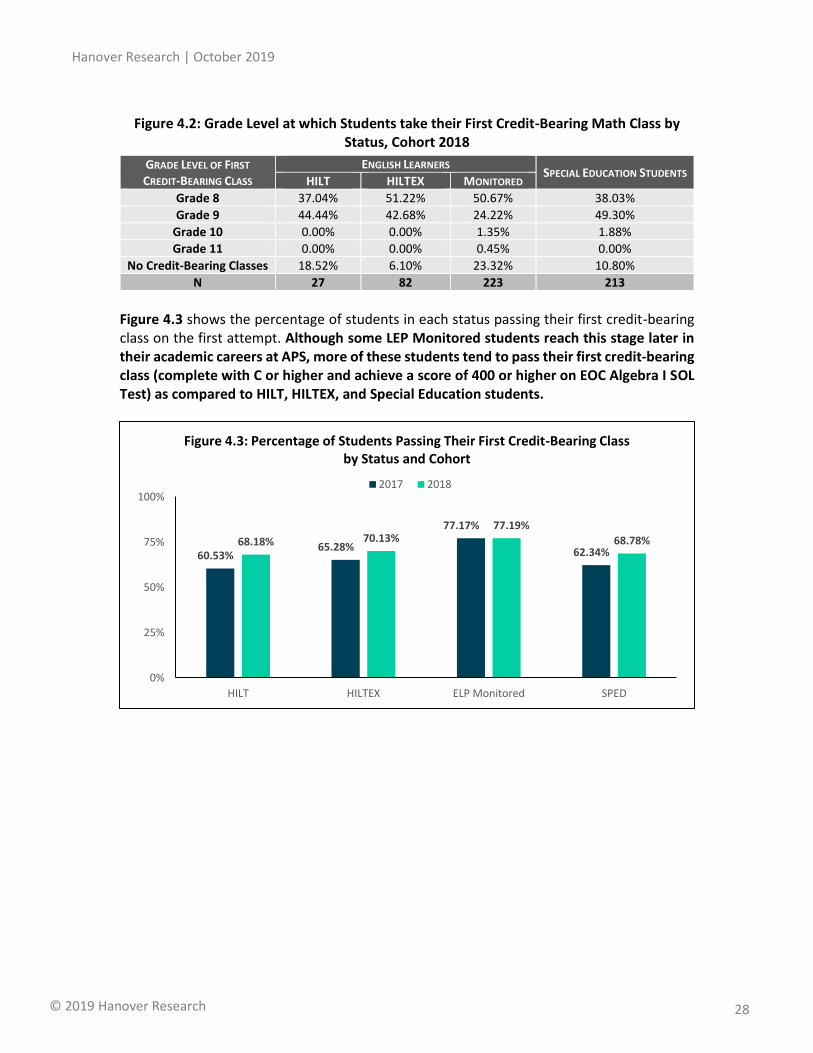
Figure 4.2: Grade Level at which Students take their First Credit-Bearing Math Class by Status, Cohort 2018
GRADE LEVEL OF FIRST
CREDIT-BEARING CLASS
ENGLISH LEARNERS SPECIAL EDUCATION STUDENTS
HILT HILTEX MONITORED
Grade 8 37.04% 51.22% 50.67% 38.03%
Grade 9 44.44% 42.68% 24.22% 49.30%
Grade 10 0.00% 0.00% 1.35% 1.88%
Grade 11 0.00% 0.00% 0.45% 0.00%
No Credit-Bearing Classes 18.52% 6.10% 23.32% 10.80%
N 27 82 223 213
Figure 4.3 shows the percentage of students in each status passing their first credit-bearing class on the first attempt. Although some LEP Monitored students reach this stage later in their academic careers at APS, more of these students tend to pass their first credit-bearing class (complete with C or higher and achieve a score of 400 or higher on EOC Algebra I SOL Test) as compared to HILT, HILTEX, and Special Education students.
60.53%65.28%
77.17%
62.34%68.18% 70.13%
77.19%
68.78%
0%
25%
50%
75%
100%
HILT HILTEX ELP Monitored SPED
Figure 4.3: Percentage of Students Passing Their First Credit-Bearing Class by Status and Cohort
2017 2018
PROJECT EVALUATION FORM Hanover Research is committed to providing a work product that meets or exceeds client expectations. In keeping with that goal, we would like to hear your opinions regarding our reports. Feedback is critically important and serves as the strongest mechanism by which we tailor our research to your organization. When you have had a chance to evaluate this report, please take a moment to fill out the following questionnaire. http://www.hanoverresearch.com/evaluation/index.php
CAVEAT The publisher and authors have used their best efforts in preparing this brief. The publisher and authors make no representations or warranties with respect to the accuracy or completeness of the contents of this brief and specifically disclaim any implied warranties of fitness for a particular purpose. There are no warranties that extend beyond the descriptions contained in this paragraph. No warranty may be created or extended by representatives of Hanover Research or its marketing materials. The accuracy and completeness of the information provided herein and the opinions stated herein are not guaranteed or warranted to produce any particular results, and the advice and strategies contained herein may not be suitable for every client. Neither the publisher nor the authors shall be liable for any loss of profit or any other commercial damages, including but not limited to special, incidental, consequential, or other damages. Moreover, Hanover Research is not engaged in rendering legal, accounting, or other professional services. Clients requiring such services are advised to consult an appropriate professional.
4401 Wilson Boulevard, Suite 400
Arlington, VA 22203
P 202.559.0500 F 866.808.6585
www.hanoverresearch.com