Embed Size (px)
Citation preview

AUDITED
ANNUAL FINANCIAL STATEMENT
South Dublin County Council
For the year ended 31st December 2019

Page
Financial Review 2Certificate of Chief Executive/Head of Finance 6Audit Opinion 7Statement of Accounting Policies 8
Financial AccountsStatement of Comprehensive Income (Income & Expenditure Account) 13Statement of Financial Position (Balance Sheet) 14Statement of Funds Flow (Funds Flow Statement) 15
Notes on and forming part of the Accounts1 Fixed Assets 162 Work In Progress & Preliminary Expenses 173 Long Term Debtors 174 Stocks 185 Trade Debtors & Prepayments 186 Creditors & Accruals 197 Loans Payable 198 Refundable Deposits 209 Capitalisation Account 20
10 Other Balances 2111 Capital Account Analysis 2212 Mortgage Loan Funding Surplus/(Deficit) 2213 Summary of Plant & Materials Account 2214 Transfers From/(To) Reserves 2315 Analysis of Revenue Income 2316 Over/Under Expenditure 2417 Net Cash Inflow/(Outflow) from Operating Activities 2518 Increase/(Decrease) in Reserve Balances 2519 (Increase)/Decrease in Other Capital Balances 2520 Increase/(Decrease) in Loan Financing 2521 (Increase)/Decrease in Reserve Financing 2622 Analysis of Changes in Cash & Cash Equivalents 2623 Post Balance Sheet Event (Non Adjusting Event) Covid 19 26
Appendices1 Analysis of Expenditure 282 Expenditure and Income by Division 293 Analysis of Income from Grants and Subsidies 374 Analysis of Income from Goods and Services 385 Summary of Capital Expenditure and Income 396 Capital Expenditure and Income by Division 407 Major Revenue Collections 418 Interest of Local Authorities in Companies 42
CONTENTSAUDITED

Annual Financial Statement for Financial Year ended 31st December 2019
Financial Review
South Dublin County Council
Page 2

Page 3
Page 4

Page 5

Page 6
South Dublin County Council
Page 7

STATEMENT OF ACCOUNTING POLICIES
1. General
The accounts have been prepared in accordance with the Accounting Code of Practice ACoP on local authority accounting, as revised by the Department of Housing, Planning and Local Government (DHPLG) at 31st December 2019. Non-compliance with accounting policies as set out in ACoP must be stated in the Policies and Notes to the Accounts.
2. Statement of Funds Flow (Funds Flow Statement)
A Statement of Funds Flow was introduced as part of AFS 2011. While the guidance of InternationalAccounting Standard 7 Statement of Cash Flows has been followed, the business of local authorities issubstantially different to most private sector organisations and therefore some minor changes to the formathave been agreed to ensure the data displayed is meaningful and useful within the local government sector.For this reason the statement is being referred to as a ‘Statement of Funds Flow’. The financial accountsnow include a Statement of Funds Flow shown after the Statement of Financial Position (Balance Sheet).Notes 17 – 22 relate to the Statement of Funds Flow and are shown in the Notes on and forming part of theAccounts section of the AFS. Note 19 details Project/Non Project/Affordable/Voluntary balances, which canbe either a debit or a credit balance. The funds flow assumes that these are debit balances and bases the(Increase)/Decrease description on this.
3. Accruals
The revenue and capital accounts have been prepared on an accrual basis in accordance with the Code of Practice.
4. Interest Charges
Loans payable can be divided into the following two categories: • Mortgage related loans • Non- mortgage related loans
4.1 Mortgage Related Loans
Mortgage related loans have a corresponding stream of income from long term advances (i.e. monies lent by the local authorities to borrowers), for the purchase of houses. Only the interest element is charged or credited to the Statement of Comprehensive Income (Income and Expenditure Statement).
4.2 Non Mortgage Related Loans
Note 7 to the accounts sets out the types of borrowing under this heading. Loans relating to assets/grants, revenue funding will not have a corresponding stream of income. Bridging finance will eventually become part of permanent funding. Loans in respect of the other headings will have a corresponding value in Note 3.
Page 8

5. Pensions Payments in respect of pensions and gratuities are charged to the revenue account in the accounting period in which the payments are made. The cost of salaries and wages in the accounts includes deductions in respect of pension contributions (including Widows and Orphans) benefits under the Local Government Superannuation Scheme and the Single Public Service Pension Scheme. The Single Public Service Pension Scheme (“Single Scheme”) commenced with effect from 1 January 2013. Employee contributions for the Single Scheme continue to be deducted by local authorities but are remitted centrally to DPER.
6. Agency and Other Services
Expenditure on services provided or carried out on behalf of other local authorities is recouped at cost or in accordance with specific agreements.
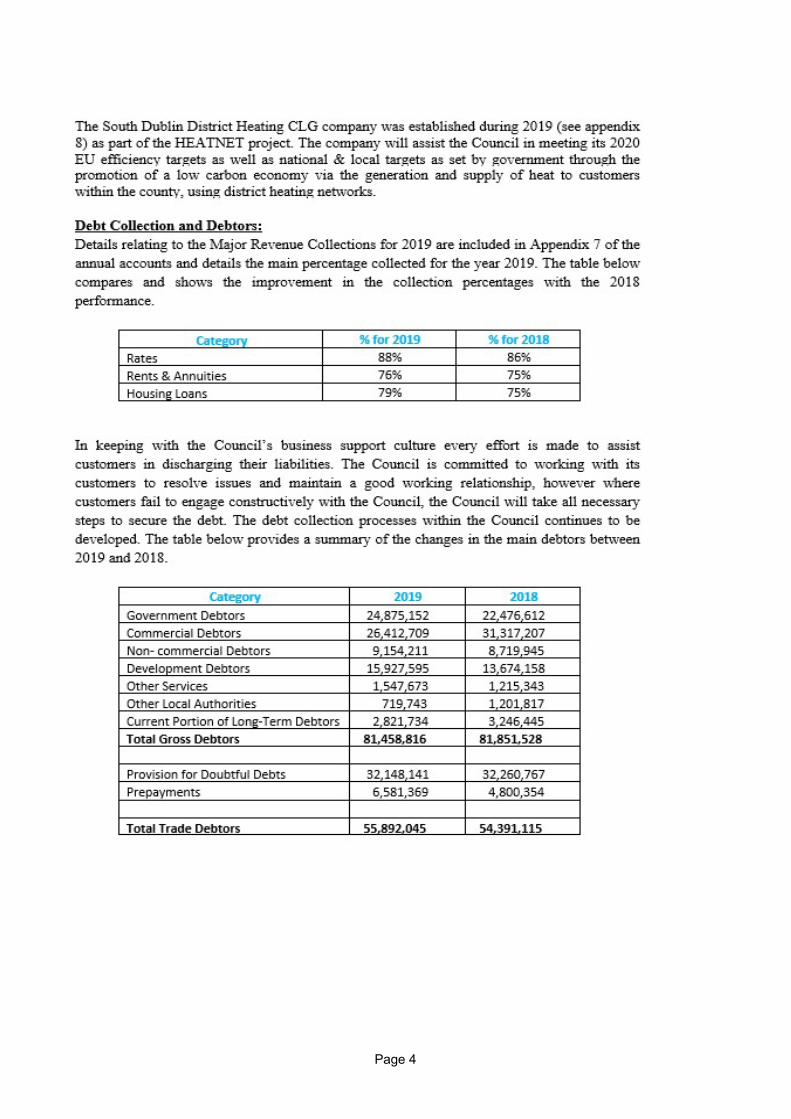
7. Provision for Bad & Doubtful Debts
Provision has been made in the relevant accounts for bad & doubtful debts.
8. Fixed Assets
8.1 Classification of Assets
Fixed assets are classified into categories as set out in the Statement of Financial Position (Balance Sheet). A further breakdown by asset type is set out in note 1 to the accounts.
8.2 Recognition
All expenditure on the acquisition or construction of fixed assets is capitalised on an accrual basis.
8.3 Measurement
A Statement of Financial Position (Balance Sheet) incorporating all of the assets of the local authority was included for the first time in the Annual Financial Statement for 2003. The assets were valued based on the 'Valuation Guideline' issued by the DHPLG. All assets purchased or constructed as from 1/1/2004 have been included at historical cost. Accounting policies relating to leases are currently being developed and will be reflected in the financial statements at a future date.
8.4 Revaluation
As set out in a revision to the Accounting Code of Practice it is policy to show fixed assets at cost. Maintenance and enhancement costs associated with Infrastructure assets are not currently included in fixed assets but will be reviewed at a future date. Due to their physical nature the vast majority of assets are unique to local authorities and are not subject to disposal. Any loss or gain associated with the net realisable value of the remaining general assets subject to disposal, are accounted for at time of disposal.
8.5 Disposals
In respect of disposable assets, income is credited to a specific reserve and is generally applied in the purchase of new assets. Proceeds of the sale of local authority houses are to be applied as directed by the DHPLG.
Page 9

8.6 Depreciation
Under the current method of accounting, the charge for depreciation is offset by the amortisation of the source of funding the asset. This method has a neutral impact on Income & Expenditure and consequently the charge for depreciation and the corresponding credit from amortisation is excluded from the Statement of Comprehensive Income (Income & Expenditure Statement).
The policies applied to assets subject to depreciation are as follows:
The Council does not charge depreciation in the year of disposal and will charge a full year's depreciation in the year of acquisition.
9. Government Grants
Government grants are accounted for on an accrual basis. Grants received to cover day-to-day operations are credited to the Statement of Comprehensive Income (Income & Expenditure Statement). Grants received, relating to the construction of assets, are shown as part of the income of work-in-progress. On completion of the project the income is transferred to a capitalisation account.
10. Development Debtors & Income
Short term development levy debtors are included in note 5. Income from development contributions not due to be paid within the current year is deferred and not separately disclosed in the financial statements.
11. Debt Redemption
The proceeds from the early redemption of loans by borrowers, are applied to the redemption of mortgage related borrowings from the HFA and OPW.
12. Lease Schemes
Rental payments under operating leases are charged to the Statement of Comprehensive Income (Income & Expenditure Statement). Assets acquired under a finance lease are included in fixed assets. The amount due on outstanding balances is shown under current liabilities and long-term creditors.
Asset Type Bases Depreciation Rate Plant & Machinery - Long life S/L 10% - Short life S/L 20% Equipment S/L 20% Furniture S/L 20% Heritage Assets Nil Library Books Nil Playgrounds S/L 20% Parks S/L 2% Water Assets - Water schemes S/L Asset life over 70 years - Drainage schemes S/L Asset life over 50 years
Asset Type Bases Depreciation Rate Plant & Machinery - Long life S/L 10% - Short life S/L 20% Equipment S/L 20% Furniture S/L 20% Heritage Assets Nil Library Books Nil Playgrounds S/L 20% Parks S/L 2% Water Assets - Water schemes S/L Asset life over 70 years - Drainage schemes S/L Asset life over 50 years
Page 10

13. Stock
Stocks are valued on an average cost basis.
14. Work-in-Progress & Preliminary Expenditure
Work-in progress and preliminary expenditure is the accumulated historical cost of various capital related projects. The income accrued in respect of these projects is shown in the Statement of Financial Position (Balance Sheet) as 'Income WIP'.
15. Interest in Local Authority Companies
The interest of South Dublin County Council in companies is listed in Appendix 8.
16. Related Parties
A related party transaction is a transfer of resources, services or obligations between the local authority and a related party. The main related parties for a local authority include the following: i. Management and Personnel ii. Council members iii. Government Departments iv. Local Authority CompaniesLocal Authority council members and key personnel are bound under the relevant sections of the Local Government Act 2001 and subsequent amending legislation to:a. furnish an annual declaration of 'declarable interests' set out in section 175 of the Act; b. disclose under sections 167, 178 and 179 any beneficial interests that they or a connected person has; and c. follow a code of conduct issued by the Minister for Housing, Planning and Local Government under section 169 of the Local Government Act 2001 in 2004.'Declarable interests' cover both financial and certain other interests such as land etc. Local authority management and personnel salary and remuneration is determined by the Department of Housing, Planning and Local Government in line with central government policy on rates of pay.Local Authority interests in companies and joint ventures are disclosed in Appendix 8 to the Annual Financial Statements.Local Authority transactions with government departments are governed by central government controls and procedures driven by government accounting rules.
Page 11

FINANCIAL ACCOUNTS

The Income and Expenditure Account Statement brings together all the revenue related income and expenditure.
It shows the surplus/(deficit) for the year. Transfers to/from reserves are shown separately and not allocated by service division.
Note 16 allocates transfers by service division in the same format as Table A of the adopted Local Authority budget.
Expenditure by DivisionGross Expenditure Income Net Expenditure Net Expenditure
2019 2019 2019 2018Notes € € € €
Housing & Building 70,611,922 70,208,317 403,605 (2,033,674)
Roads Transportation & Safety 29,368,357 6,641,034 22,727,323 20,418,090
Water Services 12,034,866 8,990,907 3,043,959 3,176,622
Development Management 15,489,675 6,940,682 8,548,992 8,734,406
Environmental Services 35,239,529 4,379,857 30,859,673 29,517,789
Recreation & Amenity 37,904,687 4,497,349 33,407,338 31,202,890
Agriculture, Education, Health & Welfare 1,372,009 643,303 728,706 737,783
Miscellaneous Services 10,605,885 17,367,986 (6,762,101) (217,170)
Total Expenditure/Income 15 212,626,930 119,669,435
Net cost of Divisions to be funded from 92,957,495 91,536,737
Rates & Local Property Tax
Rates 122,312,727 121,485,055
Local Property Tax 5,436,834 5,431,730
Surplus/(Deficit) for Year before Transfers 16 34,792,065 35,380,049
Transfers from/(to) Reserves 14 (34,787,992) (35,340,742)
Overall Surplus/(Deficit) for Year 4,073 39,306
General Reserve @ 1st January 2019 12,185,836 12,146,530
General Reserve @ 31st December 2019 12,189,910 12,185,836
FOR YEAR ENDING 31st DECEMBER 2019STATEMENT OF COMPREHENSIVE INCOME (INCOME & EXPENDITURE ACCOUNT STATEMENT)
Page 13

Notes 2019 2018€ €
Fixed Assets 1
Operational 2,098,002,789 2,003,599,187 Infrastructural 1,143,897,032 1,148,140,158 Community 9,680,900 9,162,255 Non-Operational 84,828,743 84,527,783
3,336,409,463 3,245,429,383
Work in Progress and Preliminary Expenses 2 77,594,462 111,425,722
Long Term Debtors 3 178,069,516 166,956,501
Current AssetsStocks 4 - - Trade Debtors & Prepayments 5 55,892,045 54,391,115 Bank Investments 283,926,285 233,635,396 Cash at Bank 1,210,442 1,963,273 Cash in Transit 33,862 34,667
341,062,634 290,024,451
Current Liabilities (Amounts falling due within one year)Bank Overdraft - - Creditors & Accruals 6 47,775,381 49,623,027 Finance Leases - -
47,775,381 49,623,027
Net Current Assets / (Liabilities) 293,287,252 240,401,424
Creditors (Amounts falling due after more than one year)Loans Payable 7 181,739,121 181,779,507 Finance Leases - - Refundable deposits 8 30,698,518 23,260,775 Other 38,177,830 27,710,363
250,615,470 232,750,645
Net Assets 3,634,745,224 3,531,462,386
Represented by
Capitalisation Account 9 3,336,409,463 3,245,429,383 Income WIP 2 88,124,184 127,252,655 Specific Revenue Reserve - 304,110 General Revenue Reserve 12,189,910 12,185,836 Other Balances 10 198,021,666 146,290,402
Total Reserves 3,634,745,223 3,531,462,386
STATEMENT OF FINANCIAL POSITION (BALANCE SHEET) AT 31st DECEMBER 2019
Page 14

2019 2019Note € €
REVENUE ACTIVITIESNet Inflow/(outflow) from operating activities 17 (3,344,502)
CAPITAL ACTIVITIESReturns on Investment & Servicing of FinanceIncrease/(Decrease) in Fixed Asset Capitalisation Funding 90,980,081 Increase/(Decrease) in WIP/Preliminary Funding (39,128,471) Increase/(Decrease) in Reserves Balances 18 32,545,764 Net Inflow/(Outflow) from Returns on Investment and Servicing of Finance 84,397,374
Capital Expenditure & Financial Investment(Increase)/Decrease in Fixed Assets (90,980,081) (Increase)/Decrease in WIP/Preliminary Funding 33,831,261 (Increase)/Decrease in Other Capital Balances 19 18,066,455 Net Inflow/(Outflow) from Capital Expenditure and Financial Investment (39,082,365)
FinancingIncrease/(Decrease) in Loan Financing 20 (685,933) (Increase)/Decrease in Reserve Financing 21 814,936 Net Inflow/(Outflow) from Financing Activities 129,003
Third Party HoldingsIncrease/(Decrease) in Refundable Deposits 7,437,744
Net Increase/(Decrease) in Cash and Cash Equivalents 22 49,537,253
STATEMENT OF FUNDS FLOW (FUNDS FLOW STATEMENT)
AS AT 31ST DECEMBER 2019
Page 15

1. Fixed Assets
Land Parks Housing Buildings
Plant & Machinery
(Long & Short Life)
Computers, Furniture & Equipment
Heritage Roads & InfrastructureWater &
Sewerage Network
Total
€ € € € € € € € € €CostsAccumulated Costs @ 1/1/2019 72,973,824 6,454,422 1,655,226,328 356,110,932 47,596,994 2,370,548 6,079,588 976,042,809 384,222,061 3,507,077,504
Additions - Purchased 1,120,960 - 46,803,107 783,000 370,277 22,755 - - - 49,100,099 - Transfers WIP - 778,220 49,466,160 - - - - 3,455,653 - 53,700,034 Disposals\Statutory Transfers (820,000) - (2,197,980) - (834,887) - - - - (3,852,866) Revaluations - - - - - - - - - - Historical Cost Adjustments - - - - - - - - - -
Accumulated Costs @ 31/12/2019 73,274,784 7,232,642 1,749,297,615 356,893,932 47,132,384 2,393,303 6,079,588 979,498,462 384,222,061 3,606,024,770
DepreciationDepreciation @ 1/1/2019 - 3,299,763 - - 43,005,201 2,194,041 - - 213,149,117 261,648,121
Provision for Year - 318,521 - - 717,250 68,642 - - 7,684,441 8,788,854 Disposals\Statutory Transfers - - - - (821,669) - - - - (821,669)
Accumulated Depreciation @ 31/12/2019 - 3,618,284 - - 42,900,782 2,262,683 - - 220,833,558 269,615,306
Net Book Value @ 31/12/2019 73,274,784 3,614,358 1,749,297,615 356,893,932 4,231,602 130,620 6,079,588 979,498,462 163,388,503 3,336,409,463
Net Book Value @ 31/12/2018 72,973,824 3,154,659 1,655,226,328 356,110,932 4,591,793 176,507 6,079,588 976,042,809 171,072,944 3,245,429,383
Net Book Value by CategoryOperational 1,096,518 - 1,749,297,615 341,579,433 4,231,602 130,620 105,718 - 1,561,282 2,098,002,789 Infrastructural - 2,571,349 - - - - - 979,498,462 161,827,221 1,143,897,032 Community - 1,043,008 - 2,664,022 - - 5,973,870 - - 9,680,900 Non-Operational 72,178,266 - - 12,650,477 - - - - - 84,828,743
Net Book Value @ 31/12/2019 73,274,784 3,614,358 1,749,297,615 356,893,932 4,231,602 130,620 6,079,588 979,498,462 163,388,503 3,336,409,463
NOTES TO AND FORMING PART OF THE ACCOUNTS
Page 16

2. Work in Progress and Preliminary Expenses
A summary of work in progress and preliminary expenditure by asset category is as follows:
Funded Unfunded Total Total2019 2019 2019 2018
€ € € €
ExpenditureWork in Progress 36,805,864 - 36,805,864 80,649,749 Preliminary Expenses 40,788,598 - 40,788,598 30,775,974
77,594,462 - 77,594,462 111,425,722
IncomeWork in Progress 41,050,932 - 41,050,932 93,234,337 Preliminary Expenses 47,073,252 - 47,073,252 34,018,318
88,124,184 - 88,124,184 127,252,655
Net ExpendedWork in Progress (4,245,068) - (4,245,068) (12,584,589) Preliminary Expenses (6,284,654) - (6,284,654) (3,242,344)
Net Over/(Under) Expenditure (10,529,722) - (10,529,722) (15,826,933)
3. Long Term Debtors
A breakdown of the long-term debtors is as follows:Balance @ Loans Principal Early Other Balance @ Balance @
1/1/2019 Issued Repaid Redemptions Adjustments 31/12/2019 31/12/2018€ € € € € € €
Long Term Mortgage Advances* 42,513,692 9,647,135 (2,671,711) (949,343) (66,145) 48,473,628 42,513,692 Tenant Purchases Advances 299,576 - (129,360) (13,910) 2,067 158,373 299,576 Shared Ownership Rented Equity 5,850,804 - (96,802) (74,280) 5,679,722 5,850,804
48,664,072 9,647,135 (2,801,071) (1,060,056) (138,357) 54,311,723 48,664,072
Recoupable Loan Advances 88,401,696 93,828,512 Capital Advance Leasing Facility 38,177,830 27,710,363 Long-term Investments - -
Cash - - Interest in associated companies - -
Other - - 126,579,527 121,538,875
180,891,250 170,202,947
Less: Amounts falling due within one year (Note 5) (2,821,734) (3,246,445)
Total Amounts falling due after more than one year 178,069,516 166,956,501
* Includes HFA Agency Loans
NOTES TO AND FORMING PART OF THE ACCOUNTS
Page 17

4. Stocks
A summary of stock is as follows:2019 2018
€ €
Central Stores - - Other Depots - -
Total - -
5. Trade Debtors & Prepayments
A breakdown of debtors and prepayments is as follows:2019 2018
€ €
Government Debtors 24,875,152 22,476,612 Commercial Debtors 26,412,709 31,317,207 Non-Commercial Debtors 9,154,211 8,719,945 Development Levy Debtors 15,927,595 13,674,158 Other Services 1,547,673 1,215,343 Other Local Authorities 719,743 1,201,817 Revenue Commissioners - - Other - - Add: Amounts falling due within one year (Note 3) 2,821,734 3,246,445
Total Gross Debtors 81,458,816 81,851,528
Less: Provision for Doubtful Debts (32,148,141) (32,260,767) Total Trade Debtors 49,310,675 49,590,761
Prepayments 6,581,369 4,800,354
55,892,045 54,391,115
NOTES TO AND FORMING PART OF THE ACCOUNTS
Page 18

6. Creditors and Accruals
A breakdown of creditors and accruals is as follows:2019 2018
€ €
Trade creditors 10,220,179 11,139,069 Grants 407,763 196,537 Revenue Commissioners 2,149,844 3,716,544 Other Local Authorities 79,054 1,626,299 Other Creditors 260,573 174,138
13,117,414 16,852,587
Accruals 17,431,739 16,077,709 Deferred Income 8,205,830 7,987,974
Add: Amounts falling due within one year (Note 7) 9,020,398 8,704,757
47,775,381 49,623,027
7. Loans Payable(a) Movement in Loans Payable
HFA OPW Other Balance @ Balance @
31/12/2019 31/12/2018
€ € € € €Balance @ 1/1/2019 185,846,470 - 4,637,794 190,484,264 196,795,776 Borrowings 10,472,185 - - 10,472,185 4,845,068 Repayment of Principal (8,494,129) - (237,836) (8,731,965) (9,658,453) Early Redemptions (1,464,965) - - (1,464,965) (1,498,126) Other Adjustments - - - - - Balance @ 31/12/2019 186,359,561 - 4,399,959 190,759,520 190,484,264
Less: Amounts falling due within one year (Note 6) 9,020,398 8,704,757
Total Amounts falling due after more than one year 181,739,121 181,779,507
(b) Application of LoansAn analysis of loans payable is as follows: HFA OPW Other Balance @ Balance @
31/12/2019 31/12/2018€ € € € €
Mortgage loans* 48,211,544 - - 48,211,544 41,407,841
Non-Mortgage loansAsset/Grants 14,582,575 - - 14,582,575 15,842,819 Revenue Funding - - - - - Bridging Finance 33,997,427 - - 33,997,427 33,997,427 Recoupable 84,001,738 - 4,399,959 88,401,696 93,445,760 Shared Ownership – Rented Equity 5,566,278 - - 5,566,278 5,790,416
186,359,561 - 4,399,959 190,759,520 190,484,264
Less: Amounts falling due within one year (Note 6) 9,020,398 8,704,757
Total Amounts falling due after more than one year 181,739,121 181,779,507
* Includes HFA Agency Loans
NOTES TO AND FORMING PART OF THE ACCOUNTS
Page 19

8. Refundable Deposits
The movement in refundable deposits is as follows:2019 2018
€ €
Opening Balance at 1 January 23,260,775 21,317,544 Deposits received 7,914,006 2,847,500 Deposits repaid (476,263) (904,269)
Closing Balance at 31 December 30,698,518 23,260,775
Note: Short Term Refundable Deposits are included as part of Cash Investments on the Balance sheet
9. Capitalisation Account
The capitalisation account shows the funding of the assets as follows:Balance @ Purchased Transfers Disposals\Statutory Revaluations Historical Balance @ Balance @
1/1/2019 WIP Transfers Cost Adj 31/12/2019 31/12/2018€ € € € € € € €
Grants 708,649,483 47,104,067 49,466,160 (1,738,292) - - 803,481,418 708,649,483 Loans 35,832,427 - - - - - 35,832,427 35,832,427 Revenue funded 16,780,755 - - (415,012) - - 16,365,743 16,780,755 Leases - - - - - - - - Development Levies 88,195,037 463,000 - - - - 88,658,037 88,195,037 Tenant Purchase Annuities 94,082 - - - - - 94,082 94,082 Unfunded 21,594,262 - - - - - 21,594,262 21,594,262 Historical 2,489,091,616 - - (459,688) - - 2,488,631,928 2,489,091,616 Other 146,839,842 1,533,032 4,233,873 (1,239,874) - - 151,366,873 146,839,842
Total Gross Funding 3,507,077,504 49,100,099 53,700,034 (3,852,866) - - 3,606,024,770 3,507,077,504
Less: Amortised (269,615,306) (261,648,121)
Total * 3,336,409,463 3,245,429,383
* Must agree with note 1
NOTES TO AND FORMING PART OF THE ACCOUNTS
Page 20

10. Other Balances
A breakdown of other balances is as follows:Balance @ Capital Expenditure Income Net Transfers Balance @ Balance @
1/1/2019 re-classification * 31/12/2019 31/12/2018€ € € € € € €
(i) 70,689,888 - 522,495 25,074,794 (9,640,899) 85,601,288 70,689,888
(ii) (37,823,183) 10,142,668 74,880,984 72,677,018 8,144,228 (21,740,253) (37,823,183)
Voluntary & Affordable Housing Balances (iii) - Voluntary Housing (1,047,327) - 17,241,055 16,956,879 405,602 (925,901) (1,047,327) - Affordable Housing (1,907,118) - 45,019 - 1,907,118 (45,019) (1,907,118)
Reserves created for specific purposes (iv) 162,447,667 (812,000) 2,656,025 5,249,273 15,853,116 180,082,032 162,447,667
A. Net Capital Balances 192,359,928 9,330,668 95,345,577 119,957,963 16,669,164 242,972,147 192,359,928
(v) (44,950,481) (46,069,527)
Interest in Associated Companies (vi) - -
B. Non Capital Balances (44,950,481) (46,069,527)
Total Other Balances 198,021,666 146,290,402 *() Denotes Debit Balances
(i)(ii)
(iii)(iv)
(v)
(vi)
Relates to reserves and advance funding for future Local Authority assets, insurance liabilities, other purposes and includes realised tenant purchase annuities.
Loan related balances including outstanding principal on leases and non-mortgage loans remaining to be funded, historical mortgage funding gap, unrealised principal on tenant purchase annuities to be repaid in the future and shared ownership rented equity.
Represents the local authority's interest in associated companies.
NOTES TO AND FORMING PART OF THE ACCOUNTS
Balance Sheet accounts relating the loan principal outstanding (including Unrealised TP Annuities)
Development Levies balances
Capital account balances including asset formation and enhancement
This represents the cumulative balance of development levies i.e. income less expenditure and transfers to date.This represents the cumulative position on funded and unfunded capital jobs consisting of project (completed assets) and non-project (enhancment of assets) balances. Debit balances will require sources of funding to clear.
This represents the cumulative position on voluntary and affordable housing projects.
Page 21

11. Capital Account Analysis
The capital account has been de-aggregated and is comprised of the following accounts in the balance sheet:
2019 2018€ €
Net WIP & Preliminary Expenses (Note 2) 10,529,722 15,826,933 Net Capital Balances (Note 10) 242,972,147 192,359,928 Capital Balance Surplus/(Deficit) @ 31 December 253,501,869 208,186,861
A summary of the changes in the Capital account (see Appendix 6) is as follows:
2019 2018€ €
Opening Balance @ 1 January 208,186,861 170,432,741
Expenditure 108,911,766 122,773,186
Income - Grants 85,321,770 100,921,577 - Loans * - - - Other 40,117,208 31,625,624 Total Income 125,438,977 132,547,201
Net Revenue Transfers 28,787,797 27,980,105
Closing Balance @ 31 December 253,501,869 208,186,861
12. Mortgage Loan Funding Surplus/(Deficit)
The mortgage loan funding position on the balance sheet is as follows:2019 2019 2019 2018
Loan Annuity Rented Equity Total Total€ € € €
Mortgage Loans/Equity Receivable (LT Mortgage Shared Own Note 3) 48,473,628 5,679,722 54,153,350 48,364,496 Mortgage Loans/Equity Payable (Mort Loans Shared Own Note 7) (48,211,544) (5,566,278) (53,777,822) (47,198,258)
Surplus/(Deficit) in Funding @ 31st December 262,084 113,444 375,529 1,166,238
€NOTE: Cash on Hand relating to Redemptions and Relending -
13. Summary of Plant & Materials Account
A summary of the operations of the Plant & Machinery account is as follows:
2019 2019 2019 2018Plant & Machinery Materials Total Total
€€ € €
Expenditure (2,347,940) - (2,347,940) (2,322,455) Charged to Jobs 4,364,999 - 4,364,999 3,631,923
2,017,059 - 2,017,059 1,309,468
Transfers from/(to) Reserves (2,009,400) - (2,009,400) (1,284,000)
Surplus/(Deficit) for the Year 7,659 - 7,659 25,468
NOTES TO AND FORMING PART OF THE ACCOUNTS
Page 22

14. Transfers from/(to) Reserves
A summary of transfers to/from Reserves is as follows:2019 2019 2019 2018
Transfers from Reserves
Transfers to Reserves
€ € € €
Principal Repayments of Non-Mortgage Loans (Own Asset) - (1,260,137) (1,260,137) (2,287,666) Principal Repayments of Non-Mortgage Loans (Recoupable Non Asset) - (5,044,168) (5,044,168) (5,072,971) Principal Repayments of Finance Leases - - - - Transfers to Other Balance Sheet Reserves - - - - Transfers to/from Capital Account 2,415,288 (30,898,976) (28,483,687) (27,980,105) Surplus/(Deficit) for Year 2,415,288 (37,203,280) (34,787,992) (35,340,742)
15. Analysis of Revenue Income
A summary of the major sources of revenue income is as follows:
Appendix No€ % € %
Grants & Subsidies 3 63,859,555 26% 58,949,950 25%Contributions from other local authorities 1,594,673 1% 2,044,225 1%Goods & Services 4 54,215,207 22% 47,679,402 20%
119,669,435 49% 108,673,577 46%Local Property Tax 5,436,834 2% 5,431,730 2%Rates 122,312,727 49% 121,485,055 52%Total Income 247,418,995 100% 235,590,363 100%
From 2017 onwards, local authorities will no longer retain PRD locally. Accordingly, an upward adjustment was made to the LPT baseline of each local authority, to include an additional amount equivalent to the PRD income retained by local authorities in 2014.
2019 2018
NOTES TO AND FORMING PART OF THE ACCOUNTS
Page 23

16. Over/Under Expenditure
The following table shows the difference between the adopted estimates and the actual outturnin respect of both expenditure and income:
NET
Excluding Transfers
TransfersIncluding Transfers
Budget(Over)/Under
BudgetExcluding Transfers
TransfersIncluding Transfers
BudgetOver/(Under)
Budget(Over)/Under
Budget
2019 2019 2019 2019 2019 2019 2019 2019 2019 2019 2019€ € € € € € € € € € €
Housing & Building 70,611,922 9,693,140 80,305,062 75,375,300 (4,929,762) 70,208,317 1,169,238 71,377,555 66,707,500 4,670,055 (259,707)Roads Transportation & Safety 29,368,357 3,796,292 33,164,649 30,930,300 (2,234,349) 6,641,034 25,000 6,666,034 4,976,100 1,689,934 (544,415)Water Services 12,034,866 944,174 12,979,040 13,557,300 578,260 8,990,907 - 8,990,907 9,214,900 (223,993) 354,266 Development Management 15,489,675 5,283,240 20,772,915 20,047,300 (725,615) 6,940,682 - 6,940,682 6,734,200 206,482 (519,132)Environmental Services 35,239,529 2,493,690 37,733,220 37,219,500 (513,720) 4,379,857 658,046 5,037,903 4,589,200 448,703 (65,017)Recreation & Amenity 37,904,687 4,990,338 42,895,025 42,645,600 (249,425) 4,497,349 78,876 4,576,225 4,929,400 (353,175) (602,600)Agriculture, Education, Health & Welfare 1,372,009 217,031 1,589,041 1,705,300 116,259 643,303 - 643,303 718,100 (74,797) 41,463 Miscellaneous Services 10,605,885 9,785,374 20,391,258 21,385,000 993,742 17,367,986 484,128 17,852,114 16,645,000 1,207,114 2,200,855 Total Divisions 212,626,930 37,203,280 249,830,210 242,865,600 (6,964,610) 119,669,435 2,415,288 122,084,723 114,514,400 7,570,323 605,713 Local Property Tax - - - - - 5,436,834 - 5,436,834 5,436,800 34 34 Rates - - - - - 122,312,727 - 122,312,727 122,914,400 (601,673) (601,673)Dr/Cr Balance - (Deficit)/Surplus for Year 212,626,930 37,203,280 249,830,210 242,865,600 (6,964,610) 247,418,995 2,415,288 249,834,284 242,865,600 6,968,684 4,073
NOTES TO AND FORMING PART OF THE ACCOUNTS
EXPENDITURE INCOME
Page 24

NOTES TO AND FORMING PART OF THE ACCOUNTS
2019€
17. Net Cash Inflow/(Outflow) from Operating ActivitiesOperating Surplus/(Deficit) for Year 4,073 (Increase)/Decrease in Stocks - (Increase)/Decrease in Trade Debtors (1,500,930) Increase/(Decrease) in Creditors Less than One Year (1,847,646)
(3,344,502)
18. Increase/(Decrease) in Reserve BalancesIncrease/(Decrease) in Development Levies balances 14,911,399 Increase/(Decrease) in Reserves created for specific purposes 17,634,364
32,545,764
19. (Increase)/Decrease in Other Capital Balances(Increase)/Decrease in Capital account balances including asset formation and enhancement 16,082,930 (Increase)/Decrease in Voluntary Housing Balances 121,426 (Increase)/Decrease in Affordable Housing Balances 1,862,099
18,066,455
20. Increase/(Decrease) in Loan Financing(Increase)/Decrease in Long Term Debtors (11,113,015) Increase/(Decrease) in Mortgage Loans 6,803,702 Increase/(Decrease) in Asset/Grant Loans (1,260,245) Increase/(Decrease) in Revenue Funding Loans - Increase/(Decrease) in Bridging Finance Loans - Increase/(Decrease) in Recoupable Loans (5,044,064) Increase/(Decrease) in Shared Ownership Rented Equity Loans (224,138) Increase/(Decrease) in Finance Leasing - (Increase)/Decrease in Portion Transferred to Current Liabilities (315,641) Increase/(Decrease) in Other Creditors - Deferred Income 10,467,468
(685,933)
Page 25

NOTES TO AND FORMING PART OF THE ACCOUNTS
2019€
21. (Increase)/Decrease in Reserve Financing(Increase)/Decrease in Specific Revenue Reserve (304,110) (Increase)/Decrease in Balance Sheet accounts relating the loan principal outstanding (including Unrealised TP Annuities)
1,119,046
(Increase)/Decrease in Reserves in Associated Companies - 814,936
22. Analysis of Changes in Cash & Cash EquivalentsIncrease/(Decrease) in Bank Investments 50,290,889 Increase/(Decrease) in Cash at Bank/Overdraft (752,831) Increase/(Decrease) in Cash in Transit (805)
49,537,253
23. Post Balance Sheet Event (Non Adjusting Event) Covid 19At the financial year end on 31/12/2019 initial reports were emerging from China about Covid-19. In the interim theWHO has declared it a pandemic which has resulted in unprecedented restrictions on travel and movement. Thishealth crisis has, in a short space of time, resulted in effectively locking down economic activity within the countyand country for the vast majority of businesses, and brings with it financial uncertainty and consequences that willbe of proportions impossible to estimate effectively at this time. The global economic shock created by the COVID19 pandemic has been faster and more severe that the 2008 financial crash. It is clear, however, even at this pointof the crisis that the financial impact will be significant but an estimate of such costs both in terms of dealing withthe crisis and the direct impact on other Income and Expenditure for the local authority cannot be estimated at thistime as the crisis is on-going.
Page 26

APPENDICES

2019 2018€ €
Payroll ExpensesSalary & Wages 59,058,358 58,009,470 Pensions (incl Gratuities) 14,011,530 14,150,572 Other costs - -
Total 73,069,888 72,160,042
Operational ExpensesPurchase of Equipment 501,335 873,064 Repairs & Maintenance 665,761 1,029,580 Contract Payments 25,914,129 19,960,327 Agency services 26,889,569 25,993,324 Machinery Yard Charges incl Plant Hire 1,741,968 1,739,806 Purchase of Materials & Issues from Stores 2,297,290 2,041,097 Payment of Grants 6,164,876 4,888,332 Members Costs 410,200 418,002 Travelling & Subsistence Allowances 571,199 612,293 Consultancy & Professional Fees Payments 1,614,544 1,084,590 Energy / Utilities Costs 4,534,349 4,196,120 Other 39,649,209 35,394,583
Total 110,954,429 98,231,118
Administration ExpensesCommunication Expenses 529,564 664,924 Training 516,521 551,970 Printing & Stationery 617,292 548,628 Contributions to other Bodies 4,979,663 5,743,318 Other 4,143,388 3,096,768
Total 10,786,428 10,605,607
Establishment ExpensesRent & Rates 3,607,138 3,479,727 Other 1,854,224 1,523,045
Total 5,461,363 5,002,773
Financial Expenses 7,129,440 7,167,982
Miscellaneous Expenses 5,225,382 7,042,793
Total Expenditure 212,626,930 200,210,314
APPENDIX 1ANALYSIS OF EXPENDITURE
FOR YEAR ENDED 31st DECEMBER 2019
Page 28

EXPENDITURE INCOME
DIVISION TOTAL State Grants & Subsidies Provision of Goods and
Services Contributions from other
local authorities TOTAL
€ € € € €
A01 Maintenance/Improvement of LA Housing 19,963,277 1,335,218 24,957,480 - 26,292,698
A02 Housing Assessment, Allocation and Transfer - - - - -
A03 Housing Rent and Tenant Purchase Administration 1,813,747 - 56,616 - 56,616
A04 Housing Community Development Support 6,001,755 - 138,170 - 138,170
A05 Administration of Homeless Service 3,688,111 - 62,925 345,347 408,272
A06 Support to Housing Capital & Affordable Prog. 9,274,776 6,601,483 61,742 - 6,663,225
A07 RAS Programme 33,381,173 30,559,325 2,821,848 - 33,381,173
A08 Housing Loans 2,345,277 81,394 1,436,114 - 1,517,508
A09 Housing Grants 3,025,090 2,103,916 19,301 - 2,123,217
A11 Agency & Recoupable Services 520,699 397,344 108,177 - 505,521
A12 HAP Programme 291,156 50,250 240,906 - 291,156
SERVICE DIVISION TOTAL INCLUDING TRANSFERS TO/FROM RESERVES
80,305,062 41,128,931 29,903,278 345,347 71,377,555
Less Transfers to/from Reserves 9,693,140 1,169,238 1,169,238
SERVICE DIVISION TOTAL EXCLUDING TRANSFERS TO/FROM RESERVES
70,611,922 28,734,039 70,208,317
APPENDIX 2SERVICE DIVISION A
HOUSING and BUILDING
Page 29

APPENDIX 2
EXPENDITURE INCOME
DIVISION TOTAL State Grants & Subsidies Provision of Goods and
Services Contributions from other
local authorities TOTAL
€ € € € €
B01 NP Road - Maintenance and Improvement - - - - -
B02 NS Road - Maintenance and Improvement 1,194,606 1,101,084 4,074 - 1,105,158
B03 Regional Road - Maintenance and Improvement 2,703,829 - 49,633 - 49,633
B04 Local Road - Maintenance and Improvement 15,007,279 2,886,859 167,791 - 3,054,650
B05 Public Lighting 6,037,318 949,232 36,596 - 985,828
B06 Traffic Management Improvement 2,703,903 - 115,511 - 115,511
B07 Road Safety Engineering Improvement 1,967,332 4,015 79,096 - 83,110
B08 Road Safety Promotion/Education 2,120,290 - 63,716 - 63,716
B09 Maintenance & Management of Car Parking 446,440 - 692,464 - 692,464
B10 Support to Roads Capital Prog. 910,552 - 21,741 - 21,741
B11 Agency & Recoupable Services 73,100 - 494,222 - 494,222
SERVICE DIVISION TOTAL INCLUDING TRANSFERS TO/FROM RESERVES
33,164,649 4,941,190 1,724,844 - 6,666,034
Less Transfers to/from Reserves 3,796,292 25,000 25,000
SERVICE DIVISION TOTAL EXCLUDING TRANSFERS TO/FROM RESERVES
29,368,357 1,699,844 6,641,034
ROAD TRANSPORTATION and SAFETY
SERVICE DIVISION B
Page 30

APPENDIX 2
EXPENDITURE INCOME
DIVISION TOTAL State Grants & Subsidies Provision of Goods and
Services Contributions from other
local authorities TOTAL
€ € € € €
C01 Operation and Maintenance of Water Supply 4,373,592 - 160,820 - 160,820
C02 Operation and Maintenance of Waste Water Treatment 3,351,810 - 134,594 - 134,594
C03 Collection of Water and Waste Water Charges 130,916 - 4,678 - 4,678
C04 Operation and Maintenance of Public Conveniences - - - - -
C05 Admin of Group and Private Installations - - - - -
C06 Support to Water Capital Programme 396,689 - 479,895 - 479,895
C07 Agency & Recoupable Services (45,859) - 7,672,068 - 7,672,068
C08 Local Authority Water and Sanitary Services 4,771,892 484,338 54,515 - 538,853
SERVICE DIVISION TOTAL INCLUDING TRANSFERS TO/FROM RESERVES
12,979,040 484,338 8,506,569 - 8,990,907
Less Transfers to/from Reserves 944,174 - -
SERVICE DIVISION TOTAL EXCLUDING TRANSFERS TO/FROM RESERVES
12,034,866 8,506,569 8,990,907
WATER SERVICES
SERVICE DIVISION C
Page 31

APPENDIX 2
EXPENDITURE INCOME
DIVISION TOTAL State Grants & Subsidies Provision of Goods and
Services Contributions from other
local authorities TOTAL
€ € € € €
D01 Forward Planning 2,865,765 3,500 75,455 - 78,955
D02 Development Management 3,233,534 - 1,107,170 - 1,107,170
D03 Enforcement 775,950 - 35,115 - 35,115
D04 Op & Mtce of Industrial Sites & Commercial Facilities 1,188,456 - 200,355 - 200,355
D05 Tourism Development and Promotion 1,551,199 (0) 65,245 - 65,244
D06 Community and Enterprise Function 3,923,389 2,552,754 18,959 - 2,571,714
D07 Unfinished Housing Estates - - - - -
D08 Building Control 668,145 - 163,471 - 163,471
D09 Economic Development and Promotion 3,908,024 1,407,317 248,779 - 1,656,096
D10 Property Management 2,585,913 - 994,279 6,050 1,000,330
D11 Heritage and Conservation Services 72,542 59,790 2,443 - 62,233
D12 Agency & Recoupable Services - - - - -
SERVICE DIVISION TOTAL INCLUDING TRANSFERS TO/FROM RESERVES
20,772,915 4,023,361 2,911,271 6,050 6,940,682
Less Transfers to/from Reserves 5,283,240 - -
SERVICE DIVISION TOTAL EXCLUDING TRANSFERS TO/FROM RESERVES
15,489,675 2,911,271 6,940,682
SERVICE DIVISION D
DEVELOPMENT MANAGEMENT
Page 32

APPENDIX 2
EXPENDITURE INCOME
DIVISION TOTAL State Grants & Subsidies Provision of Goods and
Services Contributions from other
local authorities TOTAL
€ € € € €
E01 Operation, Maintenance and Aftercare of Landfill 1,513,963 - 588,758 (249) 588,509
E02 Op & Mtce of Recovery & Recycling Facilities 551,151 (72,676) 237,912 - 165,236
E03 Op & Mtce of Waste to Energy Facilities 1,034,395 - - 1,044,869 1,044,869
E04 Provision of Waste to Collection Services 734,472 64,554 254,281 136,182 455,017
E05 Litter Management 1,638,603 58,525 236,014 3,500 298,039
E06 Street Cleaning 7,921,364 - 206,129 - 206,129
E07 Waste Regulations, Monitoring and Enforcement 1,018,359 247,000 189,517 - 436,517
E08 Waste Management Planning - - - - -
E09 Maintenance and Upkeep of Burial Grounds 1,488,359 - 701,910 - 701,910
E10 Safety of Structures and Places 653,864 - 93,164 - 93,164
E11 Operation of Fire Service 20,248,378 - - - -
E12 Fire Prevention 1,319 - 969,529 - 969,529
E13 Water Quality, Air and Noise Pollution 345,727 - 360 - 360
E14 Agency & Recoupable Services - - - - -
E15 Climate Change and Flooding 583,267 12,750 65,873 - 78,623
SERVICE DIVISION TOTAL INCLUDING TRANSFERS TO/FROM RESERVES
37,733,220 310,153 3,543,448 1,184,302 5,037,903
Less Transfers to/from Reserves 2,493,690 658,046 658,046
SERVICE DIVISION TOTAL EXCLUDING TRANSFERS TO/FROM RESERVES
35,239,529 2,885,402 4,379,857
SERVICE DIVISION E
ENVIRONMENTAL SERVICES
Page 33

APPENDIX 2
EXPENDITURE INCOME
DIVISION TOTAL State Grants & Subsidies Provision of Goods and
Services Contributions from other
local authorities TOTAL
€ € € € €
F01 Operation and Maintenance of Leisure Facilities 534,600 - 121,230 - 121,230
F02 Operation of Library and Archival Service 10,971,885 169,015 366,187 - 535,202
F03 Op, Mtce & Imp of Outdoor Leisure Areas 20,136,773 - 613,637 - 613,637
F04 Community Sport and Recreational Development 8,959,021 2,251,365 379,343 967 2,631,676
F05 Operation of Arts Programme 2,292,746 247,774 423,706 3,000 674,480
F06 Agency & Recoupable Services - - - - -
SERVICE DIVISION TOTAL INCLUDING TRANSFERS TO/FROM RESERVES
42,895,025 2,668,154 1,904,104 3,967 4,576,225
Less Transfers to/from Reserves 4,990,338 78,876 78,876
SERVICE DIVISION TOTAL EXCLUDING TRANSFERS TO/FROM RESERVES
37,904,687 1,825,228 4,497,349
RECREATION and AMENITY
SERVICE DIVISION F
Page 34

APPENDIX 2
EXPENDITURE INCOME
DIVISION TOTAL State Grants & Subsidies Provision of Goods and
Services Contributions from other
local authorities TOTAL
€ € € € €
G01 Land Drainage Costs - - - - -
G02 Operation and Maintenance of Piers and Harbours - - - - -
G03 Coastal Protection - - - - -
G04 Veterinary Service 1,420,154 365,582 241,076 - 606,658
G05 Educational Support Services 168,887 36,645 - - 36,645
G06 Agency & Recoupable Services - - - - -
SERVICE DIVISION TOTAL INCLUDING TRANSFERS TO/FROM RESERVES
1,589,041 402,228 241,076 - 643,303
Less Transfers to/from Reserves 217,031 - -
SERVICE DIVISION TOTAL EXCLUDING TRANSFERS TO/FROM RESERVES
1,372,009 241,076 643,303
AGRICULTURE, EDUCATION, HEALTH and WELFARE
SERVICE DIVISION G
Page 35

APPENDIX 2
EXPENDITURE INCOME
DIVISION TOTAL State Grants & Subsidies Provision of Goods and
Services Contributions from other
local authorities TOTAL
€ € € € €
H01 Profit/Loss Machinery Account 37,030 - 44,689 - 44,689
H02 Profit/Loss Stores Account - - - - -
H03 Adminstration of Rates 17,998,738 6,852,500 5,281,429 - 12,133,929
H04 Franchise Costs 949,199 - 497,700 - 497,700
H05 Operation of Morgue and Coroner Expenses 6,071 - - - -
H06 Weighbridges - - - - -
H07 Operation of Markets and Casual Trading - - 36,770 - 36,770
H08 Malicious Damage - - - - -
H09 Local Representation/Civic Leadership 1,337,948 - 1,839 - 1,839
H10 Motor Taxation - - - - -
H11 Agency & Recoupable Services 62,273 3,048,700 2,033,480 55,006 5,137,186
SERVICE DIVISION TOTAL INCLUDING TRANSFERS TO/FROM RESERVES
20,391,258 9,901,200 7,895,907 55,006 17,852,114
Less Transfers to/from Reserves 9,785,374 484,128 484,128
SERVICE DIVISION TOTAL EXCLUDING TRANSFERS TO/FROM RESERVES
10,605,885 7,411,779 17,367,986
TOTAL ALL DIVISIONS 212,626,930 63,859,555 54,215,207 1,594,673 119,669,435
MISCELLANEOUS SERVICES
SERVICE DIVISION H
Page 36

2019 2018€ €
Department of Housing, Planning and Local GovernmentHousing Grants & Subsidies 41,163,661 37,682,914 Local Improvement Schemes - - Road Grants 2,886,859 3,237,016 Water Services Group Schemes - - Environmental Protection/Conservation Grants (42,676) 301,281 Library Services - 36,000 Urban and Village Renewal Schemes - - Miscellaneous 10,385,538 9,930,126
54,393,382 51,187,337
Other Departments and BodiesRoad Grants 2,054,331 781,636 Local Enterprise Office 1,361,933 1,001,061 Community Employment Schemes 1,540,411 1,597,693 Civil Defence - - Higher Education Grants - - Miscellaneous 4,509,498 4,382,222
9,466,173 7,762,613
Total 63,859,555 58,949,950
APPENDIX 3ANALYSIS OF INCOME FROM GRANTS AND SUBSIDIES
Page 37

2019 2018
€ €
Rents from Houses 26,413,486 24,968,172
Housing Loans Interest & Charges 1,367,316 1,131,465
Domestic Water - -
Commercial Water - -
Irish Water 8,135,771 7,556,537
Domestic Refuse - -
Commercial Refuse - -
Domestic Sewerage - -
Commercial Sewerage - -
Planning Fees 1,147,719 1,211,603
Parking Fines/Charges 712,877 720,688
Recreation & Amenity Activities 376,316 286,944
Library Fees/Fines 67,513 125,127
Agency Services 89,400 89,400
Pension Contributions 1,937,243 2,093,046
Property Rental & Leasing of Land 1,659,860 1,748,198
Landfill Charges - -
Fire Charges 969,529 684,240
NPPR 1,327,684 1,852,000
Misc. (Detail) 9,854,708 5,171,650
54,059,421 47,639,070
APPENDIX 4ANALYSIS OF INCOME FROM GOODS AND SERVICES
Page 38

2019 2018
€ €
EXPENDITURE
Payment to Contractors 22,098,044 92,592,049 Puchase of Land 430,554 - Purchase of Other Assets/Equipment 57,852,979 7,980,648 Professional & Consultancy Fees 6,220,772 3,366,955 Other 22,309,416 18,833,534
Total Expenditure (Net of Internal Transfers) 108,911,766 122,773,186 Transfers to Revenue 2,415,288 730,477
Total Expenditure (Incl Transfers) * 111,327,054 123,503,664
INCOMEGrants and LPT 85,321,770 100,921,577 Non - Mortgage Loans - -
Other Income (a) Development Contributions 25,074,794 20,442,972 (b) Property Disposals- Land 8,596,970 2,932,914 - LA Housing 369,000 82,000 - Other property 33,000 3,548 (c) Purchase Tenant Annuities 237,300 252,249
(d) Car Parking - -
(e) Other 5,806,144 7,911,942
Total Income (Net of Internal Transfers) 125,438,977 132,547,201 Transfers from Revenue 31,203,085 28,710,583
Total Income (Incl Transfers) * 156,642,062 161,257,784
Surplus\(Deficit) for year 45,315,008 37,754,120
Balance (Debit)\Credit @ 1 January 208,186,861 170,432,741
Balance (Debit)\Credit @ 31 December 253,501,869 208,186,861
* Excludes internal transfers, includes transfers to and from Revenue account
APPENDIX 5SUMMARY OF CAPITAL EXPENDITURE AND INCOME
Page 39

BALANCE @ EXPENDITURE BALANCE @
1/1/2019 Grants and LPT Non-Mortgage Loans* Other Total Income Transfer from Revenue Transfer to Revenue Internal Transfers 31/12/2019
€ € € € € € € € € €
Housing & Building 18,950,621 76,725,504 73,455,167 - 2,959,720 76,414,886 4,524,471 1,169,238 (923,728) 21,071,508
Road Transportation & Safety 5,625,128 10,885,178 7,610,147 - 1,487,115 9,097,262 3,371,000 25,000 2,151,548 9,334,759
Water Services 11,670,327 1,305,153 655,966 - 13,916 669,882 635,000 - 42,899 11,712,954
Development Management 108,392,665 6,431,309 773,296 - 34,164,764 34,938,060 4,141,436 19,278 (9,340,646) 131,680,928
Environmental Services 25,573,855 331,143 77,047 - 35,573 112,620 550,000 638,768 (67,636) 25,198,929
Recreation & Amenity 14,022,864 12,002,318 2,750,147 - 444,864 3,195,011 5,588,600 78,876 7,363,835 18,089,115
Agriculture, Education, Health & Welfare - - - - - - - - - -
Miscellaneous Services 23,951,401 1,231,160 - - 1,011,257 1,011,257 12,392,578 484,128 773,728 36,413,676
TOTAL 208,186,861 108,911,766 85,321,770 - 40,117,208 125,438,977 31,203,085 2,415,288 - 253,501,869
Note: Mortgage-related transactions are excluded
APPENDIX 6ANALYSIS OF EXPENDITURE AND INCOME ON CAPITAL ACCOUNT
INCOME TRANSFERS
Page 40

Summary of Major Revenue Collections for 2019
ADebtor type
B Incoming arrears @ 1/1/2019
CAccrued -
current year debit (Gross)
DVacant
property adjustments
EWrite offs
FWaivers
GTotal for
collection=(B+C-D-E-F)
HAmount
collected
I Closing
arrears @ 31/12/2019
= (G-H)
JSpecific doubtful arrears*
K% Collected= (H)/(G-J)
€ € € € € € € € €Rates 22,962,719 122,312,727 4,339,101 3,354,310 - 137,582,034 117,950,053 19,631,981 3,788,587 88%
Rents & Annuities 8,117,785 26,430,791 - 350,929 - 34,197,647 25,965,124 8,232,523 - 76%
Housing Loans 1,279,597 4,326,374 - - - 5,605,971 4,433,240 1,172,731 - 79%
*Specific doubtful arrears = (i) Vacancy applications pending/criteria not met & (ii) Accounts in examinership/receivership/liquidation and no communication regarding likely outcome
APPENDIX 7

Name of Company or Entity Voting Power % Classification: Subsidiary / Associate / Joint Venture
Total Assets Total Liabilities Revenue Income Revenue Expenditure
Cumulative Surplus/Deficit
Currently Consolidated Y / N
Date of Financial Statements
Civic Theatre Company Limited 67% Subsidiary 540,081 384,840 1,638,827 1,650,344 155,241 N 31st Dec 2019South Dublin Arts Centre Company Limited 43% Associate 130,858 70,263 882,723 878,876 60,595 N 31st Dec 2019South County Dublin Leisure Services Limited 100% Subsidiary 327,082 378,577 3,569,745 3,523,552 (51,495) N 31st Dec 2019Grange Castle Facilities Management Limited 100% Subsidiary 1,668,444 1,668,444 820,156 820,156 - N 31st Dec 2019
South Dublin District Heating CLG 100% Subsidiary
This company was incorporated on 23rd October 2019.
APPENDIX 8
INTEREST OF LOCAL AUTHORITY IN COMPANIES AND JOINT VENTURES
Where a local authority as a corporate body or its members or officers, by virtue of their office, have an interest in a company (controlled, jointly controlled and associated), the following disclosures should be made for each entity:
Page 42