Embed Size (px)
Citation preview

Our Ref: COMM-PANLI-20090821-01 FAX: 2803 5112 E-mail: [email protected] Office of the Telecommunications Authority 29th Floor, Wu Chung House 213 Queen’s Road East Wan Chai Hong Kong Attn: Senior Telecommunication Engineer (Spectrum Planning) Dear Sir, 2nd Submission of Comments on the Consultation Paper of “Creation of a Class License for Ultra Wideband Radiocommunications Devices under Section 7B(2) of the Telecommunications Ordinance(Cap.106)” References: 1. APT Satellite, “Comment on Consultation Paper Creation of a Class Licence for
Ultra-Wideband Radiocommunications Devices under Section 7B(2) of the Telecommunications Ordinance (Cap. 106)”, HTTP://WWW.OFTA.GOV.HK, 27 April 2009
2. OFTA, “Further Field Testing on Ultra-wideband (UWB) Devices”, L/M 24/2009 in S60/8, 25 May 2009
The first reference document is the first submission of our comment on the subject consultation paper (Ref). In this submission APT Satellite (APT Satellite Co., Ltd.) expressed concerns that 1) the benefit brought by the employment of Low Duty Cycle (LDC) technique on the impact of UWB devices on FSS needs to be studied; 2) the idea of establishing an exclusion zone surrounding the UWB devices needs to be further studied. The second reference document is an acknowledgement from OFTA to APT Satellite’s request for a further field test, OFTA expressed the willingness to participate the tests.

Bearing in mind these concerns, APT Satellite, teamed up with other Hong Kong satellite operators, has conducted two field tests to examine the magnitude of the impact of the UWB devices on the Fixed Satellite Service (FSS) receiving system and Very Small Aperture Terminals (VSAT) link. In the first field test, a 1.8 meter satellite receiving antenna was set to a series of elevation angles, not pointing to any satellite, the noise floor without the presence of UWB interference was recorded down. Then an UWB device with a maximum emission power level of -41.3 dBm/MHz, operating with a Low Duty Cycle (LDC) of 5%, was placed in front, at the back and on one side of the 1.8 meter satellite receiving antenna, with various distance from 2 meter to 20 meter. The noise floor of the receiving system was raised when the UWB device started transmitting. In the worst scenario, an interference of more than 20 dB I/N was recorded on the noise floor of the satellite receiving system. Attachment 1 is the report on this field test. In the second field test, the same 1.8 meter satellite antenna was used, pointing to APSTAR-VI satellite at GSO slot 134°East Longitude. A VSAT narrow-band outbound link was re-transimitted by the satellite, then received by the antenna and demodulated by a satellite modem. Two BER testers worked in parallel with the satellite modem, they recorded down the errored seconds (ES) and severely errored seconds (SES) which reflect how many bad frames in the satellite transmissions. When the UWB device started working around the antenna, ES and SES occurred. Same pattern of interference was rendered again by the UWB transmission. In the worst scenario, totally 44 SES occurred in 300 seconds period of sampling time. It means, within these seconds, the UWB interference was so serious that the bad frames it caused to the VSAT transmission were beyond the VSAT system’s self-correction capability, 44 seconds out of 300 is 14.67% loss of data package. Attachment 2 is the report on this field test. We have drawn conclusions that, 1) Even not considering the ITU-R S.1432 stating the overall noise caused by
secondary service on primary service(i.e. UWB transmission as related to FSS) should be less than 1% or -20 dB, even the 6% criteria for the homogeneous service is exceeded by tens of hundred of times.

2) LDC technique brings no significant mitigation benefit, still a great deal of SES occurred to the actually VSAT link when the UWB was operating with LDC. The 5% pulse-like working time is corresponding to at least 5% down-time for the FSS links. However, the availability requirement for a typical FSS VSAT link is 99.99%, which has already taking into account of the rain-fade, ASI, inter-modulation, ASI etc, an additional 5% loss out of UWB interference is totally unacceptable.
3) There was still serious interference when UWB devices was placed more than 10 meter away from the 1.8 meter antenna. For the side area where the feed horn of the antenna can be directly “seen” by the UWB device, the interference distance could go farther than 20 meter.
Based on the field test facts and up-listed technical findings, APT Satellite would like to render this 2nd submission of comments, For the Question 1 raised in the consultation paper: Do you agree that UWB radiocommunications devices should be allowed for use in Hong Kong at this stage? APT Satellite Comments: Beside the fact that there is serious harmful interference from UWB devices to FSS receiving systems, the UWB device (i.e. the USB Wireless Hub used in the tests) itself is extremely fragile and instable. The connection between the USB Wireless Hub and the computer was broken down for tens of times during the tests. Taking into account this type of electronic devices are not very popular in the market and are likely be an immature and intermediate product, APT satellite would like to propose OFTA pause its licensing plan. Question 2: Do you have any comments or views on the recommended generic emission mask and operational criteria? APT Satellite Comments: The tests have proved the emission mask of -41.3 dBm/MHz can cause serious interference to FSS receiving systems. Since LDC technique enables it work in this power level for 5% time during a working cycle, it could be predicted that it would cause at least 5% downtime to FSS links which is totally not acceptable to FSS operators.

Question 3: Regarding the application of the alternative limit, do you prefer option 1 or option 2? Option 1 - the alternative limit of -41.3 dBm/MHz is confined to 4.2-4.8 GHz band only with a view to providing a high level of confidence in respect of protection of fixed satellite services. Option 2 - the alternative limit of -41.3 dBm/MHz is extended to the whole 3.4-4.8 GHz band with a view to facilitating the UWB deployment in Hong Kong by allowing a wider choice of overseas UWB radiocommunications products. APT Satellite Comments: From world-wide point of view, 3.4-4.2GHz and 4.5-4.8 GHz are allocated for FSS use, as a satellite operator, APT satellite is opposed to the allocation of these bands for UWB use. From Hong Kong point view, 3.4-.4.2 GHz band is also allocated for FSS use while 4.5-4.8GHz was for other services, therefore, APT is inclined to accepting option 1 assuming that the primary status of FSS in 3.4-4.2 GHz band is fully protected. Sincerely yours,
Pan Li Senior Spectrum Engineer

ATTACHMENT 1
Test Report on Impact of UWB Devices
on FSS Receiving System
JOINTLY BY
APT Satellite Co., Ltd.
&
Asia Satellite Telecommunications Co. Ltd.

Table of Content
1. Test objectives 2. Methodology 3. Test setup 3.1 Equipments used in test 3.2 Connection
4. Calibration 4.1 Identify the side area of the 1.8 meter FSS receiving antenna where the
strongest UWB interference would be received 4.2 Calibration of the UWB Output Power 4.3 Calibration of the UWB Radiation Power 4.4 Carrier Pattern of the UWB devices 4.5 Noise floor of spectrum analyzer 4.6 Noise floor of 1.8 meter ant. receiving system
5. Illustrations 6. Analysis and discussion 7. Conclusions and Recommendations Annex 1: Spectrum plots

1. Test Objectives 1.1 To evaluate the interference from UWB devices to FSS receiving systems 1.2 To evaluate the power density mask (i.e. -41.3 dBm/MHz) for UWB devices 1.3 To evaluate the idea of establishing an exclusion zone to protect FSS receiving systems 2. Methodology The tests were conducted on 22nd and 23rd of July 2009 at an out-door test field in Hong Kong. The tested UWB device operates in 3.168 – 4.752 GHz band, it overlaps with the frequency band allocated for FSS downlink (i.e. receiving frequency for FSS earth stations), ranging from 3.4 GHz to 4.2 GHz in non-planned bands and from 4.5 GHz to 4.8 GHz in planned bands. Although the UWB device operates with relatively low power, its industrial standard of radiation power mask is -41.3 dBm/MHz. The UWB devices being used operate with Low Duty Cycle (LDC) which means that the -41.3 dBm/MHz signals are sent out in pulses and that the UWB is transmitting no more than 5% of the total time. The received FSS signal is still lower than this value when it arrives at the receiving earth stations. Therefore UWB devices can cause interference when operating around the FSS receiving earth stations. A typical FSS receiving system and a UWB device that is commercially available in the local computer stores, a wireless USB hub, was used for the test. The noise floor of the FSS receiving earth station was raised due to the presence of the UWB radiation. Analysis on combination of antenna elevation angle, azimuth location of the UWB devices relative to the boresight of the satellite receive earth station antenna, separation distance and UWB device height and their respective influence on noise floor were evaluated. 3. Test Setup UWB interference to FSS receiving system is dependant on the elevation angle of the FSS receiving antenna, three settings of elevation angles were tested. For each elevation angle setting, the UWB device was placed in different locations surrounding the antenna in order to simulate different incoming angles and power levels of the UWB interference. In addition, for some locations, the UWB device was placed both on ground level and on a rack of 1.45 meter high to simulate the UWB applications roaming status when they are integrated into mobile phones. 1) Antenna elevation angle: 10° - in front of the FSS receiving antenna - in back of the FSS receiving antenna - at the sidelobe of the FSS receiving antenna 2) Antenna elevation angle: 30° - in front of the FSS receiving antenna - at the side area of the FSS receiving antenna 3) Antenna elevation angle: 60° - in front of the FSS receiving antenna A summary of all test points is shown in Table 1.

Table 1: All test points with reference to spectrum plots distance from ant.(meter), front back side UWB
height 20 19 18 17 15 10 8 6 4 2 10 8 6 4 2 20 15 10 1.8 meter ant. pointing to: azimuth=100 degree, elevation=10 degree, plot No.
Gnd. 1 2 3 4 5 6 7 8 9 10 11 13 14
1.45m 12
1.8 meter ant. pointing to: azimuth=100 degree, elevation=30 degree, plot No. Gnd. 15 17 18 19 20 21 23 25
1.45m 16 22 24 26
1.8 meter ant. pointing to: azimuth=100 degree, elevation=60 degree, plot No. Gnd. 37 39 27 29 31 33 35 1.45m 38 41 42 43 40 28 30 32 34 36
3.1 Equipments Used in Test
Table 2 Equipments Manufacturer Model Specs 1.8 meter receiving only dish antenna
Hua Da Antenna Factory
C-band SMC RX-H&V dish antenna
Gain: 35.68 dBi at 4 GHz
Extended C-band PLL LNB (Low Noise Block)
CalAmp 140194 Gain: 63 dB Input: 3.4 – 4.2 GHz Output: 950 – 1750 MHz Noise: 20 K
Integrated Receiver Decorder(IRD)
Harmonic IRD-2900 Compliant with DVB-S and DVB-S2
Spectrum Analyzer Anritsu MS 2663C Frequency range: 9KHz-8.1 GHz
UWB device IOGEAR IOGEAR Wireless USB hub and Adapter, GUWH104KIT
Frequency range: 3.168-4.752 GHz Output power: -41.3 dBm/MHz Antenna Gain: 0 dBi Low Duty Cycle: 5% at full transfer rate
Signal generator HP 83630 A Horn Antenna Scientific
Atlanta 6301CA 12 – 3.9
Frequency: 3.95 – 4.8 GHz
Accessories: two way splitter, notebook computer to operate the UWB device, notebook computer to capture plots from the Spectrum Analyzer, distance and angle meters, cables, etc
3.2 Connections

Figure 1: Equipment Connections
The 1.8 meter FSS receiving antenna was setup in the center of a test field in Hong Kong. In order to exclusively evaluate the receiving system’s noise floor, the antenna is not pointing to any satellite in the sky. The IRD worked as power supply to the LNB only. LNB receives and re-routes the FSS signal from C-band (3.4 to 4.2 GHz) to L-band (950 to 1750 MHz) while amplifying the signal’s power by 63 dB. The signal is later routed to the spectrum analyzer for visual appreciation of its spectrum characteristics and C/N values, the notebook computer can store the spectrum plots for further analysis. The UWB interference signal source is generated by the wireless USB hub. It comprises a USB host dongle connected to a notebook computer via a USB port and a UWB USB hub each connectable to a USB disk drive. The UWB transmission occurred by activating an USB drive copying or pasting files from/to the computer via the dongle. When the application was reading the file in UWB USB disk, the UWB hub transmitted at its full power and caused most serious interference to the nearby FSS receiving system. Section 5 further illustrated the test process. 4. Calibrations 4.1 Identify the side area of the 1.8 meter FSS receiving antenna where the
strongest UWB interference would be received A horn antenna was set up and connected to a signal generator. The horn was located on a rack of 1.45 m high and at a distance of 10 m from the 1.8 m FSS receiving antenna. The horn was moved around with fixed distance from the 1.8 m antenna such as to find out the position where a maximum receiving power would be observed. A spectrum plot showing the received maximum power at the designated location is shown in Figure 2.2, this location has 97 degree bear angle with the antenna’s bore-sight. The test proved that the most sensitive area is within the 97±10 degree bear angle arc for this specific 1.8 meter antenna, where the antenna feeder can be directly “seen” by the interferer when it
work in pair LNB
UWB USB Hub
UWB USB dongle
splitter
IRD
Spectrum Analyzer
ele = 10°/30°/60°

is placed in this area. It should be noted that the arc varies from antenna to antenna in terms of feeder type, installation, and antenna size, etc.
Figure 2.1: Alignment
Figure 2.2: Calibrated spectrum plots.
signal generator is placed with bear angle of 97 degree to ant’s bore-sight,can
directly “see” the feeder, the maximum
signal generator is placed with bear angle of 110 degree to ant’s bore-sight,can not
directly “see” the feeder
4.2 Calibration of the UWB Output Power The UWB device(wireless USB) was directly connected to the spectrum analyzer as shown in Figure 3, two UWB devices were measured in sequence.
Signal generator
97° Spectrum analyzer
feeder

Figure 3: Calibration of the UWB output power
Figure 4: Spectrum plots of the UWB output
UWB device 1: Power density in Spec: -41.3 dBm/MHz Calibrated power density: -38.83dBm/MHz Device 1 is selected for the interference test.
UWB device 2 Power density in Spec: -41.3 dBm/MHz Calibrated power density: -41.09dBm/MHz
4.3 Calibration of the UWB Radiation Power Figure 5 shows the testing configuration of the co-polarization radiation power level of the wireless USB using a horn antenna for reception. The corresponding spectrum is displayed in Figure 6. The
UWB device Spectrum Analyzer
Cable connected to the spectrum analyzer
UWB device
cross-polarization emission power testing and the results are shown in Figure 7 and Figure 8 respectively.
Figure 5: Setup for the testing the co-polarization radiation power of the wireless USB using the horn antenna for reception.
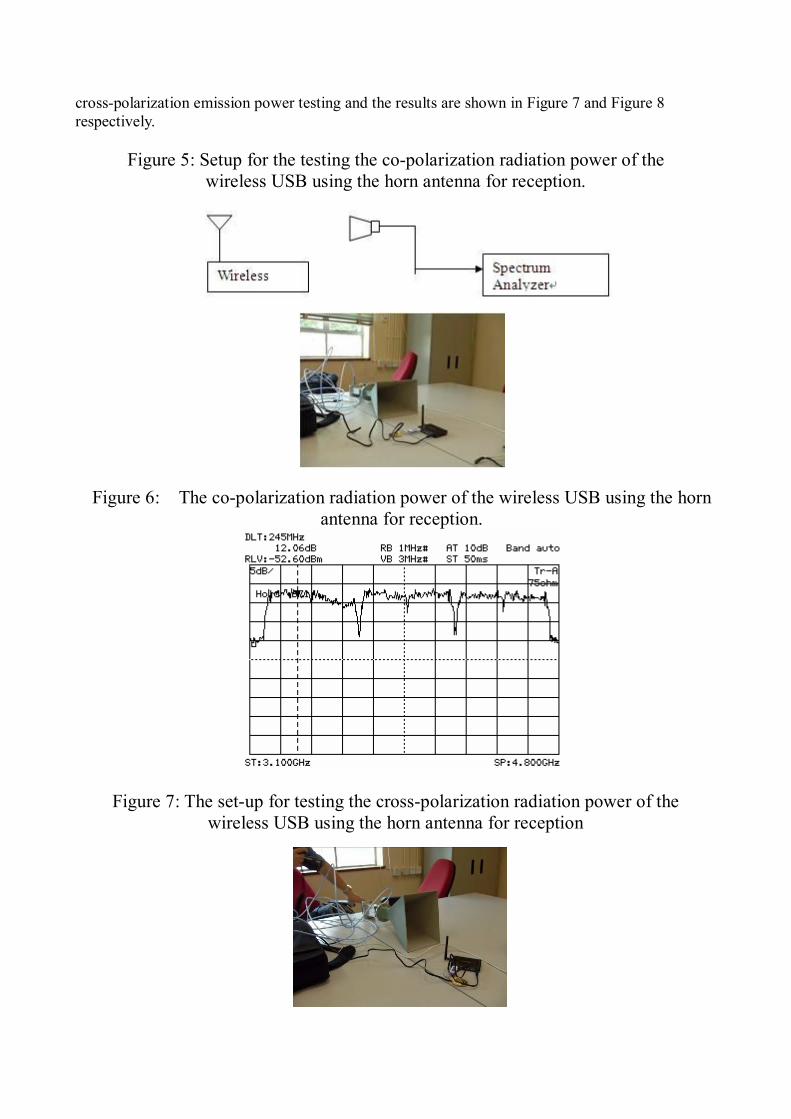
Figure 6: The co-polarization radiation power of the wireless USB using the horn antenna for reception.
Figure 7: The set-up for testing the cross-polarization radiation power of the wireless USB using the horn antenna for reception

Figure 8: The cross-polarization radiation power of the wireless USB using the
horn antenna for reception.
4.4 Carrier Pattern of the UWB devices Monitored by the spectrum analyzer, the UWB carriers have the following patterns. The max. hold plot of the whole 3.1-4.8 GHz spectrum has clearly shown three channels of the UWB carriers.
Figure 9: Carrier Pattern
Narrow span of 1 KHz
Wide span from 3.1 GHz to 4.8 GHz

Wide span Max-hold
note: The UWB device uses MB-OFDM technology transmitting in 3 channels in the data rate of 480 Mbps per channel in 3.168-4.752 GHz band.
4.5 Noise floor of spectrum analyzer
Note: Before starting the field test, the noise of the spectrum analyzer was measured
4.6 Noise floor of 1.8 meter ant. receiving system
Figure 10: Noise floor of the receiving system
Note: Compared to 4.5, the rec. system brings in >10 dB noise raise, the noise from spectrum analyzer is neglectable.

5. Illustrations - in front of the FSS receiving antenna The 1.8 meter FSS receiving antenna was installed at the center of the test field and connected to the spectrum analyzer through the IRD. The antenna’s pointing was set to certain elevation angle (10˚, 30˚ and 60˚) and fixed 100˚ azimuth angle, while the UWB device(wireless USB) was placed on the test field ground in front of the antenna and tested at 10 m, 8 m, 6 m, 4 m and 2 m distance in sequence, as shown in Figure 11.1. When the wireless USB began to transfer data to the laptop, the spectrum plots were captured and compared with the recorded receiving system’s noise floor which was calibrated in section 4.6. ANNEX 1 contains the spectrum plots, Table 3 contains a summary of the estimated average increase of the noise due to the presence of the wireless USB in the front of the 1.8 meter FSS receiving antenna. - in back of the FSS receiving antenna The 1.8 meter FSS receiving antenna was kept to certain elevation angle (only 10˚ mode was tested) and the wireless USB (on the ground) was tested in back of the antenna at 10 m, 8 m, 6 m, 4 m and 2 m distance. When the wireless USB started to operate, the spectrum plots were captured and compared with the recorded receiving system’s noise floor which was calibrated in section 4.6. ANNEX 1 contains the spectrum plots, Table 3 contains a summary of the estimated average increase of the noise due to the presence of the wireless USB.
Figure 11.1: Test points in front of & back of the ant.

Figure 11.2 Photos for a test point in front of the ant.
UWB device on ground
UWB device on a rack of 1.45 meter high
- in the side area of the FSS receiving antenna After the optimum azimuth angle was found (as calibrated in section 4.1), the wireless USB (on the ground) was placed at the same azimuth angle with a distance of 10 m, 15 m and 20 m respectively from the FSS receiving antenna (shown in Figure 12.1). ANNEX 1 contains the captured spectrum plots, Table 3 contains a summary of the estimated average increase of the noise due to the presence of the wireless USB.
Figure 12.1: Test points in the side area of the antenna

Figure 12.2 Photos for a test point in the side area of the ant.
UWB device is on ground, can directly “see” the antenna feeder,
refer to section 4.1
97°
10 m
Note: The signal generator is used to determine the most sensitive area. when it is placed with 97°bear angle to the ant’s bore-sight, the spectrum analyzer recorded maximum power
15m 20 m

On a rack of 1.45 meter high, can directly “see” the antenna feeder,
refer to section 4.1
Figure 13: Side view
6. Analysis and discussion The evaluation of the impact of UWB devices on FSS receiving systems shall follow Recommendation ITU-R S. 1432 in which it states that: “error performance degradation due to interference at frequencies below 30 GHz should be allotted portions of the aggregate interference budget of 32% or 27% of the clear-sky satellite system noise in the following way:
- 25% for other FSS systems for victim systems not practising frequency re-use; - 20% for other FSS systems for victim systems practising frequency re-use; - 6% for other systems having co-primary status; - 1% for all other sources of interference,
and that the sum of all of the interference sources should not cause violation of the error performance objectives (see Recommendations ITU-R S.522, ITU-R S.614, ITU-R S.1062 and ITU-R S.1420).” To our understanding, the interference caused by UWB devices into FSS receiving systems shall be considered as a portion but not all of “other sources of interference”. Even if it was to be granted
UWB on ground, 0 meter
UWB on 1.45 meter height
Elevation = 10/30/60°

that the interference from UWB devices is the sole interference source, the maximum allowed interference generated by UWB devices shall not exceed 1% of the clear-sky satellite system noise. This can be interpreted by the following:
(1)
where NSAT is the clear-sky satellite system noise and IUWB is the interference created by UWB devices. In ANNEX 1, there are two curves shown in each spectrum plot. One of them with a lower receiving power level is the clear-sky satellite system noise (i.e. NSAT) and the other one above the former is the noise floor in the presence of the UWB devices (i.e. IUWB+NSAT). The portions of the UWB interference power of the clear-sky satellite system noise can be derived as:
(2)
Then all the recorded data in this test are analysed using (2) and the corresponding results are presented in Table 3 below. 6.1 It can be seen from Table 3 that in all three testing scenarios (i.e. setting the 1.8 meter FSS
receiving antenna to an elevation angle of 10 degree, 30 degree and 60 degree), there is an obvious noise floor raise (i.e. (IUWB+NSAT)/NSAT = 5 – 10 dB) in FSS downlink C-band when the operating UWB device is placed at 10 meter away in front of the antenna. The noise floor goes significantly higher and higher as the UWB device is approaching the antenna from the distance of 10 meter to 2 meter. The highest noise floor raise observed is around 25 dB.
6.2 Compared to the interference into the main beam of the FSS receiving antenna, more severe interference from the UWB device could be picked up by the FSS receiving antenna on its side when the UWB device can directly “see” the antenna feedhorn. Even if the UWB device is moving further away from 10 to 20 meters, the noise floor raise is still remarkable (i.e. (IUWB+NSAT)/NSAT = 5 – 6 dB).
6.3 The interference created by UWB devices into the back lobe of the FSS receiving antenna is at a level of 3 – 5 dB, which also cannot be negligible.
6.4 The interference caused by UWB devices (i.e. IUWB/NSAT) ranges from 26% to 31523% which has exceeded 1% criteria of ITU Recommendations by hundreds and thousands of times. Therefore, operation of UWB devices with a maximum mean e.i.r.p. density of – 41.3 dBm/MHz would pose a significant interference threat to FSS receiving systems.
6.5 It is also observed from Table 3 that if UWB devices are placed at a distance of 10 meters at side of the FSS receiving antenna, the measured UWB interference is IUWB/NSAT = 9.5 dB which is 29.5 dB bigger than the ITU requirement (i.e. – 20 dB). In order to meet the ITU requirement, the emission power of the UWB devices in FSS downlink C-band should be reduced from – 41.3 dBm/MHz to – 70 dBm/MHz.

7. Conclusions and Recommendations 7.1 Since the significant raise of the noise floor (> 3dB, permissible value is 0.04 dB) were
observed when the UWB device is placed at 10 meter away from the FSS receiving antenna in every case (10, 30 and 60 degree elevation angle of FSS receiving antenna), the 10 meter exclusion zone must be enlarged to tens and hundreds of meters to provide adequate protection for FSS downlinks. However, due to the mobile/nomadic nature of the deployment of UWB devices, and the existing deployment of FSS earth stations, it is impractical to achieve such exclusion zone distances of tens and hundreds of meters in many cases. Instead, it would be more appropriate to propose a reduction of the e.i.r.p. density levels of UWB devices in order to achieve the I/N ratio of –20 dB into the FSS downlink C-band.
7.1 Satellite industry has been using the Rec. ITU-R S.1432 for the design of satellite network and to maintain sufficient margin and reasonable service quality for the operation of FSS network. The extra interference as created by UWB devices would impose more stringent operation condition with highly possible interruption of FSS reception. According to the measurement and analysis results, the UWB maximum e.i.r.p. density of – 41.3 dBm/MHz in 3 400 – 4 200 MHz and 4 500 – 4 800 MHz frequency range cannot fully protect FSS downlink from harmful interference and it must be reduced.
7.2 Moreover, interference may occur at random period of time and location. UWB devices in
motion would impose certain difficulties in identifying and eliminating interfering sources if interruption of satellite services is taken place. It is also anticipated that interference situation would become worsen if UWB devices were deployed on a large scale.

Table 3 Summary and analysis of the measurement data UWB Distance from Dish Antenna (m)
Front Back Side Height 20 19 18 17 15 10 8 6 4 2 10 8 6 4 2 20 15 10
Antenna Elevation Angle = 10 degree
(IUWB+NSAT)/NSAT (dB) 10 10 12 13 16 3 4 4 4 5 5 9 10
IUWB/NSAT (dB) 9.5 9.5 11.7 12.8 15.9 -0.02 1.8 1.8 1.8 3.3 3.3 8.4 9.5 Ground
IUWB/NSAT (%) 900 900 1485 1895 3981 99 151 151 151 216 216 694 900
(IUWB+NSAT)/NSAT (dB) 8
IUWB/NSAT (dB) 7.3 1.45 m
IUWB/NSAT (%) 531
Antenna Elevation Angle = 30 degree
(IUWB+NSAT)/NSAT (dB) 5 6 12 15 18 6 8 10
IUWB/NSAT (dB) 3.3 4.7 11.7 14.9 17.9 4.6 7.3 9.5 Ground
IUWB/NSAT (%) 216 298 1485 3062 6206 298 531 900
(IUWB+NSAT)/NSAT (dB) 5 10 12 14
IUWB/NSAT (dB) 3.3 9.5 11.7 13.8 1.45 m
IUWB/NSAT (%) 216 900 1485 2412
Antenna Elevation Angle = 60 degree
(IUWB+NSAT)/NSAT (dB) 0 2 5 9 10 12 19
IUWB/NSAT (dB) - -2.3 3.3 8.4 9.5 11.7 18.9 Ground
IUWB/NSAT (%) 0 59 216 694 900 1485 7843
(IUWB+NSAT)/NSAT (dB) 0 1 1 2 4 5 7 10 12 25
IUWB/NSAT (dB) - -5.8 -5.8 -2.3 1.8 3.3 6.0 9.5 11.7 25 1.45 m
IUWB/NSAT (%) 0 26 26 59 152 216 401 900 1485 31523

ANNEX 1
Spectrum plots In spectrum plot, one indication of input in the lower side is the noise floor of the 1.8 meter antenna receiving system without the presence of UWB interference, the other one in the higher side is the noise floor raised by the UWB interference signals.
Plot 1 in Table 1 Setting: Ant. ele. angle = 10 degree UWB interf. route = front Distance = 10 meter Height = 0 meter Reading: estimated max. (I+N)/N = 10 dB
Plot 2 in Table 1 Setting: Ant. ele. angle = 10 degree UWB interf. route = front Distance = 8 meter Height = 0 meter Reading: estimated max. (I+N)/N = 10 dB
Plot 3 in Table 1 Setting: Ant. ele. angle = 10 degree UWB interf. route = front Distance = 6 meter Height = 0 meter Reading: estimated max. (I+N)/N = 12 dB

Plot 4 in Table 1 Setting: Ant. ele. angle = 10 degree UWB interf. route = front Distance = 4 meter Height = 0 meter Reading: estimated max. (I+N)/N = 13 dB
Plot 5 in Table 1 Setting: Ant. ele. angle = 10 degree UWB interf. route = front Distance = 2 meter Height = 0 meter Reading: estimated max. (I+N)/N = 16 dB
Plot 6 in Table 1 Setting: Ant. ele. angle = 10 degree UWB interf. route = back Distance = 10 meter Height = 0 meter Reading: estimated max. (I+N)/N = 3 dB

Plot 7 in Table 1 Setting: Ant. ele. angle = 10 degree UWB interf. route = back Distance = 8 meter Height = 0 meter Reading: estimated max. (I+N)/N = 4 dB
Plot 8 in Table 1 Setting: Ant. ele. angle = 10 degree UWB interf. route = back Distance = 6 meter Height = 0 meter Reading: estimated max. (I+N)/N = 4 dB
Plot 9 in Table 1 Setting: Ant. ele. angle = 10 degree UWB interf. route = back Distance = 4 meter Height = 0 meter Reading: estimated max. (I+N)/N = 4 dB

Plot 10 in Table 1 Setting: Ant. ele. angle = 10 degree UWB interf. route = back Distance = 2 meter Height = 0 meter Reading: estimated max. (I+N)/N = 5 dB
Plot 11 in Table 1 Setting: Ant. ele. angle = 10 degree UWB interf. route = side Distance = 20 meter Height = 0 meter Reading: estimated max. (I+N)/N = 5 dB
Plot 12 in Table 1 Setting: Ant. ele. angle = 10 degree UWB interf. route = side Distance = 20 meter Height = 1.45 meter Reading: estimated max. (I+N)/N = 8dB
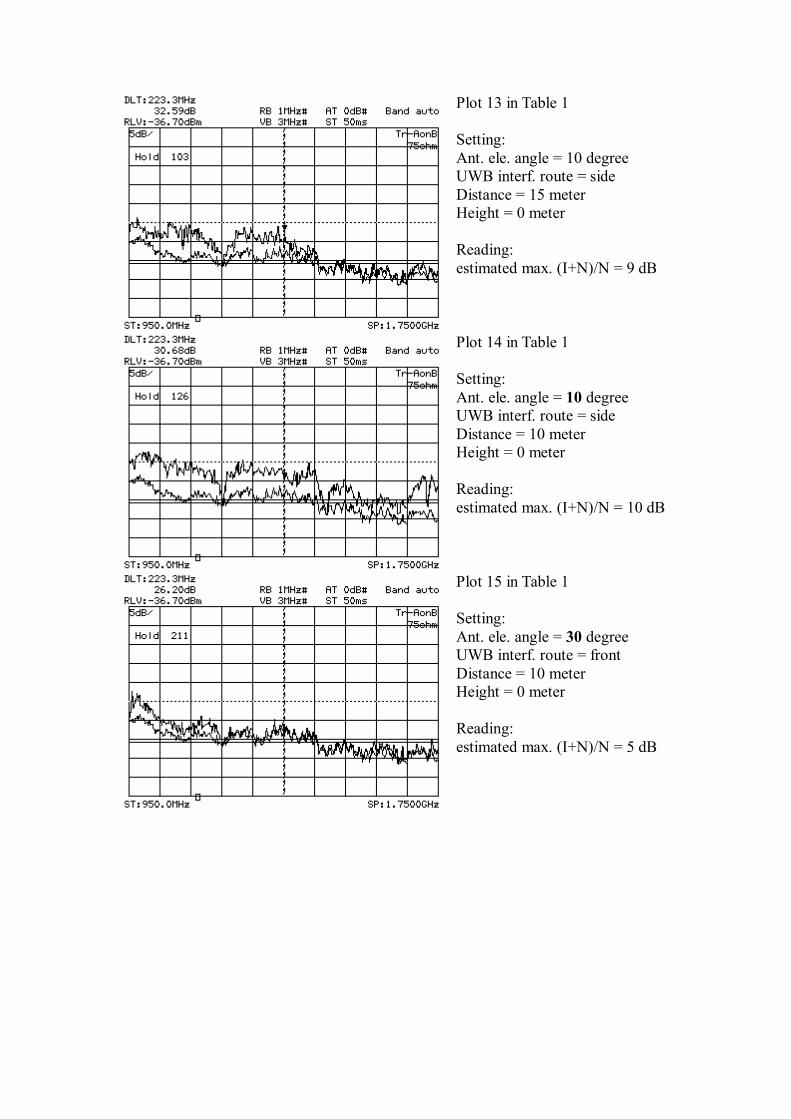
Plot 13 in Table 1 Setting: Ant. ele. angle = 10 degree UWB interf. route = side Distance = 15 meter Height = 0 meter Reading: estimated max. (I+N)/N = 9 dB
Plot 14 in Table 1 Setting: Ant. ele. angle = 10 degree UWB interf. route = side Distance = 10 meter Height = 0 meter Reading: estimated max. (I+N)/N = 10 dB
Plot 15 in Table 1 Setting: Ant. ele. angle = 30 degree UWB interf. route = front Distance = 10 meter Height = 0 meter Reading: estimated max. (I+N)/N = 5 dB

Plot 16 in Table 1 Setting: Ant. ele. angle = 30 degree UWB interf. route = front Distance = 10 meter Height = 1.45 meter Reading: estimated max. (I+N)/N = 5 dB
Plot 17 in Table 1 Setting: Ant. ele. angle = 30 degree UWB interf. route = front Distance = 8 meter Height = 0 meter Reading: estimated max. (I+N)/N = 6 dB
Plot 18 in Table 1 Setting: Ant. ele. angle = 30 degree UWB interf. route = front Distance = 6 meter Height = 0 meter Reading: estimated max. (I+N)/N = 12 dB

Plot 19 in Table 1 Setting: Ant. ele. angle = 30 degree UWB interf. route = front Distance = 4 meter Height = 0 meter Reading: estimated max. (I+N)/N = 15 dB
Plot 20 in Table 1 Setting: Ant. ele. angle = 30 degree UWB interf. route = front Distance = 2 meter Height = 0 meter Reading: estimated max. (I+N)/N = 18 dB
Plot 21 in Table 1 Setting: Ant. ele. angle = 30 degree UWB interf. route = side Distance = 20 meter Height = 0 meter Reading: estimated max. (I+N)/N = 6 dB

Plot 22 in Table 1 Setting: Ant. ele. angle = 30 degree UWB interf. route = side Distance = 20 meter Height = 1.45 meter Reading: estimated max. (I+N)/N = 10 dB
Plot 23 in Table 1 Setting: Ant. ele. angle = 30 degree UWB interf. route = side Distance = 15 meter Height = 0 meter Reading: estimated max. (I+N)/N = 8 dB
Plot 24 in Table 1 Setting: Ant. ele. angle = 30 degree UWB interf. route = side Distance = 15 meter Height = 1.45 meter Reading: estimated max. (I+N)/N = 12 dB

Plot 25 in Table 1 Setting: Ant. ele. angle = 30 degree UWB interf. route = side Distance = 10 meter Height = 0 meter Reading: estimated max. (I+N)/N = 10 dB
Plot 26 in Table 1 Setting: Ant. ele. angle = 30 degree UWB interf. route = side Distance = 10 meter Height = 1.45 meter Reading: estimated max. (I+N)/N = 14 dB
Plot 27 in Table 1 Setting: Ant. ele. angle = 60 degree UWB interf. route = front Distance = 10 meter Height = 0 meter Reading: estimated max. (I+N)/N = 5 dB

Plot 28 in Table 1 Setting: Ant. ele. angle = 60 degree UWB interf. route = front Distance = 10 meter Height = 1.45 meter Reading: estimated max. (I+N)/N = 5 dB
Plot 29 in Table 1 Setting: Ant. ele. angle = 60 degree UWB interf. route = front Distance = 8 meter Height = 0 meter Reading: estimated max. (I+N)/N = 9 dB
Plot 30 in Table 1 Setting: Ant. ele. angle = 60 degree UWB interf. route = front Distance = 8 meter Height = 1.45 meter Reading: estimated max. (I+N)/N = 7 dB

Plot 31 in Table 1 Setting: Ant. ele. angle = 60 degree UWB interf. route = front Distance = 6 meter Height = 0 meter Reading: estimated max. (I+N)/N = 10 dB
Plot 32 in Table 1 Setting: Ant. ele. angle = 60 degree UWB interf. route = front Distance = 6 meter Height = 1.45 meter Reading: estimated max. (I+N)/N = 10 dB
Plot 33 in Table 1 Setting: Ant. ele. angle = 60 degree UWB interf. route = front Distance = 4 meter Height = 0 meter Reading: estimated max. (I+N)/N = 12 dB

Plot 34 in Table 1 Setting: Ant. ele. angle = 60 degree UWB interf. route = front Distance = 4 meter Height = 1.45 meter Reading: estimated max. (I+N)/N = 12 dB
Plot 35 in Table 1 Setting: Ant. ele. angle = 60 degree UWB interf. route = front Distance = 2 meter Height = 0 meter Reading: estimated max. (I+N)/N = 19 dB
Plot 36 in Table 1 Setting: Ant. ele. angle = 60 degree UWB interf. route = front Distance = 2 meter Height = 1.45 meter Reading: estimated max. (I+N)/N = 25 dB

Plot 37 in Table 1 Setting: Ant. ele. angle = 60 degree UWB interf. route = front Distance = 20 meter Height = 0 meter Reading: estimated max. (I+N)/N = 0 dB
Plot 38 in Table 1 Setting: Ant. ele. angle = 60 degree UWB interf. route = front Distance = 20 meter Height = 1.45 meter Reading: estimated max. (I+N)/N = 0 dB
Plot 39 in Table 1 Setting: Ant. ele. angle = 60 degree UWB interf. route = front Distance = 15 meter Height = 0 meter Reading: estimated max. (I+N)/N = 2 dB

Plot 40 in Table 1 Setting: Ant. ele. angle = 60 degree UWB interf. route = front Distance = 15 meter Height = 1.45 meter Reading: estimated max. (I+N)/N = 4 dB
Plot 41 in Table 1 Setting: Ant. ele. angle = 60 degree UWB interf. route = front Distance = 19 meter Height = 1.45 meter Reading: estimated max. (I+N)/N = 1 dB
Plot 42 in Table 1 Setting: Ant. ele. angle = 60 degree UWB interf. route = front Distance = 18 meter Height = 1.45 meter Reading: estimated max. (I+N)/N = 1 dB

Plot 43 in Table 1 Setting: Ant. ele. angle = 60 degree UWB interf. route = front Distance = 17 meter Height = 1.45 meter Reading: estimated max. (I+N)/N = 2 dB

ATTACHMENT 2
Test Report on Interference from UWB Devices
to VSAT Links
BY
APT SATTELLITE CO., LTD.

Table of Content
1. Test objectives 2. Methodology 3. Test setup
3.1 Equipments used in test 3.2 Connections
4. Calibration
4.1 Carrier Pattern of the UWB devices 4.2 Calibration of the UWB Output Power
5. Test results
5.1 UWB device placed in front of the 1.8 meter antenna 5.2 UWB device placed in the side area of the 1.8 meter antenna
6. Analysis and conclusions

Background: UWB (Ultra Wide Band) device is one type of SRD (Short Range Device), it operates in 3.1-10.6 GHz band with very low emission power by spreading the signals in a very wide frequency band. A mask E.I.R.P.(Effective Isotropically Radiated Power) density of -41.3 dBm/MHz has been adopted by UWB devices manufacturers as its emission power guideline. Since its operating frequencies overlap with the C-band FSS downlink frequencies, i.e. 3.4 – 4.2 GHz, which is allocated as primary service in most countries and regions, UWB transmissions would cause interference when operating in close proximity to the FSS receiving stations. ITU-R S.1432 has detailed the protection criteria for interference analysis between primary and secondary services. 1. Test Objectives 1.1 In order to evaluate the magnitude of the interference from UWB to FSS, field tests have been performed by many organizations around the world. While most tests focused on monitoring the visualized satellite TV reception degradation that was caused by the presence of nearby UWB devices, its impact on the other type of satellite services such as data transmission links, is seldom mentioned. VSAT (Very Small Aperture Terminal) systems are representative data transmission systems that are widely implemented in the world. The interference from UWB transmissions to the VSAT links should be evaluated. 1.2 Some UWB devices employ LDC (Low Duty Cycle) technique and/or DAA (Detect and Avoid) technique to reduce its interference to other radio services. LDC achieves this target by reducing the UWB device’s working cycle time so as to decrease its totally emission power in a given period of time to a level that the other services can be protected. DAA can detect the presence of the local radio radiations, if other services already employ a band, it will shift to the other band to avoid frequency overlapping. While it is commonly known that the DAA technique is not practical to detect the FSS signal (too weak to detect), the benefit brought by LDC for protecting FSS should be evaluated. 2. Methodology In order to simulate the interference scenarios, a typical VSAT link was established in site, it was used as an example of the victim being harmfully interfered by a nearby operating UWB device. Usually a VSAT network consists the outbound (from hub station to remote terminals) and inbound (from remote terminals to hub stations) transmission which work in pairs to communicate data among the network. The outbound part is more prone to interference since it usually utilizes small size antennas in the remote site due to economic reasons, these small size antennas have lower G/T and higher side-lobe gain features which make them easier to be jammed by interference. The Eb/N0 readings of the VSAT demodulators in the remote site would decrease if a UWB device worked nearby. The BER tester that works in parallel with the demodulator would also record Errored Seconds (“ES”) and Severly Errored Seconds (SES) which means the number of “second” when the tester detects some error in demodulation (ES) and when the error accumulates to a serious situation that the link is totally disrupted (SES). A combination of interference incoming angle, separation distances and UWB device height and their respective influence on noise floor were evaluated. 3. Test Setup The test was conducted on July 30, 2009 at the Tai Po Earth Station of APT Satellite Ltd, Hong Kong. The following is the setup of the VSAT link which is widely implemented in satellite

communication field. Only outbound is analyzed in the test since it is more vulnerable to interference due to deployment of smaller antennas. A wide variety of satellite services and applications can be implemented based on this link. The link performance is summarized in Table 2. FSS Satellite:
APSTAR-VI at 134°East longitude VSAT carrier frequencies:
Two carriers at 3807.06 MHz and 3808.06 MHz in downlink Vertical polarization in C-5B transponder of APSTAR-VI
VSAT Carrier: outbound information rate 64 Kbps, QPSK, FEC=7/8, viterbi coding, threshold Eb/N0 = 9.5
Hub station: 13 meter Vertex antenna in Tai Po Earth Station, APT Satellite Ltd.
Terminal Station: 1.8 meter dish antenna, elevation = 55.7°, azimuth = 136.4°
The UWB interference to VSAT link is dependant on the interference incoming angle for the VSAT antenna, two settings of incoming angles were tested. The UWB device was placed 1) in front of the antenna and 2) in the side area of the antenna to test its interference to the VSAT link. In addition, for some locations, the UWB device was placed both on ground level and on a rack of height of 1.45 meter in order to simulate the UWB applications that integrate with mobile phones. Two UWB devices (wireless USB hub) that used in the test are commercially available in many local computer stores, it is equipped with LDC (low duty cycle) technology which enables the device to work in 5% of time in a duty cycle. 3.1 Equipments Used in Test

Table 1 Equipments Manufacturer Model Specs 1.8 meter receiving only dish antenna
Hua Da Antenna Factory
C-band SMC RX-H&V dish antenna
Gain: 35.68 dBi at 4 GHz
Extended C-band PLL LNB (Low Noise Block)
CalAmp 140194 Gain: 63 dB Input: 3.4 – 4.2 GHz Output: 950 – 1750 MHz Noise: 20 K
C-band LNA (Low Noise Amplifer)
California Amplifier 30622 Gain: 50 dB Input: 3.625-4.2 GHz Output: 3.625-4.2 GHz Noise: 40 K
Integrated Receiver Decorder(IRD)
Harmonic IRD-2900 Compliant with DVB-S and DVB-S2
Spectrum Analyzer Anritsu MS 2663C Frequency range: 9KHz-8.1 GHz
UWB device IOGEAR IOGEAR Wireless USB hub and Adapter, GUWH104KIT
Frequency range: 3.168-4.752 GHz Output power: -41.3 dBm/MHz Antenna Gain: 0 dBi Duty cycle: 5% at full transfer rate (LDC ready)
Block transceiver Codan 5700 C-band converter
Input frequency: 3.4-4.2 GHz Output: 70 or 140MHz IF
Satellite modem Comtech EF DATA SDM-300A Frequency range: 50-180MHz Symbol rate range: 4.8 Kbit/s to 2.5 Mbit/s Mod/demod: BPSK, QPSK, 8PSK, 1/2 to 7/8
BER tester Sunrise Telecom Sunset E20 & T10
BERT testing to frame relay, voice, ISDN primary rate, GR-303, HDSL, SS7, Datacom, and DDS PATTERN 2E-15
Accessories: 3 way splitter, notebook computer to operate the UWB device, notebook computer to capture plots from the Spectrum Analyzer, cables, etc

3.2 Connections
Figure 1: Equipment Connections
The antenna was setup in the rooftop of floor 2, block 2, Tai Po earth station, pointing to APSTAR-VI satellite at 134°E. The LNB was installed to receive horizontal polarization signal in parallel with the LNA. LNB worked with IRD to receive a TV carrier on APSTAR-VI which was meant to provide a side reference to the power level of the satellite signal, the TV signal’s Eb/No margin reading would decrease when the FSS signal is jammed. The LNA worked to receive vertical polarization signal where the VSAT carriers were located. After receiving the carrier signal via the antenna, LNA routed the carrier signal to the transceiver where it was converted from C-band frequency (3.4 to 4.2 GHz) to IF frequency (140 MHz in this case). The signal was later routed to the satellite modem for signal demodulation. In the meanwhile, the IF signal was sent to spectrum analyzer for visual appreciation of its spectrum characteristics and C/N values, the notebook computer can store the spectrum plots for further analysis. Two BER testers were connected to the satellite modems to perform BER analysis on two VSAT outbound carriers respectively. The UWB interference signal source was generated by a commercialized product of wireless USB hub. It comprises a USB host dongle connected to a notebook computer via a USB port and a UWB USB hub that is connectable to several USB disk drives. The UWB transmission occurred by activating an USB drive copying or pasting files from/to the computer via the dongle. When the application was reading the file in UWB USB disk, the UWB hub transmitted at its full power and caused most serious interference to the nearby FSS receiving system. The photos for the equipments setup is as shown in Figure 2. There were three readings for evaluation of the severity of VSAT link disruption that was caused by the UWB interference: Eb/N0 value by the satellite modem, it should decrease when the power of the UWB
interference increases
work in pair LNB
UWB USB Hub
UWB USB dongle
Transceiver
IRD
Spectrum Analyzer
ele = 55.7° LNA
Sat modem 2
Sat modem 1 BER tester 1
BER tester 2

Errored second (ES) number and Severly Errored Second (SES) number by the BER tester.
During certain period of time (5 minutes for each test spot), the accumulative ES and SES number should increases when the power of the UWB interference increases
Eb/N0 margin value by the IRD. It should decrease when the power of the UWB interference
increases Figure 2: Photos of Equipments
Outdoor part
Indoor part
UWB wireless hub

4. Calibrations 4.1 Carrier Pattern of the UWB devices
Figure 3: UWB Interference Carrier Pattern
Two VSAT carriers in IF spectrum, without UWB interference. IF of Carrier 1 = 145.06 MHz IF of Carrier 2 = 146.06 MHz
UWB placed 6 meter in front of the 1.8 meter ant. and started working

Maximum hold
4.2 Calibration of the UWB Output Power The UWB device(wireless USB) was directly connected to the spectrum analyzer as shown in Figure 4, two UWB devices were measured in sequence.
Figure 4: Calibration of the UWB output power
Figure 5: Spectrum plots of the UWB output
UWB device Spectrum Analyzer
Cable connected to the spectrum analyzer
UWB device

UWB device 1: Maximum-hold Mask power density in Spec: -41.3 dBm/MHz Calibrated power density: -38.83dBm/MHz Device 1 is selected for the interference test.
UWB device 2 Maximum-hold Power density in Spec: -41.3 dBm/MHz Calibrated power density: -41.09dBm/MHz
It should be noted that the wireless USB hub employs MB-OFDM (Multi-band Orthogonal Frequency Division Multiplexing) technology. The maximum hold plots show clearly there are three channels in its working frequency band of 3.168 – 4.752 GHz. During the test, its working pattern was observed as, from time to time, depending on the type of undertaking task (i.e. file copying or synchronization etc), either one or two or three channels are activated. The selection is random and unpredictable. 5 Test result Before the test commencing, two VSAT links were warmed up for around 15 hours to ensure all equipments worked properly. Figure 6 has shown there were no ES or SES within this period of time.
Figure 6: No ES/SES record before the test

Table 2 is a summary of the readings of the equipments before the UWB device started working. It indicated two VSAT links have 1.5-1.6 dB link margin
Table 2: VSAT link performance VSAT link performance
Readings and Margins Reading Required Margin Notes
Carrier 1 11.1 9.6 1.5 Note1 Eb/N0 of satellite modem (dB) Carrier 2 11.2 9.6 1.6 Note1
Carrier 1 0 0 N/A Note2 BER Tester ES in 15 hours Carrier 2 0 0 N/A Note2
Carrier 1 0 0 N/A Note2 BER Tester SES in 15 hours Carrier 2 0 0 N/A Note2 Eb/N0 margin of the IRD (dB) 3.1 0 3.1
Note 1: In the specification of the “SDM-300A satellite modem”, the threshold Eb/N0 is 9.6 dB when carrier is QPSK with 7/8, under the requirement of BER at 10-8. It is more than 10-10 with Eb/N0 of 11.1dB. Note 2: When BER is 10-10, information rate is 64kbit/second, the data transmission allows averagely 0.3456 error bit in the warm-up 15 hours. For the two tested two carriers, no ES was recorded. Taking into account the high requirement of BER for the VSAT link, any interference that causes only one single ES in a short period of time is not acceptable. 5.1 UWB device placed in front of the 1.8 meter antenna The UWB device(wireless USB) was placed on the ground in front of the antenna and tested at 6 m, 8m, 10 m, 12 m distance in sequence, as shown in Figure 7. When the wireless USB began to transfer data to the notebook computer, interference occurred to the VSAT link, the satellite modems recorded decreasing Eb/N0 value while both Errored Second (ES) and Severly Errored Second (SES) readings increased for both testers. The Eb/No margin reading of the IRD also provided a side reference to the decreasing link performance. Table 3 is a summary of data readings for VSAT carrier 1 and 2 respectively.

Figure 8 is sample photos of the Eb/No readings of the modem, BER tester readings and the IRD Eb/N0 margin readings, in some test spots.
Figure 7: Test points in front of the ant.
Figure 8: Sample photos

Table 3: Test spots in front of the antenna UWB Test spots in front of ant. Readings 6 meter 8 meter 10 meter 12 meter
Carrier 1 4.8 5.6 10.8 11.1 Eb/N0 of satellite modem (dB) Carrier 2 4.9 5.1 10.8 11.2
Carrier 1 135 33 0 0 BER Tester ES in 5 minutes Carrier 2 50 2 0 0
Carrier 1 44 2 0 0 BER Tester SES in 5 minutes Carrier 2 5 0 0 0 Eb/N0 margin of the IRD (dB) 1.6 2.7 3.1 3.1
5.2 UWB device placed in the side area of the 1.8 meter antenna The UWB device(wireless USB) was placed in the side area of the 1.8 meter antenna where it can directly “see” the antenna feeder as shown in Figure 8. For this specific 1.8 meter antenna, this area is measured as around 97±10 degree bear angle from the antenna bore-sight. Coincidentally during the test, portions of this area were indoor area, all test spots were located indoor as opposed to the antenna, as shown in Figure 7. They had separation distance of 20 m, 15m, 10m, 8m and 6m with the 1.8 meter antenna during the test. Table 4 is a summary of data readings for VSAT carrier 1 and 2 respectively.
Figure 7: Photos of test spots in the side area

Figure 8: Illustration of the side area
Table 4
UWB Test spots in side area of ant. Readings 4 m* 6 m * 8 m on a rack of
1.45 m tall 10 m on a rack of
1.45 m tall 20m on a rack of
1.45 m tall
Carrier 1 10.6 10.5 7.1 6 7.7 Eb/N0 of satellite modem (dB) Carrier 2 10.5 10.5 7.7 5.9 7.6
Carrier 1 2 2 26 21 8 BER Tester ES in 5 minutes Carrier 2 1 1 11 23 8
Carrier 1 0 0 17 10 2 BER Tester SES in 5 minutes Carrier 2 0 0 6 7 2 Eb/N0 margin of the IRD (dB) 2.8 2.9 2.9 1.9 1.4
* The interference at 4 m and 6 m spots is not as serious since the UWB device was put on ground and could not “see” the feeder directly. Then it was placed on a rack of 1.45 meter tall in later test spots in 8 m, 10m and 20m. 6 Analysis and conclusions 6.1 UWB transmissions have caused serious degradation of performance to the VSAT carriers
in both interference scenarios. During 15 hours period of time before the test, no ES or SES occurred, Eb/No margin is 1.5-1.6 dB, the link performance meets the BER criteria of 10-8. During the tests, within 5 minutes time, a great deal of ES and SES occurred for many test spots, the link performance can not be maintained due to the presence of UWB transmissions. The degradation of BER is corresponding to a decreasing availability of the VSAT link which is usually set at 99.99% taking into account the rain attenuation and outage caused by ASI (Adjacent Satellite Interference), cross-pol and inter-modulations interferences. Apparently with the presence of UWB transmissions, the 99.99% availability for VSAT data links would be compromised.
6.2 In accordance with ITU-R S.1432, the overall interference caused by secondary radio

services on primary service should not exceed 1% of the thermal noise (i.e. multi entry I/N < -20 dB). The test has shown that, when the UWB interference totally disrupted the VSAT link and consequently caused a SES, the thermal noise must have been raised by 1.5-1.6 dB at least so that the link margin became deficit. The corresponding I/N ratio is 48% - 51%, much more than the 1% criteria.
6.3 When the UWB device was put in front of the VSAT antenna, at least 10 meter of space
clearance should be provided to protect VSAT service. When the UWB device was put in the side area with direct line-of-sight of the antenna feeder, even 20 meter clearance is not enough. It is believed this side area case is only applicable for certain type of FSS antenna (frond-fed), the interference magnitude and the size of this area (97±10 degree for the tested antenna) is dependant on the algorithm of the construction of the antenna. However, this area should have been taken into account since it is easily causing interference to the antenna. The UWB device was coincidentally located indoor in this area, no mention the indoor-to-outdoor loss, it still cause serious interference to the VSAT link.
6.4 The idea of establishing a 10 meter radius exclusion zone for UWB devices surrounding
the FSS receiving antennas should not be based on the result of this test since 1) the 10 meter clearance in front of the 1.8 meter antenna is a specific case. In the test configuration, its elevation angle is 55.7 degree, no interference was observed when the UWB is put at 10 meter distance and beyond. However, it would be much different when the antenna tilted down in elevation so that it would be much easier to pick up radio signals transmitting directly into its reflector; 2) the tested VSAT link is a specific case too, other links with more complicated data modulation usually require higher Eb/N0 criteria and consequently more protection from interference. For them, whether or not a much wider exclusion zone should be introduced?
6.5 LDC technology is no helpful for the mitigating the UWB interference to VSAT link. LDC
can only reduce the average power emission of the UWB devices. During its pulse-like 5% of working time, the data frame of the VSAT carriers was lost due to its high power of -41.3 dBm/MHz. Considering the self-correction function of the VSAT duplex link, after detection of the error frame, the VSAT terminal will send back a request to the hub station for retransmission of the lost frame. It takes a round trip of around 500ms for the retransmission and very likely it would fall in the next UWB pulse and be jammed again.
Since the UWB power mask of -41.3 dBm/MHz would cause harmful interference, a UWB device transmitting in this power level in a cycle of 5% is corresponding to a loss of availability of 5% for the VSAT link, which is unacceptable to any protocol of VSAT links.
6.6 The aggregate effect of UWB devices working in the same frequency band is not taken into account in the test. It could result in worse interference compared to that from one single UWB device.