Embed Size (px)
Citation preview

ANNUAL REPORT AND FINANCIAL STATEMENTS 2017

ANNUAL REPORT AND FINANCIAL STATEMENTS 2017ANNUAL REPORT AND FINANCIAL STATEMENTS 2017 32
ContentsOur story
Group Chairman and ceo’s statement 5
Strategic report 9
Directors’ report 43
Independent auditors’ report 50
Consolidated financial statements 58
Company financial statements 96
Our founder Peter Boizot threw open the doors of the first PizzaExpress on Wardour Street, Soho, in 1965. With it, he revolutionised the London restaurant scene. After university, Peter lived and worked in France, Germany and Switzerland before settling in Rome. On his return to London he was shocked to discover that he couldn’t find pizza anywhere. Recognising its potential, he decided to make, sell and enjoy real Italian pizza.
Peter’s mantra was authenticity. Shipping an authentic pizza oven from Naples, and sourcing real mozzarella from the only producer in London, he secured his first premises which opened in March 1965, selling squares of pizza in greaseproof paper through the front window at 10p a slice.
Peter teamed up with Italian designer Enzo Apicella, and together they introduced a wine menu, dining tables, our signature open kitchen and simple, attractive furnishings. Celebrities and journalists flocked to the restaurant and a brand was born.
Individual designs became a feature as the brand expanded, with Peter determined to avoid the business becoming a homogeneous, faceless chain. Instead, he saw PizzaExpress as a necklace and each restaurant as an individual gem. Enzo designed over 85 such gems.
Today, we operate over 600 restaurants in the UK & Ireland and internationally. Peter’s passion for pizza is central to PizzaExpress, and the care and attention he put into the food and ambience are principles that still inspire us.

ANNUAL REPORT AND FINANCIAL STATEMENTS 2017ANNUAL REPORT AND FINANCIAL STATEMENTS 2017 54
Group chairman and ceo’s statement
PizzaExpress at a glance—we…
In May 2017 I proudly became the Group Chief Executive Officer of PizzaExpress, having served as Chairman for the last two years. In that role, I had already got to know the business well, and I have seen it develop considerably both in the UK and internationally following its acquisition by Hony Capital. Since taking on the role of Chief Executive and having spent more time in all our markets, I have been hugely impressed with the commitment, dedication and passion shown by our restaurant teams and our head office teams (that we rightly call ‘Restaurant Support’) in all our operations around the world.
The strength of the brand is impressive; it is of course well recognised in the UK as market-leading, but is also steadily becoming better known in the other territories in which we operate. At the heart of this is the fact that PizzaExpress appeals to a broad consumer demographic across multiple occasions, and, crucially, that every customer visit to PizzaExpress is underpinned by an exceptional experience.
Consumers are increasingly less interested in purchasing material goods and instead are choosing to spend their money on experiences that they can enjoy and share with the people around them. People don’t just come to PizzaExpress to eat a delicious pizza; they are visiting for the overall experience and for this reason, we put a lot of emphasis on ensuring our teams not only understand how to deliver best-in-class customer service but enjoy doing so too.
UK & IrelandThe UK & Ireland business has continued to progress in 2017, despite the widely publicised sector-wide ‘cost headwinds’ in the UK, be they the impact of higher food costs due to the depreciation of sterling and increases in commodity prices, the increases in National Living Wage and National Minimum Wage, the rise in business rates or indeed commercial rents that continue to increase. Conditions in Ireland have been more benign than in the UK, and we continue to see good progress in our Milano operation.
We opened 13 restaurants in the year: ten PizzaExpress, one Milano, one trial site under the Firezza brand and a first PizzaExpress site operated by our new franchise partner in the UK, Welcome Break, at the Oxford Services. We also refurbished 25 sites, including the complete transformation of our restaurant in High Holborn, London, as the first of our new-look ‘PizzaExpress Live’ sites. We are very pleased with the performance of this site since it opened in August 2017 and the customer feedback has been really positive.
We also continued to explore innovative ways of bringing PizzaExpress to new audiences. For example, our PizzaExpress ‘Boxed’ concept: two customised, PizzaExpress-branded shipping crates appeared at summer festivals including Barclaycard British Summer Time, Goodwood Festivals and Gloworm. Importantly, although it is mobile, Boxed remains true to the spirit of our permanent sites, producing freshly-made, high-quality, restaurant-standard pizzas served hot to thousands of happy customers.
…serve customers in
…generate over
restaurants
of revenues*
* 52 weeks to 31 December 2017
14,500
…operate in
…employ over
…have raised over
territories
for good causes*
13
£800,000
607
£530m
team members

ANNUAL REPORT AND FINANCIAL STATEMENTS 2017ANNUAL REPORT AND FINANCIAL STATEMENTS 2017 76
We executed a number of improvements to our Retail business this year in both our well established chilled range of products on sale in most major grocery retailers and the newer Artisan frozen range that is available at Iceland. For the very first time we developed retail versions of seasonal in-restaurant specials; the Zapparoli Romana and Campana Romana were launched at the same time as their restaurant equivalents and all four variations proved to be great successes in their respective channels.
As we noted last year, home delivery is having a significant impact on the restaurant sector and in 2017 our delivery sales continued to grow. We now consider that we have three channels within a restaurant: dine-in, collection and delivery. Following the rapid evolution in the delivery market, and the significant success of our partnerships with Deliveroo and, on a smaller scale to date with Just Eat, in November we completed the disposal of the Firezza delivery business. This means we now access the delivery market solely in partnership with selected third-party aggregators, leveraging our existing restaurant network in a capital-light manner.
Indeed our partnership with Deliveroo continued to develop through 2017 and we saw a steady increase in performance through the year. We also expanded our trial with Just Eat to 60 sites by the end of the year, and are working hard on a number of projects to improve the speed of delivery as well as investing in technology to further improve product quality to ensure that our customers receive the best possible pizza when they order PizzaExpress to be eaten at home.
InternationalOur International business continued to expand throughout 2017, with a record number of openings in a 12-month period in our equity markets (27), together with a further seven restaurants opened by our franchise partners. Our International segment now represents around 22% of the total Group estate (14% company-owned, 8% franchise). We operate these restaurants in over a dozen territories around the world and I strongly believe that PizzaExpress has the potential to become a truly global business.
However we recognise that we will not achieve this by simply seeking to replicate the model we operate in the UK & Ireland. Remaining true to our PizzaExpress core whilst appealing to evolving local tastes is essential for success and we have continually innovated and introduced new products to the menu in our local markets, such as new fish and steak dishes in China. We have however ensured that we maintain our focus on pizza, including the development of new pizzas specifically for the Chinese market.
We also know that consumer behaviour is not the same across the world. For this reason, we have been looking at how we interact with our customers and adapting our operations accordingly. For example, in China we have driven growth through our payment channels by accepting smartphone-optimised systems like Alipay rather than the debit and credit cards favoured by European customers.
Charitable activityIn the UK & Ireland, our second Annual Charity Week for Macmillan was held in the last week of June and once again our team members amazed us with their passion and dedication to raising money for our charity partner. Up and down the UK, our teams in restaurants and Restaurant Support ‘went green’ for the week and put on a huge range of fundraising activities, whilst over in Ireland, our Milano teams ‘went yellow’ during Charity Week raising money for our local charity partner, Enable Ireland.
We also supported other charities through a variety of events in our International markets. In Hong Kong the team donated a proportion of sales of our Trifolata pizza to support the Hong Kong Cancer Fund and the team also used any leftover fresh dough to bake flatbreads for distribution through a food bank, Feeding Hong Kong. In the UAE, we partnered with the Dubai Foundation for Women and Children, a non-profit organisation dedicated to the rehabilitation of victims of domestic violence, abuse or human trafficking. Across all our markets we raised over £800,000 for good causes in 2017.
ResultsIn the 52 weeks to 31 December 2017 the Group generated turnover of £534.2m, which is growth of 6.3% on the pro forma prior year period (52 weeks to 1 January 2017). On the same basis Group like-for-like* sales growth was 1.4% and operating profit was £60.6m.
Our International business continues to drive a significant proportion of this growth with turnover up 34.6% on the pro forma prior year to £93.7m and I am delighted to say that we returned to like-for-like sales growth in the UK & Ireland, up 0.4%. 2017 was also the first year that our International businesses were classified as like-for-like and this growth was a particularly pleasing 8.2%.
Across the same period, ebitda* declined by 8.9% from £103.9m to £94.6m, with an increase in our International operations being more than offset by the negative impact of margin pressures in the UK. More detail on our financial performance can be found on page 36 under ‘Key performance indicators’.
OutlookI am confident that we are putting in place a compelling strategy to help combat challenging market conditions and to drive the future growth of the Group based on a number of fundamental principles. Firstly, we will adopt an employee-first approach that recognises the importance of people in our business, and strives to achieve a high-performing culture. Secondly, we recognise the absolute need to put the customer at the heart of our business if we are to continue to deliver sustainable growth. Finally we are committed to investing in our people and our brands to improve the ‘experience economy’ of our business.
We will seek to capitalise further on our brand equity across our markets through an increased focus on innovation in our restaurant business—in food, format or design—and by leveraging existing and new partnerships beyond the four walls of our restaurants.
Of course, the UK & Ireland remains a key focus. We plan to drive growth organically in this market, supported by a range of initiatives including the further development of delivery, while also having a much more targeted approach to new site rollouts.
The other crucial part of our strategy is further international growth, especially in China where there is a growing middle class and demand for Western brands like PizzaExpress.
I have taken on the role of leading this business in a challenging period for our industry in the UK and the challenges undoubtedly remain as we look forward to 2018. Cost pressures and a rapid rise in competition have been the focus of considerable recent negative sentiment, but I believe that in such times the strongest brands demonstrate their resilience. PizzaExpress is without question one such brand having recently been voted a ‘Superbrand’ in the UK and I remain confident in our future success.
Jinlong WangChairman and Chief Executive Officer30 April 2018
GROUP CHAIRMAN AND CEO’S STATEMENT GROUP CHAIRMAN AND CEO’S STATEMENT
* Non-statutory measure. See page 36 for full definition

ANNUAL REPORT AND FINANCIAL STATEMENTS 2017 9
Strategic report
The Directors present their Strategic Report for 2017.
Business activitiesThe principal activity of the Group is the operation of pizza restaurants in the UK and the Republic of Ireland (‘UK & Ireland’), and through its international operations (‘International’) which comprise both franchises and wholly-owned businesses. It also has licensing arrangements in place to enable PizzaExpress pizzas, salad dressings and other products to be sold through supermarkets.
Business modelWe believe that key to our success is the simplicity of our restaurant model where we install and operate a single cooking platform—a pizza oven—in all UK & Ireland restaurants. In addition, we offer our customers a menu oriented primarily around pizza. This focus enables us to deliver a freshly-prepared offering to a consistently high standard, and allows us to derive economies of scale in purchasing. Our model is flexible and is adaptable to different location types, sizes of restaurant and geographies.
Market reviewUK & Ireland We primarily operate in the restaurant segment of the UK & Ireland eating and drinking out market, which was valued at approximately £88bn in 2017. The restaurant segment consists predominantly of full-service branded restaurants (including chain casual dining restaurants) and independent full-service restaurants. The branded restaurant sub-segment was valued at £5.7bn in 2017 and is forecast to grow at a cagr of 4.3% between 2017 and 2020. Growth in this sub-segment in the near term is expected to moderate from recent levels as the contribution from new outlets and immature sites decreases, but growth in the branded sub-segment will remain considerably stronger than the total restaurant market overall (source: MCA Eating Out Report, September 2017). As we move closer to the formal departure date of the UK from the European Union we will continue to monitor carefully the impact on market dynamics.
Given the moderation in the pace of expansion of new outlets across the market, there will be an increasing focus on generating solid like-for-like growth through offering great tasting food at good value in appealing restaurant environments. All of these attributes have been and continue to be key strengths of our business and therefore we remain confident in our ability to grow successfully in such market conditions.
International We believe we are well placed to take advantage of growth in the eating and drinking out market in our selected territories through our strategy of opening new restaurants in both well-established areas of Mainland China such as Shanghai, and by broadening our geographic reach into Tier 2 cities such as Wuhan. We will also continue to evolve and adapt our offering to ensure that it remains highly relevant and offers great value to our customers. Outside of Mainland China, our operations in Hong Kong and the UAE are well established and we will seek to grow our presence in these markets through the addition of carefully selected sites that complement our existing estate.
Zapparoli Romana

STRATEGIC REPORT STRATEGIC REPORT
ANNUAL REPORT AND FINANCIAL STATEMENTS 2017ANNUAL REPORT AND FINANCIAL STATEMENTS 2017 1110
In both the UK & Ireland and International segments we see the further development of the delivery market as one that offers considerable growth opportunities. We will continue to develop our presence in this market in the future.
Trading resultsThe results of the Group for the period are set out on page 58 and show an operating profit for continuing operations in the 52-week period ended 31 December 2017 of £60.6m (79 weeks ended 1 January 2017: £114.5m) and a loss before taxation for the period of £28.7m (79 weeks ended 1 January 2017: loss of £15.0m).
Further discussion on the results for the period is included on page 36.
StrategyOur people-first, customer-centric strategy focuses on the continued growth of the UK & Ireland business and the opportunity to grow our presence in selected international markets, primarily Mainland China. This growth is underpinned and enabled by continual investment in our people, in our brand and in technology. We also seek further development of our successful retail brand as well as evaluating other potential opportunities as they arise.
Growth in the UK & Ireland is achieved by an unwavering focus on delivering an outstanding customer experience through our commitment to quality food, excellent customer service and attractive restaurants. We also continue to build on our established track record of innovation in food, designed to maintain and enhance existing customer interest and attract new customers to the brand.
Growth in our International markets will be achieved by implementing our strategy of opening company-operated restaurants in attractive markets with expected high demand, as well as franchise restaurants in local markets where we believe working with a franchise partner is more appropriate—for example, where we believe a partner’s local expertise will enable the business to grow more successfully than if we were to operate alone.
During the period we executed this strategy through the opening of a net 25 restaurants in our wholly owned markets of Mainland China, Hong Kong, the UAE and Singapore, and a net two with our franchise partners. We continue to anticipate that the majority of ebitda growth in our International segment will arise from the opening of new company-operated restaurants in Mainland China where we expect to open a substantial number of restaurants each year.
We also continue to seek growth through our franchise partners in our existing international territories of Indonesia, India, Cyprus, Gibraltar, the Middle East and most recently the Philippines, and will seek to expand with existing or new partners in additional territories where suitable opportunities arise.
A world made happier by pizzaOur vision is of a world made happier by pizza—everything we do is in pursuit of this aim. In last year’s report we set out the strategic framework to deliver our vision. Whilst our vision is unchanged, we have updated the framework to ensure it remains fully relevant in light of the rapidly shifting market dynamics that we have seen over the last 12 months. Our strategic framework is therefore now organised under the following headings:
• Being passionate about our people
• Building business through a trusted brand
• Delivering unique customer experiences and value
• Driving sustainable growth
• Exploring new revenue growth channels and new concepts
Running through of all these segments are the values that govern how we operate:
• Family a welcoming, caring, happy place to work
• Winning with energy, thought and determination, we will succeed
• Pride if we are not proud, we are not doing it right
• Loyalty delighting customers will create lifelong affection
• Simplicity by keeping things simple, we can be brilliant
Together, we believe these attributes and ways of working will enable us to deliver our vision. The following pages provide some insight into our strategy and just some of the activities that we have undertaken to deliver this in 2017.
The PizzaExpress strategic framework

STRATEGIC REPORT
ANNUAL REPORT AND FINANCIAL STATEMENTS 2017 13
UK & IRELANDPeople are at the heart of our business and we are passionate about being a great place to work. Last year we launched our People Deal. This outlines the things that make PizzaExpress a great place to work, and the things that we expect from the people who work for us.
We conducted employee research to understand what our people love about PizzaExpress and what keeps them engaged in our business. The research identified eight pillars which make up our People Deal:
• Family• Heritage• Opportunities• Recognition• Our Food• Ways of Working• Fun and Flexible• Inclusivity and Respect
These principles underpin our internal and external communications to promote PizzaExpress as a great place to work.
Qualifications and apprenticeshipsAs one example of our ‘Opportunities’ pillar, we relaunched our Qualifications programme in September. This gives our team members the chance to study for a National Vocational Qualification while working for PizzaExpress. In 2017, over 250 team members embarked on qualifications in Team Leading, Kitchen Services, Food & Beverage Services, or Hospitality Supervision & Leadership.
Being passionate about our people

STRATEGIC REPORT STRATEGIC REPORT
ANNUAL REPORT AND FINANCIAL STATEMENTS 2017ANNUAL REPORT AND FINANCIAL STATEMENTS 2017 1514
Supporting our teamsIn September, we launched a company-wide engagement survey called ‘Let’s Talk…Feedback’. The survey provided us with an opportunity to listen to the views of our team members and to give them a forum for making suggestions on how we can make PizzaExpress an even better place to work.
The survey was sent to all 11,000-plus employees in the UK & Ireland and contained questions on topics including culture, engagement, management and development. The results were used to inform action plans at a national, regional, area and restaurant level.
Gender pay statementWe are proud of having a diverse workforce and attracting applicants of different ages, backgrounds and nationalities and believe we must support this equality through fair pay. Our mean gender pay gap is 8.1%, and our median gender pay gap is 4.9%. While our gender pay gap is significantly below the UK mean of 18.1%, we recognise that there is more we can do. Our gender pay gap reflects the average paid to men and women across the UK business. It is not a comparison of pay rates for men and women doing work of equal value.
It is important to recognise other pay elements in our industry that do not form part of an employee’s salary. In the lower quartile of pay bands 63% are women working in front of house and back of house, and these roles have fixed hourly rates. If we were to include other benefits that our front of house and back of house teams earn, the gap closes.
Diversity is important to all of us and we continue to build on our reward package that is equitable, fair, consistent and appropriately reflects our company values. We have a large number of women join our business in the lower pay quartiles and we remain committed to attracting and retaining the very best talent at all levels. This starts at the very top and we are very proud that 40% of our UK & Ireland leadership team roles are held by women. We continue to review and develop our practices and policies, in line with our Family and People values to encourage women to progress to senior roles.
Safety of our teamsAs the safety and well-being of our teams are of paramount importance, we responded proactively to recent terror incidents in London and Manchester. Last year we conducted one-to-one training with all our restaurant teams on emergency planning. The training involved improving our visitor sign-in processes and guidance on personal safety, emergency evacuation and lockdown procedures. We also introduced a 24-hour service for reporting incidents to ensure our teams are always supported in times of need.
INTERNATIONAL
Supporting our teamsIn China we recruited more than 1,000 team members to join the Pizza Marzano family, with a particular focus on offering opportunities to young people, achieved by delivering presentations at colleges to attract student applicants.
We also partnered with Jianghai College to design and develop a ‘Marzano western food class’. Over 18 months, students will divide their time between the university campus and our restaurants.
PizzaExpress Hong Kong developed a suite of training courses to ensure team members meet customers’ expectations of PizzaExpress. The courses complement existing business training, external English courses and promotion training. Together, these initiatives led to several internal training qualifications.
We were very proud to be named as one of the ‘Best Companies To Work For In Asia’ by HR Asia. The award recognises outstanding employer practices and identifies Asia’s employers of choice. This is a fantastic achievement and a sign of the growing reputation of our business in the region.
In the UAE, our people development programme saw our teams take pride in their career progression opportunities. We are pleased that nearly a quarter of our people have been in the business for more than five years but due to the growth in the size of the estate, we introduced induction training, to support a 68% increase in new team members. We also developed more refresher training to encourage team member development and increase retention, and are delighted with the reduction in people turnover seen in the year.
Engagement of our team members is important to us and our annual team recognition night recognised unsung heroes of the business and celebrated team members who have been with us since 2000. During the year we also ran activities including an annual sports event, regular town hall meetings and employee of the month programmes.
We were also very proud to be voted one of the Top 30 companies in the ‘Great Places to Work’ survey in the UAE.

STRATEGIC REPORT
ANNUAL REPORT AND FINANCIAL STATEMENTS 2017 17
UK & IRELANDCharitable workMarch 2017 marked 12 months since we started our charity partnership with Macmillan Cancer Support and during the year we passed the milestone of £1 million raised. This achievement was possible thanks to our donation of 25p for every Padana pizza sold, customer donations on Snowball Dough Ball Day, as well as our teams’ own fundraising activities.
In June we held our annual Charity Week, a focused week of fundraising by our restaurant teams and our support offices. In the UK several managers took part in a sponsored cycle ride, between them cycling the length of the country twice—over 1,300 miles. Our team members were really engaged and raised over £70,000 for Macmillan in Charity Week alone.
Across the year, our team members took on other fundraising challenges for Macmillan including Tough Mudder Yorkshire, hiking to Everest Base Camp and descending Europe’s longest zip wire.
The launch of our Christmas menu in November was marked by Snowball Dough Ball Day. This year’s event supported Macmillan, with over 10,000 people donating £1 in exchange for a portion of these seasonal treats.
Our Milano teams had a successful year of fundraising for Enable Ireland, our charity partner in the Republic of Ireland. During Charity Week they held a variety of fundraising activities and continued to support the charity throughout the year, with our Restaurant Managers visiting an Enable Ireland centre in Dublin to see how the money raised was making a difference.
Summer competitionThe year also saw the launch of our Dough Ball Adventures Competition, reaching over 36 million people and aimed at unleashing the creativity of our Piccolo fans. Children visiting our restaurants were asked to submit short adventure stories featuring dough ball characters. We were overwhelmed by the response and the creativity of the stories received—from tales of unicorns and giant ducks, to express trains, cruise ships, rock bands and more!
Building business through a trusted brand

STRATEGIC REPORT
ANNUAL REPORT AND FINANCIAL STATEMENTS 2017 19
‘Gather Round Great Food’At Christmas we encouraged customers to Gather Round Great Food. The campaign celebrated our presence on the British high street as a place for families, friends and colleagues to connect over the busy festive period.
Tapping into the insight that many people lose touch with childhood and adulthood friends, we created an emotional film to connect with our customers. It was viewed more than five million times, generated over 25,000 positive reactions, and received broad coverage in national, local and trade media.
AwardsWe are proud of the work that we do, and it is always rewarding when this is recognised by others. This year we were delighted to receive several awards, including:
• Good Housekeeping Food Awards Favourite High-Street Restaurant• FreeFrom Eating Out Awards Gold Award for Gluten-Free Menu• London Lifestyle Awards PizzaExpress Live inducted into Hall of Fame• PETA Best Vegan Pizza• The Cateys Best Use of Technology: PizzaExpress Facebook Messenger Bot
Supply chainIn the UK & Ireland the Supply Chain team manages over 150 suppliers and 750 products to deliver the brand experience for our guests. As well as seeking the best value, high-quality products, we also continued to ensure that the highest standards are applied to both supplier and product selection, as well as focusing on our corporate and social responsibilities (csr).
Supplier selection We continue to use our online supplier management tool to drive and monitor compliance across our company standards, such as our policies relating to Modern Slavery and Anti Bribery & Corruption amongst others. This year, we updated the tool to ensure additional requirements are met by existing and proposed suppliers.
Product selection We continue to apply our sourcing and nutrition policies across all of our own-label products, such as only allowing free-range eggs, sustainable palm oil and protein from a restricted list of countries of origin in our recipes. We heavily restrict the use of additives in our food and drink and our Piccolo range remains free from all artificial flavours and colourings.
Waste managementOur efforts in waste management saved 7,312 tonnes of co2 in 2017. In restaurants where we control the waste supply chain we now divert 99% (2016: 92%) of food, glass, dry-mixed and general waste away from landfill, through recycling or conversion into alternative fuels. Over 9,800 tonnes of waste was collected, of which 2,650 tonnes was food waste, and our restaurants’ overall recycling rate was 85%.
We work with our distributors to ensure any surplus food goes to charities whenever possible. We denoted the equivalent of 25,000 meals through our key partnership with FareShare, the UK’s largest charity fighting hunger and food waste.
Energy managementWe retrofitted 115 sites, including our bakery, with led lighting. This investment is estimated to reduce co2 emissions by 1,250 tonnes on an annualised basis. The programme will continue in 2018.

STRATEGIC REPORT STRATEGIC REPORT
ANNUAL REPORT AND FINANCIAL STATEMENTS 2017ANNUAL REPORT AND FINANCIAL STATEMENTS 2017 2120
INTERNATIONAL
Charitable workIn China we have partnered with Chi Heng Foundation since 2006, a charitable organisation that supports education, psychological care, medical treatment and career opportunities for children with HIV. In addition to our regular donations, we ran pizza-making parties for children attending the foundation’s summer camps in Shanghai and Guangzhou.
Our csr programme in Hong Kong promotes sustainable living by caring for our community, our team members, our environment and our health. We supported several initiatives, including:
• the Hong Kong Cancer Fund through sales of the Trifolata pizza and two ‘cancer-fighting’ pizzas for October’s breast cancer awareness campaign;
• the Chi Heng Foundation, supporting children affected by aids through sales of our Peking Duck pizza;
• the Child Welfare Scheme, to support underprivileged Nepalese children through the sale of Piccolo menus;
• baking and distributing flatbreads to local food banks for Feeding Hong Kong;
• the fashion charity, Redress, helping to cut waste in the fashion industry through sales of our Quattro Formaggi pizza.
Collectively, we raised hkd 830,000 (£82,707) for these charities, as well as for other worthy causes.
As part of an ongoing community campaign in the UAE, we partnered with the Dubai Foundation for Women and Children (dfwac), a charitable non-profit organisation dedicated to the rehabilitation of victims of domestic violence, abuse or human trafficking. PizzaExpress invited residents of dfwac to create a limited-edition pizza for the new menu. The result was the Melanzane Romana, sales of which supported dfwac. The campaign also helped to raise awareness of dfwac on social media, with 21,000 likes on Facebook and 5,000 followers on Instagram.
MarketingIn China we hosted a vip and media event with Annabel Langbein, a New Zealand celebrity chef. Annabel shared her cooking experiences and introduced the stories of some of our dishes, focusing on the healthy and nutritious ingredients that we use in our menu.
In the UAE we partnered with Done Events, a leading event company that brings international comedians, musicians and other acts to perform in Dubai. We used ‘on-box’ promotion and social media competitions to raise awareness of the events. In return, Done Events distributed leaflets and hosted web banners to drive footfall into our restaurants. We also ran promotional videos on the main stage screens at the event itself. The partnership with Done Events led several other event organisers to arrange events with us, including RedFest DXB, the biggest music event in Dubai.
In Singapore we expanded the reach of our communications by investing in new advertising channels and platforms. We ran two-week campaigns on national English and Chinese-language stations to highlight the launch of our Duo Galleria restaurant in Bugis, a move which also attracted new customers into our existing Scotts Square restaurant.
Across our international Franchise markets we ran ‘Stripes Together’, a multi-market brand campaign, for our partners to build recognition of our iconic black-and-white stripes. A suite of creative materials supported all customer touchpoints, including social media platforms, digital engagements, online to offline promotions and instore promotions.
SustainabilityWe are very conscious of the detrimental impact of plastics on wildlife and the environment, and in the UAE we now provide plastic straws only if our customers request them, and are also trialling drinks served without napkins to further reduce our environmental impact. We have also recently announced that we are phasing out single-use plastic straws from all our restaurants in the UK.

STRATEGIC REPORT
ANNUAL REPORT AND FINANCIAL STATEMENTS 2017 23
UK & IRELANDSimple recipes and listening to the customerWe believe that simplicity, quality and innovation remain the pillars of food and beverage development. We responded to growing consumer demand for dairy-free and vegan products, as well as embracing the familiar and comforting through classic combinations and indulgent flavours. Here are some of the year’s most successful launches.
Zapparoli Romana The Zapparoli Romana became our best-selling limited-edition pizza of the last three years. Tapping into food trends of smoking, charring and pickling, this chicken and sweetcorn pizza elevated a popular yet humble ingredient, sweetcorn, into something really special by introducing a smoked creamed corn base, topped with torn chicken, spicy ‘nduja sausage and mozzarella and finished with parsley and Roquito pearls that add colour and a pickled note.
Vegan Giardiniera Classic With customers’ dietary requirements and expectations regularly evolving, there has been an increase in customers seeking dairy-free and vegan ‘cheese’ options. The challenge for us was to source a product that tasted delicious and would cook well in our pizza ovens.
The answer came in the form of an Italian vegan mozzarella alternative made using brown rice. The ingredient featured on the summer special Vegan Giardiniera alongside artichokes, black olives and mushroom and was so popular it is now a core line.
Lotus Biscoff Cheesecake Dolcetti The Dolcetti category is a special one for PizzaExpress: for customers who are in two minds about having a dessert, the option of something small and sweet served alongside their choice of tea or coffee is an ideal compromise. The Lotus Biscoff Cheesecake—with its crunchy biscuit base, layers of smooth Lotus Biscoff spread and creamy cheesecake, finished with a Lotus Biscoff biscuit—also proved so popular in 2017 that it is now part of our core menu.
Delivering unique customer experiences and value
Lotus Biscoff Cheesecake Dolcetti
Vegan Giardiniera Classic

STRATEGIC REPORT STRATEGIC REPORT
ANNUAL REPORT AND FINANCIAL STATEMENTS 2017ANNUAL REPORT AND FINANCIAL STATEMENTS 2017 2524
TechnologyWe continue to see effective use of technology in both customer-facing and team situations as a key driver of success in the market. In May we completed the implementation of new stock and electronic point-of-sale (epos) solutions. New handheld technology that enables us to process orders at table was positively received by team members and customers. We also completed the rollout of a new customer-facing wi-fi service, Purple Wi-Fi, that provides a better customer experience and also allows us to understand our customers even better.
From a team member perspective, in the latter part of the year we introduced a new labour forecasting and productivity tool. The tool helps managers to set staff rotas more efficiently and optimise staffing levels for busier and quieter periods.
Customer storiesOur ‘blank bills’ initiative creates special moments for our teams and customers alike. Restaurant teams surprise selected customers with a blank bill, meaning that they dine free of charge. In 2017 our restaurant teams gave out over 3,400 blank bills to customers, and we regularly share these customer stories with all our teams.
One blank bill story involved two sisters who were belatedly celebrating a birthday. Lingering after a long lunch and chatting to their waiter, the sisters mentioned that they had recently had some sad personal news but that they were enjoying their lunch out. The assistant manager of the restaurant said, ‘Once I presented them with a blank bill, the ladies began to well up and gave me a huge hug. Not only did I give them the blank bill because of their kindness, but they honestly made me really appreciate my job and realise how fantastic our loyal customers are… it’s times like these I really do love my job more than anything in the world!’
INTERNATIONAL
Menu developmentTo celebrate the Year of the Rooster in Hong Kong, a special set menu with ‘Beyond Chicken Calzone’ was available in January and February. Our spring/summer menu in
April was themed ‘Indulge yourself with our refreshing treats’ with fruit and refreshing elements added to menu. Our autumn/winter menu tapped into the trend for spiced and smoked cheese with our Scamorza e ‘Nduja pizza and introduced healthy options like Beyond Chicken & Kale Pesto.
In October the UAE introduced a signature pizza to cater for Arabic tastes. The Sujuk Reale includes lamb sujuk (a local spicy sausage), pomegranate molasses, sumak, garlic and pine nuts. Marketed as a ‘Royal Pizza’, the new product is popular not only
with locals but Western expats, who enjoy this Arabic twist on their traditional pizza.
In Singapore we launched several successful new pizzas, including Parma e Rucola, Chilli Crab and Laksa, as well as the Linguine Granchio pasta. Many of these are now amongst our customers’ favourites, whilst the Calabrese and Carbonara pizzas remain our bestsellers.
Additionally, our new menu in April focused on improving our pasta offering, with the addition of a fresh pasta range. In November we added some lighter starters and desserts, and some new Romana pizzas. We also trialled a brunch menu as we seek to drive weekend traffic.
TechnologyIn China the use of digital technology is critical to success as consumers increasingly use mobile phones for many aspects of their daily lives. One way in which we seek to remain relevant is by the introduction of Alipay, the world’s leading third-party online payment solution, to all our restaurants in the final quarter.
A great example of leveraging our expertise across the Group was the implementation of a new epos system in Hong Kong and Singapore, drawing on the skills of local teams and Group IT in the UK. It is now live in all four restaurants in Singapore and two in Hong Kong, with the remainder to follow in 2018.
Beyond Chicken Calzone

STRATEGIC REPORT
ANNUAL REPORT AND FINANCIAL STATEMENTS 2017 27
MarketingIn China we hosted a live ‘stripe party’ with a local vlogger at our Beijing Sanlitun store, to encourage new and regular customers to visit the restaurant. Customers attending the event enjoyed a discount on our menu and learned more about our brand. We streamed the event live on social media, reaching more than 300,000 viewers.
In Hong Kong we ran a ‘Stripes Together’ campaign that promoted PizzaExpress as a great place for families and friends to meet. As part of the promotion, over 5,000 #StripesTogether e-coupons were redeemed. This brand campaign also served as the beginning of more multi-market initiatives to strengthen brand equity and momentum regionally for expansion into new markets.
Customer storiesIn China we receive frequent feedback from satisfied customers. One such came from a German customer who visited our restaurant in the King Glory shopping centre. She said, ‘Not speaking Chinese, I had to rely on others to speak in English. I was pleasantly taken by the professional way in which the junior store manager informed me about the menu. The waiters also practised their English with me. It was a very enjoyable afternoon and I feel sorry that we do not have a similar restaurant in Germany. I am looking forward to my next trip to Shenzhen even more because I know which restaurant I will visit first. Compliments to your staff’.
In Singapore our ‘surprise and delight’ campaign continues to drive customer engagement. For example, in October we received positive feedback from a guest who dined at our Duo Galleria restaurant. The loyal PizzaExpress customer had moved from London to Singapore and was excited to see we had opened in Duo Galleria. Hoping to satisfy her craving, she was happy to wait in the busy restaurant when the manager was unable to seat her immediately. The manager suggested that the customer might prefer to go shopping and await a call from him, rather than wait outside on a hot day. After just 20 minutes he duly called, and when the customer arrived he presented her with a fresh portion of dough balls on the house. She was amazed at the experience and is now a regular at the restaurant.
Duo Galleria, Singapore

STRATEGIC REPORT
ANNUAL REPORT AND FINANCIAL STATEMENTS 2017 29
UK & IRELANDNew openingsWe opened 12 new company-owned restaurants in 2017. Each is individually designed and seeks to maximise the original character of the building where possible, often inspired by well-known local people or historical events. Here are some examples.
Gloucester Road The design of this restaurant in the heart of Kensington was inspired by the Georgian building’s past as a bank. The spacious interior incorporates several bespoke, eye-catching design features including a central kitchen/pizzaiola space with white marble worktops incorporating brass mesh panels. The kitchen’s white gloss tiles are laid in a brick-bond pattern inspired by the tiling in the bank vaults.
Freestanding settles and banquettes are upholstered in a rich tan leather and finished with deeply set brass buttons. High-quality oak parquet flooring features throughout the seating area with a decorative lighting scheme made from a rich palette of materials including brushed brass, timber beading and brushed nickel. The artwork also draws on the building’s banking origins, with framed illustrations that evoke the patterns of bank notes. Elsewhere, there are pictures of fossils, rocks, minerals and botanicals inspired by the nearby Natural History Museum.
Bracknell The restaurant’s warm, relaxing feel is inspired by nearby Swinley forest. Finishes include reclaimed timber panelling and natural oak flooring. The timber complements boldly patterned tiling on the floor and bars, and elsewhere, leafy artwork reflects plant species from the forest. To the rear of the restaurant, the Pizzaiola counter is a stand-out feature, thanks to its yellow ceiling, colourful wall tiles and birch ply counter in abstract tree patterns. Booth seats and banquettes are upholstered in tan fabric. Privacy comes from screens strewn with artificial ivy. A ceiling feature with subtle lighting creates the impression of a tree spreading from the middle of the restaurant.
Rushden Lakes This Northamptonshire restaurant takes its cues from a fantastic lakeside location. The fresh, colourful interior includes a mint-green ceiling that lends a bright and airy feeling. This contrasts with warm corals and natural oak finishes. Slatted timber ceiling rafts stretch across the shopfront, and a copper valance frames the kitchen. An inviting external area that runs the length of the restaurant allows diners to enjoy warmer days and an uninterrupted view of the activities on the lake.
The side walls feature eye-catching, full-height wallpapers designed to capture the attention of passers-by. Colourful, graphic images, with vintage engravings of freshwater fish and wildlife, celebrate the wetland habitat.
Driving sustainable growth
Bracknell
Gloucester Road

STRATEGIC REPORT
ANNUAL REPORT AND FINANCIAL STATEMENTS 2017 31
RefurbishmentsIn addition to opening beautifully designed new restaurants, we regularly refresh and refurbish existing sites under our refurbishments programme. In 2017 we undertook 25 such projects, ranging from a light ‘sparkle’ to a complete overhaul of the site.
River House, York The stunning Grade II listed building on the banks of the River Ouse was once a gentleman’s club, and the building’s heritage inspired its respectful yet exciting transformation. The concept uses colour, comfort, luxury and style to create a bold but relaxing dining environment.
The interior was zoned to create separate rooms, each with an individual style—from a cosy lobby and bar area, to impressive formal dining rooms, and a casual pantry kitchen. Vibrant upholstery, striking artwork and a leather-clad greeting counter create a real sense of occasion.
Timber floors were reinstated and a rich colour palette makes the double-height rooms feel comfortable and inviting. Warm leathers and velvets bring a lounge feel to the furniture. Floor and table lamps and large feature pendants cast a warm glow and ensure a relaxed transition from day to evening dining.
Sheffield Meadowhall This transformation was inspired by Sheffield’s renowned steel industry, and subtle steel touches feature throughout. The facade has been opened to remove the boundary between the inside and outside, and creates an inviting and welcoming first impression to customers.
Festoon lighting and blackened steel planters define the attractive external seating area, whilst timber strip panelling runs along the internal curving walls with sections of brick slips above banquettes. The cool tones of the steel are offset with warm Jacobean stained timber and soft, earthy toned fabrics.
The Pizzaiola front includes steel panelling, and a steel artwork rail supports works that celebrate the city’s rich history and the international reputation for craftsmanship and innovation signified by the words ‘Made in Sheffield’.
Sheffield Meadowhall

STRATEGIC REPORT
ANNUAL REPORT AND FINANCIAL STATEMENTS 2017 33
PizzaExpress LivePizzaExpress Live brings live music and entertainment to guests in a PizzaExpress setting. We have five ticketed venues—Dean Street, The Pheasantry and High Holborn in London, as well as Maidstone and Birmingham—that host around 1,500 ticketed shows a year. We also have over 30 ‘Live Playlist’ restaurants that host more than 1,500 free music events a year.
Our latest venue, in the basement of our refurbished High Holborn restaurant, opened in August. The concept will inform the rest of the estate as we look to roll out PizzaExpress Live across more venues in the future.
RetailThe PizzaExpress grocery range is one of the UK’s hundred biggest retail brands (source: The Grocer, March 2017) thanks to sales of our chilled pizza, bread, pasta, and dressing ranges in Tesco, Sainsbury’s, Waitrose, asda, Morrisons and Co-op, and our frozen range, available exclusively at Iceland.
In 2017 we launched a retail version of our lighter, healthier Leggera, with three single-serving options launched nationally in Waitrose. We also extended availability of the entire range, with the launch of four Classic pizzas in 125 asda stores, new Romana listings in Tesco, and gluten-free options in Waitrose and Sainsbury’s.
For the first time, we simultaneously launched pizzas in our restaurants and in supermarkets. We launched two seasonal special pizzas—the Zapparoli Romana and Campana Romana—in this way, supported by cross-channel marketing initiatives.
We were delighted to receive several awards, including a Penta award for our packaging and The Grocer dessert product of the year for our Tiramisu Gelato.
PizzaExpress Live, High Holborn, London
Campana Romana

STRATEGIC REPORT STRATEGIC REPORT
ANNUAL REPORT AND FINANCIAL STATEMENTS 2017ANNUAL REPORT AND FINANCIAL STATEMENTS 2017 3534
INTERNATIONAL
New openingsIn China, we opened 17 new restaurants during the year. The new openings included growth in cities where we already operate more than one restaurant, with seven openings in Shanghai and one each in Shenzhen, Guangzhou and Wuhan. In addition, we opened our second and third sites in Nanjing, the capital of Jiangsu Province in Eastern China and the region’s largest city.
We also further expanded our footprint with first sites in new locations, opening two restaurants in Suzhou and three in Hangzhou.
In Hong Kong we opened four restaurants, starting with Empire Centre in May. It is in East Tsim Sha Tsui, close to local transport links, several major hotels and shopping centres. Visitors can also enjoy the famous Victoria Harbour view from the restaurant.
Discovery Bay opened in June, within a mixed-used development on Lantau Island. The development offers upmarket residential accommodation and recreational facilities including a private beach, a golf course, a marina club and a public park.
Park Central opened in November, in the densely populated Tseung Kwan O district. The estate provides over 4,000 residential units and a shopping mall with more than a hundred retailers and restaurants.
Maritime Square opened in December. The restaurant is opposite a large cinema in this new shopping mall in Tsing Yi, a residential area with more than 200,000 residents.
We opened three new restaurants in the UAE: Al Hamra, Al Reem and Ajman City Centre. In February, we opened a 238-cover restaurant in Al Hamra, within one of the largest malls in Ras al-Khaimah, a growing emirate that is popular for staycations and holidays. As with our Fujairah site, the restaurant is designed with Arabic culture in mind: there are large family seating areas that allow privacy, and dark woods and tones tailored to local preferences.
In April, we opened a 128-cover restaurant on Al Reem Island, a populous area near Abu Dhabi. Once development finishes the area will house many expats. The design, inspired by Paddington in the UK, creates an exciting environment that appeals to the younger expat population.
In December, we opened a 182-cover restaurant in Ajman City Centre, in a premium position at the entrance to the largest shopping mall in the emirate of Ajman. This was our first opening in the emirate and increases our business presence to five emirates.
We also transformed our ‘Jazz@PizzaExpress’ concept in Jumeirah Lakes Towers to create a modern, cool and contemporary jazz lounge.
We opened three new restaurants in Singapore: Duo Galleria, Holland Village and Marina One. Duo Galleria opened in August on a busy intersection near the bustling Haji Lane in Bugis, within a new collaborative development by the governments of Malaysia and Singapore.
Holland Village opened in November, located in a thriving expat residential area, with a successful bar scene and community retail malls and Marina One opened in December. This restaurant is in a
multipurpose development in the heart of the Marina Bay Financial Centre, with offices now occupied by major blue-chip tenants.
Our Franchise partners opened seven restaurants in 2017 through four openings in Indonesia and three in India.
Indonesia remains our largest Franchise market, with 17 sites in Jakarta at the end of 2017. In India, we launched three new ‘by PizzaExpress’ concept stores, to target different neighbourhood markets, and now operate eight sites in Mumbai and three in Delhi.
Holland Village, Singapore
Al Hamra, UAE
Discovery Bay, Hong Kong

STRATEGIC REPORT STRATEGIC REPORT
ANNUAL REPORT AND FINANCIAL STATEMENTS 2017ANNUAL REPORT AND FINANCIAL STATEMENTS 2017 3736
Key performance indicatorsThe senior management teams of each business unit review detailed weekly and monthly information on performance that covers a wide range of financial and non-financial measures to assist them in driving performance and monitoring progress against key targets.
The financial and non-financial KPIs that are used to monitor the business are set out below†.
Statutory 52-week period ended
31 December 2017
Prior year statutory 79-week
period ended 1 January 2017
Group Turnover from continuing operations £534.2m £760.8m
Group ebitda* from continuing operations £94.6m £158.7m
Group ebitda* margin 17.7% 20.9%
Number of restaurants (Group) 607 572
Statutory 52-week period ended
31 December 2017
Pro forma 52-week period
ended 1 January 2017 VarianceGroup Turnover from continuing operations £534.2m £502.8m +6.3%
Group lfl* sales growth 1.4% n/a n/a
International lfl* sales growth 8.2% n/a n/a
UK & Ireland lfl* sales growth 0.4% (0.9)% +1.5ppts
Group ebitda* from continuing operations £94.6m £103.9m (8.9)%
Group ebitda* margin 17.7% 20.7% (300)bps
Number of restaurants (Group) 607 572 35
Statutory period ‘Statutory 52-week period ended 31 December 2017’ refers to the audited 52-week period ended 31 December 2017 and ‘Prior year statutory 79-week period ended 1 January 2017’ refers to the audited 79-week period ended 1 January 2017.
Pro forma period ‘Pro forma 52-week period ended 1 January 2017’ refers to the unaudited results for the 52 weeks ended 1 January 2017 showing continuing operations.
* Non-statutory reporting measures:
Like-for-like sales Like-for-like (lfl) sales growth is defined as sales from wholly-owned restaurants that have traded for a full financial year (being a pro forma year where a financial year is of a non-standard duration) at the start of each financial year. Sites that are closed or disposed during a financial year are excluded from the lfl calculation from the point at which the restaurant closes. Growth is measured by reference to the sales generated from lfl restaurants in the same period in the prior financial year.
Group ebitda Group ebitda is a non-statutory measure and is calculated as the result for the period excluding taxation, interest, depreciation and amortisation and before deducting share-based payment charges, exceptional items and profit/loss on disposal of fixed assets. Please also see Group ebitda reconciliation on page 38.
† Values shown at actual fx rates
Statutory basis (52 weeks vs 79 weeks)On a statutory basis, the Group achieved turnover from continuing operations of £534.2m. The decline in turnover compared with the previous statutory period largely arises from the additional 27 trading weeks in the prior period.
Total operating profit from continuing operations was £60.6m (period ended 1 January 2017: £114.5m) a decrease of 47.1%, with margins down by 371bps as a result of both the higher proportion of turnover from immature International markets and cost headwinds in the UK. Net interest charges of £89.3m (period ended 1 January 2017: £129.5m) resulted in a loss before tax of £28.7m (period ended 1 January 2017: loss of £15.0m).
The Firezza delivery business was disposed of on 5 November 2017 and these operations have been classified as discontinued in the accounts. In the period up to the date of disposal, the business generated turnover of £7.1m (period ended 1 January 2017: £7.0m) and a loss before tax of £2.8m (period ended 1 January 2017: loss of £2.1m). Further information is set out in note 25.
Net cash inflow from operating activities was £35.6m (period ended 1 January 2017: £77.1m), after payments of interest on the Group’s Senior Secured and Senior Notes of £48.3m (period ended 1 January 2017: £72.5m). Net cash outflows from investing activities totalled a further £44.5m (period ended 1 January 2017: £76.3m), of which £43.0m (period ended 1 January 2017: £62.6m) related to the purchase of property, plant and equipment.
As at 31 December 2017 the Group’s total debt stood at £1,077.4m (period ended 1 January 2017: £1,036.4m), comprising external Senior and Senior Secured notes of £652.8m (period ended 1 January 2017: £650.3m) and a loan from parent of £424.6m (period ended 1 January 2017: £386.1m). Cash was £42.6m (period ended 1 January 2017: £52.0m). Net external debt was therefore £610.2m (period ended 1 January 2017: £598.3m).
The Senior Secured Notes are due for repayment in August 2021 and the Senior Notes are due for repayment in August 2022. The loan from parent is due for repayment in August 2024. Further details on the Group’s borrowings and financial risk management are set out in notes 18 and 21 respectively.
Pro forma basisOn a comparable 52-week basis (pro forma period ended 1 January 2017), the Group achieved turnover growth of 6.3% as a result of both organic growth and new restaurant openings with our International segment delivering very strong growth due to the significant increase in the restaurant estate.
UK like-for-like sales growth remained subdued in the period. The dining out market in the UK continued to feel the impact of significant outlet growth, putting pressure on same store sales. In this context, full-year growth of 0.4% in the period represents a solid result (pro forma period ended 1 January 2017: (0.9)%). We continue to focus on operational improvements in both the dine-in and delivery channels, with operational improvements in the delivery channel starting to bear fruit particularly in the latter part of the year, increasing average weekly sales.
The Group’s simple operating model enables it to deliver a strong return on sales. The profitability of the International segment continues to grow as the business gains scale, however the absolute margin level remains below that of the more mature UK market. Consequently, the increasing proportion of Group sales from the lower-margin International markets has a downward impact on the overall Group margin.

STRATEGIC REPORT STRATEGIC REPORT
ANNUAL REPORT AND FINANCIAL STATEMENTS 2017ANNUAL REPORT AND FINANCIAL STATEMENTS 2017 3938
Further, the well-publicised cost headwinds in the UK business such as food cost inflation, increases in National Minimum Wage and National Living Wage as well as material rises in Business Rates and persistently high commercial rents have had an impact on the level of profitability achieved in the UK & Ireland segment, despite measures taken to mitigate these factors. The impact on the key indicator of profitability, ebitda, was a reduction in both absolute terms, declining from £103.9m in 2016 to £94.6m with ebitda margin declining 300bps.
Of the 48 new restaurants opened in the year, our International equity markets opened 27 sites with a further seven opened by our International franchise partners. In the UK, we opened 13 company-owned restaurants. In addition to this, the first UK franchise site was opened by our partner Welcome Break in December 2017. Net of closures, 35 sites were opened in 2017.
The sale of the Firezza delivery business included the disposal of 22 sites. The results of the Firezza business are shown under discontinued operations and the disposed sites have been excluded from the KPIs shown here.
Reporting period reconciliation
Unaudited 27-week period
Jun–Dec 2015
Pro forma 52-week period
Jan–Dec 2016
Statutory 79-week period ended
1 January 2017Group Turnover from continuing operations £258.0m £502.8m £760.8m
Group ebitda* from continuing operations £54.8m £103.9m £158.7m
Group ebitda* margin % 21.2% 20.7% 20.9%
Number of restaurants (Group) 549 572 572
Group ebitda* reconciliationStatutory 52-week period ended 31 December 2017
Statutory 79-week period ended 1 January 2017
Loss for the period from continuing (31.6) (4.8)
Add: taxation 2.9 (10.2)
Add: net interest 89.3 129.5
Add: exceptional items 4.4 3.2
Add: depreciation and amortisation 28.6 38.3
Add: loss on disposal of fixed assets 1.0 2.4
Add: share based payment charge 0.0 0.3
Group ebitda* 94.6 158.7
* Non-statutory reporting measures—see page 36 for definitions
Tax strategyAs the largest casual dining operator in the UK and with an increasing presence internationally, the protection of our reputation and brand values is vitally important. Accordingly, our objective is to maintain a reputation as a responsible taxpayer, founded on open relationships with the tax authorities with which the Group’s entities interact. The Group has a Board approved Tax Charter setting out this approach and this has been shared with hmrc.
The Group ensures its tax teams are provided with sufficient training and support to be able to carry out and monitor these policies and procedures in practice. Thus, the Group is able to ensure that the correct amount of tax is paid to the correct authority in the required timeframe and all necessary information is submitted with the Group’s tax returns.
Continued improvement of management controls and protection from tax risks is sought by evaluating the efficiency of measures undertaken to ensure early identification and assessment of any potential risks. These procedures are aligned with the tax strategy ultimately agreed by the Group’s Board.
Day-to-day management of tax controls in the UK lies with the Tax Manager, with supervision from the finance team and business unit specialists within finance operations. Any developments or issues in the compliance processes or identified risks are regularly communicated and escalated appropriately to the Group’s cfo. The cfo reports to the Board on a regular basis on key tax risks arising and on the nature of tax governance procedures. Ownership of the tax strategy, along with the wider business strategy, rests with the Group’s Board.
Attitude of Group towards Tax Planning As part of the wider considerations when structuring commercial activities, the Group will also consider the tax laws of countries within which we operate. We will not undertake planning that is contrived or artificial and will ensure any planning has regard to the potential impact on our reputation and broader goals.
We will engage tax advisers to provide specialist expertise when tax law is opaque or new legislation is enacted in order to provide support to any positions we take on potentially ambiguous or complex taxation matters and to provide us with insight on industry practice.
Level of risk in relation to UK taxation that the Group is willing to accept The tax risk appetite of the Group is set at Board level in the context of the wider business strategy, taking into account financial, reputational and operational aspects. The Group aims to identify, assess and monitor risks as they arise. In particular, the Tax Manager takes responsibility for ensuring that changes in compliance requirements are adhered to, all processes with regard to tax are managed effectively and amicable relationships with tax authorities are maintained and are transparent.
The Group wishes to reinforce its integrity and tax transparency by ensuring that risks in relation to legislative and compliance obligations are considered and acted upon in a timely manner in order to keep risk exposure within the accepted levels which are set by the Board.
Approach of Group towards its dealings with hmrc The Group engages with tax authorities in the spirit of honesty and cooperative compliance. The Group seeks to ensure that measures are taken to minimise risk by ensuring early dispute resolution. However, if agreement cannot be met through transparent discussion with hmrc, and although this has not been applicable to date, the Group would seek to resolve such matters through more formal channels.
In order to limit tax-related uncertainty the Group will seek, and has sought in the past, to reach formal agreement in advance in relation to significant transactions as far as commercially practicable and will use external advisors to assist with uncertain tax positions as required.
operations

STRATEGIC REPORT
ANNUAL REPORT AND FINANCIAL STATEMENTS 2017 41
Our core offering of delicious pizza served in a great environment with excellent customer service has served us incredibly well for the last 53 years. We continue to be focused on delivering pizza leadership in the markets in which we operate.
However we also recognise the need to innovate, be that in format, range or location. As a result we are continually developing new ways to reach new guests and occasions. Below is a small selection of the new areas for growth that we entered in 2017 across our UK & Ireland and International business segments.
Welcome Break Oxford ServicesIn December we opened our first franchised restaurant in the UK for over 20 years with Welcome Break, one of the UK’s leading independent motorway service operators. The restaurant is supported by the PizzaExpress business, using the same supply chain and offering the familiar menu. We trained the Welcome Break restaurant team in our own restaurants as we would a normal opening. Welcome Break’s 27 UK sites attract 85 million motorway customers each year, and we are exploring plans to open at additional locations.
PizzaExpress BoxedPizzaExpress Boxed brings our brand to summer festivals, selling restaurant-quality pizzas from converted, custom-fitted shipping containers. In 2017 our Boxed containers visited seven festivals, reaching a range of target audiences.
We promoted Boxed through online competitions that offered the chance to win festival tickets. This activity increased online engagement through our owned and shared communication channels.
PizzaExpress Boxed was well received at all events and we are considering how we might expand the concept in 2018.
FranchisesThe search for new franchisees was a key focus in 2017 and the contract for the Philippines territory was signed in December with the Manila-based Tasteless Food Group.
This Strategic Report was approved by the Board on 30 April 2018.
On behalf of the Board
Andy PellingtonDirector
Exploring new revenue growth channels and new concepts
PizzaExpress Boxed
Welcome Break Oxford Services

ANNUAL REPORT AND FINANCIAL STATEMENTS 2017 43
The Directors present their report and audited consolidated financial statements for the Group for the period ended 31 December 2017.
DirectorsThe Directors of the Company during the period to the date of approving this report were:
Jinlong Wang is the Group Chairman and CEO, having joined PizzaExpress Group as Chairman in June 2015. Jinlong also served as PizzaExpress China interim ceo from April 2016 to May 2017.
Jinlong has almost 30 years of experience in leadership, global business development, consumer branding, general management, and retail and restaurant chain operation.
Jinlong previously worked for Starbucks, where he served as Chairman and President of Starbucks Greater China. In this role he led the growth of the business in China, playing a critical role in creating a coffee culture in a tea-drinking nation and establishing China as the second home market for Starbucks outside US.
Jinlong currently serves on the board of Sonova Holding ag, and chairman of PizzaExpress Group Holding Limited. Jinlong received his bachelor’s degree in international economics and trade from the University of International Economics and Trade in Beijing in January 1982 and his Juris Doctor from Columbia University School of Law in May 1988.
Andy Pellington is the Group cfo having joined the company in March 2014 just prior to the acquisition of the Group by Hony Capital. Alongside his responsibilities as Group cfo he also leads our international equity and franchise businesses outside of China and our commercial operations within the UK.
He has extensive experience across all areas of the leisure and hospitality sector having served as a director of hotel, restaurant, pub and health club businesses including finance director roles at Whitbread and David Lloyd Leisure; this experience has been gained within both ftse 100 and private equity backed businesses.
He has successfully led a number of business transformation projects and undertaken a range of M&A activity as well as having broad general management experience of leading a broad range of functions. Andy holds an economics degree from Birmingham University and is a qualified accountant.
Directors’ report

ANNUAL REPORT AND FINANCIAL STATEMENTS 2017ANNUAL REPORT AND FINANCIAL STATEMENTS 2017 4544
DIRECTORS’ REPORT DIRECTORS’ REPORT
Jianzhong Gong has been a director since February 2015. Mr Gong graduated from Dongbei University of Finance and Economics. He currently serves as the chief executive officer at Bank of China Group Investment Limited. With about 30 years’ experience in banking and investment, Mr Gong has participated or taken a leadership role in numerous domestic and overseas investment projects.
Mingju Ma has been a director since March 2015. Mr Ma has served as vice president of Jin Jiang International Holdings Co., Ltd since 2005, as general manager of the finance business division of Jin Jiang International, chairman of Shanghai Jin Jiang International Investment and Management Company Limited as well as director of Jin Jiang Investment. Mr Ma holds a master’s degree in business administration from the Asia International Open University (Macau) and is a senior accountant.
Bing Yuan has been a non-executive director since 2011, and is primarily responsible for providing strategic advice and guidance on the business and operations of the Hony Group. Mr Yuan has more than 15 years of experience in the investment banking industry and has extensive knowledge in corporate financing, listings and mergers and acquisitions transactions. Mr Yuan joined Hony Capital in April 2009 and has served as managing director of the investment department of its Hong Kong office since January 2010. Mr Yuan has been a non-executive director of Haichang Holdings Ltd since August 2012, whose shares are listed on the Main Board of the Stock Exchange (stock code: 2255). Prior to joining Hony Capital, Mr Yuan served as managing director of the direct investment department of Morgan Stanley Asia Limited from October 2006 to 2009. Before that, Mr Yuan served as managing director of the prc enterprises corporate financing department of Morgan Stanley Asia Limited from April 2004 to June 2006. Mr Yuan also served as the vice president of Credit Suisse First Boston (Hong Kong) Limited from September 2001 to March 2004. Mr Yuan received a bachelor of arts degree in English from Nanjing University in 1990. He also obtained a master’s degree in International Relations in 1993 and a juris doctorate’s degree in 1998 from Yale University.
Xiaoxin Shao has been a director since 5 May 2016. Ms Shao has served as an investment director of Hony Capital since 2010, where she was responsible for cross-border investment activities. Prior to joining Hony Capital, Ms Shao served at Morgan Stanley Asia Limited from 2006 to 2010, mainly involved in Greater China financing and M&A activities. Ms Shao holds a master’s degree in Electronic Engineering from Tsinghua University.
Richard Hodgson resigned as a director on 30 May 2017.
Hony CapitalCrystal Bright Developments Limited, a company registered in the British Virgin Islands, is the ultimate parent company of the Group, and private equity firm Hony Capital is the ultimate controlling party.
Hony Capital, founded in 2003 and sponsored by Legend Holdings Corporation, specialises in private equity investment. As a ‘China expert’ and company builder, it focuses on the Chinese market with ‘value creation by providing value-added services’ as its investment philosophy.
Hony Capital currently manages eight private equity funds, two mezzanine funds and two real estate funds with more than rmb 70 billion of assets under management. The investors of Hony Capital include Legend Holdings, the National Social Security Fund, China Life Insurance and leading investment institutions such as Goldman Sachs, Temasek, and Canada Pension Plan Investment Board. The combination of domestic and international high-quality resources enhances the ability of Hony Capital.
DividendsThe Directors do not recommend the payment of a dividend (period ended 1 January 2017: £nil).
Political donationsThe Group did not make any political donations during the period (period ended 1 January 2017: £nil).
Charitable donationsDetails of the Group’s charitable donations for the period are included in the Strategic report.
Principal risks and uncertaintiesThe Board of Directors (‘the Board’) has the primary responsibility for identifying the principal risks which the business faces and for developing appropriate policies to manage those risks.
The principal risks that the business faces are considered as:
Competition The casual dining market continues to be highly competitive with a focus on consumers expecting value for money. The Board closely analyses current market trends and adjusts the strategy of the Group as appropriate, for example through new partnerships. Where appropriate the Group also looks to diversify the risk associated with competition by exploring new concepts that are consistent with the Group’s current offering.
Brand strength A key element of being able to compete in the market is our brand strength and customer perception. Invitations on receipts invite all customers to take part in our ‘How Did We Dough?’ customer satisfaction survey. The results from the survey are regularly presented to the Board in order to inform strategic priorities.
We strive to maintain our restaurants to the highest standard. This is achieved through our transformation programme which aims to deliver restaurant refurbishments on a regular cycle.
Foreign exchange rates The Group is exposed to movements in exchange rates through subsidiaries operating in a currency other than the Group’s functional currency of gbp. The translation risk arising from this introduces an element of volatility to the Group’s profit. This risk is partly mitigated by the range of currencies that subsidiaries within the Group operate in.
The Group is also exposed to movements in exchange rates through subsidiaries making purchases denominated in a currency other than their functional currency, the key risk being purchases made in Euros by Sterling-dominated entities and vice versa. To mitigate against this risk, cash generated in foreign currencies is matched with payments made in the same currency where possible. Additionally, where possible, foreign exchange rates included within supplier contracts are fixed.
Where a large payment is expected in a currency other than a subsidiary’s functional currency, the foreign exchange risk is managed through the use of hedging instruments.

ANNUAL REPORT AND FINANCIAL STATEMENTS 2017ANNUAL REPORT AND FINANCIAL STATEMENTS 2017 4746
DIRECTORS’ REPORT DIRECTORS’ REPORT
We have a diverse workforce and an equal opportunities policy in place. We aim to employ people who reflect the diverse nature of society and value people and their contribution irrespective of age, sex, disability, sexual orientation, race, colour, religion, marital status or ethnic origin.
Future developmentsDetails of the Group’s future developments are included within the Strategic Report on page 41.
Going concernThe Directors note that as at 31 December 2017, the Group is in a net liabilities position of £57,921,000 (as at 1 January 2017: £15,547,000) and a net current liabilities position of £23,138,000 (as at 1 January 2017: £15,281,000). The Directors note that the first repayments of the Group’s borrowings of £1,077,417,000 (period ended 1 January 2017: £1,036,400,000) are not due until August 2021. In addition, the cash flow forecasts of the Group are closely monitored on a regular basis to ensure that the Group has sufficient cash to meet its liabilities as they fall due. In preparing these consolidated financial statements the Directors have reviewed these cash flow forecasts for the following 12 months from the date of approval of these financial statements and consider that these appropriately demonstrate the ability of the Group to meet its obligations for the foreseeable future including the ability of the Group to use its currently undrawn Revolving Credit Facility of £20,000,000. This facility is readily available until July 2020. Board-approved budgets are prepared on a rolling basis covering a five-year period and in making their assessment of going concern, the Directors have taken into account the most recently approved Five Year Plan as well as reviewing an appropriate sensitivity analysis thereon, which demonstrate that the Group is able to operate as a going concern. The Directors regularly review the risks facing the business and, where appropriate, adjust the strategy of the business accordingly. The Directors consider that the Group is well placed to mitigate the risks that it faces. As such, these financial statements have been prepared on a going concern basis.
Qualifying third party indemnityQualifying third party indemnity provisions as defined by the Companies Act 2006 were in force for the benefit of Directors throughout the period and up to the date of approval of the financial statements.
Operating cost rises Continued rises in certain key operating costs are monitored carefully by the Board and appropriate action taken to mitigate these factors, which can include operational efficiency measures and investment in technology.
Brexit The vote to exit the eu in June 2016 has brought uncertainty to the UK economy. Although the formal date of departure for the UK is now known as 29 March 2019, the full impact of Brexit remains uncertain. However the impact on the Group to date has been through the resulting movement in foreign exchange rates and the potential impact on workforce availability. The Group also makes a proportion of its purchases from eu countries, although this is considered immaterial relative to the total value of the Group’s purchases.
The Board has assessed the potential impact that Brexit could have on the business and the key risk is considered to be employee recruitment and retention, due to the number of employees from the eu working in the UK. The Board will continue to closely monitor this risk as the impact of Brexit becomes clearer.
Employee retention In addition to the risk arising from the Brexit vote, there is an ongoing risk to employee retention. As in the whole sector, staff turnover continues to be a challenge for the Group as the labour market becomes increasingly competitive. Our employees are key to the success of our business through excellent customer service and therefore we must be able to retain the highest calibre of employees.
This risk is mitigated through continual review of reward structures to ensure that these are competitive relative to our industry counterparts, in addition to the provision of comprehensive training and development programmes.
Financial risk managementSee note 21 on page 87 for details of the Group’s financial risk management.
Research and developmentThe Group did not incur any research and development expenditure during the period.
Anti-bribery and corruption policyThe Group operates an anti-bribery and corruption policy in accordance with the Bribery Act 2010, which is accessible at http://corporate.pizzaexpress.com. This sets out PizzaExpress’s commitment to maintaining the highest standards of ethics and ensuring compliance with all legal and regulatory requirements for preventing bribery and corruption.
Employment policy and equalityServing millions of meals to customers a year, our people truly are our greatest asset and we believe in treating them as such: with respect, looking after their welfare and allowing them the freedom to be themselves and to flourish.
We encourage a work environment that is fair, open and communicative, with many benefits for our employees. Our employees have a performance review at least once a year, which includes consideration of skills development and career prospects. We aim to retain, develop and promote our best staff, offering a variety of training courses and development opportunities.
Informal, frank and open dialogue is encouraged at all levels of the Group. We aim to keep our employees informed of any changes and progress with the business on a regular basis in an engaging way.

ANNUAL REPORT AND FINANCIAL STATEMENTS 2017ANNUAL REPORT AND FINANCIAL STATEMENTS 2017 4948
DIRECTORS’ REPORT DIRECTORS’ REPORT
Statement of Directors’ responsibilitiesThe Directors are responsible for preparing the Annual Report and the financial statements in accordance with applicable law and regulation.
Company law requires the Directors to prepare financial statements for each financial period. Under that law the Directors have prepared the Group financial statements in accordance with International Financial Reporting Standards (ifrs) as adopted by the European Union and company financial statements in accordance with United Kingdom Generally Accepted Accounting Practice (United Kingdom Accounting Standards, comprising frs 101 ‘Reduced Disclosure Framework’, and applicable law). Under company law the Directors must not approve the financial statements unless they are satisfied that they give a true and fair view of the state of affairs of the Group and Company and of the profit or loss of the Group and Company for that period. In preparing the financial statements, the Directors are required to:
• select suitable accounting policies and then apply them consistently;
• state whether applicable ifrs as adopted by the European Union have been followed for the Group financial statements and United Kingdom Accounting Standards, comprising frs 101, have been followed for the Company financial statements, subject to any material departures disclosed and explained in the financial statements;
• make judgements and accounting estimates that are reasonable and prudent; and
• prepare the financial statements on the going concern basis unless it is inappropriate to presume that the Group and Company will continue in business.
The Directors are responsible for keeping adequate accounting records that are sufficient to show and explain the Group and Company’s transactions and disclose with reasonable accuracy at any time the financial position of the Group and Company and enable them to ensure that the financial statements comply with the Companies Act 2006 and, as regards the Group financial statements, Article 4 of the ias Regulation.
The Directors are also responsible for safeguarding the assets of the Group and Company and hence for taking reasonable steps for the prevention and detection of fraud and other irregularities.
The Directors are responsible for the maintenance and integrity of the Company’s website. Legislation in the United Kingdom governing the preparation and dissemination of financial statements may differ from legislation in other jurisdictions.
Disclosure of information to auditorsIn the case of each Director in office at the date the Directors’ Report is approved:
• so far as the Director is aware, there is no relevant audit information of which the Group and Company’s auditors are unaware; and
• they have taken all the steps that they ought to have taken as a Director in order to make themselves aware of any relevant audit information and to establish that the Group and Company’s auditors are aware of that information.
Post balance sheet eventsThere are no post balance sheet events to disclose.
Independent auditorsThe independent auditors, PricewaterhouseCoopers llp have indicated their willingness to continue in office, and a resolution that they will be reappointed will be proposed at the annual general meeting.
This Directors’ report was approved by the Board on 30 April 2018.
On behalf of the Board
Andy PellingtonDirector

ANNUAL REPORT AND FINANCIAL STATEMENTS 2017ANNUAL REPORT AND FINANCIAL STATEMENTS 2017 5150
INDEPENDENT AUDITORS’ REPORT INDEPENDENT AUDITORS’ REPORT
Report on the audit of the financial statements
OPINIONIn our opinion:
• PizzaExpress Group Holdings Limited’s consolidated financial statements (‘Group’) and Company financial statements (‘Company’) (together the ‘financial statements’) give a true and fair view of the state of the Group’s and of the Company’s affairs as at 31 December 2017 and of the Group’s loss and cash flows for the 52-week period (the ‘period’) then ended;
• the Group financial statements have been properly prepared in accordance with ifrs as adopted by the European Union;
• the Company financial statements have been properly prepared in accordance with United Kingdom Generally Accepted Accounting Practice (United Kingdom Accounting Standards, comprising frs 101 ‘Reduced Disclosure Framework’, and applicable law); and
• the financial statements have been prepared in accordance with the requirements of the Companies Act 2006.
We have audited the financial statements, included within the Annual Report and Consolidated Financial Statements (the ‘Annual Report’), which comprise: the consolidated and Company statements of financial position as at 31 December 2017; the consolidated statement of comprehensive income, the consolidated cash flow statement, and the consolidated and Company statements of changes in equity for the 52-week period then ended; and the notes to the financial statements, which include a description of the significant accounting policies.
BASIS FOR OPINIONWe conducted our audit in accordance with International Standards on Auditing (uk) (‘isas (uk)’) and applicable law. Our responsibilities under isas (uk) are further described in the auditors’ responsibilities for the audit of the financial statements section of our report. We believe that the audit evidence we have obtained is sufficient and appropriate to provide a basis for our opinion.
IndependenceWe remained independent of the Group in accordance with the ethical requirements that are relevant to our audit of the financial statements in the UK, which includes the frc’s Ethical Standard, as applicable to listed entities, and we have fulfilled our other ethical responsibilities in accordance with these requirements.
Independent auditors’ report
OUR AUDIT APPROACH
Overview
The scope of our auditAs part of designing our audit, we determined materiality and assessed the risks of material misstatement in the financial statements. In particular, we looked at where the Directors made subjective judgements, for example in respect of significant accounting estimates that involved making assumptions and considering future events that are inherently uncertain.
As in all of our audits we also addressed the risk of management override of internal controls, including evaluating whether there was evidence of bias by the Directors that represented a risk of material misstatement due to fraud.
• Overall Group materiality: £2.37 million (period ended 1 January 2017: £3.75 million), based on 2.5% of earnings before interest, tax, depreciation and amortisation (‘ebitda’)
• The period ended 1 January 2017 was a 79-week period compared to the 52-week period in 2017 which has resulted in the reduction in materiality compared to the previous period. The benchmark used in both periods is ebitda for Group
• Overall Company materiality: £2.20 million (period ended 1 January 2017: £3.70 million), based on 1% of total assets
• The Company materiality level is capped based on the level of overall Group materiality. This resulted in the reduction in materiality compared to the previous period despite the assets-based benchmark
• 91% coverage over ebitda• One full-scope component with the remaining coverage obtained
through full-scope audit on specified line items from the China and Hong Kong components
• Carrying value of goodwill and intangibles (Group)• Recoverability of non-current intercompany receivables (Company)

ANNUAL REPORT AND FINANCIAL STATEMENTS 2017ANNUAL REPORT AND FINANCIAL STATEMENTS 2017 5352
INDEPENDENT AUDITORS’ REPORT INDEPENDENT AUDITORS’ REPORT
Key audit mattersKey audit matters are those matters that, in the auditors’ professional judgement, were of most significance in the audit of the financial statements of the current period and include the most significant assessed risks of material misstatement (whether or not due to fraud) identified by the auditors, including those which had the greatest effect on: the overall audit strategy; the allocation of resources in the audit; and directing the efforts of the engagement team. These matters, and any comments we make on the results of our procedures thereon, were addressed in the context of our audit of the financial statements as a whole, and in forming our opinion thereon, and we do not provide a separate opinion on these matters. This is not a complete list of all risks identified by our audit.
Key audit matter How our audit addressed the key audit matterCarrying value of goodwill and intangibles – GroupThe key audit matter identified is in respect of the risk of material misstatement in the valuation of goodwill and intangible assets. The Group had £379.2 million of goodwill as at 31 December 2017 (1 January 2017: £380.9 million) and £520.6 million of intangibles as at 31 December 2017 (1 January 2017: £521.1 million).
The carrying values of these assets are contingent upon future cash flows and there is a risk that these assets will be impaired if the cash flows are not in line with expectations. We consider this to be a key audit risk given the magnitude of the relevant balances and the significant judgement and estimation involved in the impairment assessments of these assets. The key assumptions in management’s cash flow projections are: restaurant openings, long-term growth rate, and discount rate. Changes in these assumptions could lead to an impairment in the carrying value of these assets.
To address this risk we have designed and performed a number of audit procedures over the impairment assessments performed by management. We tested the reasonableness of management’s key assumptions including track record of restaurant openings and long-term growth rates in the respective territories. We challenged management to substantiate its assumptions including comparing certain assumptions to industry and economic forecasts. We tested the integrity of the models. We also:• performed a comparison of the performance of the business for the
period ended 31 December 2017 to the budget for the equivalent period to assess the accuracy of the budgeting process;
• verified the cash flow forecasts to the Board-approved five-year forecast;
• engaged our valuation specialists to assist in the assessment of the reasonableness of certain key assumptions, for example discount rate and long-term growth rates.
In performing our audit we challenged management on its forecasts based on our assessment of historical financial results and restaurant opening trends against budget. In performing these assessments the audit team focused on applying an appropriate level of professional scepticism.
Based on the work performed we found that the underlying financial information and assumptions used were supported by the evidence we obtained.
We have also assessed the disclosures made in the financial statements, including sensitivity analysis and the reasonably possible downsides. We are satisfied that these disclosures are appropriate.
Key audit matter How our audit addressed the key audit matterRecoverability of non-current intercompany receivables – CompanyThe Company has non-current intercompany receivables of £424.6 million as at 31 December 2017 (1 January 2017: £386.1 million) which are material to the financial statements.
Judgement is required in assessing the recoverability of the intercompany receivable because the counterparty is in a net liability position.
The receivable is ultimately supported by the underlying value of the business. If there were to be a reduction in the value of the business this could impact the recoverability of the intercompany receivable.
We obtained a listing of the intercompany balances as at the balance sheet date and traced these to the corresponding balance in the counterparty financial statements to confirm the accuracy of the balance. The accrued interest calculations were reperformed.
We considered the ability of the counterparty to repay the balance if the need should arise.
Given the counterparty is in a net liability position the ultimate recoverability is dependent upon the value achieved on the ultimate sale or refinancing of the business. We carried out procedures to assess management’s valuation of the underlying business in supporting the recoverability of the receivables.
We tested the reasonableness of management’s key assumptions, including track record of restaurant openings and long-term growth rates in the respective territories. We challenged management to substantiate its assumptions including comparing certain assumptions to industry and economic forecasts. We tested the integrity of the models. We also:• performed a comparison of the performance of the business for the
year to 31 December 2017 to the budget for the equivalent period to assess the accuracy of the budgeting process;
• verified the cash flow forecasts to the Board-approved five-year forecast;
• engaged our valuation specialists to assist in the assessment of the reasonableness of certain key assumptions, for example the discount rate and long-term growth rates.
Based on the work performed we found that the underlying financial information and assumptions used were supported by the evidence we obtained.

ANNUAL REPORT AND FINANCIAL STATEMENTS 2017ANNUAL REPORT AND FINANCIAL STATEMENTS 2017 5554
INDEPENDENT AUDITORS’ REPORT INDEPENDENT AUDITORS’ REPORT
How we tailored the audit scopeWe tailored the scope of our audit to ensure that we performed enough work to be able to give an opinion on the financial statements as a whole, taking into account the structure of the Group and the Company, the accounting processes and controls, and the industry in which they operate.
The Group management function is situated in the UK along with the largest component of the Group. There are other operations based in China, Hong Kong and the United Arab Emirates.
The largest trading entity in the UK, PizzaExpress (Restaurants) Limited, is the only component requiring an audit of its complete financial information for the purposes of the consolidated Group audit.
In addition to this given the magnitude of certain other operations within the Group, the audit of certain financial line items within a number of other UK incorporated components; in the largest trading entity in China; and in the largest trading entity in Hong Kong are required for the purposes of the consolidated Group audit.
All work over the UK incorporated entities was performed by the Group audit team. Component teams were engaged for the audit procedures required in China and Hong Kong. These teams were formally instructed by PwC UK. Our Group engagement team’s involvement in the work performed over the overseas entities included regular communication throughout the audit process where the component auditors’ planned response to areas of focus was discussed and attendance at the local clearance calls once the component audit work was completed. In addition the Group audit team performed a review of the work performed by the component teams.
Based on the scoping summarised above, Group audit procedures provide coverage of 91% of total Group ebitda.
The Company was scoped to ensure all material financial statement line items were included within the audit plan.
MaterialityThe scope of our audit was influenced by our application of materiality. We set certain quantitative thresholds for materiality. These, together with qualitative considerations, helped us to determine the scope of our audit and the nature, timing and extent of our audit procedures on the individual financial statement line items and disclosures and in evaluating the effect of misstatements, both individually and in aggregate on the financial statements as a whole.
Based on our professional judgement, we determined materiality for the financial statements as a whole as follows:
Group financial statements Company financial statementsOverall materiality £2.37 million (period ended
1 January 2017: £3.75 million)£2.20 million (period ended 1 January 2017: £3.70 million)
How we determined it 2.5% of earnings before interest, tax, depreciation and amortisation
1% of total assets
Rationale for benchmark applied
Based on the key performance measures discussed in the annual report, ebitda is the primary measure used by the shareholders in assessing the performance of the Group and is a generally accepted auditing benchmark.
As the Company is a holding company we believe total assets is the primary measure used by the shareholders in assessing the performance of the entity, and is a generally accepted auditing benchmark.
Please note that the materiality has been capped at a lower level than the underlying statutory benchmark to ensure this remains below the Group materiality.
For each component in the scope of our Group audit, we allocated a materiality that is less than our overall Group materiality. The range of materiality allocated across components was between £2.2 million and £0.75 million.
We agreed with the Audit Committee that we would report to them misstatements identified during our audit above £0.12 million (Group audit) (period ended 1 January 2017: £0.19 million) and £0.12 million (Company audit) (period ended 1 January 2017: £0.19 million) as well as misstatements below those amounts that, in our view, warranted reporting for qualitative reasons.
CONCLUSIONS RELATING TO GOING CONCERNWe have nothing to report in respect of the following matters in relation to which isas (uk) require us to report to you when:
• the Directors’ use of the going concern basis of accounting in the preparation of the financial statements is not appropriate; or
• the Directors have not disclosed in the financial statements any identified material uncertainties that may cast significant doubt about the Group’s and Company’s ability to continue to adopt the going concern basis of accounting for a period of at least twelve months from the date when the financial statements are authorised for issue.
However, because not all future events or conditions can be predicted, this statement is not a guarantee as to the Group’s and Company’s ability to continue as a going concern.

ANNUAL REPORT AND FINANCIAL STATEMENTS 2017ANNUAL REPORT AND FINANCIAL STATEMENTS 2017 5756
INDEPENDENT AUDITORS’ REPORT INDEPENDENT AUDITORS’ REPORT
REPORTING ON OTHER INFORMATIONThe other information comprises all of the information in the Annual Report other than the financial statements and our auditors’ report thereon. The Directors are responsible for the other information. Our opinion on the financial statements does not cover the other information and, accordingly, we do not express an audit opinion or, except to the extent otherwise explicitly stated in this report, any form of assurance thereon.
In connection with our audit of the financial statements, our responsibility is to read the other information and, in doing so, consider whether the other information is materially inconsistent with the financial statements or our knowledge obtained in the audit, or otherwise appears to be materially misstated. If we identify an apparent material inconsistency or material misstatement, we are required to perform procedures to conclude whether there is a material misstatement of the financial statements or a material misstatement of the other information. If, based on the work we have performed, we conclude that there is a material misstatement of this other information, we are required to report that fact. We have nothing to report based on these responsibilities.
With respect to the Strategic Report and Directors’ Report, we also considered whether the disclosures required by the UK Companies Act 2006 have been included.
Based on the responsibilities described above and our work undertaken in the course of the audit, isas (uk) require us also to report certain opinions and matters as described below.
Strategic Report and Directors’ ReportIn our opinion, based on the work undertaken in the course of the audit, the information given in the Strategic Report and Directors’ Report for the period ended 31 December 2017 is consistent with the financial statements and has been prepared in accordance with applicable legal requirements.
In light of the knowledge and understanding of the Group and Company and their environment obtained in the course of the audit, we did not identify any material misstatements in the Strategic Report and Directors’ Report.
RESPONSIBILITIES FOR THE FINANCIAL STATEMENTS AND THE AUDIT
Responsibilities of the Directors for the financial statementsAs explained more fully in the Statement of Directors’ Responsibilities, the Directors are responsible for the preparation of the financial statements in accordance with the applicable framework and for being satisfied that they give a true and fair view. The Directors are also responsible for such internal control as they determine is necessary to enable the preparation of financial statements that are free from material misstatement, whether due to fraud or error.
In preparing the financial statements, the Directors are responsible for assessing the Group’s and the Company’s ability to continue as a going concern, disclosing as applicable, matters related to going concern and using the going concern basis of accounting unless the Directors either intend to liquidate the Group or the Company or to cease operations, or have no realistic alternative but to do so.
Auditors’ responsibilities for the audit of the financial statementsOur objectives are to obtain reasonable assurance about whether the financial statements as a whole are free from material misstatement, whether due to fraud or error, and to issue an auditors’ report that includes our opinion. Reasonable assurance is a high level of assurance, but is not a guarantee that an audit conducted in accordance with isas (uk) will always detect a material misstatement when it exists. Misstatements can arise from fraud or error and are considered material if, individually or in the aggregate, they could reasonably be expected to influence the economic decisions of users taken on the basis of these financial statements.
A further description of our responsibilities for the audit of the financial statements is located on the Financial Reporting Council’s website at: www.frc.org.uk/auditorsresponsibilities. This description forms part of our auditors’ report.
Use of this reportThis report, including the opinions, has been prepared for and only for the Company’s members as a body in accordance with Chapter 3 of Part 16 of the Companies Act 2006 and for no other purpose. We do not, in giving these opinions, accept or assume responsibility for any other purpose or to any other person to whom this report is shown or into whose hands it may come save where expressly agreed by our prior consent in writing.
OTHER REQUIRED REPORTING
Companies Act 2006 exception reporting
Under the Companies Act 2006 we are required to report to you if, in our opinion:
• we have not received all the information and explanations we require for our audit; or
• adequate accounting records have not been kept by the Company, or returns adequate for our audit have not been received from branches not visited by us; or
• certain disclosures of Directors’ remuneration specified by law are not made; or
• the Company financial statements are not in agreement with the accounting records and returns.
We have no exceptions to report arising from this responsibility.
Sarah QuinnSenior Statutory Auditorfor and on behalf of PricewaterhouseCoopers llpChartered Accountants and Statutory AuditorsUxbridge30 April 2018

ANNUAL REPORT AND FINANCIAL STATEMENTS 2017ANNUAL REPORT AND FINANCIAL STATEMENTS 2017 5958
CONSOLIDATED FINANCIAL STATEMENTS CONSOLIDATED FINANCIAL STATEMENTS
Consolidated Statement of Financial PositionAs at 31 December 2017Registration number: 09115780
Consolidated Statement of Comprehensive IncomeFor the period from 2 January 2017 to 31 December 2017
52 weeks ended
31 December 201779 weeks ended
1 January 2017 Note £000 £000
Continuing operationsTurnover 3 534,243 760,764
Cost of sales (397,285) (542,478)
Gross profit 136,958 218,286
Administrative expenses (76,348) (103,772)
Operating profit excluding exceptional items 64,965 117,689
Exceptional items 5 (4,355) (3,175)
Operating profit 6 60,610 114,514
Finance income 7 53 273
Finance costs 7 (89,361) (129,810)
Loss on ordinary activities before taxation (28,698) (15,023)
Taxation on loss on ordinary activities 10 (2,939) 10,177
Loss for the financial period from continuing operations (31,637) (4,846)
Discontinued operationsLoss for the financial period from discontinued operations 25 (9,076) (2,009)
Loss for the financial period (40,713) (6,855)
Other comprehensive (loss)/income:Currency translation differences (1,678) 4,365
Total comprehensive loss for the financial period (42,391) (2,490)
Total comprehensive loss for the financial period attributable to equity shareholders arises from:—Continuing operations (33,315) (481)
—Discontinued operations (9,076) (2,009)
(42,391) (2,490)
The notes on pages 62 to 95 form part of these consolidated financial statements.
The notes on pages 62 to 95 form part of these consolidated financial statements.
The financial statements on pages 58 to 95 were authorised for issue by the Board of Directors on 30 April 2018 and were signed on its behalf.
Andy PellingtonDirector
31 December 2017 1 January 2017Note £000 £000
Intangible assets 11 899,837 901,983
Property, plant and equipment 12 237,806 233,290
Trade and other receivables falling due after more than one year 14 5,236 2,409
Investments 13 174 32
Non-current assets 1,143,053 1,137,714
Inventories 15 11,022 9,727
Trade and other receivables falling due within one year 14 37,128 34,593
Corporation tax debtor – 148
Cash and cash equivalents 16 42,552 52,008
Current assets 90,702 96,476
Trade and other payables falling due within one year 17 (112,405) (109,484)
Corporation tax creditor (1,435) (2,273)
Current liabilities (113,840) (111,757)
Net current liabilities (23,138) (15,281)
Borrowings 18 (1,077,417) (1,036,400)
Provisions for liabilities and charges 19 (1,283) (1,289)
Deferred tax liability 20 (99,136) (100,291)
Non-current liabilities (1,177,836) (1,137,980)
Net liabilities (57,921) (15,547)
Share capital 24 – –
Share premium 24 4,500 4,500
Accumulated losses (62,421) (20,047)
Total equity (57,921) (15,547)

ANNUAL REPORT AND FINANCIAL STATEMENTS 2017ANNUAL REPORT AND FINANCIAL STATEMENTS 2017 6160
CONSOLIDATED FINANCIAL STATEMENTS CONSOLIDATED FINANCIAL STATEMENTS
Consolidated Cash Flow StatementFor the period from 29 June 2015 to 1 January 2017
Consolidated Statement of Changes in EquityFor the period from 2 January 2017 to 31 December 2017
The notes on pages 62 to 95 form part of these consolidated financial statements.
Share
capitalShare
premiumAccumulated
lossesTotal
equity £000 £000 £000 £000
As at 29 June 2015 – 4,500 (17,894) (13,394)
Loss for the financial period – – (6,855) (6,855)
Currency translation differences – – 4,365 4,365
Total comprehensive loss for the financial period
- - (2,490) (2,490)
Share-based payment charge – – 337 337
Total transactions with owners, recognised directly in equity
– – 337 337
As at 1 January 2017 – 4,500 (20,047) (15,547)
As at 2 January 2017 – 4,500 (20,047) (15,547)
Loss for the financial period – – (40,713) (40,713)
Currency translation differences – – (1,678) (1,678)
Total comprehensive loss for the financial period
– – (42,391) (42,391)
Share-based payment charge – – 17 17
Total transactions with owners, recognised directly in equity
– – 17 17
As at 31 December 2017 – 4,500 (62,421) (57,921)
52 weeks ended
31 December 2017 79 weeks ended
1 January 2017
Note £000 £000
Loss for the financial period (40,713) (6,855)
Share-based payment charge 9 33 337
Depreciation and amortisation 29,307 38,697
Impairment of property, plant and equipment 12 2,226 812
Taxation charge/(credit) 2,922 (10,259)
Net finance expense 89,311 129,542
Loss/(profit) on disposal of business 6,154 (1,156)
Loss on disposal of assets 1,068 2,410
Increase in inventories (1,565) (971)
Increase in trade and other receivables (6,729) (4,922)
Increase in trade and other payables 5,791 8,294
Increase/(decrease) in provisions 128 (1,009)
Other non-cash items 11 (1,949)
Net cash inflow from operations 87,944 152,971
Taxation paid (4,059) (3,296)
Interest paid (48,323) (72,532)
Net cash inflow from operating activities 35,562 77,143
Purchase of property, plant and equipment (43,040) (62,632)
Income on disposal of property, plant and equipment 493 346
Purchase of intangible assets 11 (1,375) (343)
Purchase of subsidiary undertakings, net of cash acquired (1,479) (16,357)
Purchase of shares – (32)
Proceeds from disposal of business 899 2,471
Interest received 7 52 273
Net cash outflow from investing activities (44,450) (76,274)
Debt issue costs – (490)
Net cash outflow from financing activities – (490)
Net (decrease)/increase in cash and cash equivalents (8,888) 379
Cash and cash equivalents at the beginning of the period 52,008 49,273
Exchange (loss)/gain on cash and cash equivalents (568) 2,356
Cash and cash equivalents at the end of the period 16 42,552 52,008
The notes on pages 62 to 95 form part of these consolidated financial statements.
The cash flow statement has been presented as if the discontinued operations had not been classified as discontinued. The net cash flows for operating, financing and investing activities for discontinued operations are disclosed in note 25.

ANNUAL REPORT AND FINANCIAL STATEMENTS 2017ANNUAL REPORT AND FINANCIAL STATEMENTS 2017 6362
NOTES TO THE CONSOLIDATED FINANCIAL STATEMENTS NOTES TO THE CONSOLIDATED FINANCIAL STATEMENTS
1 General information
PizzaExpress Group Holdings Limited (the ‘Company’) is a limited company limited by shares, domiciled and incorporated in the United Kingdom. The Company’s registered office is Hunton House, Highbridge Estate, Oxford Road, Uxbridge, Middlesex, ub8 1lx.
The Company and its subsidiaries (together, the ‘Group’) operate an international chain of pizza restaurants, as well as receiving royalty income from sales of retail products, income from the sale of dough products and franchise fees.
2 Summary of significant accounting policies
The principal accounting policies are outlined below. These policies have been consistently applied to all periods presented, unless otherwise stated.
Basis of preparationThe consolidated financial statements have been prepared in accordance with International Financial Reporting Standards (ifrs) and ifrs Interpretations Committee (ifric) interpretations as adopted by the European Union and the Companies Act 2006 applicable to companies reporting under ifrs.
The consolidated financial statements have been prepared on the historical cost basis, except for the fair valuation of assets and liabilities of the subsidiary companies acquired during the period ended 1 January 2017. Separate financial statements are prepared for the Company as a single entity as required by law. These have been prepared under Financial Reporting Standard 101 and are included on pages 96 to 105.
Going concernThe Directors note that as at 31 December 2017, the Group is in a net liabilities position of £57,921,000 (as at 1 January 2017: £15,547,000) and a net current liabilities position of £23,138,000 (as at 1 January 2017: £15,281,000). The Directors note that the first repayments of the Group’s borrowings of £1,077,417,000 (period ended 1 January 2017: £1,036,400,000) are not due until August 2021. In addition, the cash flow forecasts of the Group are closely monitored on a regular basis to ensure that the Group has sufficient cash to meet its liabilities as they fall due. In preparing these consolidated financial statements the Directors have reviewed these cash flow forecasts for the following 12 months from the date of approval of these financial statements and consider that these appropriately demonstrate the ability of the Group to meet its obligations for the foreseeable future. Furthermore, the Group has an undrawn Revolving Credit Facility of £20,000,000 currently readily available until July 2020. Board approved budgets are prepared on a rolling basis covering a five-year period and in making their assessment of going concern, the Directors have taken into account the most recently approved Five Year Plan, which demonstrates that the Group is able to operate as a going concern. The Directors regularly review the risks facing the business and, where appropriate, adjust the strategy of the business accordingly. The Directors consider that the Group is well placed to mitigate the risks that it faces. As such, these financial statements have been prepared on a going concern basis.
Change of accounting reference dateDuring the period ended 1 January 2017, the Group effected its proposal to change its accounting reference date (ard) from 30 June to 31 December. The comparative period was the first period in which statutory financial statements were prepared on this basis and therefore the financial statements were prepared for the 79-week period ended 1 January 2017.
Disclosure for new accounting standards effective during the current periodNo new standards, amendments or interpretations, effective for the first time for the financial period beginning on or after 2 January 2017 have had a material impact on the Group.
New standards, amendments and interpretationsA number of new standards and amendments to standards and interpretations are effective for annual periods beginning after 1 January 2018, and have not been applied in preparing these consolidated financial statement. None of these are expected to have a significant effect on the consolidated financial statements of the Group:
• ifrs 9, ‘Financial instruments’, addresses the classification, measurement and recognition of financial assets and financial liabilities. It replaces the guidance in ias 39 that relates to the classification and measurement of financial instruments. ifrs 9 retains but simplifies the mixed measurement model and establishes three primary measurement categories for financial assets: amortised cost; fair value through other comprehensive income; and fair value through profit or loss. The basis of classification depends on the entity’s business model and the contractual cash flow characteristics of the financial asset. Investments in equity instruments are required to be measured at fair value through profit or loss with the irrevocable option at inception to present changes in fair value in other comprehensive income, not recycling. An expected credit losses model replaces the incurred loss impairment model used in ias 39. For financial liabilities, there are no changes to classification and measurement, except for the recognition of changes in own credit risk in other comprehensive income, for liabilities designated at fair value through profit or loss. ifrs 9 relaxes the requirements for hedge effectiveness by replacing the bright-line hedge effectiveness tests. To qualify for hedge accounting, it requires an economic relationship between the hedged item and hedging instrument, and for the ‘hedged ratio’ to be the same as the one that management actually uses for risk management purposes. Contemporaneous documentation is still required, but it is different from that currently prepared under ias 39. There is an accounting policy choice to continue to account for all pre-existing hedges under ias 39. ifrs 9 is effective for accounting periods beginning on or after 1 January 2018. Early adoption is permitted. The Group will implement ifrs 9 with effect from 1 January 2018 and this has not had a significant impact on the Group. The classification and measurement basis for the Group’s financial assets and liabilities has not been changed by adoption of ifrs 9, and in addition as the Group does not have any hedges in place, there has been no impact of the changes in hedge accounting. The main impact of adopting ifrs 9 was likely to arise from the implementation of the expected loss model, however as the majority of the Group’s financial assets fall due within one year the Group will use the practical expedient allowed under ifrs 9 in relation to short-term trade receivables and there is currently no significant value for expected losses based on historical information.
• ifrs 15, ‘Revenue from contracts with customers’, deals with revenue recognition and establishes principles for reporting useful information to users of financial statements about the nature, amount, timing and uncertainty of revenue and cash flows arising from an entity’s contracts with customers. Revenue is recognised when a customer obtains control of a good or service and thus has the ability to direct the use and obtain the benefits from the good or service. Variable consideration is included in the transaction price if it is highly probable that there will be no significant reversal of the cumulative revenue recognised when the uncertainty is resolved. The standard replaces ias 18, ‘Revenue’, and ias 11, ‘Construction contracts’, and related interpretations. The standard is effective for annual periods beginning on or after 1 January 2018, and earlier application is permitted. The Group will implement ifrs 15
2 Summary of significant accounting policies (continued)

ANNUAL REPORT AND FINANCIAL STATEMENTS 2017ANNUAL REPORT AND FINANCIAL STATEMENTS 2017 6564
NOTES TO THE CONSOLIDATED FINANCIAL STATEMENTS NOTES TO THE CONSOLIDATED FINANCIAL STATEMENTS
from 1 January 2018 and has carried out a review of existing contractual arrangements as part of this process. There is no material change for any of the revenue streams and therefore ifrs 15 has not had a significant impact on the Group.
• ifrs 16, ‘Leases’, addresses the definition of a lease, recognition and measurement of leases, and it establishes principles for reporting useful information to users of financial statements about the leasing activities of both lessees and lessors. A key change arising from ifrs 16 is that most operating leases will be accounted for on balance sheet for lessees. The standard replaces ias 17, ‘Leases’, and related interpretations. The standard is effective for annual periods beginning on or after 1 January 2019, and earlier application is permitted, subject to eu endorsement and the entity adopting ifrs 15, ‘Revenue from contracts with customers’, at the same time. The Directors are in the process of reviewing the impact of the adoption of ifrs 16 on the Group and note that the year of adoption for the Group will be the annual period beginning on 30 December 2019.
Critical accounting estimates and areas of judgmentThe preparation of the consolidated financial statements in conformity with ifrs requires management to make estimates and assumptions that affect the application of policies and reported amounts of assets, liabilities, income, expenses and related disclosures. The estimates and underlying assumptions are based on historical experience and other relevant factors. This approach forms the basis of making the judgments about carrying values of assets and liabilities that are not readily apparent from other sources. Actual results may differ from these estimates.
The estimates and underlying assumptions are reviewed on an ongoing basis. Changes in accounting estimates may be necessary if there are changes in the circumstances on which the estimate was based or as a result of new information. Such changes are recognised in the period in which the estimate is revised.
The key assumptions about the future and key sources of estimation uncertainty that have a risk of causing a material adjustment to the carrying value of assets and liabilities within the next 12 months, are described below.
Intangible assetsThe Group tests its indefinite life intangible assets for impairment annually by reference to value in use. This is calculated using Board-approved budgets covering a five-year period. After this five-year period the cash flows are continued into perpetuity using a growth rate specific to the market. The key assumptions are discount rate, long term growth rate and forecast cash flows (including number of new site openings). Long term growth rates are based on external research demonstrating expected long term growth for each of the markets to which the asset relates. Valuation of identifiable assets and liabilities on acquisitionsThe consideration paid on an acquisition is allocated to identifiable assets and liabilities at their estimated fair value, with any excess recognised as goodwill. Fair values are estimates, as active markets do not always exist for assets and liabilities acquired through acquisition and therefore alternative valuation methods are used. The allocation of consideration to identifiable assets and liabilities is made on a provisional basis and is revised based upon improved knowledge in subsequent periods, but no later than one year following the date of acquisition.
Onerous lease and dilapidation provisionsProvisions for onerous leases and dilapidations include estimates such as the length of time a property may be empty for and the value of any make good costs at the end of a lease. Provisions are discounted to present value which requires the use of a discount rate. Provisions are reviewed regularly and adjusted as appropriate.
Useful lives of intangible and tangible assetsDepreciation and amortisation is provided in order to write down to estimated residual values the cost of each asset over its estimated useful economic life. These useful economic lives require the use of management judgement. These estimates are regularly reviewed.
Impairment of tangible assetsEach cash generating unit (cgu) is reviewed annually for indicators of impairment. In assessing whether an asset has been impaired, the carrying value of the cgu is compared to its recoverable amount. The recoverable amount is the higher of its fair value and its value in use. Where value in use is estimated, this is calculated using a discounted cash flow model, which includes assumptions around future performance and the use of an appropriate discount rate. Future projections are compared to actual performance on a regular basis to assess the accuracy of such projections.
Basis of consolidationThe consolidated financial statements of the Group incorporate the financial statements of the Company and those entities controlled by the Company. The accounting reference date for the Group is 31 December and the financial statements are prepared to the Sunday falling nearest this date each year.
SubsidiariesSubsidiaries are all entities (including structured entities) over which the Group has control. The Group controls an entity when the Group is exposed to, or has rights to, variable returns from its involvement with the entity and has the ability to affect those returns through its power over the entity. Subsidiaries are fully consolidated from the date on which control is transferred to the Group. They are deconsolidated from the date that control ceases. Acquisition related costs are expensed as incurred.
Intra-Group transactions, balances, and unrealised gains and losses on transactions between Group companies are eliminated on consolidation.
All subsidiaries have coterminous accounting reference dates of 31 December, and those incorporated in the UK and Ireland prepare statutory financial statements to the Sunday falling nearest to their accounting reference date.
Business combinationsAll acquisitions are accounted for using the acquisition method of accounting. The cost of an acquisition is the aggregate of the fair values of the assets transferred, liabilities incurred or assumed and equity instruments in issue at the date of acquisition.
Costs directly relating to an acquisition are expensed to the statement of comprehensive income. The identified assets and liabilities and contingent liabilities are measured at their fair value at the date of acquisition. The excess of the fair value of consideration to acquire the business over the aggregate fair value of the Group’s share of the net identified assets and liabilities is recorded as goodwill.
2 Summary of significant accounting policies (continued) 2 Summary of significant accounting policies (continued)

ANNUAL REPORT AND FINANCIAL STATEMENTS 2017ANNUAL REPORT AND FINANCIAL STATEMENTS 2017 6766
NOTES TO THE CONSOLIDATED FINANCIAL STATEMENTS NOTES TO THE CONSOLIDATED FINANCIAL STATEMENTS
Disposal of subsidiariesWhen the Group ceases to have control, any retained interest in the entity is remeasured to its fair value at the date when control is lost, with the change in carrying amount recognised in profit or loss. In addition, any amounts previously recognised in other comprehensive income in respect of that entity are accounted for as if the Group had directly disposed of the related assets or liabilities. This may mean that amounts previously recognised in other comprehensive income are reclassified to profit or loss. Where the disposal of a subsidiary also meets the definition of discontinued operations, the policy for discontinued operations is also followed.
TurnoverTurnover represents net invoiced sales of food and beverages, royalties from retail sales, sales of dough products and franchise fees, all excluding value added tax. Turnover of restaurant services is recognised when the services have been delivered. Royalties from retail sales are recognised in turnover on product delivery or when due under the terms of the relevant retail sales agreements. Turnover from the sale of dough products is recognised on despatch, as this is when the risks and rewards of ownership transfer to the third party. Franchise fees are recognised when they fall due under the terms of the relevant franchise agreements.
Allocation of costsCost of sales includes the cost of goods sold, direct labour costs and restaurant overheads. Administrative expenses include central and area management, administration and head office costs.
Holiday pay accrualA liability is recognised to the extent of any unused holiday pay entitlement which is accrued at the statement of financial position date and carried forward to future periods. This is measured at the undiscounted salary cost of the future holiday entitlement so accrued at the statement of financial position date.
Property, plant and equipmentTangible fixed assets are stated at original historical purchase cost less accumulated depreciation.
Cost includes the original purchase price of the asset and the costs attributable to bringing the asset to its working condition for its intended use.
Depreciation is provided at the following annual rates in order to write down the cost of each asset over its estimated useful economic life on a straight-line basis:
Equipment 20% per annumFurniture and fittings 10% per annum
Short leasehold improvements are depreciated over the length of the lease except where the anticipated renewal or extension of the lease is sufficiently certain so that a longer estimated useful life is appropriate. Current legislation and the terms of the lease contracts are such that the majority of leases are readily extendable. The maximum depreciation period for short-term leasehold properties is 30 years.
Assets under construction include tangible fixed assets acquired for restaurants under construction including costs directly attributable to bringing the asset into use. Assets are transferred to short leasehold, equipment or furniture and fittings when the restaurant opens. No depreciation is provided on assets under construction as these assets have not been brought into working condition for intended use by the Group.
Intangible assets (excluding goodwill and brand)Intangible assets are initially recognised at cost. After recognition, under the cost model, intangible assets are measured at cost less any accumulated amortisation and any accumulated impairment losses.
Amortisation is provided at the following annual rates in order to write down to estimated residual values the cost of each asset over its estimated useful economic life on a straight line basis:
Computer software and trademarks 6.66%–20% per annum
Goodwill and brandGoodwill arising on consolidation represents the excess of consideration transferred over the interest in the net fair value of the net assets acquired. Brand values arising on consolidation relate to externally acquired, separable brand names and are valued at the date of acquisition. Where brand values are not considered to have an indefinite useful life, they are amortised over their useful life.
An impairment review is carried out annually for goodwill and indefinite life brand values, or when circumstances arise that may indicate an impairment is likely. The carrying value of the goodwill allocated to each cash generating unit is compared to its recoverable amount being the higher of its value in use and its fair value less costs to sell. Any impairment is charged immediately to the consolidated statement of comprehensive income.
Operating leasesRentals paid under operating leases are charged to the statement of comprehensive income on a straight-line basis over the term of the lease. The benefits of lease incentives are taken to the statement of comprehensive income on a straight line basis over the lease term. Contributions received from landlords as an incentive to enter into a lease are treated as deferred income within creditors and are taken to the statement of comprehensive income on a straight-line basis over the lease term. Rentals received under operating leases are credited to the income statement on a straight-line basis over the term of the lease.
Exceptional itemsExceptional items are material items of income and expense that, because of the unusual nature and expected infrequency of the events giving rise to them, merit separate presentation to allow an understanding of the Group’s underlying financial performance.
PensionsContributions to defined contribution personal pension schemes are charged to the statement of comprehensive income in the period in which they become payable.
2 Summary of significant accounting policies (continued) 2 Summary of significant accounting policies (continued)

ANNUAL REPORT AND FINANCIAL STATEMENTS 2017ANNUAL REPORT AND FINANCIAL STATEMENTS 2017 6968
NOTES TO THE CONSOLIDATED FINANCIAL STATEMENTS NOTES TO THE CONSOLIDATED FINANCIAL STATEMENTS
TaxationThe tax expense represents the sum of current tax and deferred tax.
Current taxationCurrent tax payable is based on taxable profit for the period which differs from accounting profit as reported in the statement of comprehensive income because it excludes items of income or expense that are taxable or deductible in other years and those items never taxable or deductible. The Group’s liability for current tax is measured using tax rates that have been enacted or substantively enacted by the reporting date.
Deferred taxationDeferred tax is the tax expected to be payable or recoverable on differences between the carrying amount of assets and liabilities in the consolidated financial statements and the corresponding tax base used in the computation of taxable profit, and is accounted for using the balance sheet liability method.
Deferred tax liabilities are recognised for all taxable temporary differences and deferred tax assets are recognised to the extent that it is probable that future taxable profits will be available against which deductible temporary differences can be utilised. Such assets and liabilities are not recognised if the temporary difference arises from the initial recognition of goodwill or from the initial recognition (other than in a business combination) of other assets and liabilities in a transaction which affects neither the taxable profit nor the accounting profit.
Deferred tax is calculated at the substantively enacted tax rates at the balance sheet date that are expected to apply to the period when the asset is realised or the liability is settled. Deferred tax is charged or credited in comprehensive income, except when it relates to items credited or charged directly to equity, in which case the deferred tax is dealt with in equity, or items charged or credited directly to other comprehensive income, in which case the deferred tax is also recognised in other comprehensive income.
Deferred tax assets and liabilities are offset when there is a legally enforceable right to set off current tax assets and liability and when the Group intends to settle its current tax assets and liabilities on a net basis.
Discontinued operationsDiscontinued operations are operations and cash flows that can be clearly distinguished, operationally and for financial reporting purposes from the rest of the Group, and that have been sold, closed or not yet sold but classified as held for sale. Discontinued operations represent a separate major line of business or geographical area of operations or are part of a single coordinated plan to dispose of a separate major line of business or geographical area of operations.
Discontinued operations are disclosed as a single amount in the statement of comprehensive income comprising the total of the post-tax profit or loss of the discontinued operations and the post-tax gain or loss recognised on the measurement to fair value less costs to sell or on the disposal of the assets constituting the discontinued operation. The cash flow statement is presented as if the discontinued operation had not been classified as discontinued with disclosures of net cash flows attributable to the operating, investing and financing activities of the discontinued operations presented in the notes.
InventoryInventories are valued at the lower of cost and net realisable value. Cost is based on the purchase cost on a first-in, first-out basis. Inventories comprises food and drink and items that are utilised in the rendering of services to customers.
Rebates receivable from suppliersWhere a rebate agreement with a supplier covers more than one period the rebates are recognised in the financial statements in the period in which they are earned.
Foreign currency transactionsThe Group’s functional and presentational currency is gbp. Transactions denominated in foreign currencies are recorded at the spot rate applicable at the date of the transaction. Monetary assets and liabilities expressed in foreign currencies held at the statement of financial position date are translated at the closing rate. The resulting exchange gain or loss is dealt with in the statement of comprehensive income. The results of foreign subsidiaries are translated at the average rate. The statement of financial position of foreign subsidiaries are translated at the closing rate. The resulting exchange differences are dealt with through reserves and are reported in the consolidated statement of comprehensive income and expense.
Financial instrumentsFinancial assets and financial liabilities are recognised when the Group has become a party to the contractual provisions of the instrument. Financial instruments are de-recognised when they are discharged or when the contractual terms expire. The Group’s accounting policies in respect of financial instruments transactions are explained below.
Financial assetsFinancial assets comprise cash and cash equivalents and trade and other receivables. The Group classifies all of its financial assets as loans and receivables. Loans and receivables are non-derivative financial assets with fixed or determinable payments that are not quoted in an active market. They arise principally through intercompany transactions, but also incorporate other types of contractual monetary asset. They are initially recognised at fair value plus transaction costs that are directly attributable to their acquisition or issue, and are subsequently carried at amortised cost using the effective interest rate method, less provision for impairment
Impairment provisions are recognised when there is objective evidence (such as significant financial difficulties on the part of the counterparty or default or significant delay in payment) that the Group will be unable to collect all of the amounts due under the terms receivable, the amount of such a provision being the difference between the net carrying amount and the present value of the future expected cash flows associated with the impaired receivable.
Financial liabilitiesFinancial liabilities comprise borrowings and trade and other payables. The Group classifies all of its financial liabilities as liabilities at amortised cost. Financial liabilities at amortised cost are initially recognised at fair value net of any transaction costs directly attributable to the issue of the instrument.
The Group does not hold or issue derivative financial instruments for trading purposes.
2 Summary of significant accounting policies (continued) 2 Summary of significant accounting policies (continued)

ANNUAL REPORT AND FINANCIAL STATEMENTS 2017ANNUAL REPORT AND FINANCIAL STATEMENTS 2017 7170
NOTES TO THE CONSOLIDATED FINANCIAL STATEMENTS NOTES TO THE CONSOLIDATED FINANCIAL STATEMENTS
ProvisionsProvisions are recognised when the Group has a present legal obligation as a result of a past event which it is probable will result in an outflow of economic benefits that can be reliably estimated. Where the effect of the time value of money is material, the provision is based on the present value of future outflows, discounted at the pre-tax discount rate that reflects the risks specific to the liability.
Share-based paymentsThe Group operates share schemes under which shares and share options are granted to certain employees. The schemes meet the definition of equity-settled and cash-settled share-based payment schemes. The costs of equity-settled transactions are measured at fair value at the date of grant. The costs of cash-settled transactions are measured at fair value at the date of grant and then revalued at each reporting date. The costs are expensed on a straight line basis over the vesting period and are adjusted to reflect the actual number of share that are expected to vest.
Employee benefit trustThe Group operates an employee benefit trust (ebt) in conjunction with the share schemes in place. As the Group is considered to have control over the ebt it is consolidated as a subsidiary and the shares held by the trust are shown as an investment, as they relate to an entity outside the Group which is consolidated.
Segmental reportingOperating segments are identified using the level of information that is regularly reviewed by the Chief Operating Decision Maker (codm) in order to allocate resources. The codm has been identified as the Group Board of Directors. The Group Board of Directors reviews financial information split between UK and Ireland and International. This split is also consistent with budget approval and the level at which segment management exists.
The key focus of segmental information that is regularly reviewed is turnover and earnings before interest, tax, depreciation and amortisation. As such, the statement of comprehensive income segmental information disclosed is for turnover, operating profit and depreciation and amortisation (by virtue of the fact that the latter is included in operating profit for statutory reporting purposes). Net finance costs and tax are reviewed by the codm at a Group level as opposed to a segmental level.
Statement of financial position information is only reviewed at a Group level by the codm and therefore no split of segmental information is disclosed in these financial statements. The codm does not regularly review assets and liabilities disaggregated by the Group’s reportable segments.
The Group is also required to disclose financial information by material product and geography, irrespective of the identified reportable operating segments. In determining what constitutes material in respect of geography, the Group applies a threshold of 10% of total Group turnover.
3 Turnover
Business segment analysisThe split of turnover by business segment is as follows:
52 weeks ended31 December 2017
79 weeks ended 1 January 2017
£000 £000
Restaurant income 517,784 736,591
Merchandising income 10,778 16,073
Wholesale income 4,095 6,346
Franchise income 1,586 1,754
534,243 760,764
Geographical segmental analysisThe split of turnover by material geographical segment is as follows:
52 weeks ended31 December 2017
79 weeks ended 1 January 2017
£000 £000
UK & Ireland 440,496 663,550
China 77,744 80,755
Other international geographies 16,003 16,459
534,243 760,764
2 Summary of significant accounting policies (continued)
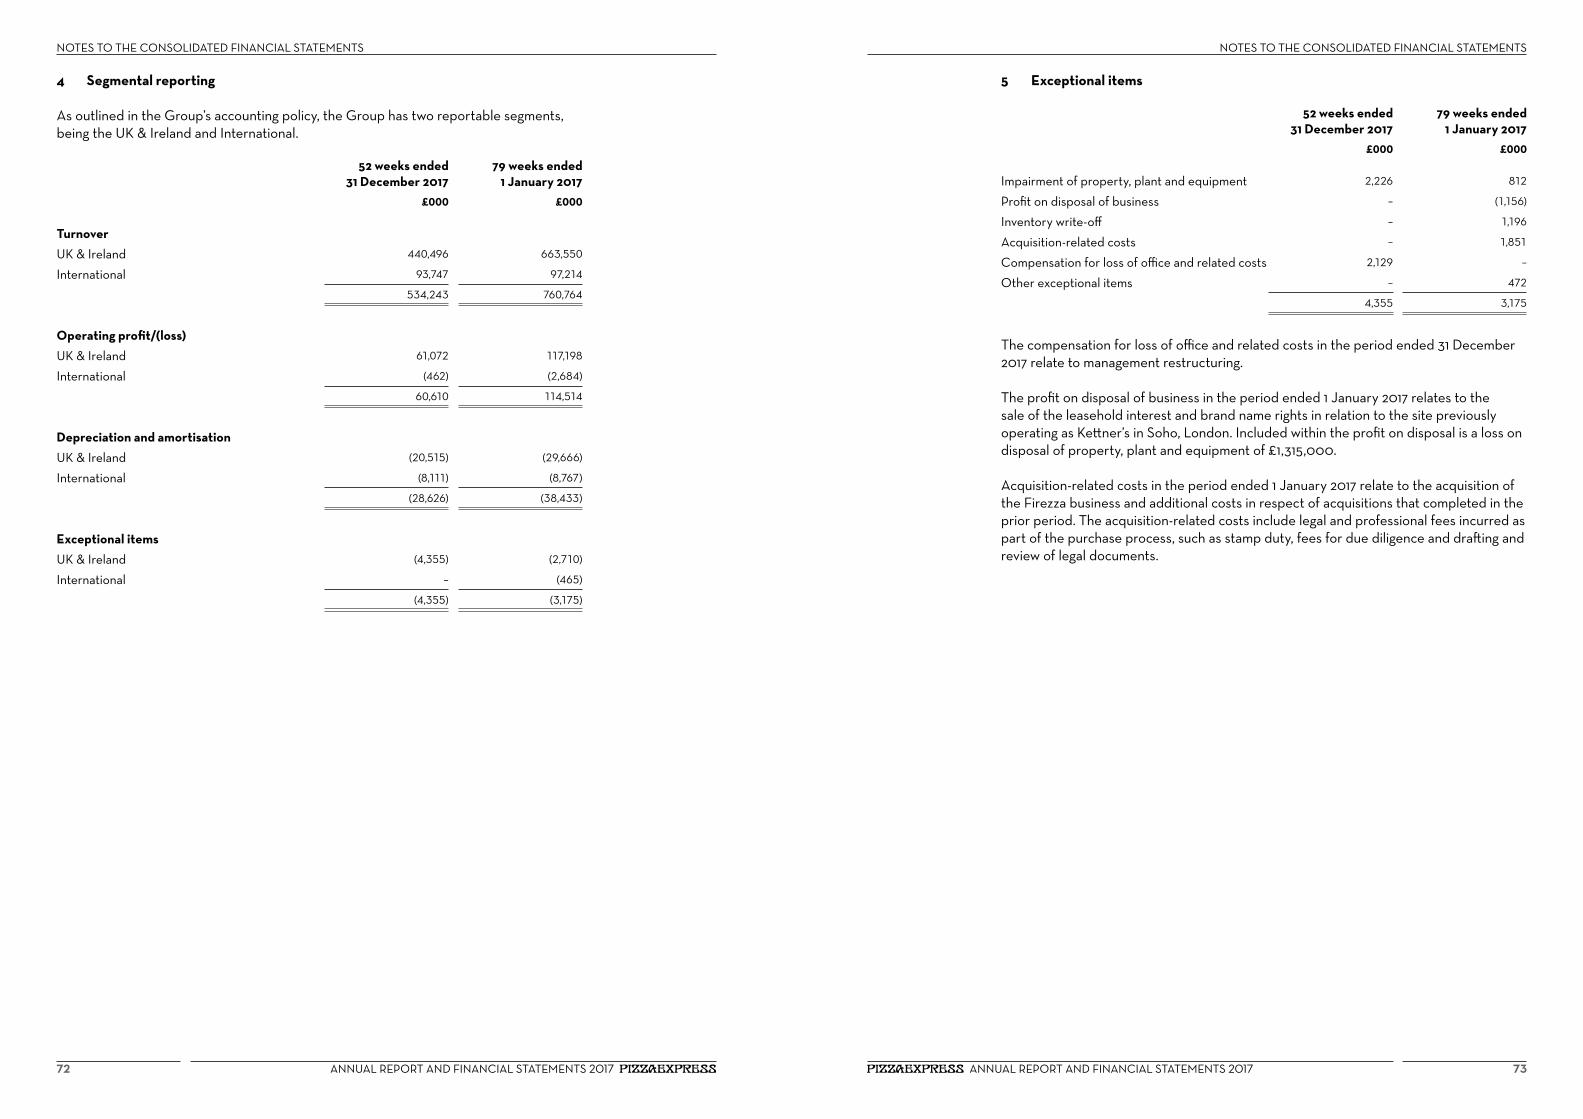
ANNUAL REPORT AND FINANCIAL STATEMENTS 2017ANNUAL REPORT AND FINANCIAL STATEMENTS 2017 7372
NOTES TO THE CONSOLIDATED FINANCIAL STATEMENTS NOTES TO THE CONSOLIDATED FINANCIAL STATEMENTS
4 Segmental reporting
As outlined in the Group’s accounting policy, the Group has two reportable segments, being the UK & Ireland and International.
52 weeks ended31 December 2017
79 weeks ended1 January 2017
£000 £000
TurnoverUK & Ireland 440,496 663,550
International 93,747 97,214
534,243 760,764
Operating profit/(loss)
UK & Ireland 61,072 117,198
International (462) (2,684)
60,610 114,514
Depreciation and amortisation
UK & Ireland (20,515) (29,666)
International (8,111) (8,767)
(28,626) (38,433)
Exceptional items
UK & Ireland (4,355) (2,710)
International – (465)
(4,355) (3,175)
5 Exceptional items
52 weeks ended31 December 2017
79 weeks ended1 January 2017
£000 £000
Impairment of property, plant and equipment 2,226 812
Profit on disposal of business – (1,156)
Inventory write-off – 1,196
Acquisition-related costs – 1,851
Compensation for loss of office and related costs 2,129 –
Other exceptional items – 472
4,355 3,175
The compensation for loss of office and related costs in the period ended 31 December 2017 relate to management restructuring.
The profit on disposal of business in the period ended 1 January 2017 relates to the sale of the leasehold interest and brand name rights in relation to the site previously operating as Kettner’s in Soho, London. Included within the profit on disposal is a loss on disposal of property, plant and equipment of £1,315,000.
Acquisition-related costs in the period ended 1 January 2017 relate to the acquisition of the Firezza business and additional costs in respect of acquisitions that completed in the prior period. The acquisition-related costs include legal and professional fees incurred as part of the purchase process, such as stamp duty, fees for due diligence and drafting and review of legal documents.

ANNUAL REPORT AND FINANCIAL STATEMENTS 2017ANNUAL REPORT AND FINANCIAL STATEMENTS 2017 7574
NOTES TO THE CONSOLIDATED FINANCIAL STATEMENTS NOTES TO THE CONSOLIDATED FINANCIAL STATEMENTS
6 Operating profit
Operating profit from continuing operations has been arrived at after charging/(crediting):
52 weeks ended31 December 2017
79 weeks ended 1 January 2017
£000 £000
Rent—operating leases 63,491 83,699
Rental income (1,377) (2,602)
Share based payment charge 33 337
Depreciation of property, plant and equipment 27,665 37,352
Loss on disposal of property, plant and equipment 1,000 2,221
Amortisation of intangible assets 961 928
Loss on disposal of intangible assets 19 189
Increase/(decrease) in provisions 128 (1,009)
Exchange differences (101) (1,789)
Inventories recognised as an expense 96,985 135,420
During the period the Group incurred costs relating to services provided by the Group’s auditors:
52 weeks ended31 December 2017
79 weeks ended 1 January 2017
£000 £000
– Audit of Group and parent company 61 62
– Audit of subsidiary companies 310 315
– Corporate finance services – 115
– Other assurance services 71 113
7 Finance income and finance costs
Finance income52 weeks ended
31 December 201779 weeks ended
1 January 2017£000 £000
Other interest receivable 53 273
Finance costs52 weeks ended
31 December 201779 weeks ended
1 January 2017£000 £000
Interest on loan notes 47,458 72,143
Interest on shareholder loan 38,496 51,932
Amortisation of loan issue costs 2,958 4,083
Other interest payable 449 1,652
89,361 129,810
8 Staff costs
The aggregate remuneration for the employees of the Group comprised:
52 weeks ended31 December 2017
79 weeks ended 1 January 2017
£000 £000
Wages and salaries 167,490 238,968
Social security costs 11,334 14,074
Other pension costs 1,928 2,423
180,752 255,465
The average monthly number of persons (including Executive Directors) employed by the Group during the period was:
52 weeks ended31 December 2017
79 weeks ended 1 January 2017
No No
Restaurants 14,095 13,799
Central 415 418
Total average headcount 14,510 14,217
The aggregate remuneration to Directors of the Group comprised:
52 weeks ended31 December 2017
79 weeks ended 1 January 2017
£000 £000
Aggregate emoluments 876 1,182
Share-based payment charge 31 186
Compensation for loss of office 1,656 –
2,563 1,368
The compensation for loss of office includes waiver of a loan to a previous Director and settlement of the related personal tax element. See note 28 for further details.
The highest paid Director received remuneration of £358,000 (period ended 1 January 2017: £704,000) and the share-based payment charge was £31,000 (period ended 1 January 2017: £139,000).
During the period no (period ended 1 January 2017: no) Directors received shares under the long-term incentive schemes.
See note 28 for details of Key Management Personnel remuneration.
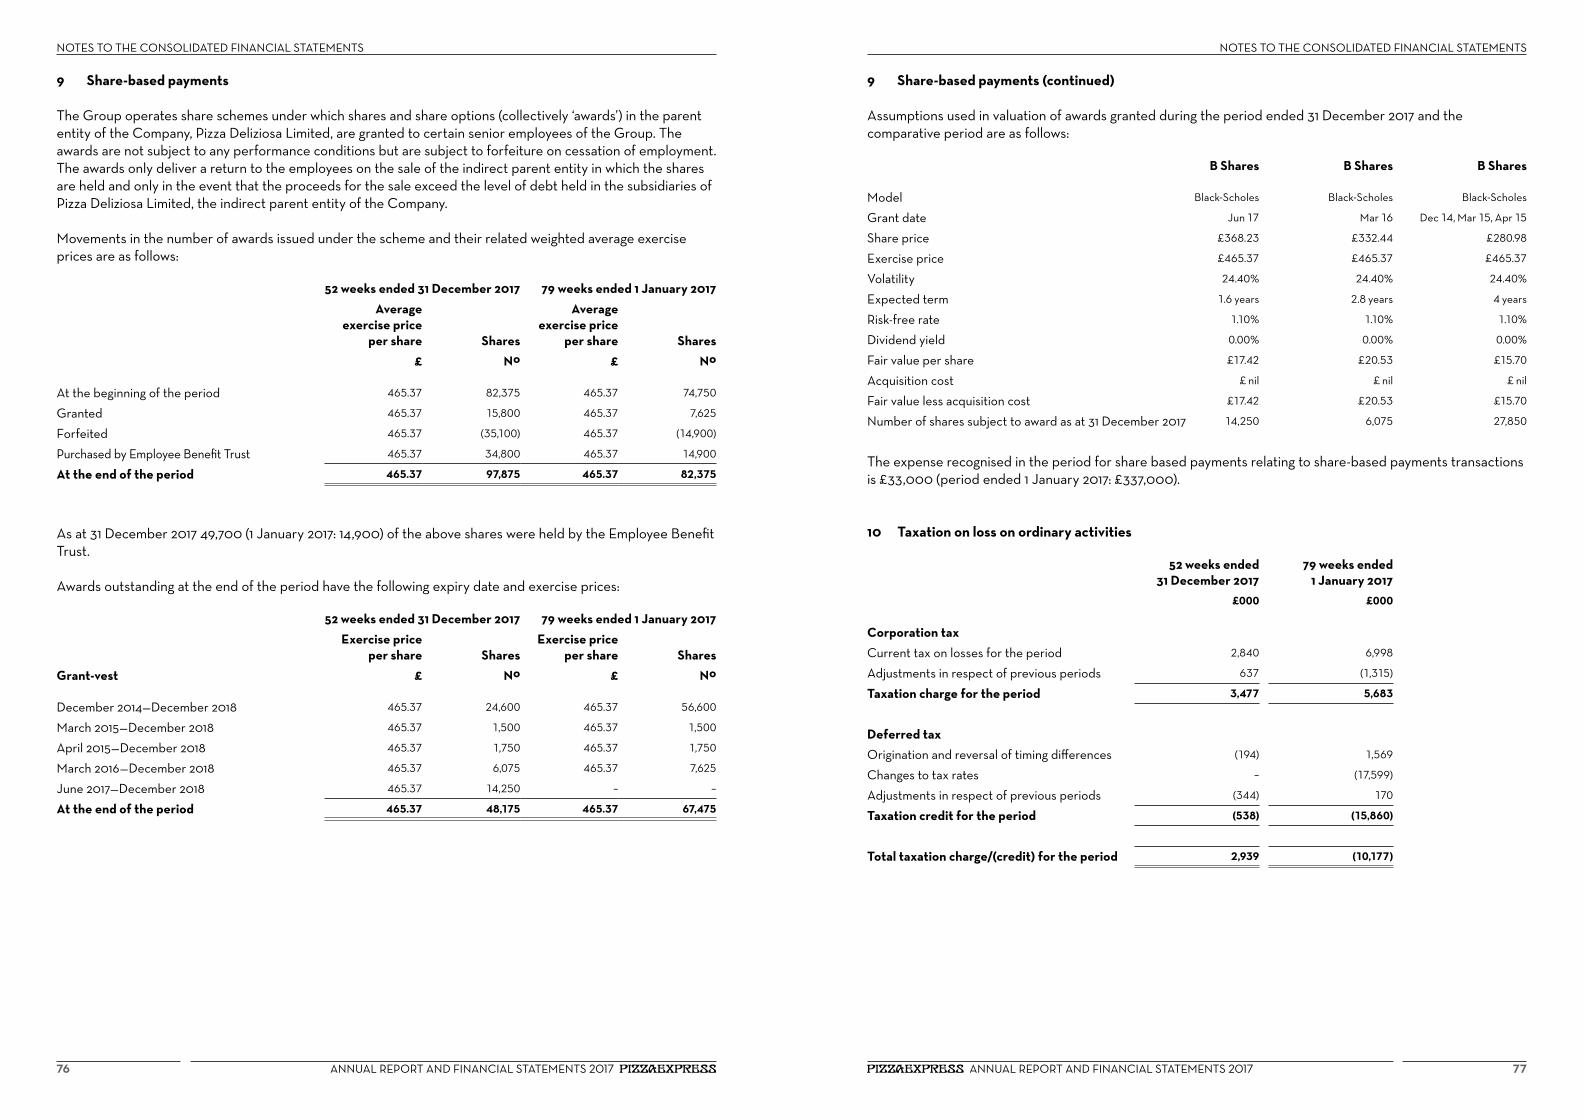
ANNUAL REPORT AND FINANCIAL STATEMENTS 2017ANNUAL REPORT AND FINANCIAL STATEMENTS 2017 7776
NOTES TO THE CONSOLIDATED FINANCIAL STATEMENTS NOTES TO THE CONSOLIDATED FINANCIAL STATEMENTS
9 Share-based payments
The Group operates share schemes under which shares and share options (collectively ‘awards’) in the parent entity of the Company, Pizza Deliziosa Limited, are granted to certain senior employees of the Group. The awards are not subject to any performance conditions but are subject to forfeiture on cessation of employment. The awards only deliver a return to the employees on the sale of the indirect parent entity in which the shares are held and only in the event that the proceeds for the sale exceed the level of debt held in the subsidiaries of Pizza Deliziosa Limited, the indirect parent entity of the Company.
Movements in the number of awards issued under the scheme and their related weighted average exercise prices are as follows:
52 weeks ended 31 December 2017 79 weeks ended 1 January 2017Average
exercise price per share Shares
Average exercise price
per share Shares£ No £ No
At the beginning of the period 465.37 82,375 465.37 74,750
Granted 465.37 15,800 465.37 7,625
Forfeited 465.37 (35,100) 465.37 (14,900)
Purchased by Employee Benefit Trust 465.37 34,800 465.37 14,900
At the end of the period 465.37 97,875 465.37 82,375
As at 31 December 2017 49,700 (1 January 2017: 14,900) of the above shares were held by the Employee Benefit Trust.
Awards outstanding at the end of the period have the following expiry date and exercise prices:
52 weeks ended 31 December 2017 79 weeks ended 1 January 2017Exercise price
per share SharesExercise price
per share SharesGrant-vest £ No £ No
December 2014—December 2018 465.37 24,600 465.37 56,600
March 2015—December 2018 465.37 1,500 465.37 1,500
April 2015—December 2018 465.37 1,750 465.37 1,750
March 2016—December 2018 465.37 6,075 465.37 7,625
June 2017—December 2018 465.37 14,250 – –
At the end of the period 465.37 48,175 465.37 67,475
9 Share-based payments (continued)
Assumptions used in valuation of awards granted during the period ended 31 December 2017 and the comparative period are as follows:
B Shares B Shares B Shares
Model Black-Scholes Black-Scholes Black-Scholes
Grant date Jun 17 Mar 16 Dec 14, Mar 15, Apr 15
Share price £368.23 £332.44 £280.98
Exercise price £465.37 £465.37 £465.37
Volatility 24.40% 24.40% 24.40%
Expected term 1.6 years 2.8 years 4 years
Risk-free rate 1.10% 1.10% 1.10%
Dividend yield 0.00% 0.00% 0.00%
Fair value per share £17.42 £20.53 £15.70
Acquisition cost £ nil £ nil £ nil
Fair value less acquisition cost £17.42 £20.53 £15.70
Number of shares subject to award as at 31 December 2017 14,250 6,075 27,850
The expense recognised in the period for share based payments relating to share-based payments transactions is £33,000 (period ended 1 January 2017: £337,000).
10 Taxation on loss on ordinary activities
52 weeks ended31 December 2017
79 weeks ended 1 January 2017
£000 £000
Corporation taxCurrent tax on losses for the period 2,840 6,998
Adjustments in respect of previous periods 637 (1,315)
Taxation charge for the period 3,477 5,683
Deferred taxOrigination and reversal of timing differences (194) 1,569
Changes to tax rates – (17,599)
Adjustments in respect of previous periods (344) 170
Taxation credit for the period (538) (15,860)
Total taxation charge/(credit) for the period 2,939 (10,177)

ANNUAL REPORT AND FINANCIAL STATEMENTS 2017ANNUAL REPORT AND FINANCIAL STATEMENTS 2017 7978
NOTES TO THE CONSOLIDATED FINANCIAL STATEMENTS NOTES TO THE CONSOLIDATED FINANCIAL STATEMENTS
10 Taxation on loss on ordinary activities (continued)
The tax assessed for the period is higher (period ended 1 January 2017: lower) than the standard rate of corporation tax in the United Kingdom of 19.25% (period ended 1 January 2017: 20.00%). The differences are reconciled below:
52 weeks ended31 December 2017
79 weeks ended 1 January 2017
£000 £000
Loss on ordinary activities before taxation (28,698) (15,023)
Loss on ordinary activities multiplied by standard rate of corporation tax in the UK of 19.25% (period ended 1 January 2017: 20.00%)
(5,524) (3,005)
Effects of:
Depreciation in excess of capital allowances /(Capital allowances in excess of depreciation)
31 (2,357)
Depreciation on non-qualifying assets 738 1,326
Interest not deductible for tax purposes 7,826 10,211
Other income not chargeable for tax purposes (439) (1,047)
Effect of overseas tax at lower rate (872) (1,888)
Timing difference relating to consolidation adjustments – (15,487)
Losses carried forward 757 2,442
Adjustments in respect of previous periods 293 (1,144)
Capital gains 129 772
Total taxation charge/(credit) for the period 2,939 (10,177)
Factors that may affect future tax chargesAny changes in the rate of UK corporation tax will have an impact on the future tax charge. Changes to the UK corporation tax rates were substantively enacted as part of Finance Bill 2016 (on 6 September 2016). These include reductions to the main rate to reduce the rate to 19% from 1 April 2017 and to 17% from 1 April 2020. These changes had been substantively enacted at the balance sheet date and therefore their impact is included in these financial statements. No further applicable changes were announced after 6 September 2016.
Based on current capital investment plans, the Group expects to be able to claim capital allowances in excess of depreciation in future years.
11 Intangible assets
1 January 2017 Goodwill TrademarksComputer
Software Brand Total £000 £000 £000 £000 £000
Cost As at 29 June 2015 377,697 199 1,687 515,000 894,583
Additions – 251 92 – 343
Acquisition of subsidiaries 1,616 – 28 3,662 5,306
Adjustment to fair values on acquisition 750 – – – 750
Adjustment to consideration (74) – – – (74)
Disposals – – (252) – (252)
Transfers – – 1,964 – 1,964
Foreign exchange 934 – 7 – 941
As at 1 January 2017 380,923 450 3,526 518,662 903,561
Accumulated amortisation
As at 29 June 2015 – – (541) – (541)
Charge for the period (continuing operations) – (34) (894) – (928)
Charge for the period (discontinued operations) – – (6) (153) (159)
Disposals – – 63 – 63
Foreign exchange – – (13) – (13)
As at 1 January 2017 – (34) (1,391) (153) (1,578)
Net book valueAs at 1 January 2017 380,923 416 2,135 518,509 901,983
As at 28 June 2015 377,697 199 1,146 515,000 894,042
31 December 2017 Goodwill TrademarksComputer
Software Brand Total £000 £000 £000 £000 £000
Cost As at 2 January 2017 380,923 450 3,526 518,662 903,561
Additions – 245 1,130 – 1,375
Disposal of subsidiaries (1,616) – (96) (3,662) (5,374)
Disposals – – (1,586) – (1,586)
Transfers – – 2,762 – 2,762
Foreign exchange (74) (17) (11) – (102)
As at 31 December 2017 379,233 678 5,725 515,000 900,636
Accumulated amortisation
As at 2 January 2017 – (34) (1,391) (153) (1,578)
Charge for the period (continuing operations) – (66) (895) – (961)
Charge for the period (discontinued operations) – – (11) (155) (166)
Disposal of subsidiaries – – 16 308 324
Disposals – – 1,567 – 1,567
Foreign exchange – 17 (2) – 15
As at 31 December 2017 – (83) (716) – (799)
Net book value
As at 31 December 2017 379,233 595 5,009 515,000 899,837
As at 1 January 2017 380,923 416 2,135 518,509 901,983

ANNUAL REPORT AND FINANCIAL STATEMENTS 2017ANNUAL REPORT AND FINANCIAL STATEMENTS 2017 8180
NOTES TO THE CONSOLIDATED FINANCIAL STATEMENTS NOTES TO THE CONSOLIDATED FINANCIAL STATEMENTS
11 Intangible assets (continued)
GoodwillThe goodwill balance has been allocated to the following cash generating units:
UK & Ireland China UAE Firezza Total£000 £000 £000 £000 £000
Cost
As at 1 January 2017 324,459 51,192 3,656 1,616 380,923
Disposal of subsidiaries – – – (1,616) (1,616)
Foreign exchange – (74) – – (74)
As at 31 December 2017 324,459 51,118 3,656 – 379,233
The goodwill recognised in relation to UK & Ireland relates to the acquisition of the ordinary share capital of PizzaExpress Operations Limited (formerly Gondola Investments Limited), PizzaExpress (Franchises) Limited and PizzaExpress Greater China Limited. The goodwill recognised in relation to China relates to PizzaExpress (Hong Kong) Limited and its subsidiaries. The goodwill recognised in relation to UAE relates to the acquisition of Jordana Restaurants llc. Each of these acquisition groups is considered to be a single cash generating unit.
The goodwill recognised as at 1 January 2017 in relation to Firezza related to the acquisition of Firezza Holdings Limited and its subsidiary. Firezza Holdings Limited and its subsidiary were disposed of on 5 November 2017. See note 25 for further details.
Each goodwill balance is tested annually for impairment by reference to value in use. This is calculated using Board-approved budgets covering a five-year period. After this five-year period the cash flows are continued into perpetuity using a growth rate specific to the market. The key assumptions are discount rate, long-term growth rate and forecast cash flows (including number of new site openings). Long-term growth rates are based on external research demonstrating expected long-term growth for each of the markets to which the goodwill relates.
The following table sets out the key assumptions used for the value in use calculation.
UK & Ireland China UAE
Discount rate 8.5% 9.5% 10.5%
Long-term growth rate 2.0% 3.0%–5.0% 3.0%
BrandThe brand recognised as an intangible asset at 31 December 2017 relates to the PizzaExpress brand. The PizzaExpress brand is considered to have an indefinite life due to the history, profit and market position of the trade name.
The intangible asset relating to the Firezza brand was disposed in the period as part of the sale of the Firezza business.
12 Property, plant and equipment
1 January 2017 Assets under construction
Short leasehold
Furniture and fittings Equipment Total
£000 £000 £000 £000 £000
Cost
As at 29 June 2015 2,594 165,856 39,568 14,658 222,676
Additions 37,748 9,654 8,261 6,919 62,582
Acquisition of subsidiaries – 784 449 – 1,233
Disposals – (9,792) (2,495) (3,056) (15,343)
Transfers (31,892) 14,656 14,054 1,218 (1,964)
Foreign exchange (977) 5,880 2,053 1,789 8,745
As at 1 January 2017 7,473 187,038 61,890 21,528 277,929
Accumulated depreciation and impairment
As at 29 June 2015 – (6,738) (3,979) (2,531) (13,248)
Charge for the period (continuing operations) – (19,577) (10,482) (7,293) (37,352)
Charge for the period (discontinued operations) – (40) (165) (53) (258)
Disposals – 6,995 1,677 2,790 11,462
Impairment charge – (812) – – (812)
Foreign exchange – (2,501) (837) (1,093) (4,431)
As at 1 January 2017 – (22,673) (13,786) (8,180) (44,639)
Net book value
As at 1 January 2017 7,473 164,365 48,104 13,348 233,290
As at 28 June 2015 2,594 159,118 35,589 12,127 209,428

ANNUAL REPORT AND FINANCIAL STATEMENTS 2017ANNUAL REPORT AND FINANCIAL STATEMENTS 2017 8382
NOTES TO THE CONSOLIDATED FINANCIAL STATEMENTS NOTES TO THE CONSOLIDATED FINANCIAL STATEMENTS
12 Property, plant and equipment (continued)
31 December 2017Assets under construction
Short leasehold
Furniture and fittings Equipment Total
£000 £000 £000 £000 £000
Cost
As at 2 January 2017 7,473 187,038 61,890 21,528 277,929
Additions 22,945 7,230 8,662 4,953 43,790
Disposal of subsidiaries (3) (2,113) (1,277) (12) (3,405)
Disposals (322) (2,088) (441) (231) (3,082)
Transfers (23,381) 9,452 7,626 3,541 (2,762)
Foreign exchange 161 (1,228) (773) (584) (2,424)
As at 31 December 2017 6,873 198,291 75,687 29,195 310,046
Accumulated depreciation and impairment
As at 2 January 2017 – (22,673) (13,786) (8,180) (44,639)
Charge for the period (continuing operations) – (14,053) (8,632) (4,980) (27,665)
Charge for the period (discontinued operations) – (152) (363) – (515)
Disposal of subsidiaries – (119) 283 – 164
Disposals – 1,081 48 90 1,219
Impairment charge – (2,226) – – (2,226)
Transfers – (19) (83) 102 –
Foreign exchange – 777 319 326 1,422
As at 31 December 2017 – (37,384) (22,214) (12,642) (72,240)
Net book value
As at 31 December 2017 6,873 160,907 53,473 16,553 237,806
As at 1 January 2017 7,473 164,365 48,104 13,348 233,290
Transfers relate to movements out of the assets under construction category to other property, plant and equipment categories and to intangibles.
The disposal of subsidiaries relates to the disposal of Firezza Holdings Limited and its subsidiary Firezza Limited on 5 November 2017. See note 25 for further details.
For the purposes of tangible asset impairment reviews, the Group considers each trading outlet to be a cash generating unit (cgu) and each cgu is reviewed annually for indicators of impairment of tangible assets. In assessing whether an asset has been impaired, the carrying value of the cgu is compared to its recoverable amount. The recoverable amount is the higher of its fair value and its value in use.
The Group estimates value in use using a discounted cash flow model. Future cash flows are based on assumptions from the business plans and cover a four-year period.
13 Investments
Investments£000
CostAs at 2 January 2017 32
Additions 142
As at 31 December 2017 174
Net book value
As at 31 December 2017 174
As at 1 January 2017 32
The increase in investments during the year relates to shares in a parent company that have been purchased by the Employee Benefit Trust (ebt). As described in note 2, the Group has control over the ebt and it is therefore consolidated within these financial statements.
14 Trade and other receivables
31 December 2017 1 January 2017£000 £000
Amounts falling after more than one yearNon-current rental deposits 4,885 2,200
Other receivables 351 209
5,236 2,409
31 December 2017 1 January 2017£000 £000
Amounts falling due within one yearTrade receivables 7,099 5,750
Prepayments 18,231 16,043
Accrued income 3,810 3,763
Taxation and social security 2,006 796
Other receivables 5,982 8,241
37,128 34,593
Other receivables falling due within one year include current rental deposits of £1,664,000 (period ended 1 January 2017: £2,849,000). At 31 December 2017 there was a provision of £87,000 (1 January 2017: £64,000) held in relation to trade receivables.
The fair value of the financial instruments included within trade and other receivables are not considered to be materially different from their carrying value, as the impact of the discounting is not significant. The fair values are based on discounted cash flows and are within level 3 of the fair value hierarchy.

ANNUAL REPORT AND FINANCIAL STATEMENTS 2017ANNUAL REPORT AND FINANCIAL STATEMENTS 2017 8584
NOTES TO THE CONSOLIDATED FINANCIAL STATEMENTS NOTES TO THE CONSOLIDATED FINANCIAL STATEMENTS
15 Inventories
31 December 2017 1 January 2017£000 £000
Food and drink 5,277 4,555
Equipment 5,745 5,172
11,022 9,727
During the period ended 1 January 2017, inventory write downs of £1,196,000 (note 5) were recognised within exceptional costs. There is no (1 January 2017: no) provision for impairment recognised in relation to inventory. Equipment relates to items utilised in the rendering of services to customers.
16 Cash and cash equivalents
31 December 2017 1 January 2017£000 £000
Cash at bank and in hand 42,552 52,008
17 Trade and other payables
31 December 2017 1 January 2017£000 £000
Amounts falling due within one yearTrade payables 23,316 20,721
Accruals 67,854 64,568
Deferred income 5,052 4,649
Other payables 2,237 2,137
Taxation and social security 13,946 17,409
112,405 109,484
The fair values of the financial instruments included within trade and other payables is not considered to be materially different from their carrying value, as the impact of the discounting is not significant. The fair values are based on discounted cash flows and are within level 3 of the fair value hierarchy.
18 Borrowings
31 December 2017 1 January 2017£000 £000
Senior Notes and Senior Secured Notes 652,836 650,315
Loan from parent 424,581 386,085
1,077,417 1,036,400
The fair value of the financial instruments included within borrowings are not considered to be materially different from their carrying value, as the impact of the discounting is not significant. The fair values are based on discounted cash flows and are within level 3 of the fair value hierarchy.
The Group’s loan facilities as at 31 December 2017 comprise:
Senior Notes and Senior Secured NotesThe loan notes comprise Senior Notes and Senior Secured Notes, in addition to debt issue costs offset against the loan balance and premiums on issue of the notes.
The Senior Secured Notes of £465,000,000 (1 January 2017: £465,000,000) carry interest at a fixed rate of 6.625% and are due for repayment at the maturity date in August 2021. The Senior Secured Notes are listed on the Irish Stock Exchange (Global Exchange Market).
Debt issue costs of £15,928,000 (1 January 2017: £15,928,000) have been capitalised and offset against the loan note principal balance. The issue costs are being amortised over the term to maturity and at 31 December 2017, unamortised issue costs amounted to £9,224,000 (1 January 2017: £11,391,000). A premium of £2,888,000 (1 January 2017: £2,888,000) has been added to the loan note liability and is being amortised over the term to maturity. At 31 December 2017 the unamortised premium was £1,810,000 (1 January 2017: £2,248,000).
The Senior Notes of £200,000,000 (1 January 2017: £200,000,000) carry interest at a fixed rate of 8.625% and are due for repayment at the maturity date in August 2022. The Senior Notes are listed on the Irish Stock Exchange (Global Exchange Market).
Debt issue costs of £7,188,000 (1 January 2017: £7,188,000) have been capitalised and offset against the loan note principal balance. The issue costs are being amortised over the term to maturity and at 31 December 2017, unamortised issue costs amounted to £4,751,000 (1 January 2017: £5,542,000).
The Senior Notes and Senior Secured Notes are secured against assets held by the Group, as explained in note 26.
Loan from parentThe loan from parent of £307,617,000 (period ended 1 January 2017: £307,617,000) is unsecured, accrues interest at a compound fixed rate of 10% per annum and is due for repayment at the maturity date in August 2024. Interest of £38,496,000 (period ended 1 January 2017: £51,932,000) was accrued against the loan during the period. The loan includes interest of £78,468,000 accrued during previous financial periods (1 January 2017: £26,536,000). Interest shall accrue and be aggregated with the principal balance until such time that the loan is repaid.
On 14 August 2015, PizzaExpress Group Holdings Limited listed the principal value of the loan from the parent of £307,617,000 on the Channel Island Stock Exchange. This did not have any impact on the terms of the loan.
18 Borrowings (continued)

ANNUAL REPORT AND FINANCIAL STATEMENTS 2017ANNUAL REPORT AND FINANCIAL STATEMENTS 2017 8786
NOTES TO THE CONSOLIDATED FINANCIAL STATEMENTS NOTES TO THE CONSOLIDATED FINANCIAL STATEMENTS
19 Provisions for liabilities and charges
52 weeks ended31 December 2017
79 weeks ended1 January 2017
£000 £000
As at the beginning of the period 1,289 2,003
Charged during the period 418 –
Acquisition of subsidiaries – 140
Disposal of subsidiaries (140) –
Utilised during the period (290) (1,009)
Release of discount 34 131
Foreign exchange movement (28) 24
As at the end of the period 1,283 1,289
Provisions for liabilities relate to onerous lease and dilapidation provisions. These provisions represent operating leases on properties no longer in use, until the end of their leases or until the Directors estimate the properties can be sublet, as well as an estimate of dilapidations payable on leases held by the Group. This provision is expected to be utilised within the next five years.
20 Deferred tax liability
52 weeks ended31 December 2017
79 weeks ended1 January 2017
£000 £000
As at the beginning of the period 100,291 115,404
Acquisition of subsidiaries – 739
Disposal of subsidiaries (690) –
Credit for the period (538) (15,860)
Foreign exchange movement 73 8
As at the end of the period 99,136 100,291
The deferred tax liability can be analysed as follows:
31 December 2017 1 January 2017£000 £000
Capital allowances in excess of depreciation 10,694 11,347
Carried forward fair value of brand on consolidation 87,550 88,172
Other timing differences 892 772
99,136 100,291
The Group expects to recover the deferred tax liability after more than 12 months.
21 Financial risk management
The main financial risks associated with the Group have been identified as liquidity risk, interest rate risk, foreign exchange risk and credit risk. The Directors are responsible for managing these risks and the policies adopted are set out below.
Liquidity riskThe Group finances its operations through a mixture of equity (Company share capital, reserves and retained earnings) and debt. The Group manages its liquidity risk by monitoring its existing facilities for both financial covenant and funding headroom against forecast requirements based on short-term and long-term cash flow forecasts. The Group’s existing facilities include an undrawn Revolving Credit Facility of £20,000,000 currently available until July 2020.
Maturity analysisThe following table sets out the contractual undiscounted maturities including estimated cash flows of the financial liabilities of the Group at 31 December 2017:
Less than 1 year
1 to 2 years
2 to 5 years
Over 5 years Total
£000 £000 £000 £000 £000
31 December 2017Loans and borrowings – – 665,000 424,581 1,089,581
Trade and other payables 80,590 – – – 80,590
80,590 – 665,000 424,581 1,170,171
1 January 2017Loans and borrowings – – 465,000 586,085 1,051,085
Trade and other payables 75,194 – – – 75,194
75,194 – 465,000 586,085 1,126,279
The £1,089,581,000 (period ended 1 January 2017: £1,051,085,000) of loans and borrowings are due for repayment as follows:
31 December 2017 1 January 2017£000 £000
August 2021 465,000 465,000
August 2022 200,000 200,000
August 2024 424,581 386,085
1,089,581 1,051,085

ANNUAL REPORT AND FINANCIAL STATEMENTS 2017ANNUAL REPORT AND FINANCIAL STATEMENTS 2017 8988
NOTES TO THE CONSOLIDATED FINANCIAL STATEMENTS NOTES TO THE CONSOLIDATED FINANCIAL STATEMENTS
Interest rate riskInterest rate risk reflects the Group’s exposure to fluctuations in interest rates in the market. All of the financial liabilities of the Group are either non-interest bearing or charged at a fixed rate of interest.
The following table sets out the interest rate risk associated with the Group’s financial liabilities at 31 December 2017:
Fixed rate
Floating rate
Non-interest bearing Total
£000 £000 £000 £000
31 December 2017Loans and borrowings 1,089,581 – – 1,089,581
Trade and other payables – – 80,590 80,590
1,089,581 – 80,590 1,170,171
1 January 2017Loans and borrowings 1,051,085 – – 1,051,085
Trade and other payables – – 74,994 74,994
1,051,085 – 74,994 1,126,079
The financial assets of the Group amounting to £62,937,000 (period ended 1 January 2017: £70,739,000) include cash and cash equivalents amounting to £42,552,000 (period ended 1 January 2017: £52,008,000) which are interest bearing. All other financial assets are non-interest bearing.
At present the Group does not manage its interest rate risk through interest rate swap contracts or any other derivatives.
Foreign currency riskThe Group is exposed to changes in foreign currency rates. Foreign exchange risk arises from future commercial transactions as the Group purchases certain goods from European suppliers. This is partially mitigated at the Group level by a subsidiary company generating income in Euros.
The Group has subsidiaries whose functional currency is not sterling and is therefore exposed to translation risk in relation to these entities.
Where the Group expects to undertake a significant transaction in a foreign currency, foreign exchange forward contracts are utilised. As the Group expects to expand internationally and will be exposed to more foreign exchange risk, it will consider whether it is appropriate to develop a hedging strategy using derivatives to manage this risk.
Credit riskThe Group’s credit risk predominantly arises from trade receivables and cash and cash equivalents.
Trade and other receivables comprise mainly card payments receivable, therefore credit risk is considered to be low. Trade and other receivables also includes rebates, franchise and royalty fees due.
Credit risk also arises on cash and cash equivalents held with banks.
An analysis of the ageing of trade receivables is given below.
31 December 2017 1 January 2017£000 £000
Current 5,670 4,960
0–30 days 526 82
30–60 days 242 555
More than 60 days 661 153
7,099 5,750
As at 31 December 2017, trade or other receivables of £87,000 were impaired (as at 1 January 2017: £64,000).
Capital managementThe Group’s policies seek to protect returns to shareholders by ensuring the Group will continue to trade profitably in the foreseeable future. The Group also aims to optimise its capital structure of debt and equity so as to minimise its cost of capital.
The capital of the Group is summarised as follows:
31 December 2017 1 January 2017£000 £000
Total borrowings 1,077,417 1,036,400
Less cash and cash equivalents (42,552) (52,008)
Net debt 1,034,865 984,392
Total equity (57,921) (15,547)
Total capital 976,944 968,845
The Group manages its capital with regard to the risks inherent in the business and the sector within which it operates by monitoring its actual cash flows against debt maturities, financial covenants and the cash flow forecasts reviewed by the Directors.
21 Financial risk management (continued) 21 Financial risk management (continued)

ANNUAL REPORT AND FINANCIAL STATEMENTS 2017ANNUAL REPORT AND FINANCIAL STATEMENTS 2017 9190
NOTES TO THE CONSOLIDATED FINANCIAL STATEMENTS NOTES TO THE CONSOLIDATED FINANCIAL STATEMENTS
22 Financial instruments
The following tables categorise the Group’s financial assets and liabilities included in the consolidated statement of financial position:
31 December 2017 1 January 2017£000 £000
Financial assetsTrade and other receivables 20,385 18,731
Cash and cash equivalents 42,552 52,008
62,937 70,739
Financial liabilitiesTrade and other payables 80,590 74,994
Loans and borrowings 1,089,581 1,051,085
1,170,171 1,126,079
The Group’s financial instruments are all measured at amortised cost. The fair value of these financial instruments is not considered to be materially different from their amortised cost value.
No available for sale financial assets or derivatives at fair value were held at 31 December 2017 or 1 January 2017.
Fair value estimationThe different levels of fair value have been defined as follows:
Level 1 Quoted prices (unadjusted) in active markets for identical assets or liabilities.
Level 2 Inputs other than quoted prices included within level 1 that are observable for the asset or liability, either directly (that is, as prices) or indirectly (that is, derived from prices).
Level 3 Inputs for the asset or liability that are not based on observable market data (that is unobservable inputs).
23 Pensions
The Group operates a defined contribution pension scheme and the pension costs charged to the statement of comprehensive income are the amounts paid by the Group to the scheme during the period.
The pension contribution recognised in the statement of comprehensive income during the period was £1,928,000 (period ended 1 January 2017: £2,423,000). Contributions totalling £230,000 (period ended 1 January 2017: £269,000) were outstanding at period end and are shown in other creditors.
24 Share capital and share premium
31 December 2017 1 January 2017No £000 No £000
Share capital100 (1 January 2017: 100) Ordinary shares of £1 each
100 – 100 –
Share premiumShare premium 4,500 4,500
The Company was incorporated on 3 July 2014 with the issue of 1 Ordinary £1 share for total consideration of £1. On 18 August 2014 a further 99 Ordinary £1 shares were issued for total consideration of £4,499,999.

ANNUAL REPORT AND FINANCIAL STATEMENTS 2017ANNUAL REPORT AND FINANCIAL STATEMENTS 2017 9392
NOTES TO THE CONSOLIDATED FINANCIAL STATEMENTS NOTES TO THE CONSOLIDATED FINANCIAL STATEMENTS
25 Discontinued operations
Firezza Holdings Limited and Firezza LimitedOn 5 November 2017, PizzaExpress Limited disposed of Firezza Holdings Limited and its subsidiary Firezza Limited. These operations have been classified as discontinued operations in accordance with ifrs 5 ‘Non-current assets held for sale and discontinued operations’.
Analysis of the result of discontinued operations is as follows:
52 weeks ended31 December 2017
79 weeks ended1 January 2017
Turnover 7,092 6,972
Expenses (9,904) (9,063)
Loss before tax of discontinued operations (2,812) (2,091)
Tax 17 82
Loss after tax of discontinued operations (2,795) (2,009)
Loss on disposal of subsidiary (6,281) –
Total loss for the year financial period from discontinued operations
(9,076) (2,009)
52 weeks ended31 December 2017
79 weeks ended1 January 2017
Cash flow
Net cash outflows from operating activities (2,070) (2,465)
Net cash outflows from investing activities (2,123) (1,001)
Total cash outflows (4,193) (3,466)
26 Contingent liabilities
Various subsidiaries in the Group are guarantors to Senior Secured Notes and Senior Notes issued by the subsidiaries PizzaExpress Financing 2 Limited and PizzaExpress Financing 1 Limited respectively. These guarantees are over substantially all of the assets held by the Group.
The amounts outstanding at the balance sheet date in relation to these notes were £477,831,000 (period ended 1 January 2017: £477,939,000) for the Senior Secured Notes and £207,192,000 (period ended 1 January 2017: £207,251,000) for the Senior Notes, including accrued interest.
Various subsidiaries are also potential guarantors to a Revolving Credit Facility (rcf) made available to PizzaExpress Financing 2 Limited, who may request that any of its subsidiaries become a guarantor to the facility. The rcf is currently not drawn down.
27 Operating lease arrangements
The Group leases restaurants, offices and warehouses under non-cancellable operating lease agreements. The lease terms are generally between 15 and 25 years, and the majority of lease agreements are renewable at the end of the lease period at market rate. At 1 January 2017, the total future value of the Group’s minimum lease payments under non-cancellable operating leases expiring in the following periods were:
31 December 2017 1 January 2017£000 £000
LesseeNot later than one year 57,841 55,778
Later than one year and no later than five years 193,667 180,279
Later than five years 304,485 299,590
555,993 535,647
LessorNot later than one year 953 1,694
Later than one year and no later than five years 3,640 3,752
Later than five years 3,032 3,792
7,625 9,238

ANNUAL REPORT AND FINANCIAL STATEMENTS 2017ANNUAL REPORT AND FINANCIAL STATEMENTS 2017 9594
NOTES TO THE CONSOLIDATED FINANCIAL STATEMENTS NOTES TO THE CONSOLIDATED FINANCIAL STATEMENTS
28 Related party transactions
As at 31 December 2017, a loan of £424,581,000 (as at 1 January 2017: £386,085,000) is outstanding which was previously received by the Company from Crystal Bright Developments Limited, the parent entity of PizzaExpress Group Holdings Limited. This loan accrues interest at a compound fixed rate of 10% per annum and is due for repayment at the maturity date in August 2024. The total loan outstanding includes interest of £38,496,000 (period ended 1 January 2017: £51,932,000) accrued during the period and interest of £78,468,000 (1 January 2017: £26,536,000) accrued during previous financial periods. Interest shall accrue and be aggregated with the principal balance until such time that the loan is repaid.
As at 1 January 2017 a loan of £825,000 made to Richard Hodgson, a previous director within the Group, was outstanding. This value is disclosed within other debtors in the financial statements as at 1 January 2017. No interest was accrued on the loan. Following the resignation of R Hodgson on 30 May 2017 the loan was waived and the related personal tax element of £605,000 was settled by the Group. There were no amounts outstanding in relation to this loan at 31 December 2017.
During the period the Group was charged £400,000 (period ended 1 January 2017: £225,000) by an indirect parent company (period ended 1 January 2017: by indirect parent companies) in relation to monitoring fees, of which £202,000 (period ended 1 January 2017: £1,000) was included in accruals at period end.
Amounts paid to Key Management Personnel, aside from those members of Key Management Personnel that were also Directors during the period, totalled £615,000 (period ended 1 January 2017: £505,000) and contributions to defined benefit pension schemes in relation to these individuals were £27,000 (period ended 1 January 2017: £29,000). The share-based payment charge was £41,000 (period ended 1 January 2017: £52,000).
29 Parent and ultimate parent undertakings
PizzaExpress Group Holdings Limited is wholly owned by Pizza Deliziosa Limited, a company registered in the Cayman Islands. PizzaExpress Group Holdings Limited is the largest group for which financial statements are prepared. Consolidated financial statements are also prepared by PizzaExpress Financing 1 plc, a direct subsidiary of the Company and the smallest group for which consolidated financial statements are prepared.
The Directors consider Crystal Bright Developments Limited, a company registered in the British Virgin Islands, to be the ultimate parent company, and private equity firm Hony Capital to be the ultimate controlling party.
30 Post balance sheet events
There are no post balance sheet events to disclose.

ANNUAL REPORT AND FINANCIAL STATEMENTS 2017ANNUAL REPORT AND FINANCIAL STATEMENTS 2017 9796
COMPANY STATEMENT OF FINANCIAL POSITION
Company Statement of Changes in EquityFor the period from 2 January 2017 to 31 December 2017
COMPANY STATEMENT OF CHANGES IN EQUITY
Company Statement of Financial PositionAs at 31 December 2017Registration number: 09115780
31 December 2017 1 January 2017Note £000 £000
Investments in subsidiaries 5 4,500 4,500
Fixed assets 4,500 4,500
Trade and other receivables falling due within one year 6 34 34
Trade and other receivables falling due after more than one year 6 424,581 386,085
Cash and cash equivalents 1 1
Current assets 424,616 386,120
Trade and other payables falling due within one year 7 (73) (73)
Current liabilities (73) (73)
Net current assets 424,543 386,047
Borrowings 8 (424,581) (386,085)
Non-current liabilities (424,581) (386,085)
Net assets 4,462 4,462
Share capital 9 – –
Share premium 9 4,500 4,500
Accumulated losses (38) (38)
As at the beginning of the financial period (38) –
Result/(loss) for the financial period attributable to equity shareholders – (38)
Total equity 4,462 4,462
The notes on pages 98 to 105 form part of these financial statements.
The financial statements on pages 96 to 105 were authorised for issue by the Board of Directors on 30 April 2018 and were signed on its behalf.
Andy PellingtonDirector
The notes on pages 98 to 105 form part of these financial statements.
Share capitalShare
premiumAccumulated
losses Total equity £000 £000 £000 £000
As at 29 June 2015 – 4,500 – 4,500
Loss for the financial period – – (38) (38)
Total comprehensive loss for the financial period
– – (38) (38)
As at 1 January 2017 – 4,500 (38) 4,462
As at 2 January 2017 – 4,500 (38) 4,462
Result for the financial period – – – –
Total comprehensive result for the financial period
– – – –
As at 31 December 2017 – 4,500 (38) 4,462

ANNUAL REPORT AND FINANCIAL STATEMENTS 2017ANNUAL REPORT AND FINANCIAL STATEMENTS 2017 9998
NOTES TO THE COMPANY FINANCIAL STATEMENTS NOTES TO THE COMPANY FINANCIAL STATEMENTS
Notes to the Company Financial StatementsFor the period from 2 January 2017 to 31 December 2017
1 General information
PizzaExpress Group Holdings Limited is a limited company limited by shares, domiciled and incorporated in the United Kingdom. The Company’s registered office is Hunton House, Highbridge Estate, Oxford Road, Uxbridge, Middlesex, ub8 1lx.
The Company is a holding company for an international chain of pizza restaurants.
2 Summary of significant accounting policies
Basis of preparationThe financial statements have been prepared in accordance with Financial Reporting Standard 101 ‘Reduced Disclosure Framework’ and the Companies Act 2006 applicable to companies reporting under frs 101 (‘frs 101’). The financial statements have been prepared on the historical cost basis.
The principal accounting policies are outlined below.
Disclosure exemptions adoptedIn the preparation of the Company only financial statements of PizzaExpress Group Holdings Limited, the following disclosure exemptions have been adopted:
• The requirements of ifrs 7 Financial Instruments: Disclosures
• Paragraph 79(a)(iv) of ias 1;
• Paragraph 73(e) of ias 16 Property, Plant and Equipment;
• The requirements of paragraphs 10(d), 10(f), 16, 38a, 38b, 38c, 38d, 40a, 40b, 40c, 40d, 111 and 134–136 of ias 1 Presentation of Financial Statements
• The requirements of ias 7 Statement of Cash Flows
• The requirements of paragraphs 30 and 31 of ias 8 Accounting Policies, Changes in Accounting Estimates and Errors
• The requirements of paragraph 17 of ias 24 Related Party Disclosures
• The requirements in ias 24 Related Party Disclosures to disclose related party transactions entered into between two or more members of a group, provided that any subsidiary which is a party to the transaction is wholly owned by such a member.
• The requirements of paragraphs 134(d)–134(f) and 135(c)–135(e) of ias 36 Impairment of Assets.
The above disclosures, where applicable, are included within the consolidated financial statements.
2 Summary of significant accounting policies (continued)
Critical accounting estimates and areas of judgmentManagement have not applied any significant estimates or judgments in the preparation of the Company financial statements.
Company statement of comprehensive incomeAs permitted by Section 408 Companies Act 2006, the Company has not presented its own statement of comprehensive income. The Company’s result for the financial period was £nil (period ended 1 January 2017: loss of £38,000) and its other comprehensive income was £nil (period ended 1 January 2017: £nil).
Investments in subsidiariesThe value of the investment in each subsidiary held by the Company is recorded at cost less any impairment in the Company’s balance sheet.
Financial instrumentsFinancial assets and financial liabilities are recognised when the Company has become a party to the contractual provisions of the instrument. Financial instruments are de-recognised when they are discharged or when the contractual terms expire. The Company’s accounting policies in respect of financial instruments transactions are explained below.
Financial assetsFinancial assets comprise cash and cash equivalents and trade and other receivables. The Company classifies all of its financial assets as loans and receivables. Loans and receivables are non-derivative financial assets with fixed or determinable payments that are not quoted in an active market. They arise principally through intercompany transactions, but also incorporate other types of contractual monetary asset. They are initially recognised at fair value plus transaction costs that are directly attributable to their acquisition or issue, and are subsequently carried at amortised cost using the effective interest rate method, less provision for impairment
Impairment provisions are recognised when there is objective evidence (such as significant financial difficulties on the part of the counterparty or default or significant delay in payment) that the Company will be unable to collect all of the amounts due under the terms receivable, the amount of such a provision being the difference between the net carrying amount and the present value of the future expected cash flows associated with the impaired receivable.
Financial liabilitiesFinancial liabilities comprise borrowings and trade and other payables. The Company classifies all of its financial liabilities as liabilities at amortised cost. Financial liabilities at amortised cost are initially recognised at fair value net of any transaction costs directly attributable to the issue of the instrument.
The Company does not hold or issue derivative financial instruments for trading purposes.

ANNUAL REPORT AND FINANCIAL STATEMENTS 2017ANNUAL REPORT AND FINANCIAL STATEMENTS 2017 101100
NOTES TO THE COMPANY FINANCIAL STATEMENTS NOTES TO THE COMPANY FINANCIAL STATEMENTS
3 Staff costs
The Company has no employees other than the Directors, who did not receive any remuneration (period ended 1 January 2017: £nil).
All Directors were remunerated by PizzaExpress Group Limited during the period. This company did not make any recharge to the Company as it is not possible to make an accurate apportionment of the Directors’ emoluments in respect of each of the companies of which they are Directors.
The Company does not operate a defined benefit pension scheme and did not make any contributions to defined contribution pension schemes for Directors. No Directors had any interests in any options for shares in the Company.
4 Audit fee
The audit fee of £3,000 (period ended 1 January 2017: £3,000) relating to the Company for the period was borne by, and included within, the financial statements of PizzaExpress Group Limited, an indirect subsidiary of the Company.
5 Investments in subsidiaries
Investments in subsidiaries
£000
Cost and net book value
As at 1 January 2017 and 31 December 2017 4,500
Name of subsidiary Country of incorporation Shares held Principal activityPizzaExpress Financing 1 plc* United Kingdom 100% FinancingPizzaExpress Financing 2 plc United Kingdom 100% FinancingPizzaExpress Group Limited United Kingdom 100% Holding CompanyPizzaExpress International Holdings Limited United Kingdom 100% Holding CompanyPizzaExpress (Franchises) Limited United Kingdom 100% International Franchises PizzaExpress Operations Limited United Kingdom 100% Holding CompanyPizzaExpress (Wholesale) Limited United Kingdom 100% DistributionPizzaExpress Merchandising Limited United Kingdom 100% Branded SalesPizzaExpress UAE Holdings Limited United Kingdom 100% Holding CompanyPizzaExpress Limited United Kingdom 100% Holding CompanyFirezza Limited† United Kingdom 100% RestaurantsFirezza Holdings Limited† United Kingdom 100% Holding CompanyAl Rollo Limited United Kingdom 100% RestaurantsPizzaExpress (Jersey) Limited Jersey 100% RestaurantsAgenbite Limited Eire 100% RestaurantsBookcash Trading Limited United Kingdom 100% RestaurantsRoll&Shake Limited United Kingdom 100% RestaurantsPizzaExpress Beijing Limited China 100% RestaurantsPizzaExpress (Restaurants) Limited United Kingdom 100% RestaurantsJordana Restaurants llc UAE 49% RestaurantsPizzaExpress (Hong Kong) Limited Hong Kong 100% RestaurantsPizzaExpress China Limited Hong Kong 100% Holding CompanyPizzaExpress Shanghai Limited China 100% RestaurantsPizzaExpress prd Limited Hong Kong 100% Holding CompanyPizzaExpress (Shenzhen) Limited China 100% RestaurantsPizzaExpress Singapore pte Limited Singapore 100% RestaurantsPandoraExpress 1 Limited United Kingdom 100% DormantPandoraExpress 2 Limited United Kingdom 100% Non tradingPandoraExpress 3 Limited United Kingdom 100% Non tradingPandoraExpress 4 Limited United Kingdom 100% Non tradingPandoraExpress 5 Limited United Kingdom 100% Non tradingPandoraExpress 6 Limited United Kingdom 100% DormantPandoraExpress 7 Limited United Kingdom 100% Non tradingRiposte Limited United Kingdom 100% Non tradingSpeed 3969 Limited United Kingdom 100% DormantWayracer Limited United Kingdom 100% DormantThe Gourmet Pizza Company Limited United Kingdom 100% DormantHalfcity Limited United Kingdom 100% DormantPizzaExpress (West) Limited Jersey 100% DormantSeptember 1993 Limited United Kingdom 100% DormantPizzaExpress (Soho) Limited United Kingdom 100% Dormant
*Direct shareholdings†Disposed of by direct parent PizzaExpress Limited on 5 November 2017

ANNUAL REPORT AND FINANCIAL STATEMENTS 2017ANNUAL REPORT AND FINANCIAL STATEMENTS 2017 103102
NOTES TO THE COMPANY FINANCIAL STATEMENTS NOTES TO THE COMPANY FINANCIAL STATEMENTS
5 Investments in subsidiaries (continued)
The registered address of all subsidiaries incorporated in the United Kingdom is Hunton House, Highbridge Estate, Oxford Road, Uxbridge, Middlesex, ub8 1lx.
The registered address of all other subsidiaries is outlined below:
Name of subsidiary Registered address
PizzaExpress Beijing Limited No 57, Xingfucun Middle Road, Chaoyang District, Beijing, China
Agenbite Limited A38 Main Street, Swords, Dublin, County Dublin, Republic of Ireland
Pizza Express (Jersey) Limited PO Box 179, 40 Esplanade, St Helier, Jersey, Channel Islands, je4 9rj
Pizza Express (West) Limited PO Box 179, 40 Esplanade, St Helier, Jersey, Channel Islands, je4 9rj
Jordana Restaurants llc 323 Oud Metha Offices, Behind Citi Bank Building Oud Metha Road, Dubai, UAE. PO Box 71274
PizzaExpress (Hong Kong) Limited No 928, 9th Floor, One Island South, 2 Heung Yip Road, Wong Chuk Hang, Hong Kong
PizzaExpress China Limited Room 2310 Dominion Centre, 43-59 Queen’s Road East, Wanchai, Hong Kong
Pizza Express prd Limited No 926, 9th Floor, One Island South, 2 Heung Yip Road, Wong Chuck Hang, Hong Kong
PizzaExpress (Shenzhen) Limited Room 02-R, 13th floor, Tower 3 of Shenzhen Kerry Plaza, 1 Zhong Xin Si Road, Futian cbd, Futian District, Shenzhen
PizzaExpress (Shanghai) Limited Room A207, No. 700 Huangpi South Road, Huangpu District, Shanghai
PizzaExpress Singapore pte Limited 60 Paya Lebar Road, #08-43, Paya Lebar Square, Singapore 409051
6 Trade and other receivables
31 December 2017 1 January 2017£000 £000
Amounts falling after more than one yearAmounts owed from Group undertakings 424,581 386,085
Amounts owed from Group undertakings due after more than one year are due from a subsidiary company and accrue interest at a compound fixed rate of 10% per annum. The principal and accrued interest is repayable on 18 August 2024.
31 December 2017 1 January 2017£000 £000
Amounts falling due within one yearAmounts owed from Group undertakings 34 34
Amounts owed from Group undertakings are charged at an interest rate of 4% on individual balances over £10,000,000 and are repayable on demand.
7 Trade and other payables
31 December 2017 1 January 2017£000 £000
Amounts falling due within one yearAmounts owed to Group undertakings 73 73
Amounts owed to Group undertakings are charged at an interest rate of 4% per annum on individual balances over £10,000,000 and are repayable on demand.
8 Borrowings
31 December 2017 1 January 2017£000 £000
Shareholder loan 424,581 386,085
The loan from parent of £307,617,000 (period ended 1 January 2017: £307,617,000)is unsecured, accrues interest at a compound fixed rate of 10% per annum and is due for repayment at the maturity date of 18 August 2024. Interest of £38,496,000 (period ended 1 January 2017: £51,932,000) was accrued against the loan during the period. The loan includes interest of £78,468,000 accrued during previous financial periods (1 January 2017: £26,536,000). Interest shall accrue and be aggregated with the principal balance until such time that the loan is repaid.
ANNUAL REPORT AND FINANCIAL STATEMENTS 2017ANNUAL REPORT AND FINANCIAL STATEMENTS 2017 105104
NOTES TO THE COMPANY FINANCIAL STATEMENTS NOTES TO THE COMPANY FINANCIAL STATEMENTS
9 Share capital and share premium
31 December 2017 1 January 2017No £000 No £000
Share capital100 (1 January 2017: 100) Ordinary shares of £1 each
100 – 100 –
Share premiumShare premium 4,500 4,500
The Company was incorporated on 3 July 2014 with the issue of 1 Ordinary £1 share for total consideration of £1. On 18 August 2014, a further 99 Ordinary £1 shares were issued for total consideration of £4,499,999.
10 Contingent liabilities
The Company did not have any contingent liabilities at 31 December 2017 or 1 January 2017.
11 Related party transactions
As at 31 December 2017, a loan of £424,581,000 (as at 1 January 2017: £386,085,000) is outstanding which was previously received by the Company from Crystal Bright Developments Limited, the parent entity of PizzaExpress Group Holdings Limited. This loan accrues interest at a compound fixed rate of 10% per annum and is due for repayment at the maturity date in August 2024. The total loan outstanding includes interest of £38,496,000 (period ended 1 January 2017: £51,932,000) accrued during the period and interest of £78,468,000 (1 January 2017: £26,536,000) accrued during previous financial periods. Interest shall accrue and be aggregated with the principal balance until such time that the loan is repaid.
As at 31 December 2017, a loan of £307,617,000 (as at 1 January 2017: £307,617,000) is outstanding which was previously made by the Company to its direct subsidiary PizzaExpress Financing 1 plc. The loan accrues interest at a compound fixed rate of 10% per annum and is due for repayment at the maturity date in August 2024. Interest of £38,496,000 (period ended 1 January 2017: £51,932,000) was accrued against the loan during the period. Interest is aggregated with the principal balance until such time that the loan is repaid, at which point the interest also becomes payable.
12 Parent and ultimate parent undertakings
PizzaExpress Group Holdings Limited is wholly owned by Pizza Deliziosa Limited, a company registered in the Cayman Islands.
The directors consider Crystal Bright Developments Limited, a company registered in the British Virgin Islands, to be the ultimate parent company, and private equity firm Hony Capital to be the ultimate controlling party.
13 Post balance sheet events
There are no post balance sheet events to disclose.