Embed Size (px)
Citation preview
Evaluation Report
on
Interference Impacts
of
Ultra Wideband Devices
on
Satellite Receiving Station
Written by: Simon S M WONG
Reviewed by: Dr Francis C M LAU Prof. Esmond C M MOK
Department of Electronic and Information Engineering
Hong Kong Polytechnic University
June 2009
Table of Content
1. Abstract ...........................................................................1
2. Introduction.....................................................................1
3. Methodology ...................................................................2
3.1. Equipment Setup.................................................................................................. 2
3.2. Theoretical Model................................................................................................ 7
3.2.1. Calculation of C/N without Interference...................................................... 7
3.2.2. Calculation of CINR with Interference........................................................ 9
3.2.3. Horizontal Plane Approximation ............................................................... 11
3.3. Relationship among BER, C/N and Video Quality............................................ 12
4. Theoretical and Experimental Results........................14
4.1. CINR Against Off-Axis Angle........................................................................... 14
4.2. CINR Against Distance...................................................................................... 16
4.3. Aggregate Interference....................................................................................... 17
5. Conclusion ....................................................................19
References
1
1. Abstract
The purpose of this report is to assess the interference potential of a commercially
available Ultra Wideband (UWB) device being deployed outdoor near a typical C-band
satellite receiving antenna. The results of field measurements were compared with those
derived by theoretical calculations. It was found that they were in pretty good agreement
with each other. When the UWB device was transmitting inside the main lobe of the dish
antenna at a distance of less than 5m, the television signal was seriously distorted and the
picture and sound qualities were unacceptable. When the UWB device was moved away
from the main lobe to side-by-side, the interference became almost negligible and the
picture resumed normal. The aggregate interference of using up to three UWB devices
operating at the same time and same location was also evaluated by field test and the
aggregate effect was noticeable. A “No UWB Device” zone of 10m radius is proposed in
this report to protect a C-band satellite television receiver free from interference possibly
caused by a UWB device operating in the WiMedia Band Group 1 and with -41.3dBm/MHz
output power spectral density. All these results will be useful for spectrum regulatory
bodies that are currently responsible for defining UWB emission limits and the
corresponding compliance measurement procedures.
2. Introduction
UWB is a fast emerging technology with many unique advantages inviting
applications for communications, radar, imaging and positioning systems. Because of its
“ultra wideband” and “underlay technology” in nature, a thorough study on its coexistence
with other wireless systems is necessary before it is widely deployed.
One of the first commercially available products is the wireless USB hub. It
employs Multi-band Orthogonal Frequency Division Multiplexing (MB-OFDM) UWB
technology with the standard first proposed by the WiMedia Alliance [1] and subsequently
adopted by the ISO/IEC, and more recently the USB Implementers Forum, Bluetooth
2
Special Interest Group and Wireless USB Promoter Group. The standard defines the
specifications for the transceivers disseminating data at up to 480Mbps within the UWB
spectrum of 3.1 to 10.6GHz.
However, the 3.4 to 4.2GHz band is mainly used by fixed satellite receiving
stations. They are mostly the Satellite Master Antenna Television (SMATV) and Television
Receive Only (TVRO) systems which are widely distributed over the Hong Kong territory.
The main objective of this project is to investigate the coexistence of the wireless USB hub
(as an example of UWB device) and a domestic satellite television system (as an example
of fixed satellite receiving station) when they are deployed outdoor, by both theoretical
evaluations and field measurements.
The field measurements were performed in December 2008 under the conditions
stipulated in the Permit No. T00335 issued by the Office of the Telecommunications
Authority (OFTA) of Hong Kong on 11 December 2008.
3. Methodology 3.1. Equipment Setup
The evaluation of impacts of UWB devices on a satellite receiver is mainly the
over-the-air interference when the UWB devices are operating around the dish antenna. A
low-cost free-to-air satellite TV receiver was used as an example of the victim being
jammed by a number of wireless USB hubs. Interference analysis on its link budgets,
carrier-to-interference-plus-noise-ratio (CINR) and bit-error-rate before forward error
correction (FEC) and after Viterbi decoding were evaluated. An assessment of the
interference model was also evaluated by field measurements.
Table 1 lists the major equipment deployed. Figures 1 and 2 illustrate their
interconnections and photo respectively. The dish antenna was setup on the rooftop of a
high-rise building near an antenna tower for easy access of its main radiation lobe pointing
to the Sinosat 3 [2] which is a satellite TV transponder with good reception in Hong Kong.
The down-converted IF signal was splitted into 2 paths. One path was connected to the Sat
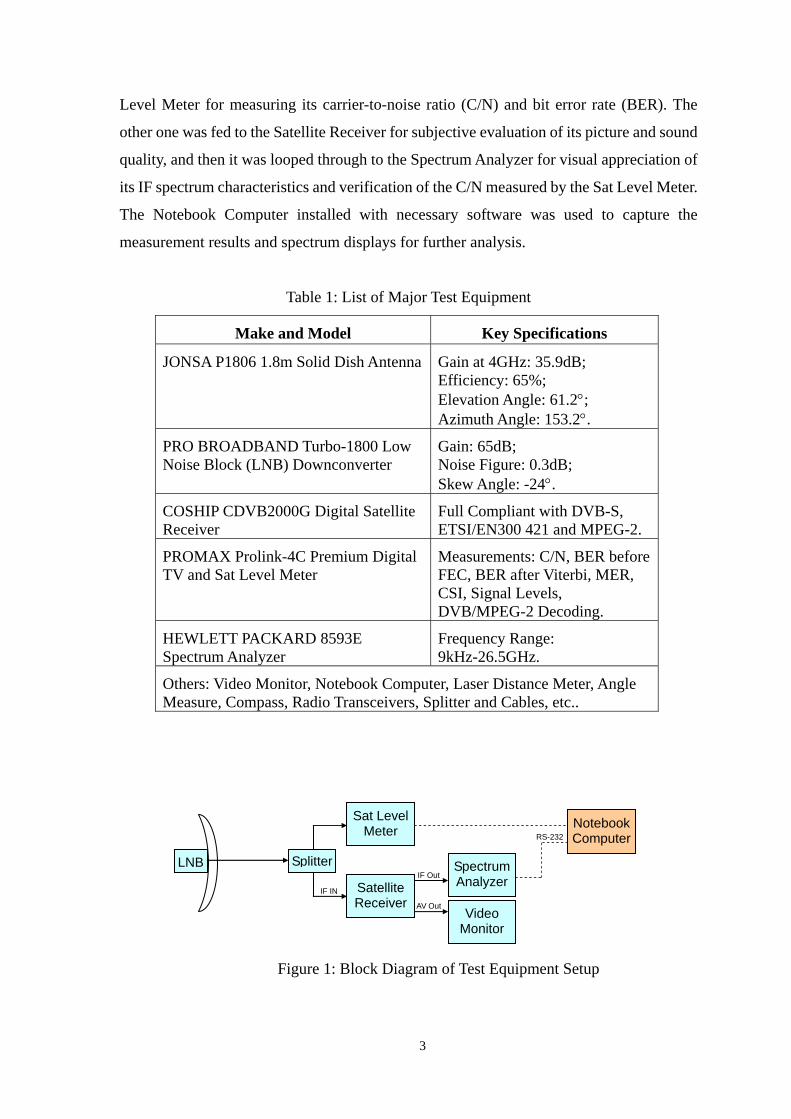
3
Level Meter for measuring its carrier-to-noise ratio (C/N) and bit error rate (BER). The
other one was fed to the Satellite Receiver for subjective evaluation of its picture and sound
quality, and then it was looped through to the Spectrum Analyzer for visual appreciation of
its IF spectrum characteristics and verification of the C/N measured by the Sat Level Meter.
The Notebook Computer installed with necessary software was used to capture the
measurement results and spectrum displays for further analysis.
Table 1: List of Major Test Equipment
Make and Model Key Specifications
JONSA P1806 1.8m Solid Dish Antenna Gain at 4GHz: 35.9dB; Efficiency: 65%; Elevation Angle: 61.2°; Azimuth Angle: 153.2°.
PRO BROADBAND Turbo-1800 Low Noise Block (LNB) Downconverter
Gain: 65dB; Noise Figure: 0.3dB; Skew Angle: -24°.
COSHIP CDVB2000G Digital Satellite Receiver
Full Compliant with DVB-S, ETSI/EN300 421 and MPEG-2.
PROMAX Prolink-4C Premium Digital TV and Sat Level Meter
Measurements: C/N, BER before FEC, BER after Viterbi, MER, CSI, Signal Levels, DVB/MPEG-2 Decoding.
HEWLETT PACKARD 8593E Spectrum Analyzer
Frequency Range: 9kHz-26.5GHz.
Others: Video Monitor, Notebook Computer, Laser Distance Meter, Angle Measure, Compass, Radio Transceivers, Splitter and Cables, etc..
Figure 1: Block Diagram of Test Equipment Setup
LNB Splitter
Sat Level Meter
SatelliteReceiver
SpectrumAnalyzer
IF IN
Notebook Computer RS-232
Video Monitor
IF Out
AV Out

4
Figure 2: Photo of Some of the Test Equipment
The UWB interference signal source was generated by the setup as shown in
Figure 3. It was comprised of a UWB USB host adaptor connected to a notebook computer
via a USB extension cable and three UWB USB hubs each connected to a USB flash drive.
The interference scenario was emulated by activating an individual disk drive test
programme running on the notebook computer for each of the flash drives. When the
programme was doing a drive reading test, the USB hub transmitted at its full speed and
hence caused most interference radiated from the antenna. The aggregate interference
scenario could be emulated by running multiple drive test programmes for the other flash
drives. Under the drive reading operation, the interference signal was dominated by that
transmitted from the USB hub instead of from the USB adaptor. To measure the output
power and spectral characteristics of the signal transmitted from USB hub, the external
antenna could be removed from the USB hub and then reconnected it to the input of a
spectrum analyzer.
Spectrum Analyzer
Video Monitor
Digital TV and Sat Level Meter
Notebook Computer
Digital Satellite Receiver
5
Figure 3: Block Diagram of UWB Interference Signal Generation
Figure 4 and 5 are the photos taken during the field test. As seen in Figure 4, one
nylon string was used as a reference line to represent the on-axis beam pointing to the
Sinosat 3, whilst another string with some distance markers on it to indicate the distance d
between the UWB devices and the LNB. A laser distance meter was used when taking the
measurement if d > 6 m. The three UWB devices were tied together and with their boresight
antenna radiation patterns always facing to the satellite dish antenna. Non-conductive
materials were used as far as possible for all the mountings and stands put in front of the
dish antenna.
Figure 6 shows the spectral display of the peak power output captured at the
antenna port of the UWB device for 10s. It can be seen that the output power spectral
density of the UWB device is approximately -41.3dBm/MHz which is the emission limit in
compliance with the regulations of many countries.
Figures 7 and 8 are the spectral displays captured at the IF output from the LNB of
the satellite receiving station. Figure 7 is at a state without interference whilst Figure 8 is
with the UWB device operating 2m away and at 90° off-axis.
LNB
UWB USB Hub
USB Flash Drive
Notebook Computer
USB Extension Cable UWB
USB HubUSB
Flash Drive
UWB USB Hub
USB Flash Drive
UWB USB Adaptor
UWB Interference
Source Victim Satellite TV Antenna
dθ To Satellite
TV Receiver
Spectrum Analyzer
Coaxial cable
6
Figure 4: Photo of Satellite Receiving Antenna
Figure 5: Photo of UWB Devices Mounted on a Non-conductive Pole
Satellite Dish Antenna
LNB On-Axis Reference Line
Off-Axis Line DistanceMarkers
Off-Axis Angle θ
UWB Devices
Non-conductive
d
7
Figure 6: Spectral Capture of Antenna Output Port of UWB Device
Figure 7: Spectral Capture of IF without Interference
Figure 8: Spectral Capture of IF with UWB Interference at 2m Off-Axis
3.2. Theoretical Model
3.2.1. Calculation of C/N without Interference
The interference analysis is started by theoretical modelling of a typical satellite
TV receiving system with the presence of a UWB device working in the overlapping
8
frequency band between 3.4 and 4.2 GHz. Table 2 shows the key parameters of the satellite
TV receiving system with parameters being configured to receive the CCTV (中央電視台)
Channel 1 transmitted from Sinosat 3.
Table 2: Parameters of Satellite TV Receiving System
Specifications Data
Satellite Sinosat 3
EIRP at Hong Kong Region 45dB W [2]
Distance between Sinosat 3 and Hong Kong ds 36,464 km
Transmitting Frequency f 4.08 GHz
Channel Bandwidth B 36 MHz
Modulation QPSK
FEC Coding 3/4 RS and Convolutional
Receive Antenna Diameter D 1.8 m
Receive Antenna Radiation Pattern ITU-R BO.1213 [3]
Receive Antenna Efficiency η 0.65
System Noise Temperature Tn 100 K [4]
Noise Figure of LNB Nf 0.3 dB
Atmospheric Loss Ls 2 dB [5]
The values of C/N are essential to determine the quality of the reception by a
satellite TV receiver. Using the free-space loss model [5], the received carrier power C is
calculated by:
maxfs aC EIRP L L G= − − + (1)
where EIRP is the effective isotropic radiated power of the satellite, Lfs and La are the free
space loss and atmospheric loss respectively, and Gmax is the maximum receive antenna
gain. Free space loss is given by:
2410log( )
195.89 dB
sfs
d fLc
π=
= (2)
where ds is the distance between Sinosat 3 and Hong Kong, and f is the downlink frequency
of CCTV Channel 1. Gmax is given by [3]:
9
2
10 log
35.85 dBi
maxDfGc
πη⎛ ⎞⎛ ⎞= ⎜ ⎟⎜ ⎟⎜ ⎟⎝ ⎠⎝ ⎠
=
(3)
where η is the antenna efficiency, and D is the antenna diameter. Hence,
45 195.89 2 35.85 117.04 dBWC = − − +
= −
The noise generated in the receiver system is given by [5]:
10log( )
132.74 dBWfN kTB N= +
= − (4)
where k is the Boltzmann’s constant (1.38x10⁻²³ W/K-Hz), T is the receive antenna
temperature, B is the bandwidth of the satellite channel, and Nf is the noise figure of the
LNB. Then the nominal C/N without interference is:
C/N (in dB) 15.7 dB
C N= −=
(5)
3.2.2. Calculation of CINR with Interference
Interference imposed on the satellite receiving system is caused by the UWB
signal emitted from the UWB device comprising a wireless USB hub and a USB adaptor.
This product has been launched recently in the commercial market. It allows computer to
wirelessly communicate at high speed with USB thumb drives, printers, scanners, etc.
Table 3 shows the key parameters of this UWB device:
Table 3: Parameters of UWB Device
Specifications Data
Made and Model IOGEAR GUWH104KIT
Frequency Band, WiMedia Band Group 1 3.168 – 4.752 GHz
Output Power Spectral Density Duwb -41.3 dBm/MHz
Antenna Gain GT 0 dBi
Duty-Cycle 0.05 at full transfer rate
With the presence of UWB device, the interference signal is now added to the
thermal noise and the C/N is modified to form the CINR. In this experiment, interference
was mainly caused by the transmission from the USB hub. Due to the nearly flat spectral
characteristics of UWB signals as seen from a narrowband satellite system, UWB
10
interference can be approximated by additive white Gaussian noise (AWGN) [6]. So, both I
and N are additive and the CINR can be expressed as follows:
CINR CI N
=+
(6)
The path-loss model of a UWB signal is represented by [7]:
10 loguwb uwb oo
dR P L nd
⎛ ⎞= − − ⎜ ⎟
⎝ ⎠ (7)
where Ruwb is the received power of the UWB signal at a distance d with effective output
power Puwb of the UWB signal source, and Lo is path-loss at reference distance do = 1m. As
recommended by IEEE 802.15.4a UWB channel modelling subgroup, n = 1.58 and Lo =
49dB for an outdoor open environment with line-of-sight. In the special case of the UWB
signal as seen by the satellite TV receiver, the effective output power Puwb is given by:
10log( ) 10log( )uwb uwb d TP D C B G= + + + (8)
where Duwb is the power spectral density of the UWB signal source, Cd is its duty cycle, B is
the channel bandwidth of the satellite receiver, and GT is the antenna gain.
The satellite dish antenna exhibits different amplifications or attenuations when
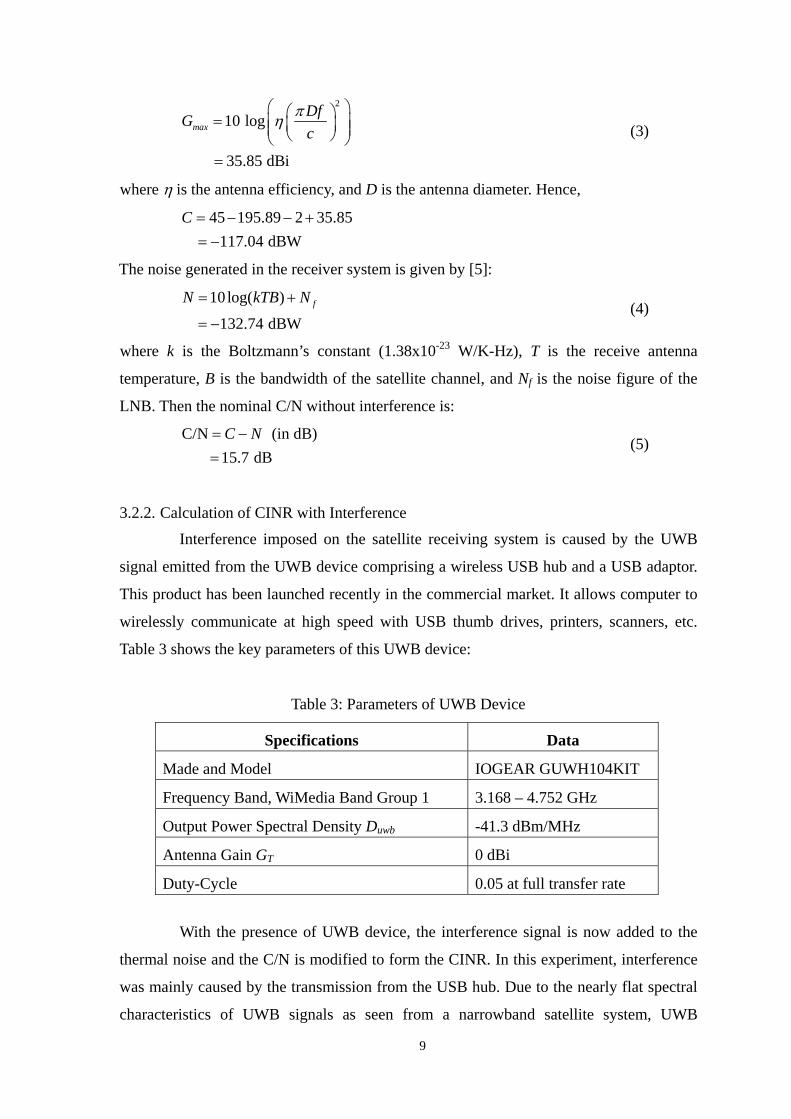
the UWB device is placed with different off-axis angle θ. The antenna radiation pattern as
recommended by ITU-R BO.1213 [3] is adopted here. Although the model was originally
developed for Ku-band broadcasting-satellite service antenna, practical experience and
measurements have shown that it is equally applicable for C-band antenna. Figure 9 plots
the antenna gain GR for the 1.8m dish antenna against the off-axis angle based on the ITU-R
BO.1213 recommendation.
The effective power of UWB signal as received by the satellite TV receiver
depends on the location of the UWB device and as a factor of its distance d away from the
LNB and the off-axis angle θ. The power of the interference I can be represented
mathematically as:
( )uwb RI R G θ= + (9)
or 10 log ( )uwb o Ro
dI P L n Gd
θ⎛ ⎞
= − − +⎜ ⎟⎝ ⎠
(10)
11
where 2
3( ) 2.5 10R maxDG Gθ θλ
− ⎛ ⎞= − × ⎜ ⎟⎝ ⎠
for 0 ≤ θ < θm (11)
1
0.0025max
mG G
Dλθ −
= (12)
G1 = 29 – 25 log θr, and 95r Dλθ = (13)
GR (θ) = G1 for θm ≤ θ < θr
GR (θ) = 29 – 25 log θ for θr ≤ θ < θb where θb = 10(34/25)
GR (θ) = –5 for θb ≤ θ < 70°
GR (θ) = 0 for 70° ≤ θ < 180°
10-1 100 101 102-10
-5
0
5
10
15
20
25
30
35
40
Off-Axis Angle [degree]
Ant
enna
Gai
n [d
Bi]
Antenna Gain Vs Off-Axis Angle
Figure 9: 1.8m Dish Antenna Radiation Pattern at 4.08 GHz
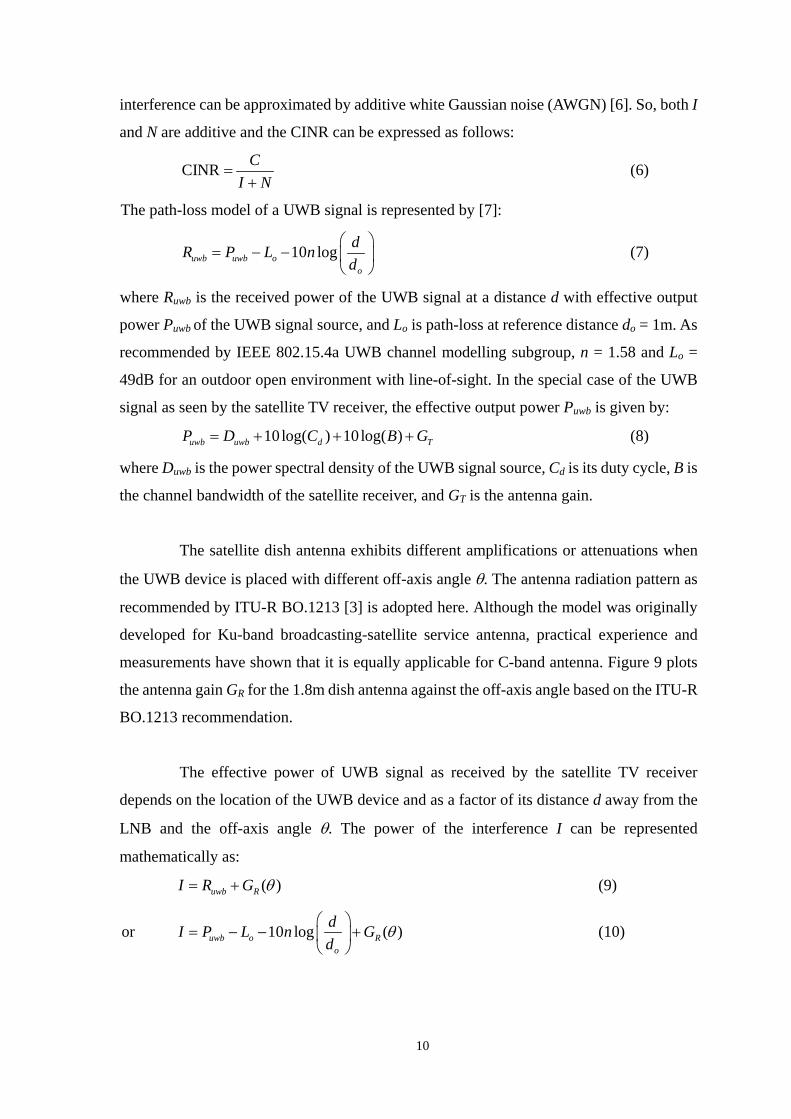
3.2.3. Horizontal Plane Approximation
As shown in Table 1, the elevation and azimuth angles of the dish antenna were
set to 61.2° and 153.2° respectively to receive the satellite signal. When making
measurements with d<5m, the antenna radiation plane was used. Figure 10 illustrates 1) the
on-axis line along which the maximum antenna gain Gmax=35.85dBi was achieved, and 2)
90° off-axis with respect to the antenna plane giving the antenna gain GR=0dBi. However, it
became very difficult to access to the locations when d>5m. In the following Section 4.2
when making off-axis measurements with d varying from 1m to 19m, the UWB devices
12
moved along the horizontal plane and in effect the antenna gain was approximated by the
90° off-axis antenna gain. The antenna plane was used throughout this report unless
otherwise specified.
Figure 10: Three-dimensional View of Dish Antenna
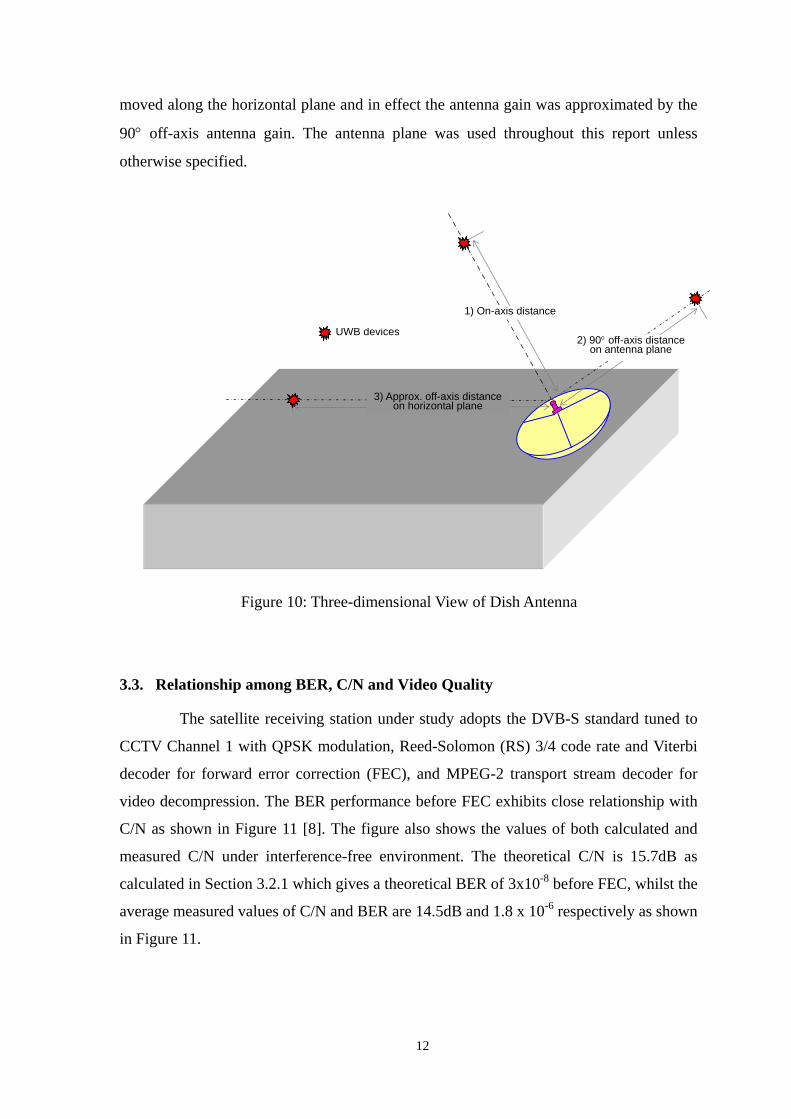
3.3. Relationship among BER, C/N and Video Quality
The satellite receiving station under study adopts the DVB-S standard tuned to
CCTV Channel 1 with QPSK modulation, Reed-Solomon (RS) 3/4 code rate and Viterbi
decoder for forward error correction (FEC), and MPEG-2 transport stream decoder for
video decompression. The BER performance before FEC exhibits close relationship with
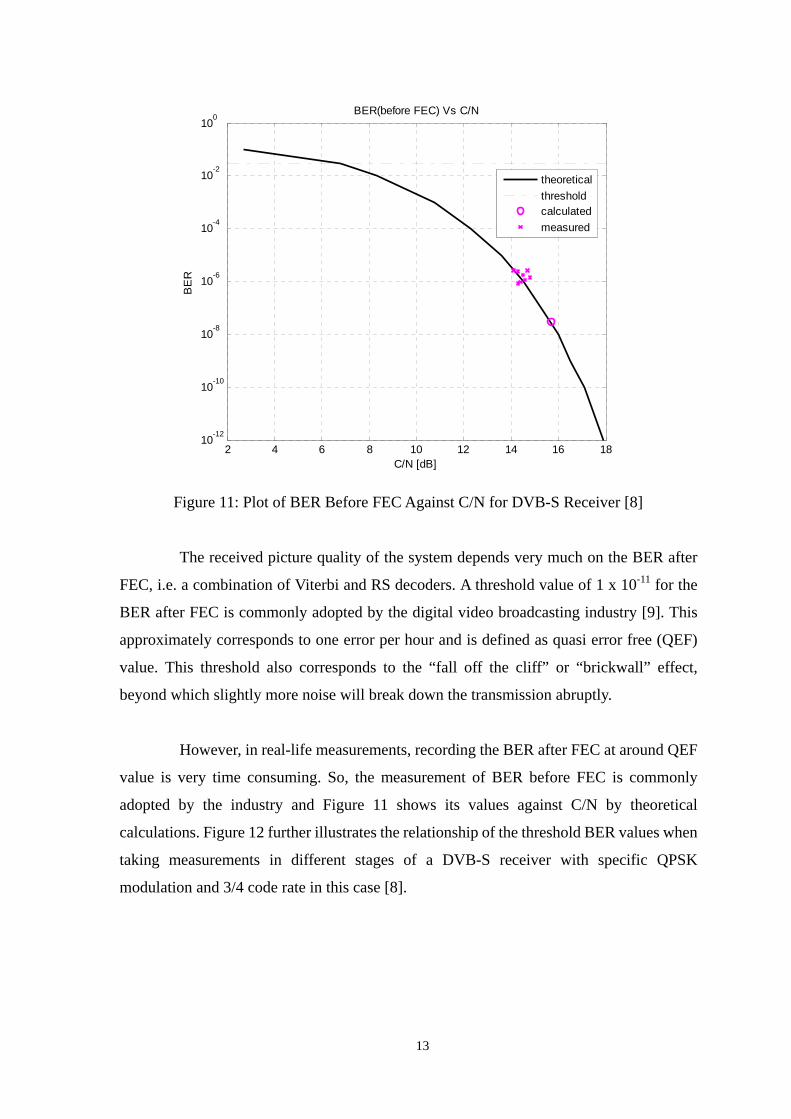
C/N as shown in Figure 11 [8]. The figure also shows the values of both calculated and
measured C/N under interference-free environment. The theoretical C/N is 15.7dB as
calculated in Section 3.2.1 which gives a theoretical BER of 3x10⁻⁸ before FEC, whilst the
average measured values of C/N and BER are 14.5dB and 1.8 x 10⁻⁶ respectively as shown
in Figure 11.
1) On-axis distance
2) 90° off-axis distanceon antenna plane
3) Approx. off-axis distanceon horizontal plane
UWB devices
13
2 4 6 8 10 12 14 16 1810-12
10-10
10-8
10-6
10-4
10-2
100
C/N [dB]
BER(before FEC) Vs C/N
BE
R
theoreticalthresholdcalculatedmeasured
Figure 11: Plot of BER Before FEC Against C/N for DVB-S Receiver [8]
The received picture quality of the system depends very much on the BER after
FEC, i.e. a combination of Viterbi and RS decoders. A threshold value of 1 x 10-11 for the
BER after FEC is commonly adopted by the digital video broadcasting industry [9]. This
approximately corresponds to one error per hour and is defined as quasi error free (QEF)
value. This threshold also corresponds to the “fall off the cliff” or “brickwall” effect,
beyond which slightly more noise will break down the transmission abruptly.
However, in real-life measurements, recording the BER after FEC at around QEF
value is very time consuming. So, the measurement of BER before FEC is commonly
adopted by the industry and Figure 11 shows its values against C/N by theoretical
calculations. Figure 12 further illustrates the relationship of the threshold BER values when
taking measurements in different stages of a DVB-S receiver with specific QPSK
modulation and 3/4 code rate in this case [8].
14
Figure 12: Required BER at Different stages for QEF Reception
For a better appreciation of the impact of the UWB interference on the TV
reception, Table 4 shows our subjective assessment of the video and audio quality against
different C/N values. The varying C/N was done by off-tuning the dish antenna under
interference free environment.
Table 4: Subjective Assessment of Video and Audio Qualities with Varying C/N
C/N [dB] Video Quality Audio Quality
< 2 No picture No sound
3 Only some colour strips Totally unreadable
4 Constant interruptions Occasional interruptions
5 Occasional interruptions Sometimes distorted
6 Very occasional artefact Almost perfect
> 7 Perfect Perfect
4. Theoretical and Experimental Results 4.1. CINR Against Off-Axis Angle
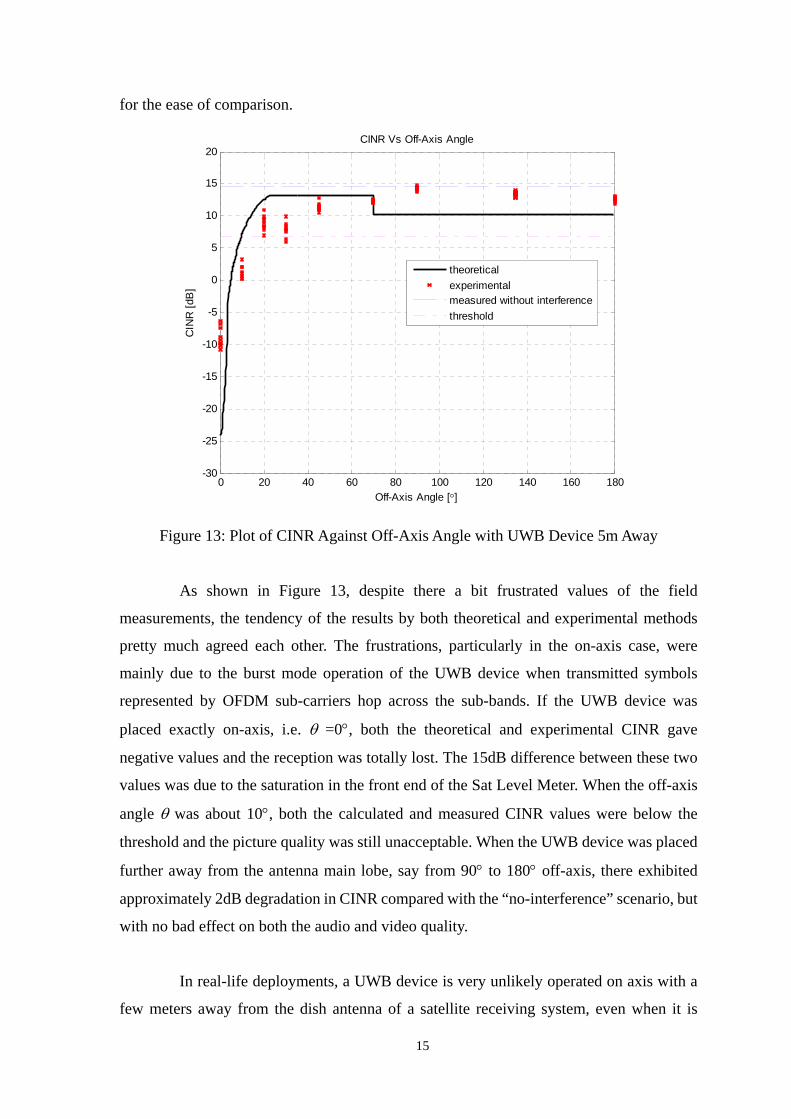
As seen in Section 3.2.2 above, the dish antenna exhibits a highly directional
characteristic with approximately 3° beamwidth. In other words, the location of the
interference source with respect to the on-axis beam of the dish antenna is also vey critical
to the CINR performance and hence the BER and picture quality. This section investigates
the interference impacts in terms of CINR when the UWB device was placed at a fixed
distance 5m away from the LNB and with a variable off-axis angles θ deviated from 0
degree (i.e. exactly in front of the dish antenna) to 180 degree (exactly behind the dish
antenna). Using the methodology as described in Section 3, the results could be obtained by
both theoretical models and field measurements, and they are plotted on the same Figure 13
DVB-S Front End
Viterbi Decoder
RS Decoder
MPEG-2 Decoder
From Satellite
C/N > 6.8dB BER after Viterbi< 2x10⁻⁴
BER after FEC< 1x10-11
Video Monitor
BER before FEC< 3x10⁻²
FEC
15
for the ease of comparison.
0 20 40 60 80 100 120 140 160 180-30
-25
-20
-15
-10
-5
0
5
10
15
20
Off-Axis Angle [°]
CIN
R [d
B]
CINR Vs Off-Axis Angle
theoreticalexperimentalmeasured without interferencethreshold
Figure 13: Plot of CINR Against Off-Axis Angle with UWB Device 5m Away
As shown in Figure 13, despite there a bit frustrated values of the field
measurements, the tendency of the results by both theoretical and experimental methods
pretty much agreed each other. The frustrations, particularly in the on-axis case, were
mainly due to the burst mode operation of the UWB device when transmitted symbols
represented by OFDM sub-carriers hop across the sub-bands. If the UWB device was
placed exactly on-axis, i.e. θ =0°, both the theoretical and experimental CINR gave
negative values and the reception was totally lost. The 15dB difference between these two
values was due to the saturation in the front end of the Sat Level Meter. When the off-axis
angle θ was about 10°, both the calculated and measured CINR values were below the
threshold and the picture quality was still unacceptable. When the UWB device was placed
further away from the antenna main lobe, say from 90° to 180° off-axis, there exhibited
approximately 2dB degradation in CINR compared with the “no-interference” scenario, but
with no bad effect on both the audio and video quality.
In real-life deployments, a UWB device is very unlikely operated on axis with a
few meters away from the dish antenna of a satellite receiving system, even when it is
16
operated in such a congested urban area in Hong Kong. So, the on-axis interference
scenario is extremely rare to happen.
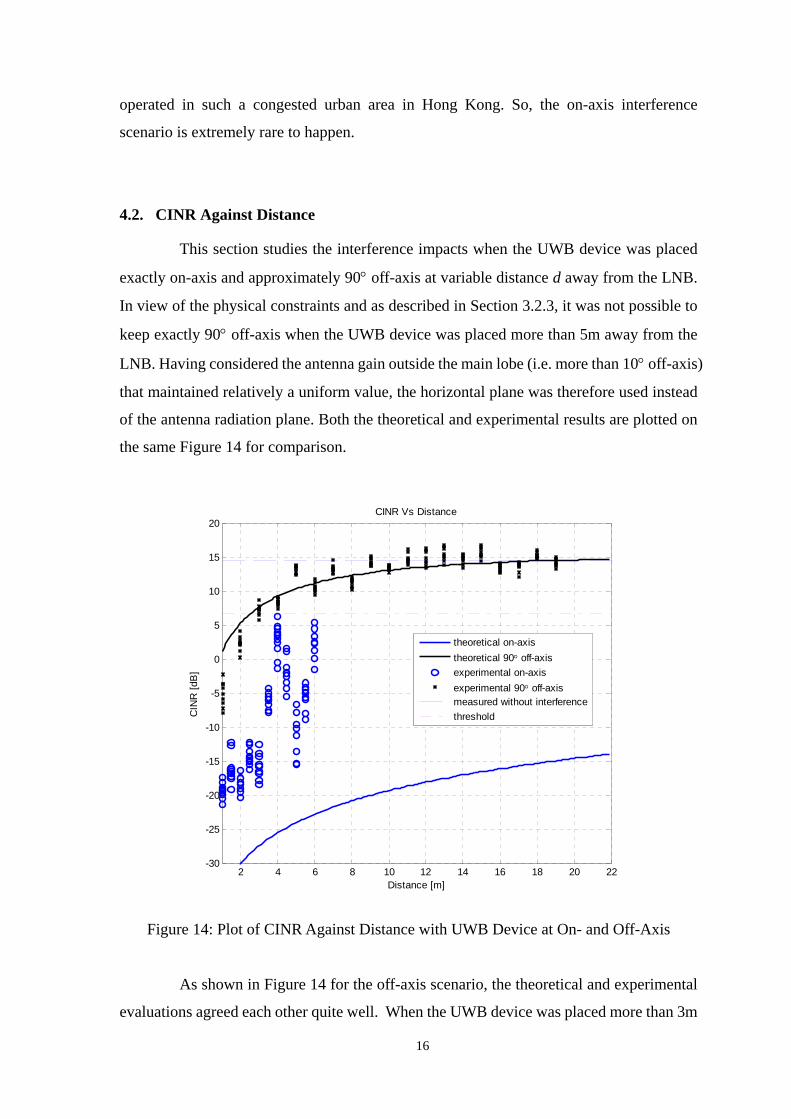
4.2. CINR Against Distance
This section studies the interference impacts when the UWB device was placed
exactly on-axis and approximately 90° off-axis at variable distance d away from the LNB.
In view of the physical constraints and as described in Section 3.2.3, it was not possible to
keep exactly 90° off-axis when the UWB device was placed more than 5m away from the
LNB. Having considered the antenna gain outside the main lobe (i.e. more than 10° off-axis)
that maintained relatively a uniform value, the horizontal plane was therefore used instead
of the antenna radiation plane. Both the theoretical and experimental results are plotted on
the same Figure 14 for comparison.
2 4 6 8 10 12 14 16 18 20 22-30
-25
-20
-15
-10
-5
0
5
10
15
20
Distance [m]
CIN
R [d
B]
CINR Vs Distance
theoretical on-axistheoretical 90° off-axisexperimental on-axisexperimental 90° off-axismeasured without interferencethreshold
Figure 14: Plot of CINR Against Distance with UWB Device at On- and Off-Axis
As shown in Figure 14 for the off-axis scenario, the theoretical and experimental
evaluations agreed each other quite well. When the UWB device was placed more than 3m
17
away from the LNB, the CINR increased beyond the threshold level. In this case, the
interference was not quite noticeable when we viewed on the video monitor. When the
UWB device was moved to 10m away, both the picture and sound quality was perfect but
with a 2dB degradation in C/N compared with the “no-interference” scenario.
However, for the on-axis scenario, both the theoretical and experimental
evaluations exhibited unacceptable results even when the UWB device was placed 6m
away, and even as far as 22m away theoretically. Again in real-life deployments, on-axis
interference is not common. It is worth to mention that there was a great discrepancy
between the theoretical and experimental results for the on-axis case. It was due to the
lower dynamic range of the Sat Level Meter or the LNB being saturated by the higher UWB
signal when the UWB device was placed unreasonably close to the front of the dish
antenna.
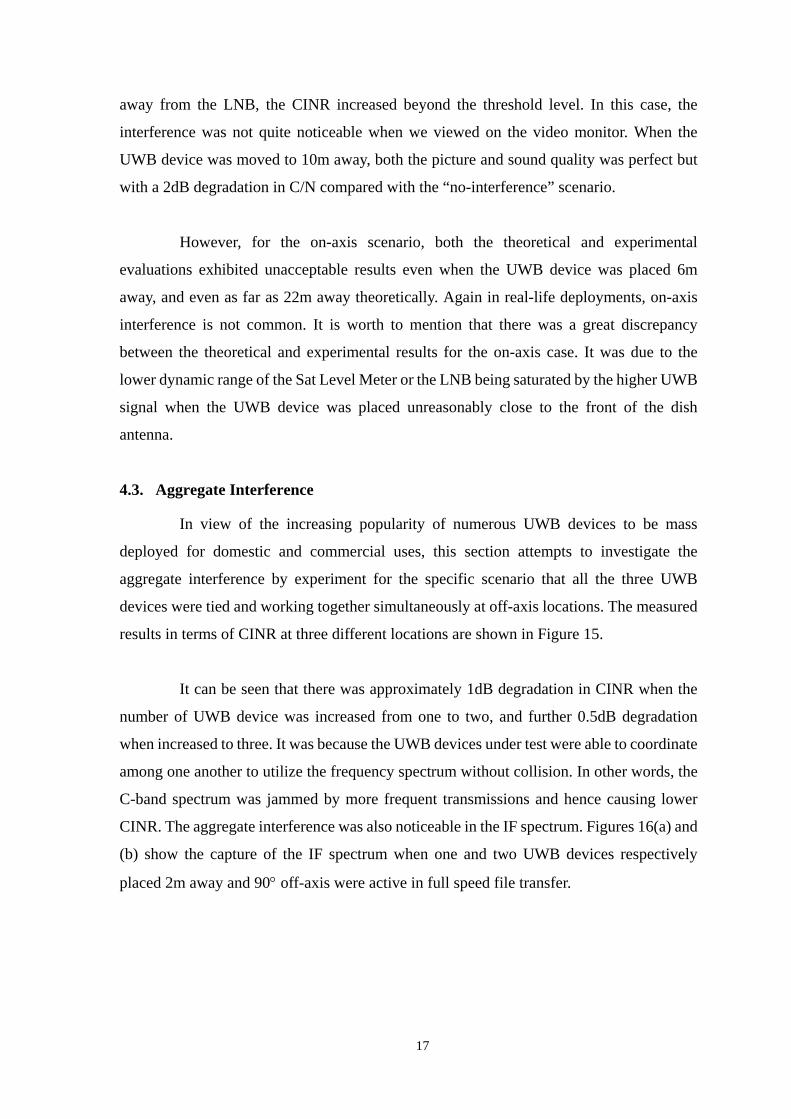
4.3. Aggregate Interference
In view of the increasing popularity of numerous UWB devices to be mass
deployed for domestic and commercial uses, this section attempts to investigate the
aggregate interference by experiment for the specific scenario that all the three UWB
devices were tied and working together simultaneously at off-axis locations. The measured
results in terms of CINR at three different locations are shown in Figure 15.
It can be seen that there was approximately 1dB degradation in CINR when the
number of UWB device was increased from one to two, and further 0.5dB degradation
when increased to three. It was because the UWB devices under test were able to coordinate
among one another to utilize the frequency spectrum without collision. In other words, the
C-band spectrum was jammed by more frequent transmissions and hence causing lower
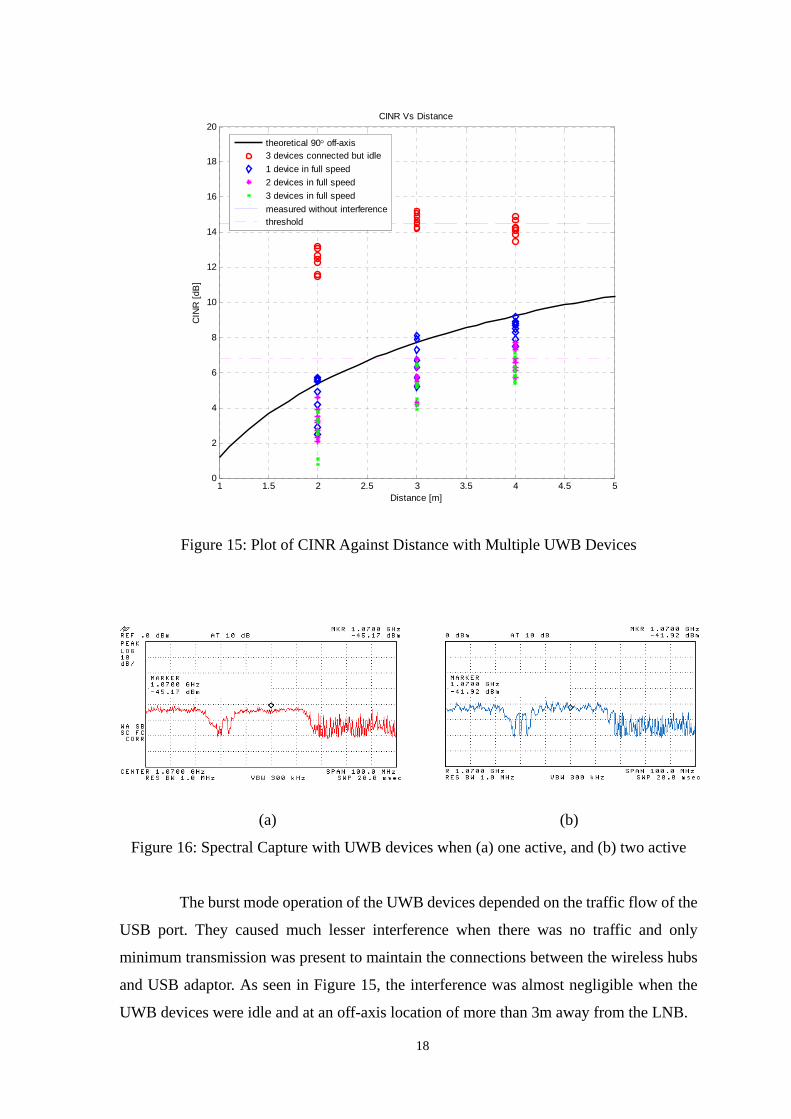
CINR. The aggregate interference was also noticeable in the IF spectrum. Figures 16(a) and
(b) show the capture of the IF spectrum when one and two UWB devices respectively
placed 2m away and 90° off-axis were active in full speed file transfer.
18
1 1.5 2 2.5 3 3.5 4 4.5 50
2
4
6
8
10
12
14
16
18
20
Distance [m]
CIN
R [d
B]
CINR Vs Distance
theoretical 90° off-axis3 devices connected but idle1 device in full speed2 devices in full speed3 devices in full speedmeasured without interferencethreshold
Figure 15: Plot of CINR Against Distance with Multiple UWB Devices
.
(a) (b)
Figure 16: Spectral Capture with UWB devices when (a) one active, and (b) two active
The burst mode operation of the UWB devices depended on the traffic flow of the
USB port. They caused much lesser interference when there was no traffic and only
minimum transmission was present to maintain the connections between the wireless hubs
and USB adaptor. As seen in Figure 15, the interference was almost negligible when the
UWB devices were idle and at an off-axis location of more than 3m away from the LNB.
19
5. Conclusion This report has presented the theoretical and experimental analysis of interference
impacts on the C-band fixed satellite receiving station caused by the commercially
available UWB devices. It was found that UWB devices did cause interference to the
station when they were operated in close proximity and particularly within the main lobe of
the antenna of the satellite receiving station. More UWB devices also caused more
interference because of their aggregated effect. If UWB devices with output power spectral
density of -41.3 dBm/MHz are to operate at the C-band, we should not allow such devices
to go near to the C-band TV satellite receiver. If they are as close as 2m side-by-side away
from the dish antenna, the TV picture may be frozen. If they are placed 5m away,
interference may not be noticeable but the fade margin will be degraded by approximately
2~4 dB. If they are moved to 10m away, the interference effect can be negligible. So,
preferable a “No UWB Device” zone with radius at least 10m should be declared
surrounding the dish antenna of satellite receiver.
However, in real world deployments, such UWB devices are usually used indoor
and are very unlikely operated in front of and closed to the antenna of a satellite receiving
station. Also, if appropriate interference mitigation techniques are employed and operated
outside a pre-defined “No UWB Device” zone or limiting the spectral density of the
emissions in the C-band down to -70 dBm/MHz as suggested by the spectrum regulators of
Hong Kong [10] and many other countries, the interference impacts caused by the UWB
device on the C-band satellite receiving stations should not be noticeable in normal
circumstances.
20
References
1. WiMedia Alliance Web Site, http://www.wimedia.org. 2. Sinosat Web Site, http://www.sinosatcom.com.
3. ITU-R, “Reference Receiving Earth Station Antenna Pattern for the
Broadcasting-Satellite Service in the 11.7-12.75 GHZ Band”, Recommendation ITU-R BO.1213-1, 2005.
4. ITU-R, “Apportionment of the Allowable Error Performance Degradation to
Fixed Satellite Service (FSS) Hypothetical Reference Digital Paths Arising from Time Invariant Interference for Systems Operating Below 30 GHz”, Recommendation ITU-R S.1432-1, 2006.
5. Bernard Sklar, “Digital Communications: Fundamentals and Applications”,
Prentice Hall, 2nd Edition, Prentice Hall, 2001.
6. S.M. Wong, F.C.M. Lau, “Passband Simulation of Interference Impacts in the Presence of Ultra Wideband and Narrowband Systems”, Proceedings, The 10th International Conference on Advanced Communication Technology (ICACT 2008), Phoenix Park, Korea, Feb 2008, pp. 569-574.
7. T.S. Rappaport, “Wireless Communications: Principles and Practice”, 1st
Edition, Prentice Hall, 1996.
8. W. Fischer, “Transmitting Digital Television Signals by Satellite – DVB-S/S2”, Book Chapter of Digital Video and Audio Broadcasting Technology A Practical Engineering Guide, 2nd Edition, Springer Berlin Heidelberg, 2008.
9. ETSI, “Digital Video Broadcasting (DVB) Measurement Guidelines for DVB
Systems” ETSI Technical Report ETSI TR 101 290 V.1.2.1, European Telecommunications Standards Institute, 2001-2005.
10. OFTA, “Consultation Paper Creation of a Class License for Ultra-Wideband
Radiocommunications Devices Under Section 7B(2) of the Telecommunications Ordinance (Cap. 106)”, Office of the Telecommunications Authority, 20 March 2009.