Embed Size (px)
Citation preview
2nd QUARTER 2013
InvestorBriefing No. 281 | July 23, 2013
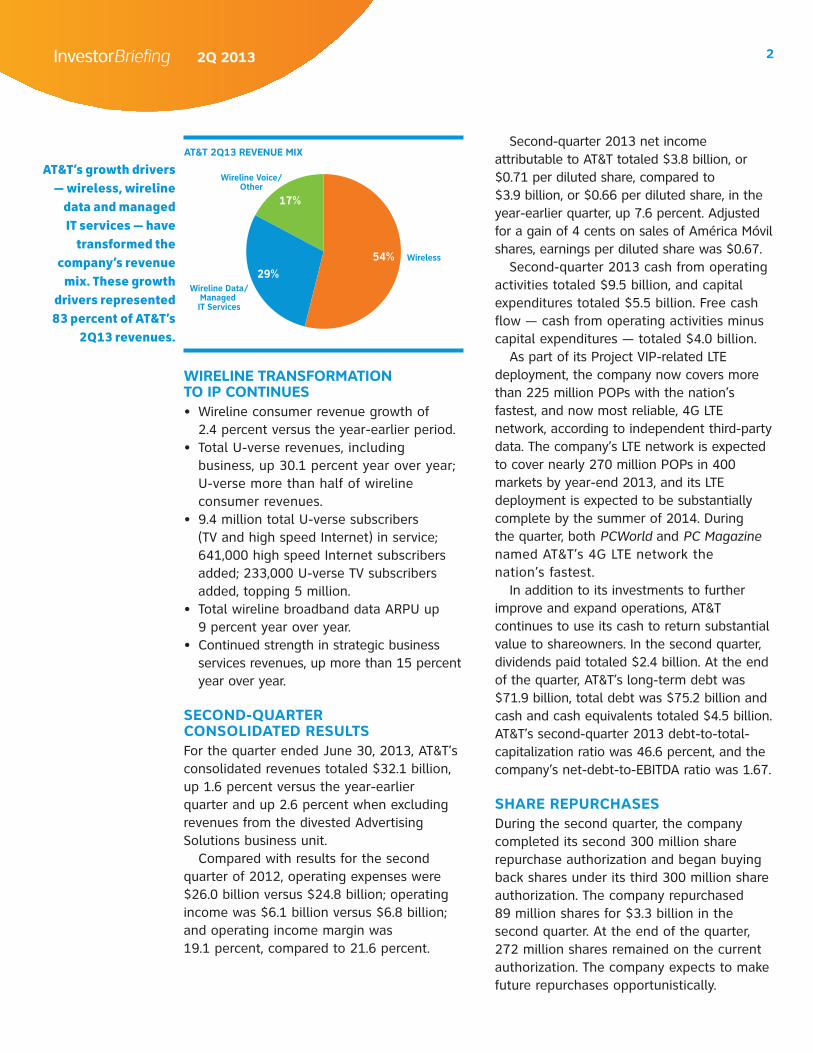
AT&T Inc. today reported continued earnings gains for the second quarter with increasing revenue growth driven by strong mobile data growth, solid postpaid net adds and continued strong gains in wireline consumer and U-verse services.
Highlights included:• $0.71 diluted EPS compared to $0.66 diluted EPS in the second quarter of
2012, up 7.6 percent. Excluding significant items, EPS was $0.67.• Consolidated revenues of $32.1 billion, up 1.6 percent versus reported results
for the year-earlier period, and up 2.6 percent adjusting for the sale of Advertising Solutions.
• More than 2 million new wireless and wireline high speed broadband connections.
NATION’S FASTEST AND MOST RELIABLE 4G LTE NETWORK DRIVING SUBSCRIBER AND USAGE GROWTH• 551,000 wireless postpaid net adds, best second-quarter postpaid net adds
in four years.• 35 percent of postpaid smartphone base LTE capable.• Smartphone data usage per device up 50 percent year over year.• LTE network expected to cover nearly 270 million POPs in 400 markets by
year-end.• LTE network build expected to be substantially complete by summer 2014.
STRONG WIRELESS REVENUE GROWTH, RECORD SECOND-QUARTER SMARTPHONE SALES• Wireless revenues up 5.7 percent, service revenues up 4.1 percent versus the
year-ago quarter.• Wireless data revenues up 19.8 percent versus the year-earlier period.• Wireless operating income margin of 27.1 percent; wireless EBITDA service
margin of 42.4 percent reflecting record second-quarter smartphone sales of 6.8 million, including record Android sales.
• Added 1.2 million new smartphone subscribers; smartphones 88 percent of postpaid phone sales.
• Total postpaid ARPU up 1.8 percent; phone-only ARPU up 3.0 percent.
AT&T’s second-quarter
results were led by strong
growth in wireless and
in wireline consumer
revenues, strong postpaid
net adds, solid high speed
IP gains and accelerating
growth in strategic
business services.
AT&T Reports Solid Revenue Growth on Strong Wireless Gains Driven by Quality Network Performance and Continued U-verse Growth
InvestorBriefing 2Q 2013 2
Second-quarter 2013 net income attributable to AT&T totaled $3.8 billion, or $0.71 per diluted share, compared to $3.9 billion, or $0.66 per diluted share, in the year-earlier quarter, up 7.6 percent. Adjusted for a gain of 4 cents on sales of América Móvil shares, earnings per diluted share was $0.67.
Second-quarter 2013 cash from operating activities totaled $9.5 billion, and capital expenditures totaled $5.5 billion. Free cash flow — cash from operating activities minus capital expenditures — totaled $4.0 billion.
As part of its Project VIP-related LTE deployment, the company now covers more than 225 million POPs with the nation’s fastest, and now most reliable, 4G LTE network, according to independent third-party data. The company’s LTE network is expected to cover nearly 270 million POPs in 400 markets by year-end 2013, and its LTE deployment is expected to be substantially complete by the summer of 2014. During the quarter, both PCWorld and PC Magazine named AT&T’s 4G LTE network the nation’s fastest.
In addition to its investments to further improve and expand operations, AT&T continues to use its cash to return substantial value to shareowners. In the second quarter, dividends paid totaled $2.4 billion. At the end of the quarter, AT&T’s long-term debt was $71.9 billion, total debt was $75.2 billion and cash and cash equivalents totaled $4.5 billion. AT&T’s second-quarter 2013 debt-to-total-capitalization ratio was 46.6 percent, and the company’s net-debt-to-EBITDA ratio was 1.67.
SHARE REPURCHASESDuring the second quarter, the company completed its second 300 million share repurchase authorization and began buying back shares under its third 300 million share authorization. The company repurchased 89 million shares for $3.3 billion in the second quarter. At the end of the quarter, 272 million shares remained on the current authorization. The company expects to make future repurchases opportunistically.
WIRELINE TRANSFORMATION TO IP CONTINUES• Wireline consumer revenue growth of
2.4 percent versus the year-earlier period.• Total U-verse revenues, including
business, up 30.1 percent year over year; U-verse more than half of wireline consumer revenues.
• 9.4 million total U-verse subscribers (TV and high speed Internet) in service; 641,000 high speed Internet subscribers added; 233,000 U-verse TV subscribers added, topping 5 million.
• Total wireline broadband data ARPU up 9 percent year over year.
• Continued strength in strategic business services revenues, up more than 15 percent year over year.
SECOND-QUARTER CONSOLIDATED RESULTSFor the quarter ended June 30, 2013, AT&T’s consolidated revenues totaled $32.1 billion, up 1.6 percent versus the year-earlier quarter and up 2.6 percent when excluding revenues from the divested Advertising Solutions business unit.
Compared with results for the second quarter of 2012, operating expenses were $26.0 billion versus $24.8 billion; operating income was $6.1 billion versus $6.8 billion; and operating income margin was 19.1 percent, compared to 21.6 percent.
USE THESE
AT&T 2Q13 REVENUE MIX
Page ONE
Wireless
Wireline Data/Managed IT Services
AT&T Dark Blue AT&T Burgundy AT&T Purple AT&T Lime Green AT&T Green
AT&T Secondary Colors (use for arcs, backgrounds and type)
AT&T Dusty Blue AT&T Ochre AT&T Magenta AT&T Royal Blue AT&T Yellow
AT&T Teal AT&T Warm Gray
AT&T Gold
AT&T Taupe AT&T Light Blue AT&T Mint Green
AT&T Accent Colors (use for type and highlights only)
54%29%
17%
Wireline Voice/Other
Other
AT&T’s growth drivers — wireless, wireline
data and managed IT services — have
transformed the company’s revenue
mix. These growth drivers represented 83 percent of AT&T’s
2Q13 revenues.
3InvestorBriefing 2Q 2013
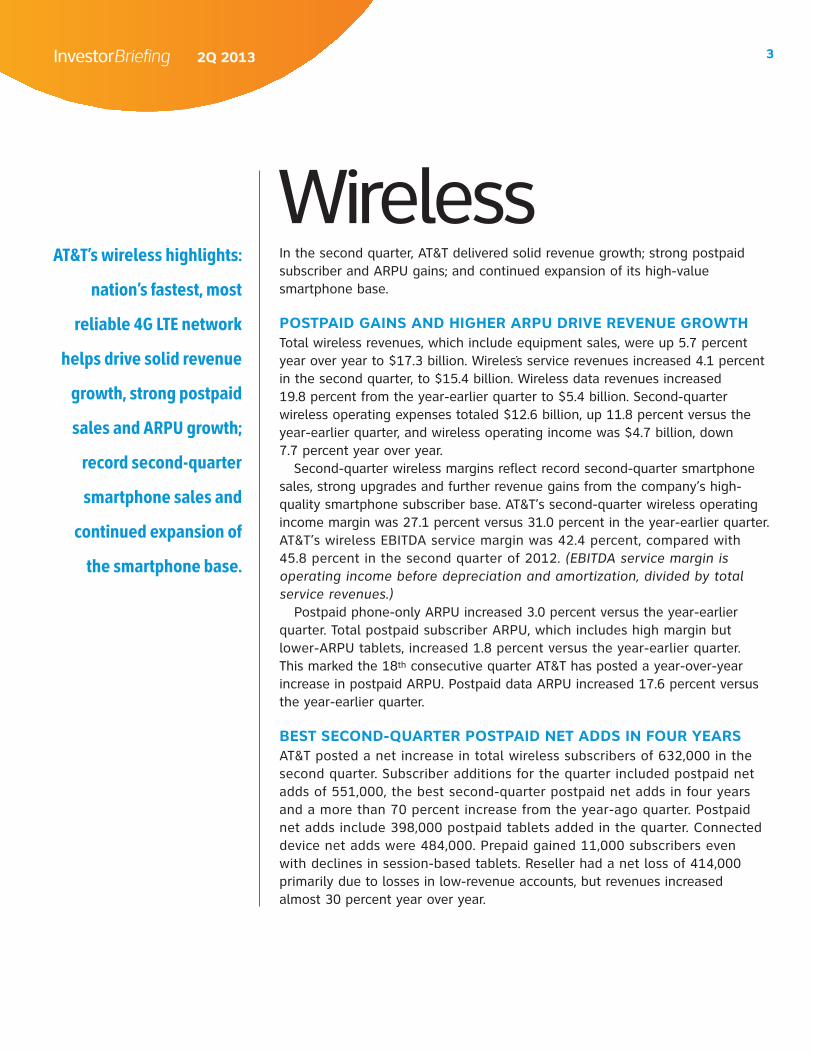
In the second quarter, AT&T delivered solid revenue growth; strong postpaid subscriber and ARPU gains; and continued expansion of its high-value smartphone base.
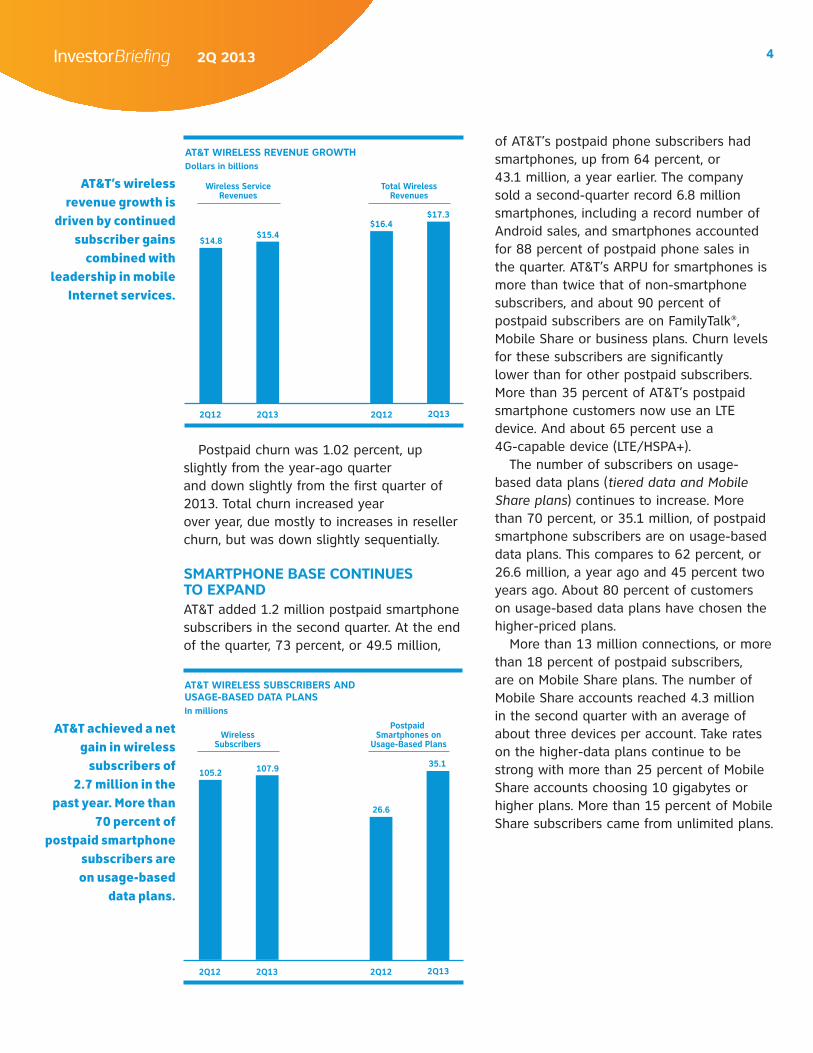
POSTPAID GAINS AND HIGHER ARPU DRIVE REVENUE GROWTH Total wireless revenues, which include equipment sales, were up 5.7 percent year over year to $17.3 billion. Wireless service revenues increased 4.1 percent in the second quarter, to $15.4 billion. Wireless data revenues increased 19.8 percent from the year-earlier quarter to $5.4 billion. Second-quarter wireless operating expenses totaled $12.6 billion, up 11.8 percent versus the year-earlier quarter, and wireless operating income was $4.7 billion, down 7.7 percent year over year.
Second-quarter wireless margins reflect record second-quarter smartphone sales, strong upgrades and further revenue gains from the company’s high-quality smartphone subscriber base. AT&T’s second-quarter wireless operating income margin was 27.1 percent versus 31.0 percent in the year-earlier quarter. AT&T’s wireless EBITDA service margin was 42.4 percent, compared with 45.8 percent in the second quarter of 2012. (EBITDA service margin is operating income before depreciation and amortization, divided by total service revenues.)
Postpaid phone-only ARPU increased 3.0 percent versus the year-earlier quarter. Total postpaid subscriber ARPU, which includes high margin but lower-ARPU tablets, increased 1.8 percent versus the year-earlier quarter. This marked the 18th consecutive quarter AT&T has posted a year-over-year increase in postpaid ARPU. Postpaid data ARPU increased 17.6 percent versus the year-earlier quarter.
BEST SECOND-QUARTER POSTPAID NET ADDS IN FOUR YEARSAT&T posted a net increase in total wireless subscribers of 632,000 in the second quarter. Subscriber additions for the quarter included postpaid net adds of 551,000, the best second-quarter postpaid net adds in four years and a more than 70 percent increase from the year-ago quarter. Postpaid net adds include 398,000 postpaid tablets added in the quarter. Connected device net adds were 484,000. Prepaid gained 11,000 subscribers even with declines in session-based tablets. Reseller had a net loss of 414,000 primarily due to losses in low-revenue accounts, but revenues increased almost 30 percent year over year.
AT&T’s wireless highlights:
nation’s fastest, most
reliable 4G LTE network
helps drive solid revenue
growth, strong postpaid
sales and ARPU growth;
record second-quarter
smartphone sales and
continued expansion of
the smartphone base.
Wireless
InvestorBriefing 2Q 2013 4
of AT&T’s postpaid phone subscribers had smartphones, up from 64 percent, or 43.1 million, a year earlier. The company sold a second-quarter record 6.8 million smartphones, including a record number of Android sales, and smartphones accounted for 88 percent of postpaid phone sales in the quarter. AT&T’s ARPU for smartphones is more than twice that of non-smartphone subscribers, and about 90 percent of postpaid subscribers are on FamilyTalk®, Mobile Share or business plans. Churn levels for these subscribers are significantly lower than for other postpaid subscribers. More than 35 percent of AT&T’s postpaid smartphone customers now use an LTE device. And about 65 percent use a 4G-capable device (LTE/HSPA+).
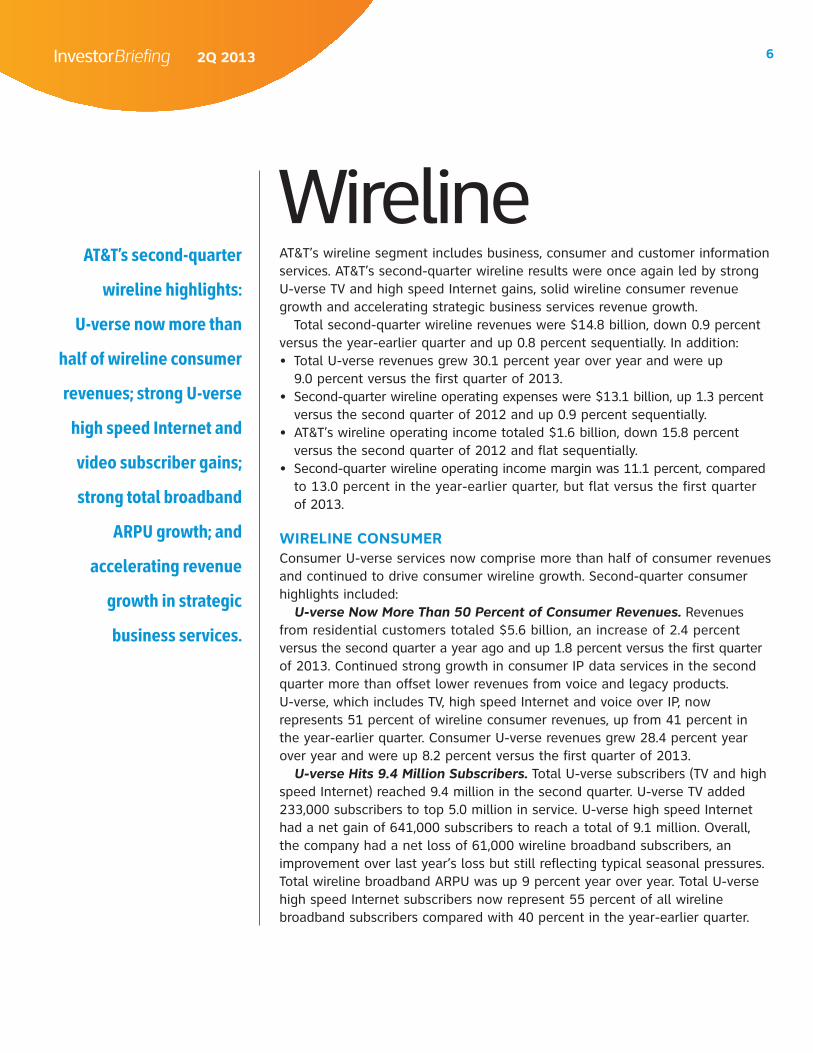
The number of subscribers on usage-based data plans (tiered data and Mobile Share plans) continues to increase. More than 70 percent, or 35.1 million, of postpaid smartphone subscribers are on usage-based data plans. This compares to 62 percent, or 26.6 million, a year ago and 45 percent two years ago. About 80 percent of customers on usage-based data plans have chosen the higher-priced plans.
More than 13 million connections, or more than 18 percent of postpaid subscribers, are on Mobile Share plans. The number of Mobile Share accounts reached 4.3 million in the second quarter with an average of about three devices per account. Take rates on the higher-data plans continue to be strong with more than 25 percent of Mobile Share accounts choosing 10 gigabytes or higher plans. More than 15 percent of Mobile Share subscribers came from unlimited plans.
Postpaid churn was 1.02 percent, up slightly from the year-ago quarter and down slightly from the first quarter of 2013. Total churn increased year over year, due mostly to increases in reseller churn, but was down slightly sequentially.
SMARTPHONE BASE CONTINUES TO EXPANDAT&T added 1.2 million postpaid smartphone subscribers in the second quarter. At the end of the quarter, 73 percent, or 49.5 million,
USE THESE
2Q12 2Q13 2Q12 2Q13
$14.8$15.4
$16.4$17.3
AT&T WIRELESS REVENUE GROWTHDollars in billions
Wireless ServiceRevenues
Total WirelessRevenues
AT&T’s wireless revenue growth is
driven by continued subscriber gains
combined with leadership in mobile
Internet services.
USE THESE
0.000000
12.222199
24.444399
36.666598
48.888798
61.110997
73.333197
85.555396
97.777596
109.999795
0
5
10
15
20
25
30
35
2Q12 2Q13 2Q12 2Q13
105.2 107.9
26.6
35.1
AT&T WIRELESS SUBSCRIBERS AND USAGE-BASED DATA PLANSIn millions
WirelessSubscribers
Postpaid Smartphones on
Usage-Based Plans
AT&T achieved a net gain in wireless
subscribers of 2.7 million in the
past year. More than 70 percent of
postpaid smartphone subscribers are on usage-based
data plans.

InvestorBriefing 2Q 2013 5
• Expanded AT&T’s 4G LTE smartphone portfolio with the addition of the Samsung Galaxy S® 4 ActiveTM, the BlackBerry® Q10TM, LG Optimus G ProTM, the HTC One® and the HTC FirstTM, the first smartphone to feature Facebook Home.
• Launched 4G LTE service for AT&T GoPhone prepaid wireless customers, as well as new GoPhone smartphone plans. Also introduced new 4G LTE GoPhone device, the Samsung Galaxy ExpressTM.
WIRELESS INNOVATION: APPLICATIONS AND DEVICESAT&T is a market leader in mobile Internet, delivering to customers expanded choice in devices, services and applications and giving businesses a mobility advantage through applications, enablers and machine-to-machine devices. In recent weeks, the company:• Announced the launch of AT&T Next.
Beginning nationwide on July 26, consumers can get a new AT&T smartphone or tablet every year with no down payment, no activation fee, no upgrade fee and no financing fees.
• Rolled out AT&T Digital Life, a new home security and automation service, in 33 markets, with plans to introduce Digital Life in up to 50 markets by the end of 2013.
• Was named America’s fastest 4G LTE network by PC Magazine as a result of wireless Internet speed tests in 30 U.S. markets. Also, for the second consecutive year, AT&T’s 4G LTE network received top ranking in PCWorld/TechHive’s 20 U.S. market speed test.
USE THESE
2Q12 3Q12 4Q12 1Q13 2Q13
$4.5$4.7
$5.1
AT&T WIRELESS DATA REVENUESDollars in billions
$4.9
$5.4AT&T is a leader in smartphones and
mobile Internet services, including
data, access to applications and related services.
6InvestorBriefing 2Q 2013
WirelineAT&T’s second-quarter
wireline highlights:
U-verse now more than
half of wireline consumer
revenues; strong U-verse
high speed Internet and
video subscriber gains;
strong total broadband
ARPU growth; and
accelerating revenue
growth in strategic
business services.
AT&T’s wireline segment includes business, consumer and customer information services. AT&T’s second-quarter wireline results were once again led by strong U-verse TV and high speed Internet gains, solid wireline consumer revenue growth and accelerating strategic business services revenue growth.
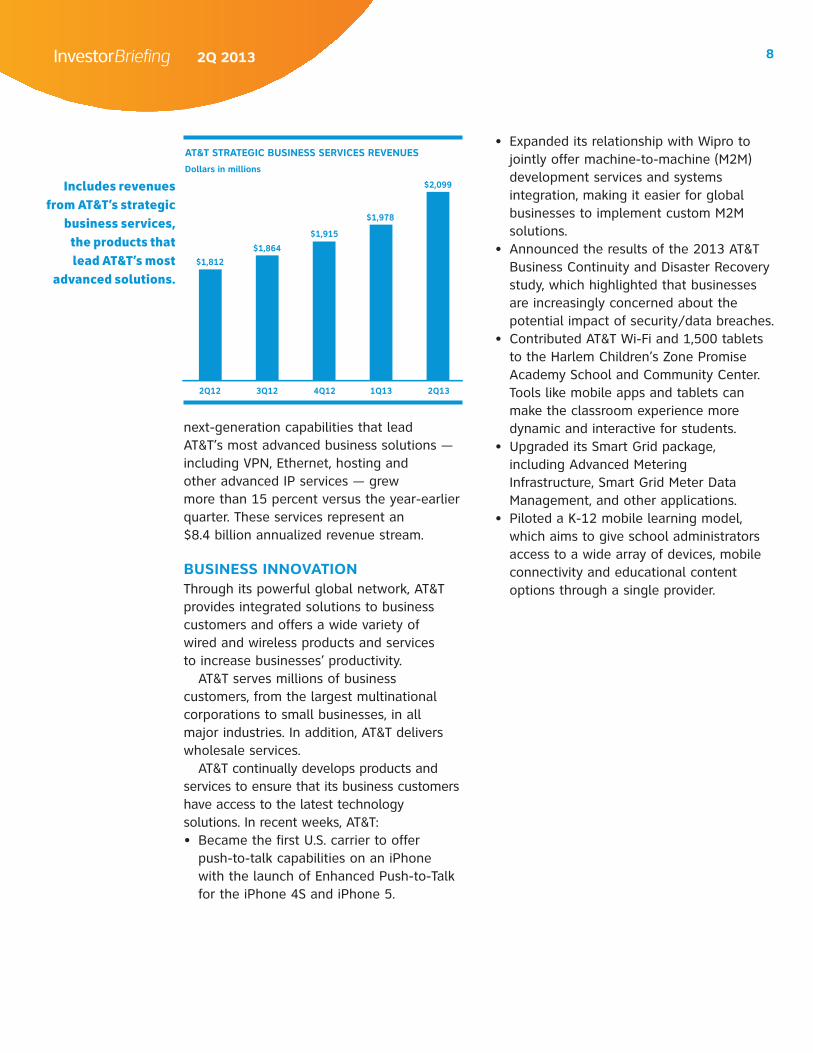
Total second-quarter wireline revenues were $14.8 billion, down 0.9 percent versus the year-earlier quarter and up 0.8 percent sequentially. In addition:• Total U-verse revenues grew 30.1 percent year over year and were up
9.0 percent versus the first quarter of 2013.• Second-quarter wireline operating expenses were $13.1 billion, up 1.3 percent
versus the second quarter of 2012 and up 0.9 percent sequentially.• AT&T’s wireline operating income totaled $1.6 billion, down 15.8 percent
versus the second quarter of 2012 and flat sequentially.• Second-quarter wireline operating income margin was 11.1 percent, compared
to 13.0 percent in the year-earlier quarter, but flat versus the first quarter of 2013.
WIRELINE CONSUMERConsumer U-verse services now comprise more than half of consumer revenues and continued to drive consumer wireline growth. Second-quarter consumer highlights included:
U-verse Now More Than 50 Percent of Consumer Revenues. Revenues from residential customers totaled $5.6 billion, an increase of 2.4 percent versus the second quarter a year ago and up 1.8 percent versus the first quarter of 2013. Continued strong growth in consumer IP data services in the second quarter more than offset lower revenues from voice and legacy products. U-verse, which includes TV, high speed Internet and voice over IP, now represents 51 percent of wireline consumer revenues, up from 41 percent in the year-earlier quarter. Consumer U-verse revenues grew 28.4 percent year over year and were up 8.2 percent versus the first quarter of 2013.
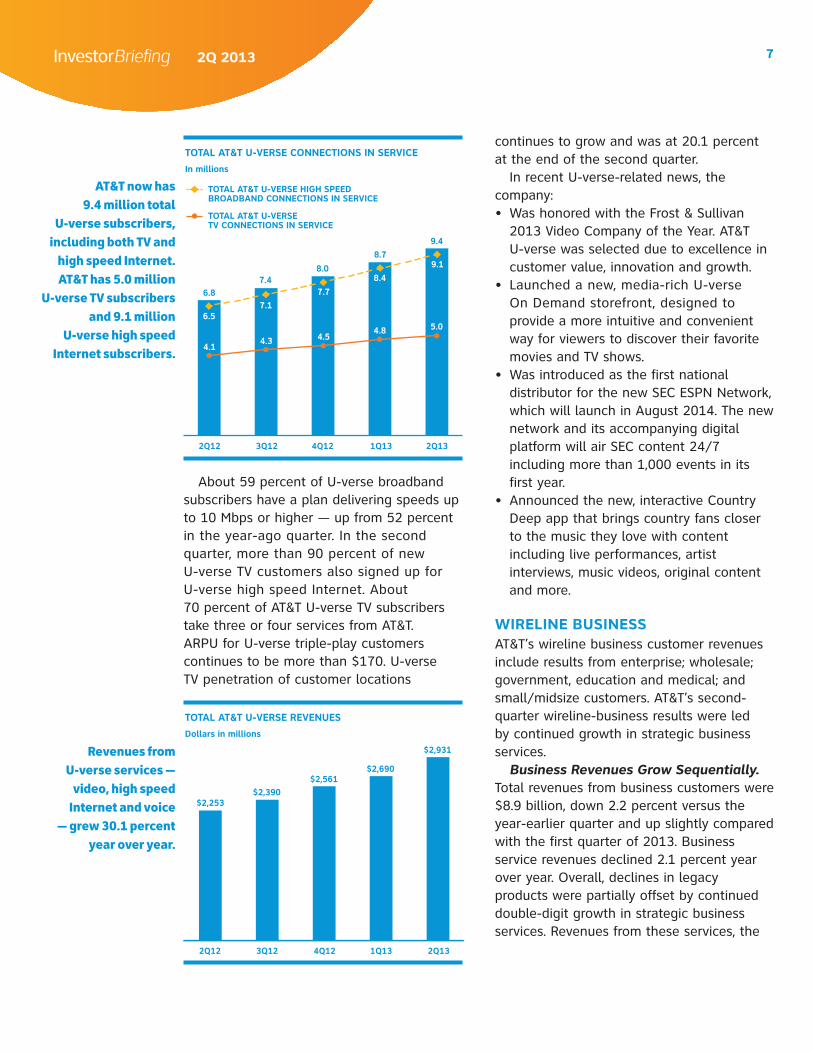
U-verse Hits 9.4 Million Subscribers. Total U-verse subscribers (TV and high speed Internet) reached 9.4 million in the second quarter. U-verse TV added 233,000 subscribers to top 5.0 million in service. U-verse high speed Internet had a net gain of 641,000 subscribers to reach a total of 9.1 million. Overall, the company had a net loss of 61,000 wireline broadband subscribers, an improvement over last year’s loss but still reflecting typical seasonal pressures. Total wireline broadband ARPU was up 9 percent year over year. Total U-verse high speed Internet subscribers now represent 55 percent of all wireline broadband subscribers compared with 40 percent in the year-earlier quarter.
InvestorBriefing 2Q 2013 7
AT&T now has9.4 million total
U-verse subscribers, including both TV and
high speed Internet. AT&T has 5.0 million
U-verse TV subscribers and 9.1 million
U-verse high speed Internet subscribers.
USE THIS
2Q11 3Q11 4Q11 1Q12 2Q12
7
6
5
4
3
2
1
TOTAL AT&T U-VERSE CONNECTIONS IN SERVICE
TOTAL AT&T U-VERSE TV CONNECTIONS IN SERVICE
TOTAL AT&T U-VERSE CONNECTIONS IN SERVICE versusTOTAL AT&T U-VERSE TV CONNECTIONS IN SERVICE
In millions
2Q12 3Q12 4Q12 1Q13 2Q13
TOTAL AT&T U-VERSE CONNECTIONS IN SERVICE
In millions
4.14.3
4.84.5
5.06.5
7.1
8.4
7.7
9.1
6.87.4
8.7
8.0
9.4
TOTAL AT&T U-VERSE TV CONNECTIONS IN SERVICE
TOTAL AT&T U-VERSE HIGH SPEED BROADBAND CONNECTIONS IN SERVICE
continues to grow and was at 20.1 percent at the end of the second quarter.
In recent U-verse-related news, the company:• Was honored with the Frost & Sullivan
2013 Video Company of the Year. AT&T U-verse was selected due to excellence in customer value, innovation and growth.
• Launched a new, media-rich U-verse On Demand storefront, designed to provide a more intuitive and convenient way for viewers to discover their favorite movies and TV shows.
• Was introduced as the first national distributor for the new SEC ESPN Network, which will launch in August 2014. The new network and its accompanying digital platform will air SEC content 24/7 including more than 1,000 events in its first year.
• Announced the new, interactive Country Deep app that brings country fans closer to the music they love with content including live performances, artist interviews, music videos, original content and more.
WIRELINE BUSINESSAT&T’s wireline business customer revenues include results from enterprise; wholesale; government, education and medical; and small/midsize customers. AT&T’s second-quarter wireline-business results were led by continued growth in strategic business services.
Business Revenues Grow Sequentially. Total revenues from business customers were $8.9 billion, down 2.2 percent versus the year-earlier quarter and up slightly compared with the first quarter of 2013. Business service revenues declined 2.1 percent year over year. Overall, declines in legacy products were partially offset by continued double-digit growth in strategic business services. Revenues from these services, the
About 59 percent of U-verse broadband subscribers have a plan delivering speeds up to 10 Mbps or higher — up from 52 percent in the year-ago quarter. In the second quarter, more than 90 percent of new U-verse TV customers also signed up for U-verse high speed Internet. About 70 percent of AT&T U-verse TV subscribers take three or four services from AT&T. ARPU for U-verse triple-play customers continues to be more than $170. U-verse TV penetration of customer locations
Revenues from U-verse services —
video, high speed Internet and voice
— grew 30.1 percent year over year.
USE THIS
2Q12 3Q12 4Q12 1Q13 2Q13
$2,253$2,390
$2,561
TOTAL AT&T U-VERSE REVENUES
Dollars in millions
$2,690
$2,931
InvestorBriefing 2Q 2013 8
• Expanded its relationship with Wipro to jointly offer machine-to-machine (M2M) development services and systems integration, making it easier for global businesses to implement custom M2M solutions.
• Announced the results of the 2013 AT&T Business Continuity and Disaster Recovery study, which highlighted that businesses are increasingly concerned about the potential impact of security/data breaches.
• Contributed AT&T Wi-Fi and 1,500 tablets to the Harlem Children’s Zone Promise Academy School and Community Center. Tools like mobile apps and tablets can make the classroom experience more dynamic and interactive for students.
• Upgraded its Smart Grid package, including Advanced Metering Infrastructure, Smart Grid Meter Data Management, and other applications.
• Piloted a K-12 mobile learning model, which aims to give school administrators access to a wide array of devices, mobile connectivity and educational content options through a single provider.
next-generation capabilities that lead AT&T’s most advanced business solutions — including VPN, Ethernet, hosting and other advanced IP services — grew more than 15 percent versus the year-earlier quarter. These services represent an $8.4 billion annualized revenue stream.
BUSINESS INNOVATIONThrough its powerful global network, AT&T provides integrated solutions to business customers and offers a wide variety of wired and wireless products and services to increase businesses’ productivity.
AT&T serves millions of business customers, from the largest multinational corporations to small businesses, in all major industries. In addition, AT&T delivers wholesale services.
AT&T continually develops products and services to ensure that its business customers have access to the latest technology solutions. In recent weeks, AT&T:• Became the first U.S. carrier to offer
push-to-talk capabilities on an iPhone with the launch of Enhanced Push-to-Talk for the iPhone 4S and iPhone 5.
Includes revenues from AT&T’s strategic
business services, the products that lead AT&T’s most
advanced solutions.
USE THIS
2Q12 3Q12 4Q12 1Q13 2Q13
$1,812
$1,864
$1,915
AT&T STRATEGIC BUSINESS SERVICES REVENUES
Dollars in millions
$1,978
$2,099
9InvestorBriefing 2Q 2013
OtherIncludes results from
equity investments in
América Móvil and
YP Holdings.
AT&T’s Other segment includes AT&T’s proportionate share of results from América Móvil and YP Holdings, which are shown in Equity in Net Income of Affiliates for this segment. Other also includes financial impacts from corporate costs not allocated to operating segments. AT&T’s equity interest in YP Holdings is 47 percent. AT&T’s equity interest in América Móvil is 9.0 percent as of the end of the second quarter of 2013.
América Móvil is one of the leading providers of telecommunications services in Latin America. At the end of the first quarter of 2013, América Móvil had 262.9 million wireless subscribers in countries throughout the region, including 71.2 million in Mexico. América Móvil operates in Argentina, Brazil, Chile, Colombia, Costa Rica, Dominican Republic, Ecuador, El Salvador, Guatemala, Honduras, Mexico, Nicaragua, Panama, Paraguay, Peru, Puerto Rico, the United States and Uruguay.
Second-quarter Other segment operating loss was $199 million versus a loss of $240 million in the year-earlier quarter. Second-quarter segment revenues totaled $11 million, compared with $10 million in the second quarter of 2012. Segment operating expenses totaled $210 million in the second quarter of 2013, compared with $250 million in the prior-year period. Equity in net income of affiliates totaled $237 million in the second quarter of 2013 versus $148 million in the year-earlier quarter.
InvestorBriefing 2Q 2013 10
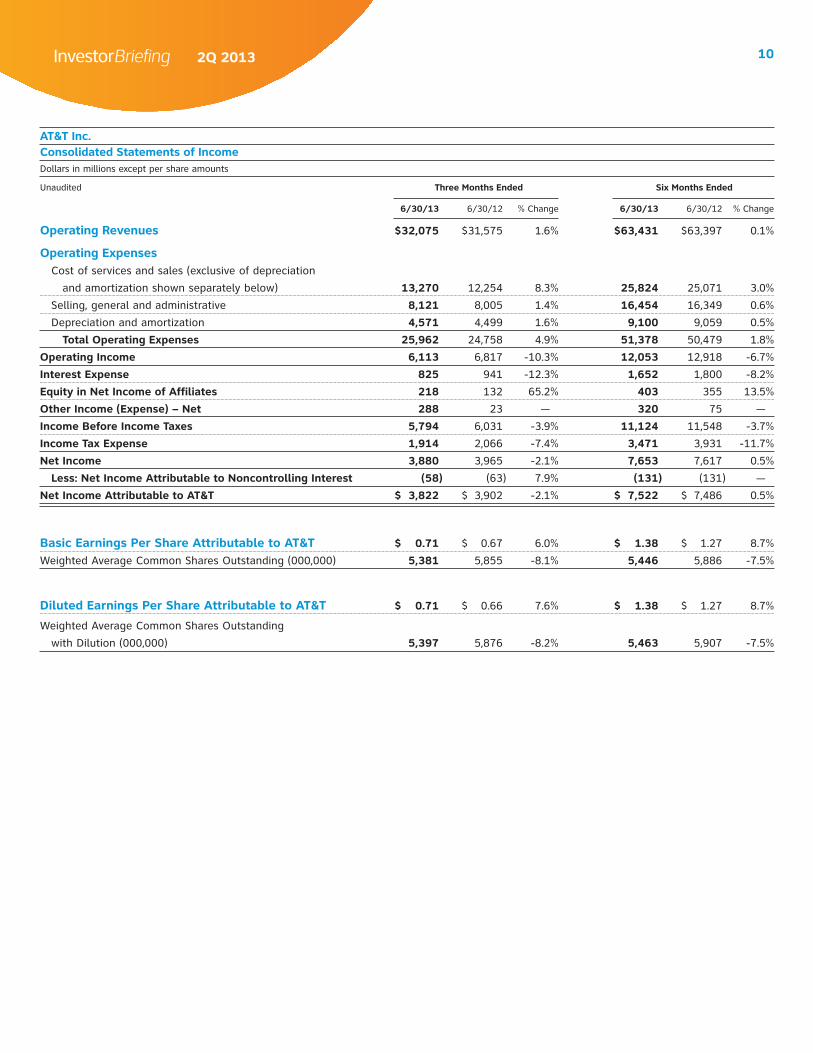
AT&T Inc.Consolidated Statements of IncomeDollars in millions except per share amounts
Unaudited Three Months Ended Six Months Ended
6/30/13 6/30/12 % Change 6/30/13 6/30/12 % Change
Operating Revenues $32,075 $31,575 1.6% $63,431 $63,397 0.1%
Operating Expenses Cost of services and sales (exclusive of depreciation
and amortization shown separately below) 13,270 12,254 8.3% 25,824 25,071 3.0%
Selling, general and administrative 8,121 8,005 1.4% 16,454 16,349 0.6%
Depreciation and amortization 4,571 4,499 1.6% 9,100 9,059 0.5%
Total Operating Expenses 25,962 24,758 4.9% 51,378 50,479 1.8%
Operating Income 6,113 6,817 -10.3% 12,053 12,918 -6.7%
Interest Expense 825 941 -12.3% 1,652 1,800 -8.2%
Equity in Net Income of Affiliates 218 132 65.2% 403 355 13.5%
Other Income (Expense) – Net 288 23 — 320 75 —
Income Before Income Taxes 5,794 6,031 -3.9% 11,124 11,548 -3.7%
Income Tax Expense 1,914 2,066 -7.4% 3,471 3,931 -11.7%
Net Income 3,880 3,965 -2.1% 7,653 7,617 0.5%
Less: Net Income Attributable to Noncontrolling Interest (58) (63) 7.9% (131) (131) —
Net Income Attributable to AT&T $ 3,822 $ 3,902 -2.1% $ 7,522 $ 7,486 0.5%
Basic Earnings Per Share Attributable to AT&T $ 0.71 $ 0.67 6.0% $ 1.38 $ 1.27 8.7%
Weighted Average Common Shares Outstanding (000,000) 5,381 5,855 -8.1% 5,446 5,886 -7.5%
Diluted Earnings Per Share Attributable to AT&T $ 0.71 $ 0.66 7.6% $ 1.38 $ 1.27 8.7%
Weighted Average Common Shares Outstanding
with Dilution (000,000) 5,397 5,876 -8.2% 5,463 5,907 -7.5%

InvestorBriefing 2Q 2013 11
AT&T Inc.Statements of Segment IncomeDollars in millions
Unaudited Three Months Ended Six Months Ended
6/30/13 6/30/12 % Change 6/30/13 6/30/12 % Change
WirelessSegment Operating Revenues
Data $ 5,356 $ 4,471 19.8% $10,481 $ 8,706 20.4%
Voice, text and other service 10,014 10,294 -2.7% 19,951 20,625 -3.3%
Equipment 1,921 1,588 21.0% 3,550 3,158 12.4%
Total Segment Operating Revenues 17,291 16,353 5.7% 33,982 32,489 4.6%
Segment Operating Expenses
Operations and support 10,770 9,590 12.3% 20,950 19,568 7.1%
Depreciation and amortization 1,843 1,696 8.7% 3,678 3,362 9.4%
Total Segment Operating Expenses 12,613 11,286 11.8% 24,628 22,930 7.4%
Segment Operating Income 4,678 5,067 -7.7% 9,354 9,559 -2.1%
Equity in Net Income (Loss) of Affiliates (19) (15) -26.7% (37) (28) -32.1%
Segment Income $ 4,659 $ 5,052 -7.8% $ 9,317 $ 9,531 -2.2%
Segment Operating Income Margin 27.1% 31.0% 27.5% 29.4%
WirelineSegment Operating Revenues
Data $ 8,400 $ 7,935 5.9% $16,562 $15,735 5.3%
Voice 5,141 5,696 -9.7% 10,447 11,588 -9.8%
Other 1,232 1,276 -3.4% 2,419 2,513 -3.7%
Total Segment Operating Revenues 14,773 14,907 -0.9% 29,428 29,836 -1.4%
Segment Operating Expenses
Operations and support 10,417 10,201 2.1% 20,752 20,603 0.7%
Depreciation and amortization 2,722 2,766 -1.6% 5,410 5,574 -2.9%
Total Segment Operating Expenses 13,139 12,967 1.3% 26,162 26,177 -0.1%
Segment Operating Income 1,634 1,940 -15.8% 3,266 3,659 -10.7%
Equity in Net Income (Loss) of Affiliates — (1) — 1 (1) —
Segment Income $ 1,634 $ 1,939 -15.7% $ 3,267 $ 3,658 -10.7%
Segment Operating Income Margin 11.1% 13.0% 11.1% 12.3%
Advertising SolutionsSegment Operating Revenues $ — $ 305 — $ — $ 1,049 —
Segment Operating Expenses
Operations and support — 226 — — 773 —
Depreciation and amortization — 29 — — 106 —
Total Segment Operating Expenses — 255 — — 879 —
Segment Income $ — $ 50 — $ — $ 170 —
Segment Income Margin — 16.4% — 16.2%
OtherSegment Operating Revenues $ 11 $ 10 10.0% $ 21 $ 23 -8.7%
Segment Operating Expenses 210 250 -16.0% 588 493 19.3%
Segment Operating Income (Loss) (199) (240) 17.1% (567) (470) -20.6%
Equity in Net Income of Affiliates 237 148 60.1% 439 384 14.3%
Segment Income (Loss) $ 38 $ (92) — $ (128) $ (86) -48.8%
InvestorBriefing 2Q 2013 12
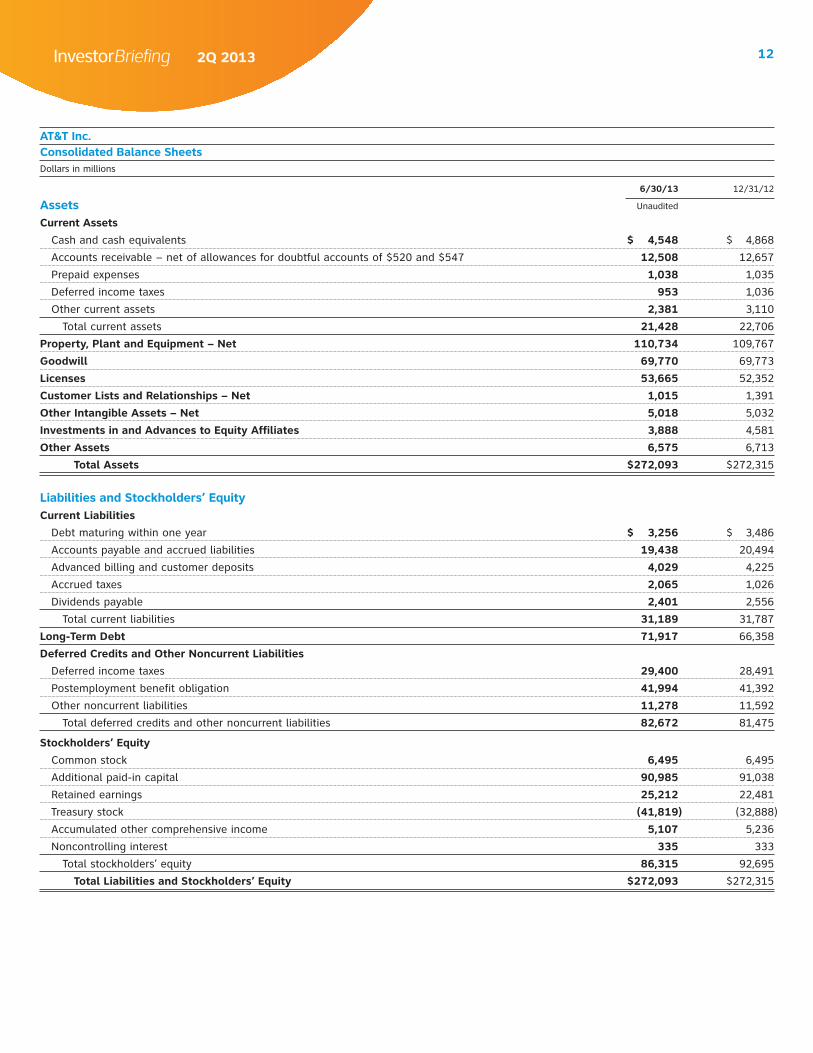
AT&T Inc.Consolidated Balance SheetsDollars in millions
6/30/13 12/31/12
Assets Unaudited
Current Assets
Cash and cash equivalents $ 4,548 $ 4,868
Accounts receivable – net of allowances for doubtful accounts of $520 and $547 12,508 12,657
Prepaid expenses 1,038 1,035
Deferred income taxes 953 1,036
Other current assets 2,381 3,110
Total current assets 21,428 22,706
Property, Plant and Equipment – Net 110,734 109,767
Goodwill 69,770 69,773
Licenses 53,665 52,352
Customer Lists and Relationships – Net 1,015 1,391
Other Intangible Assets – Net 5,018 5,032
Investments in and Advances to Equity Affiliates 3,888 4,581
Other Assets 6,575 6,713
Total Assets $272,093 $272,315
Liabilities and Stockholders’ EquityCurrent Liabilities
Debt maturing within one year $ 3,256 $ 3,486
Accounts payable and accrued liabilities 19,438 20,494
Advanced billing and customer deposits 4,029 4,225
Accrued taxes 2,065 1,026
Dividends payable 2,401 2,556
Total current liabilities 31,189 31,787
Long-Term Debt 71,917 66,358
Deferred Credits and Other Noncurrent Liabilities
Deferred income taxes 29,400 28,491
Postemployment benefit obligation 41,994 41,392
Other noncurrent liabilities 11,278 11,592
Total deferred credits and other noncurrent liabilities 82,672 81,475
Stockholders’ Equity
Common stock 6,495 6,495
Additional paid-in capital 90,985 91,038
Retained earnings 25,212 22,481
Treasury stock (41,819) (32,888)
Accumulated other comprehensive income 5,107 5,236
Noncontrolling interest 335 333
Total stockholders’ equity 86,315 92,695
Total Liabilities and Stockholders’ Equity $272,093 $272,315
InvestorBriefing 2Q 2013 13
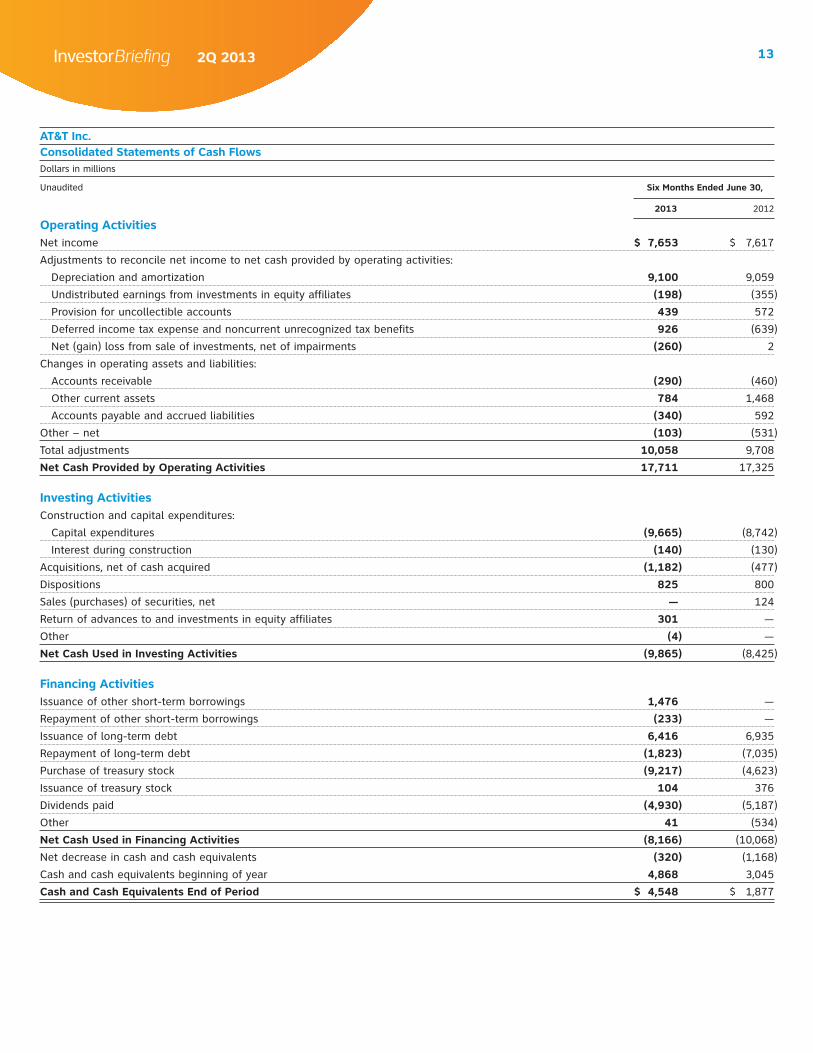
AT&T Inc.Consolidated Statements of Cash FlowsDollars in millions
Unaudited Six Months Ended June 30,
2013 2012
Operating ActivitiesNet income $ 7,653 $ 7,617
Adjustments to reconcile net income to net cash provided by operating activities:
Depreciation and amortization 9,100 9,059
Undistributed earnings from investments in equity affiliates (198) (355)
Provision for uncollectible accounts 439 572
Deferred income tax expense and noncurrent unrecognized tax benefits 926 (639)
Net (gain) loss from sale of investments, net of impairments (260) 2
Changes in operating assets and liabilities:
Accounts receivable (290) (460)
Other current assets 784 1,468
Accounts payable and accrued liabilities (340) 592
Other – net (103) (531)
Total adjustments 10,058 9,708
Net Cash Provided by Operating Activities 17,711 17,325
Investing ActivitiesConstruction and capital expenditures:
Capital expenditures (9,665) (8,742)
Interest during construction (140) (130)
Acquisitions, net of cash acquired (1,182) (477)
Dispositions 825 800
Sales (purchases) of securities, net — 124
Return of advances to and investments in equity affiliates 301 —
Other (4) —
Net Cash Used in Investing Activities (9,865) (8,425)
Financing ActivitiesIssuance of other short-term borrowings 1,476 —
Repayment of other short-term borrowings (233) —
Issuance of long-term debt 6,416 6,935
Repayment of long-term debt (1,823) (7,035)
Purchase of treasury stock (9,217) (4,623)
Issuance of treasury stock 104 376
Dividends paid (4,930) (5,187)
Other 41 (534)
Net Cash Used in Financing Activities (8,166) (10,068)
Net decrease in cash and cash equivalents (320) (1,168)
Cash and cash equivalents beginning of year 4,868 3,045
Cash and Cash Equivalents End of Period $ 4,548 $ 1,877
InvestorBriefing 2Q 2013 14
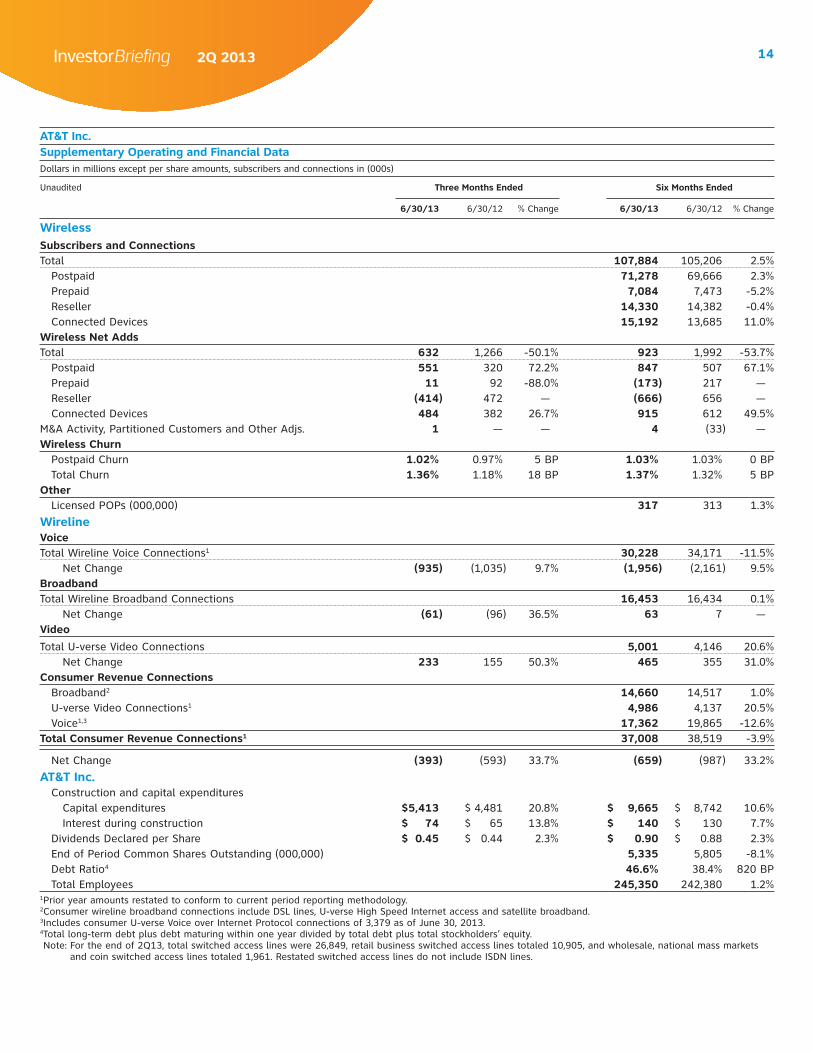
AT&T Inc.Supplementary Operating and Financial DataDollars in millions except per share amounts, subscribers and connections in (000s)
Unaudited Three Months Ended Six Months Ended
6/30/13 6/30/12 % Change 6/30/13 6/30/12 % Change
WirelessSubscribers and ConnectionsTotal 107,884 105,206 2.5% Postpaid 71,278 69,666 2.3% Prepaid 7,084 7,473 -5.2% Reseller 14,330 14,382 -0.4% Connected Devices 15,192 13,685 11.0%Wireless Net AddsTotal 632 1,266 -50.1% 923 1,992 -53.7% Postpaid 551 320 72.2% 847 507 67.1% Prepaid 11 92 -88.0% (173) 217 — Reseller (414) 472 — (666) 656 — Connected Devices 484 382 26.7% 915 612 49.5%M&A Activity, Partitioned Customers and Other Adjs. 1 — — 4 (33) —Wireless Churn Postpaid Churn 1.02% 0.97% 5 BP 1.03% 1.03% 0 BP Total Churn 1.36% 1.18% 18 BP 1.37% 1.32% 5 BPOther Licensed POPs (000,000) 317 313 1.3%
WirelineVoiceTotal Wireline Voice Connections1 30,228 34,171 -11.5% Net Change (935) (1,035) 9.7% (1,956) (2,161) 9.5%BroadbandTotal Wireline Broadband Connections 16,453 16,434 0.1% Net Change (61) (96) 36.5% 63 7 —Video
Total U-verse Video Connections 5,001 4,146 20.6% Net Change 233 155 50.3% 465 355 31.0%Consumer Revenue Connections Broadband2 14,660 14,517 1.0% U-verse Video Connections1 4,986 4,137 20.5% Voice1,3 17,362 19,865 -12.6%Total Consumer Revenue Connections1 37,008 38,519 -3.9%
Net Change (393) (593) 33.7% (659) (987) 33.2%
AT&T Inc. Construction and capital expenditures Capital expenditures $5,413 $ 4,481 20.8% $ 9,665 $ 8,742 10.6% Interest during construction $ 74 $ 65 13.8% $ 140 $ 130 7.7% Dividends Declared per Share $ 0.45 $ 0.44 2.3% $ 0.90 $ 0.88 2.3% End of Period Common Shares Outstanding (000,000) 5,335 5,805 -8.1% Debt Ratio4 46.6% 38.4% 820 BP Total Employees 245,350 242,380 1.2%1 Prior year amounts restated to conform to current period reporting methodology.2 Consumer wireline broadband connections include DSL lines, U-verse High Speed Internet access and satellite broadband.3 Includes consumer U-verse Voice over Internet Protocol connections of 3,379 as of June 30, 2013.4 Total long-term debt plus debt maturing within one year divided by total debt plus total stockholders’ equity.Note: For the end of 2Q13, total switched access lines were 26,849, retail business switched access lines totaled 10,905, and wholesale, national mass markets
and coin switched access lines totaled 1,961. Restated switched access lines do not include ISDN lines.
InvestorBriefing 2Q 2013 15
Third-Quarter 2013 Earnings Date: October 23, 2013
AT&T will release third-quarter 2013 earnings on October 23, 2013, after the market closes.
The company’s InvestorBriefing and related earnings materials will be available on the AT&T website at www.att.com/investor.relations by 4:30 p.m. Eastern time.
AT&T will also host a conference call to discuss the results at 4:30 p.m. Eastern time the same day. Dial-in and replay information will be announced on First Call approximately eight weeks before the call, which will also be broadcast live and will be available for replay over the Internet at www.att.com/investor.relations.
Cautionary Language Concerning Forward-Looking Statements
Information set forth in this InvestorBriefing contains financial estimates and other forward-looking statements that are subject to risks and uncertainties, and actual results may differ materially. A discussion of factors that may affect future results is contained in AT&T’s filings with the Securities and Exchange Commission. AT&T disclaims any obligation to update or revise statements contained in this InvestorBriefing based on new information or otherwise.
This InvestorBriefing may contain certain non-GAAP financial measures. Reconciliations between the non-GAAP financial measures and the GAAP financial measures are available on the company’s website at www.att.com/investor.relations.
AT&T InvestorBriefing The AT&T InvestorBriefing is published by the Investor Relations staff of AT&T Inc. Requests for further information may be directed to one of the Investor Relations managers by phone at 210-351-3327.
Correspondence should be sent to: Investor Relations AT&T Inc. 208 S. Akard Street Dallas, TX 75202
Email address: [email protected]
Senior Vice President- Investor Relations Susan Johnson
Investor Relations StaffJamie AndersonMichael BlackStacy ByrdMarcio CardosoKent EvansWill KuhnJoshua Lee
Shelly MathewsJoe ParsonsTerri ScheeleDanielle WilsonChris WomackTeresa Yu