Embed Size (px)
Citation preview
Attention Discrimination:
Theory and Field Experiments with Monitoring Information Acquisition
Vojtěch Bartoš§, Michal Bauer
§,, Julie Chytilová
, and Filip Matějka
§
§ CERGE-EI, a joint workplace of Charles University and the Economics Institute of the Academy of Sciences of
the Czech Republic; Politických vězňů 7, 111 21 Prague, Czech Republic
Charles University, Faculty of Social Sciences, Institute of Economic Studies; Opletalova 26, Prague 1, 110 00,
Czech Republic
SUPPLEMENTARY MATERIAL (FOR ONLINE PUBLICATION ONLY)
SUPPLEMENTARY MATERIAL TO SECTION II
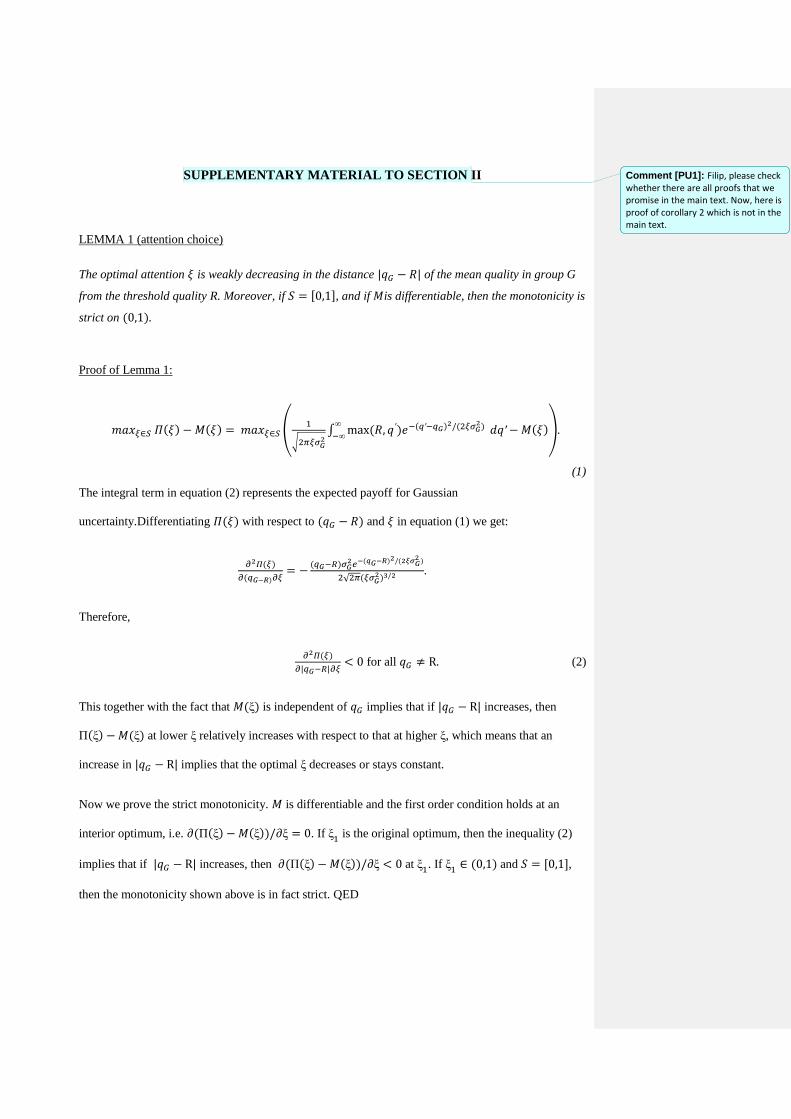
LEMMA 1 (attention choice)
The optimal attention is weakly decreasing in the distance of the mean quality in group G
from the threshold quality R. Moreover, if [ ], and if is differentiable, then the monotonicity is
strict on .
Proof of Lemma 1:
(
√ ∫
).
(1)
The integral term in equation (2) represents the expected payoff for Gaussian
uncertainty.Differentiating with respect to and in equation (1) we get:
√
.
Therefore,
for all (2)
This together with the fact that is independent of implies that if increases, then
at lower relatively increases with respect to that at higher , which means that an
increase in implies that the optimal decreases or stays constant.
Now we prove the strict monotonicity. is differentiable and the first order condition holds at an
interior optimum, i.e. . If is the original optimum, then the inequality (2)
implies that if increases, then at . If and [ ],
then the monotonicity shown above is in fact strict. QED
Comment [PU1]: Filip, please check whether there are all proofs that we promise in the main text. Now, here is proof of corollary 2 which is not in the main text.
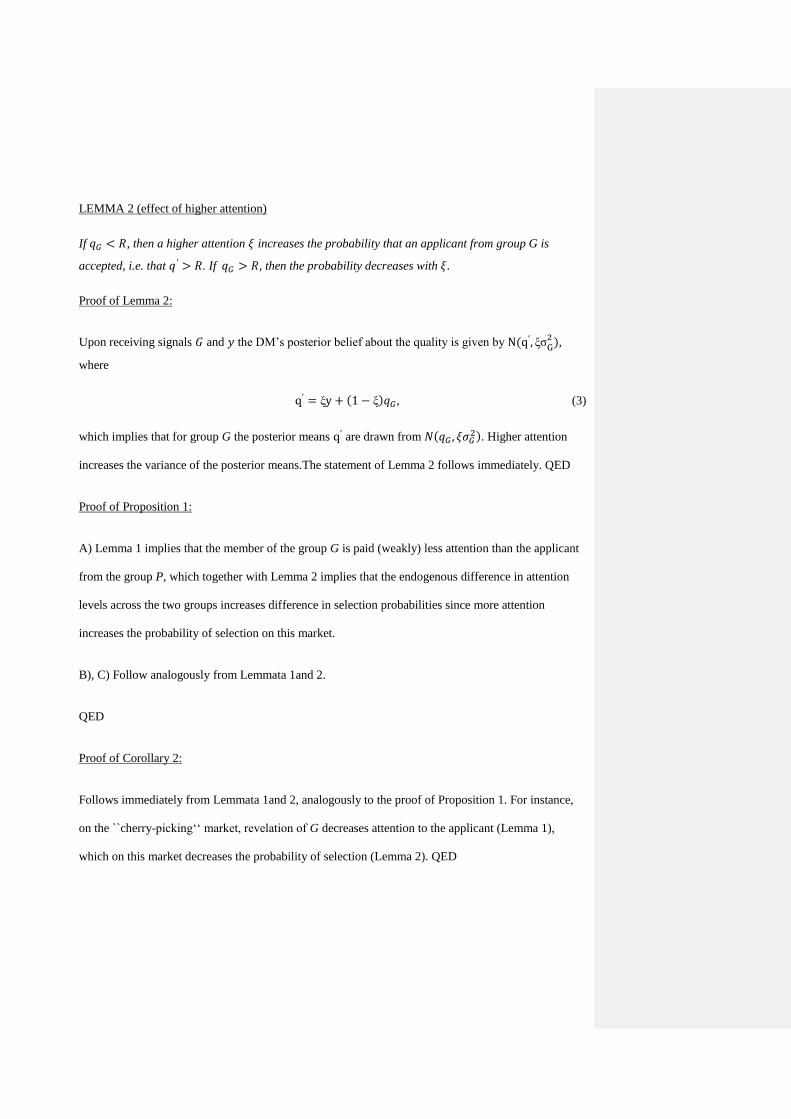
LEMMA 2 (effect of higher attention)
If , then a higher attention increases the probability that an applicant from group G is
accepted, i.e. that . If , then the probability decreases with .
Proof of Lemma 2:
Upon receiving signals and the DM’s posterior belief about the quality is given by ,
where
(3)
which implies that for group G the posterior means are drawn from . Higher attention
increases the variance of the posterior means.The statement of Lemma 2 follows immediately. QED
Proof of Proposition 1:
A) Lemma 1 implies that the member of the group G is paid (weakly) less attention than the applicant
from the group P, which together with Lemma 2 implies that the endogenous difference in attention
levels across the two groups increases difference in selection probabilities since more attention
increases the probability of selection on this market.
B), C) Follow analogously from Lemmata 1and 2.
QED
Proof of Corollary 2:
Follows immediately from Lemmata 1and 2, analogously to the proof of Proposition 1. For instance,
on the ``cherry-picking‘‘ market, revelation of G decreases attention to the applicant (Lemma 1),
which on this market decreases the probability of selection (Lemma 2). QED

SUPPLEMENTARY MATERIAL TO SECTION III
Wording of application email – Czech rental housing market
1] “Dear Sir/Madam, I am writing because I am very interested in renting the apartment that you have
advertised. When would be a good time to come see the apartment? Best regards, Phan Quyet
Nguyen”
2] Adding a link to personal website: “Dear Sir/Madam, I am writing because I am very interested in
renting the apartment that you have advertised. When would be a good time to come see the
apartment? Best regards, Phan Quyet Nguyen, phan.quiet.nguyen.sweb.cz”
3] Adding a sentence with applicant’s characteristics: “Dear Sir/Madam, I am writing because I am
very interested in renting the apartment that you have advertised. I am a thirty-year-old man, I am
single, I have a college [a high-school] degree, and I do not smoke. I have a steady job (with a regular
paycheck) at a company. When would be a good time to come see the apartment? Best regards, Phan
Quyet Nguyen”
Wording of application email – Czech labor market
“Dear Sir/Madam, I am writing because I am very interested in the Real Estate Agent job position
advertised by your company. You can find my resume in this hyperlink:
phanquyetnguyen1982.sweb.cz. Best regards, Phan Quyet Nguyen”

Wording of application email – German labor market
1] “Dear Sir/Madam, I am writing because I am very interested in the Real Estate Agent job position
advertised by your company. You can find my resume in this hyperlink:
fatihyildiz1982.webege.com . Best regards, Fatih Yildiz”
2] Adding information about 2 months unemployment: “Dear Sir/Madam, I have been searching for a
job for two months and I am writing because I am very interested in the Real Estate Agent job position
advertised by your company. You can find my resume in this hyperlink:
fatihyildiz1982.webege.com . Best regards, Fatih Yildiz”
3] Adding information about 18 months unemployment: “Dear Sir/Madam, I have been searching for a
job for a year and half and I am writing because I am very interested in the Real Estate Agent job
position advertised by your company. You can find my resume in this hyperlink:
fatihyildiz1982.webege.com . Best regards, Fatih Yildiz”
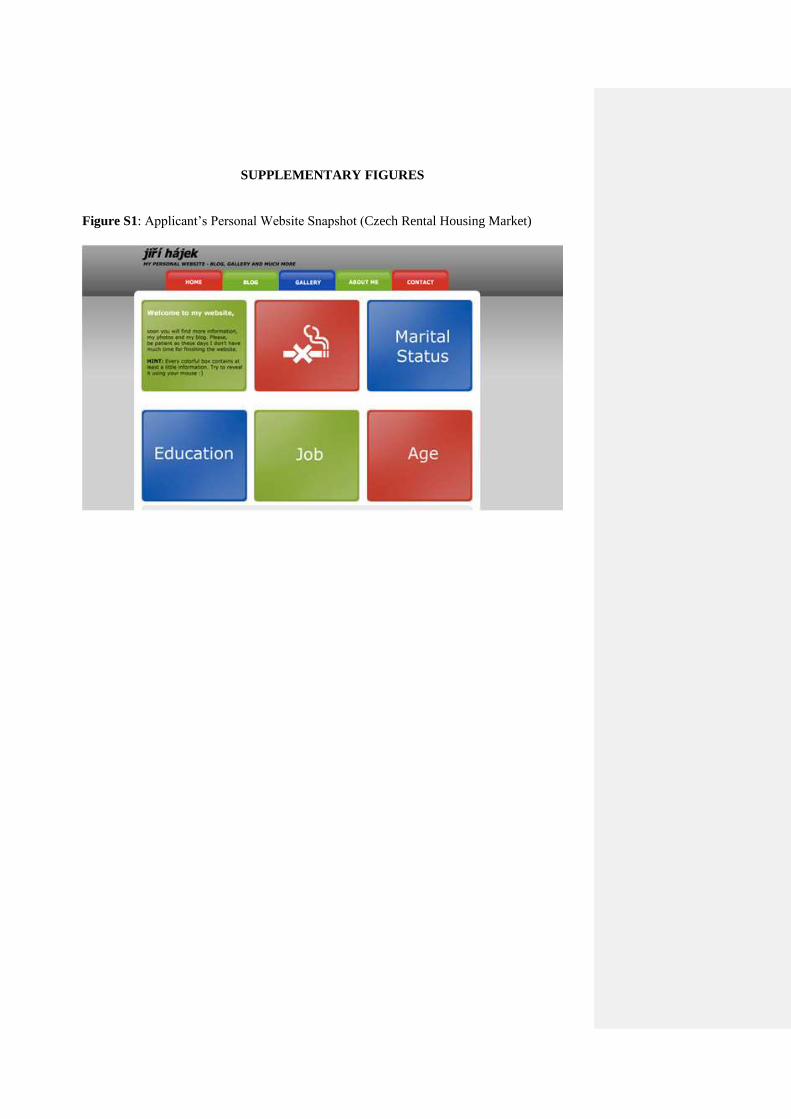
SUPPLEMENTARY FIGURES
Figure S1: Applicant’s Personal Website Snapshot (Czech Rental Housing Market)
7
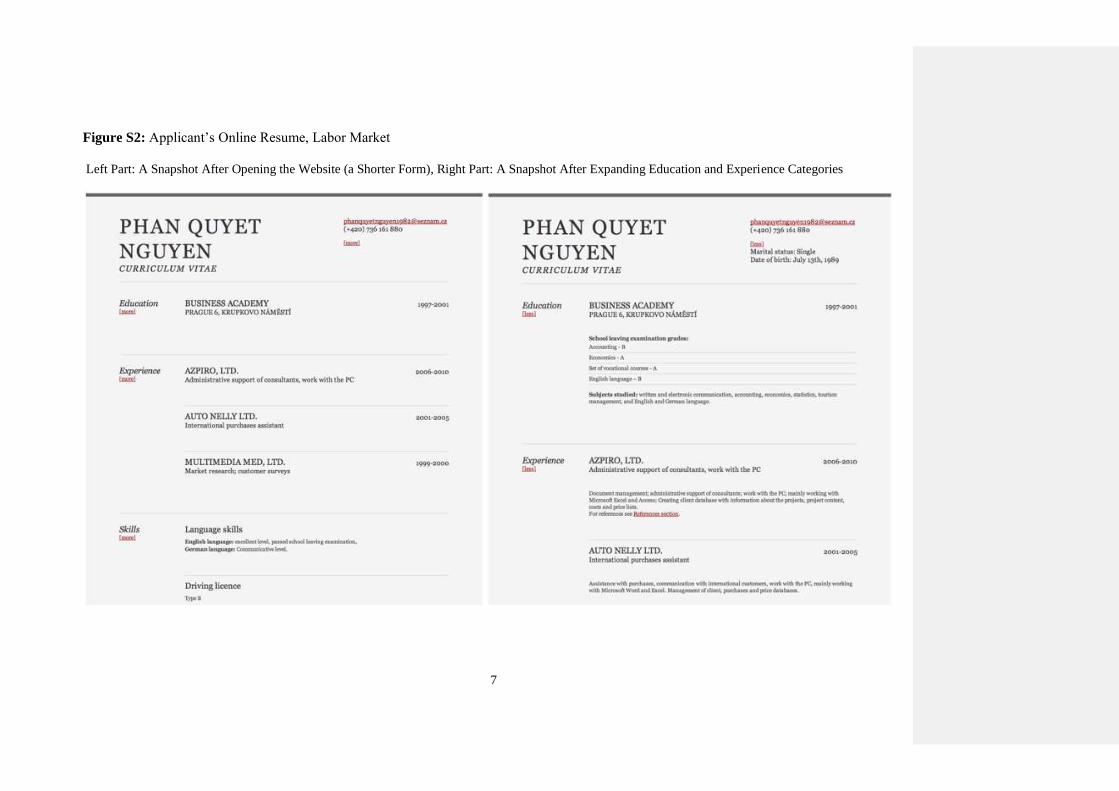
Figure S2: Applicant’s Online Resume, Labor Market
Left Part: A Snapshot After Opening the Website (a Shorter Form), Right Part: A Snapshot After Expanding Education and Experience Categories
8
SUPPLEMENTARY TABLES
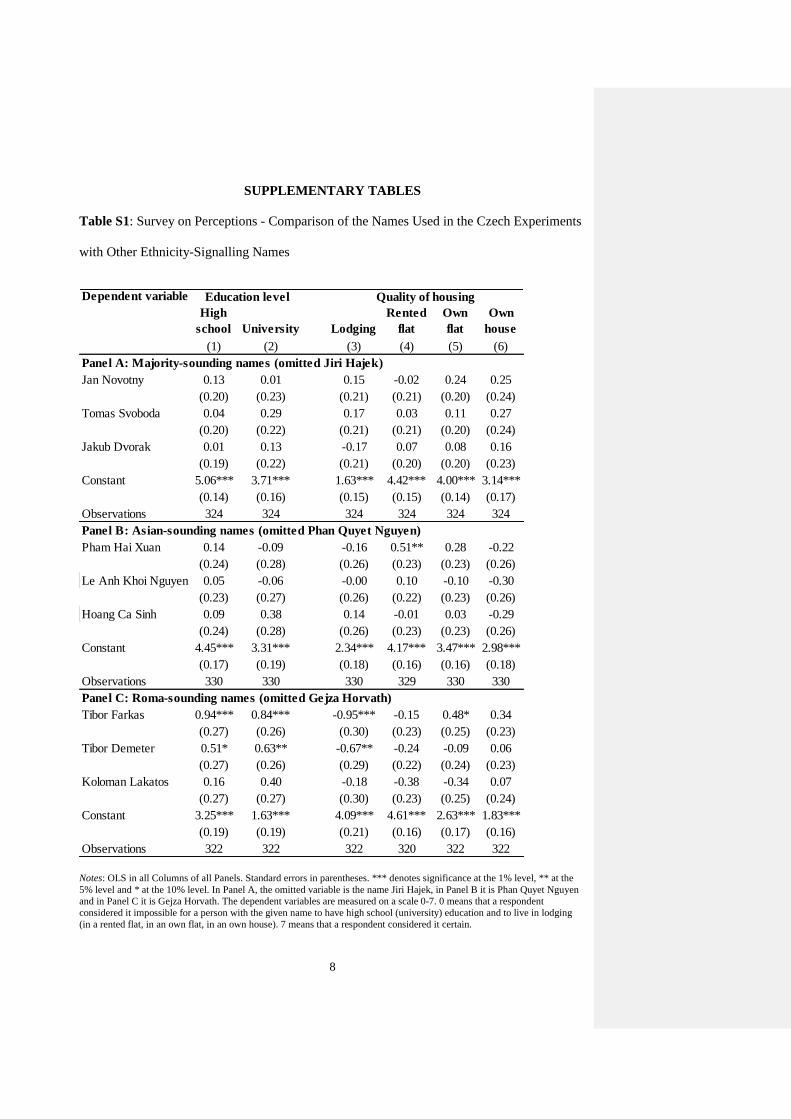
Table S1: Survey on Perceptions - Comparison of the Names Used in the Czech Experiments
with Other Ethnicity-Signalling Names
Notes: OLS in all Columns of all Panels. Standard errors in parentheses. *** denotes significance at the 1% level, ** at the
5% level and * at the 10% level. In Panel A, the omitted variable is the name Jiri Hajek, in Panel B it is Phan Quyet Nguyen
and in Panel C it is Gejza Horvath. The dependent variables are measured on a scale 0-7. 0 means that a respondent
considered it impossible for a person with the given name to have high school (university) education and to live in lodging
(in a rented flat, in an own flat, in an own house). 7 means that a respondent considered it certain.
Dependent variable
High
school University Lodging
Rented
flat
Own
flat
Own
house
(1) (2) (3) (4) (5) (6)
Panel A: Majority-sounding names (omitted Jiri Hajek)
Jan Novotny 0.13 0.01 0.15 -0.02 0.24 0.25
(0.20) (0.23) (0.21) (0.21) (0.20) (0.24)
Tomas Svoboda 0.04 0.29 0.17 0.03 0.11 0.27
(0.20) (0.22) (0.21) (0.21) (0.20) (0.24)
Jakub Dvorak 0.01 0.13 -0.17 0.07 0.08 0.16
(0.19) (0.22) (0.21) (0.20) (0.20) (0.23)
Constant 5.06*** 3.71*** 1.63*** 4.42*** 4.00*** 3.14***
(0.14) (0.16) (0.15) (0.15) (0.14) (0.17)
Observations 324 324 324 324 324 324
Panel B: Asian-sounding names (omitted Phan Quyet Nguyen)
Pham Hai Xuan 0.14 -0.09 -0.16 0.51** 0.28 -0.22
(0.24) (0.28) (0.26) (0.23) (0.23) (0.26)
Le Anh Khoi Nguyen 0.05 -0.06 -0.00 0.10 -0.10 -0.30
(0.23) (0.27) (0.26) (0.22) (0.23) (0.26)
Hoang Ca Sinh 0.09 0.38 0.14 -0.01 0.03 -0.29
(0.24) (0.28) (0.26) (0.23) (0.23) (0.26)
Constant 4.45*** 3.31*** 2.34*** 4.17*** 3.47*** 2.98***
(0.17) (0.19) (0.18) (0.16) (0.16) (0.18)
Observations 330 330 330 329 330 330
Panel C: Roma-sounding names (omitted Gejza Horvath)
Tibor Farkas 0.94*** 0.84*** -0.95*** -0.15 0.48* 0.34
(0.27) (0.26) (0.30) (0.23) (0.25) (0.23)
Tibor Demeter 0.51* 0.63** -0.67** -0.24 -0.09 0.06
(0.27) (0.26) (0.29) (0.22) (0.24) (0.23)
Koloman Lakatos 0.16 0.40 -0.18 -0.38 -0.34 0.07
(0.27) (0.27) (0.30) (0.23) (0.25) (0.24)
Constant 3.25*** 1.63*** 4.09*** 4.61*** 2.63*** 1.83***
(0.19) (0.19) (0.21) (0.16) (0.17) (0.16)
Observations 322 322 322 320 322 322
Education level Quality of housing
9
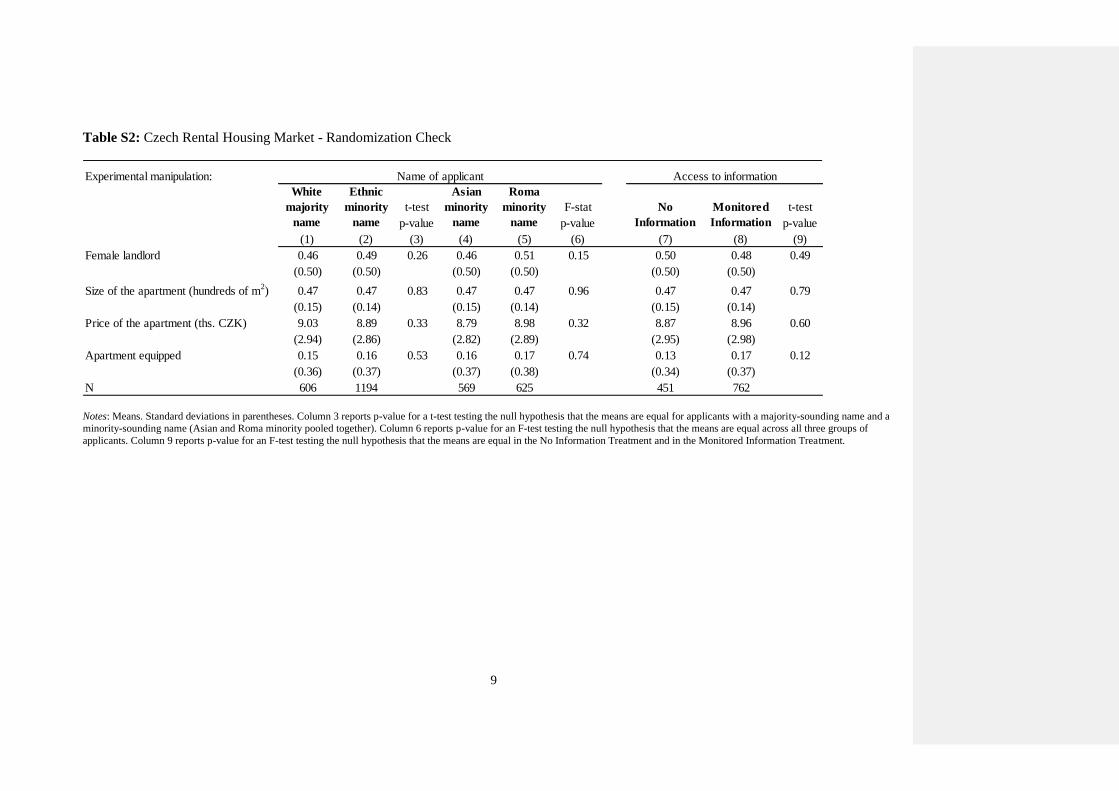
Table S2: Czech Rental Housing Market - Randomization Check
Notes: Means. Standard deviations in parentheses. Column 3 reports p-value for a t-test testing the null hypothesis that the means are equal for applicants with a majority-sounding name and a
minority-sounding name (Asian and Roma minority pooled together). Column 6 reports p-value for an F-test testing the null hypothesis that the means are equal across all three groups of
applicants. Column 9 reports p-value for an F-test testing the null hypothesis that the means are equal in the No Information Treatment and in the Monitored Information Treatment.
Experimental manipulation:
White
majority
name
Ethnic
minority
name
t-test
p-value
Asian
minority
name
Roma
minority
name
F-stat
p-value
No
Information
Monitored
Information
t-test
p-value
(1) (2) (3) (4) (5) (6) (7) (8) (9)
Female landlord 0.46 0.49 0.26 0.46 0.51 0.15 0.50 0.48 0.49
(0.50) (0.50) (0.50) (0.50) (0.50) (0.50)
Size of the apartment (hundreds of m2) 0.47 0.47 0.83 0.47 0.47 0.96 0.47 0.47 0.79
(0.15) (0.14) (0.15) (0.14) (0.15) (0.14)
Price of the apartment (ths. CZK) 9.03 8.89 0.33 8.79 8.98 0.32 8.87 8.96 0.60
(2.94) (2.86) (2.82) (2.89) (2.95) (2.98)
Apartment equipped 0.15 0.16 0.53 0.16 0.17 0.74 0.13 0.17 0.12
(0.36) (0.37) (0.37) (0.38) (0.34) (0.37)
N 606 1194 569 625 451 762
Name of applicant Access to information
10
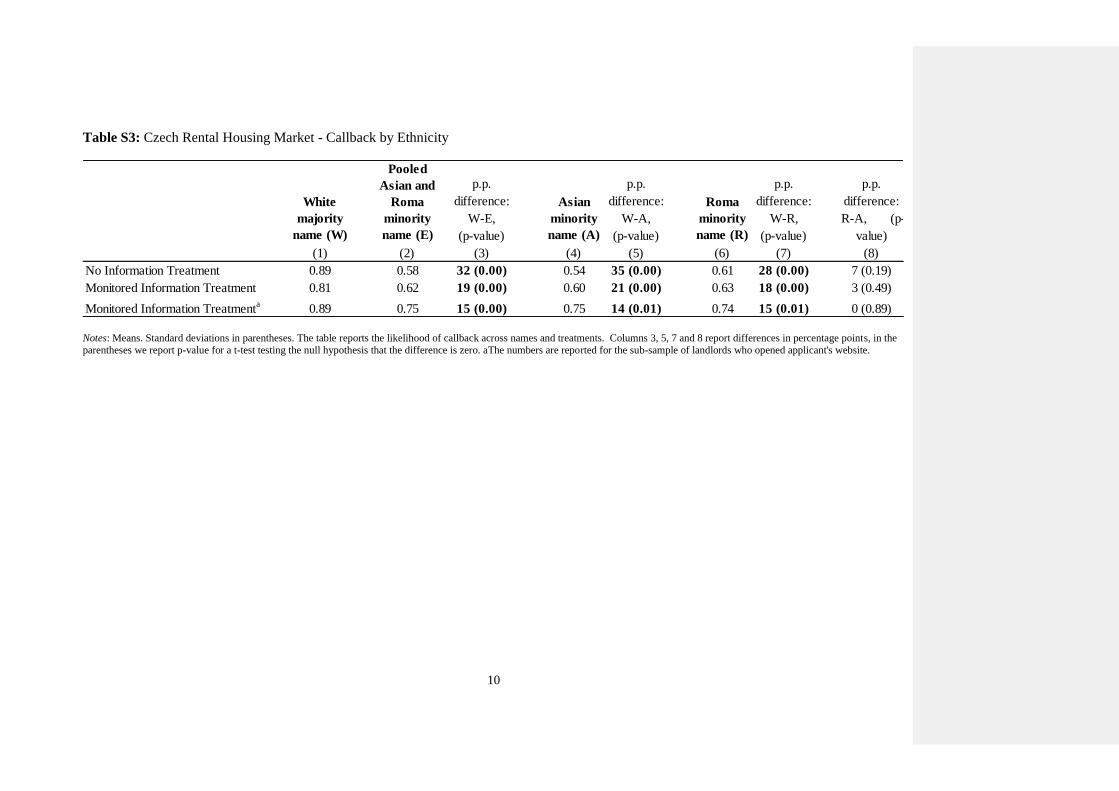
Table S3: Czech Rental Housing Market - Callback by Ethnicity
Notes: Means. Standard deviations in parentheses. The table reports the likelihood of callback across names and treatments. Columns 3, 5, 7 and 8 report differences in percentage points, in the
parentheses we report p-value for a t-test testing the null hypothesis that the difference is zero. aThe numbers are reported for the sub-sample of landlords who opened applicant's website.
White
majority
name (W)
Pooled
Asian and
Roma
minority
name (E)
p.p.
difference:
W-E,
(p-value)
Asian
minority
name (A)
p.p.
difference:
W-A,
(p-value)
Roma
minority
name (R)
p.p.
difference:
W-R,
(p-value)
p.p.
difference:
R-A, (p-
value)
(1) (2) (3) (4) (5) (6) (7) (8)
No Information Treatment 0.89 0.58 32 (0.00) 0.54 35 (0.00) 0.61 28 (0.00) 7 (0.19)
Monitored Information Treatment 0.81 0.62 19 (0.00) 0.60 21 (0.00) 0.63 18 (0.00) 3 (0.49)
Monitored Information Treatmenta
0.89 0.75 15 (0.00) 0.75 14 (0.01) 0.74 15 (0.01) 0 (0.89)
11
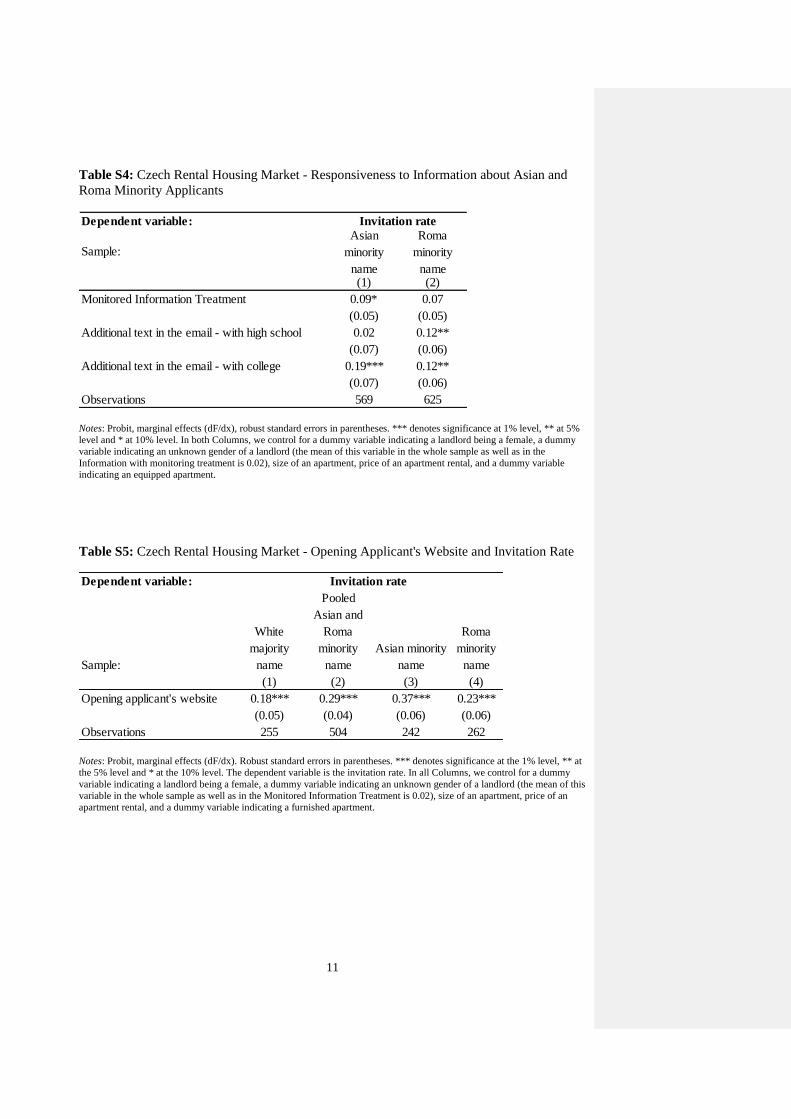
Table S4: Czech Rental Housing Market - Responsiveness to Information about Asian and
Roma Minority Applicants
Notes: Probit, marginal effects (dF/dx), robust standard errors in parentheses. *** denotes significance at 1% level, ** at 5%
level and * at 10% level. In both Columns, we control for a dummy variable indicating a landlord being a female, a dummy
variable indicating an unknown gender of a landlord (the mean of this variable in the whole sample as well as in the
Information with monitoring treatment is 0.02), size of an apartment, price of an apartment rental, and a dummy variable
indicating an equipped apartment.
Table S5: Czech Rental Housing Market - Opening Applicant's Website and Invitation Rate
Notes: Probit, marginal effects (dF/dx). Robust standard errors in parentheses. *** denotes significance at the 1% level, ** at
the 5% level and * at the 10% level. The dependent variable is the invitation rate. In all Columns, we control for a dummy
variable indicating a landlord being a female, a dummy variable indicating an unknown gender of a landlord (the mean of this
variable in the whole sample as well as in the Monitored Information Treatment is 0.02), size of an apartment, price of an
apartment rental, and a dummy variable indicating a furnished apartment.
Dependent variable:
Sample:
Asian
minority
name
Roma
minority
name(1) (2)
Monitored Information Treatment 0.09* 0.07
(0.05) (0.05)
Additional text in the email - with high school 0.02 0.12**
(0.07) (0.06)
Additional text in the email - with college 0.19*** 0.12**
(0.07) (0.06)
Observations 569 625
Invitation rate
Dependent variable:
Sample:
White
majority
name
Pooled
Asian and
Roma
minority
name
Asian minority
name
Roma
minority
name
(1) (2) (3) (4)
Opening applicant's website 0.18*** 0.29*** 0.37*** 0.23***
(0.05) (0.04) (0.06) (0.06)
Observations 255 504 242 262
Invitation rate
12
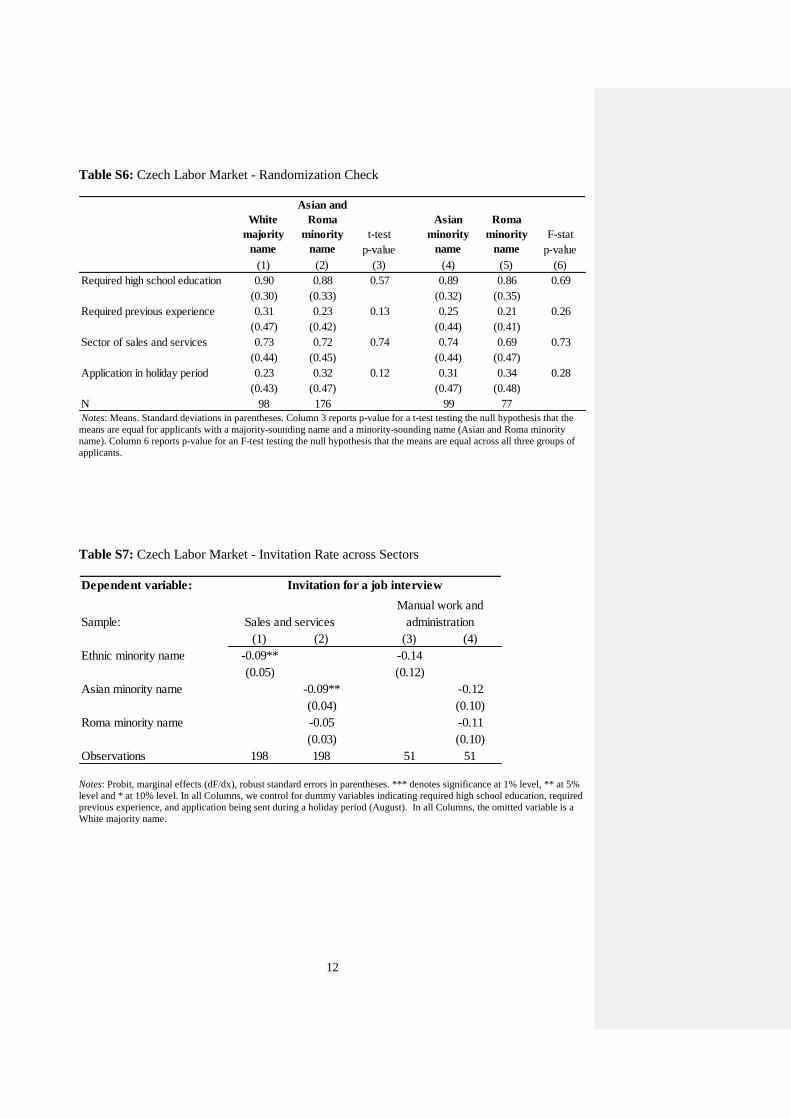
Table S6: Czech Labor Market - Randomization Check
Notes: Means. Standard deviations in parentheses. Column 3 reports p-value for a t-test testing the null hypothesis that the
means are equal for applicants with a majority-sounding name and a minority-sounding name (Asian and Roma minority
name). Column 6 reports p-value for an F-test testing the null hypothesis that the means are equal across all three groups of
applicants.
Table S7: Czech Labor Market - Invitation Rate across Sectors
Notes: Probit, marginal effects (dF/dx), robust standard errors in parentheses. *** denotes significance at 1% level, ** at 5%
level and * at 10% level. In all Columns, we control for dummy variables indicating required high school education, required
previous experience, and application being sent during a holiday period (August). In all Columns, the omitted variable is a
White majority name.
White
majority
name
Pooled
Asian and
Roma
minority
name
t-test
p-value
Asian
minority
name
Roma
minority
name
F-stat
p-value
(1) (2) (3) (4) (5) (6)
Required high school education 0.90 0.88 0.57 0.89 0.86 0.69
(0.30) (0.33) (0.32) (0.35)
Required previous experience 0.31 0.23 0.13 0.25 0.21 0.26
(0.47) (0.42) (0.44) (0.41)
Sector of sales and services 0.73 0.72 0.74 0.74 0.69 0.73
(0.44) (0.45) (0.44) (0.47)
Application in holiday period 0.23 0.32 0.12 0.31 0.34 0.28
(0.43) (0.47) (0.47) (0.48)
N 98 176 99 77
Dependent variable:
Sample:
(1) (2) (3) (4)
Ethnic minority name -0.09** -0.14
(0.05) (0.12)
Asian minority name -0.09** -0.12
(0.04) (0.10)
Roma minority name -0.05 -0.11
(0.03) (0.10)
Observations 198 198 51 51
Manual work and
administrationSales and services
Invitation for a job interview
13
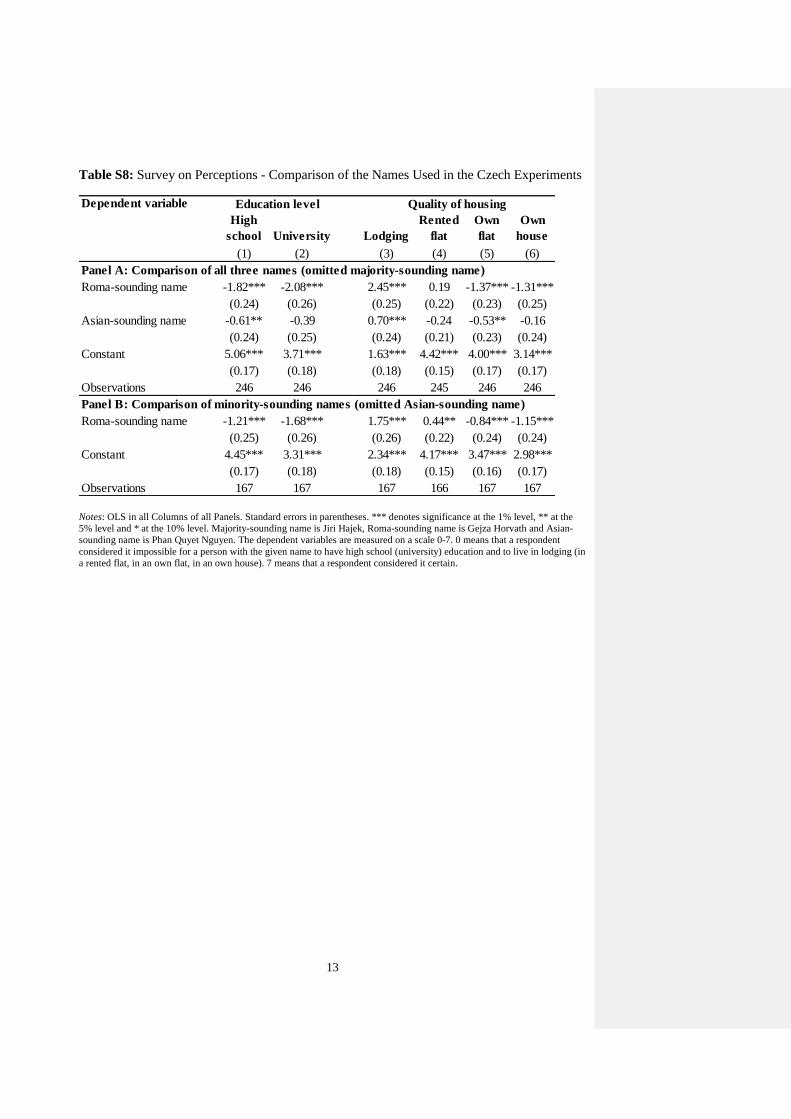
Table S8: Survey on Perceptions - Comparison of the Names Used in the Czech Experiments
Notes: OLS in all Columns of all Panels. Standard errors in parentheses. *** denotes significance at the 1% level, ** at the
5% level and * at the 10% level. Majority-sounding name is Jiri Hajek, Roma-sounding name is Gejza Horvath and Asian-
sounding name is Phan Quyet Nguyen. The dependent variables are measured on a scale 0-7. 0 means that a respondent
considered it impossible for a person with the given name to have high school (university) education and to live in lodging (in
a rented flat, in an own flat, in an own house). 7 means that a respondent considered it certain.
Dependent variable
High
school University Lodging
Rented
flat
Own
flat
Own
house
(1) (2) (3) (4) (5) (6)
Panel A: Comparison of all three names (omitted majority-sounding name)
Roma-sounding name -1.82*** -2.08*** 2.45*** 0.19 -1.37*** -1.31***
(0.24) (0.26) (0.25) (0.22) (0.23) (0.25)
Asian-sounding name -0.61** -0.39 0.70*** -0.24 -0.53** -0.16
(0.24) (0.25) (0.24) (0.21) (0.23) (0.24)
Constant 5.06*** 3.71*** 1.63*** 4.42*** 4.00*** 3.14***
(0.17) (0.18) (0.18) (0.15) (0.17) (0.17)
Observations 246 246 246 245 246 246
Panel B: Comparison of minority-sounding names (omitted Asian-sounding name)
Roma-sounding name -1.21*** -1.68*** 1.75*** 0.44** -0.84*** -1.15***
(0.25) (0.26) (0.26) (0.22) (0.24) (0.24)
Constant 4.45*** 3.31*** 2.34*** 4.17*** 3.47*** 2.98***
(0.17) (0.18) (0.18) (0.15) (0.16) (0.17)
Observations 167 167 167 166 167 167
Education level Quality of housing

14
Table S9: German Labor Market - Randomization Check
Notes: Means. Standard deviations in parentheses. Column 3 reports p-value for a t-test testing the null hypothesis that the
means are equal for applicants with a majority-sounding name and a Turkish minority-sounding name. Column 7 reports p-
value for an F-test testing the null hypothesis that the means are equal for applicants who do not provide any information
about unemployment, for those who say they have been two months unemployed and for those who say they have been a year
and a half unemployed.
Experimental manipulation:
White
majority
name
Turkish
minority
name
t-test
p-value
No
Information
2 months
unemployed
18 months
unemployed
F-stat
p-value
(1) (2) (3) (4) (5) (6) (7)
Required high school education 0.28 0.30 0.67 0.29 0.25 0.33 0.21
(0.45) (0.46) (0.45) (0.44) (0.47)
Required previous experience 0.57 0.54 0.45 0.53 0.59 0.55 0.39
(0.50) (0.50) (0.50) (0.49) (0.50)
City with more than 1 million inhabitants 0.18 0.20 0.37 0.18 0.21 0.19 0.61
(0.38) (0.40) (0.38) (0.41) (0.40)
Application in holiday period 0.17 0.24 0.02 0.21 0.20 0.22 0.92
(0.38) (0.43) (0.41) (0.40) (0.41)
Sector: manufacturing and construction 0.11 0.09 0.44 0.09 0.10 0.11 0.65
(0.31) (0.29) (0.29) (0.30) (0.32)
Sector: information and communication 0.17 0.17 0.91 0.19 0.16 0.15 0.42
(0.38) (0.37) (0.39) (0.36) (0.35)
Sector: administration 0.19 0.15 0.23 0.16 0.20 0.16 0.36
(0.39) (0.36) (0.37) (0.40) (0.36)
Sector: professional, scientific and technical
activities 0.32 0.36 0.20 0.35 0.29 0.37 0.30
(0.47) (0.48) (0.48) (0.46) (0.48)
Other sector 0.22 0.23 0.79 0.22 0.25 0.22 0.74
(0.42) (0.42) (0.41) (0.43) (0.42)
N 366 379 372 187 186
Name of applicant Information about unemployment