Embed Size (px)
Citation preview
A Web Survey Analysis of Subjective Well-being
Martin Guzi and Pablo de Pedraza
(forthcoming in the International Journal of Manpower, 2015)
ABSTRACT Purpose – This paper explores the role of work conditions and job characteristics with respect to three subjective well-being indicators: life satisfaction, job satisfaction and satisfaction with work-life balance. From a methodological point of view, the paper shows how social sciences can benefit from the use of voluntary web survey data. Design/methodology/Approach – The paper makes use of a large sample of individual data obtained from voluntary web surveys collected as part of the WageIndicator project. The sample includes extensive information on the quality of working conditions together with different well-being indicators. The Propensity Score Adjustment weights are used to improve the sample performance. Findings – The results shed light on the importance of certain job characteristics not only in determining job satisfaction, but also in other SWB domains. The findings support the theory of spillover perspectives, according to which satisfaction in one domain affects other domains. Research limitations implications – As a voluntary web-survey, WageIndicator is affected by selection bias. The validity of the sample can be improved by weighting, but this adjustment should be made and tested on a country-by-country basis. Originality/Value – The paper provides analysis of the quality of a web survey not commonly used in happiness research. The subsequent presentation of the effects of working conditions on several satisfaction domains represents a contribution to the literature. Keywords: subjective well-being, web-surveys, working conditions, quality of work JEL classification: J28, J81
Corresponding author: Martin Guzi Faculty of Economics and Administration Department of Public Economics Lipova 507/41a 602 00 Brno Czech Republic E-mail: [email protected] Tel: 00420549496766 Pablo de Pedraza García Amsterdam Institute for Advanced Labour Studies,(AIAS), University of Amsterdam Plantage Muidergracht 12 1018TV The Netherlands Departamento de Economía Aplicada Universidad de Salamanca Salamanca 37007 Spain Acknowledgment This research was supported by the STSM Grant from the COST Action WEBDATANET IS1004 and the programme “Employment of Best Young Scientists for International Cooperation Empowerment" (CZ.1.07/2.3.00/30.0037). We thank Kea Tijdens, Miguel Loriz and an anonymous referee for their comments and suggestions. Any errors in this text are the responsibility of the authors.
1
1. Introduction
The aim of this paper is to assess the role of work conditions and job characteristics
with respect to three subjective well-being (SWB) indicators: life satisfaction, job
satisfaction and satisfaction with work-life balance. According to Frey and Stutzer
(2010), research into SWB should remain open to constructing different indicators for
different aspects of life. This paper emphasizes the role of work-related characteristics
as a specific and very important aspect of life. We argue that in developed countries
employed individuals spend on average one-third of their time each day at the
workplace, so the quality of their working life can have an impact on the various
domains of SWB. Existing empirical research in this area relies on traditional surveys,
which are limited in scope. This paper offers an alternative, by making use of a large
sample of individual data collected as part of the WageIndicator project. The data is
obtained from a voluntary web survey1 and includes extensive information on the
quality of working conditions, together with several SWB indicators. This paper
explores the sample to analyze how important an aspect of life work conditions are.
The second contribution this paper makes is methodological. Wage Indicator data is
obtained from voluntarily completed online questionnaires. The sample is calibrated
with propensity score adjustment (PSA) weights and its quality is tested in comparison
with a probabilistic survey. We show that both samples deliver remarkably comparable
conclusions. The robustness of these findings is further discussed in comparison with
the existing literature. This paper is an explorative study that uses Spanish data from the
WageIndicator project to study SWB. We hope to encourage the use of WageIndicator
survey in academic research for further exploration of the characteristics of the labour
1 We refer to the voluntary web surveys data when samples are obtained from questionnaires posted on Internet and answered by web-visitors voluntarily and to the probabilistic sample or traditional survey when participants are randomly selected according to a sample frame.
2
market in relation to individual conditions. The paper's innovation and contribution to
the literature is its analysis of the quality of a web survey that has not been used
commonly in happiness research so far, and its presentation of the effects of working
conditions on several satisfaction domains.
The paper proceeds as follows: in Section 2 we discuss the advantages and
disadvantages of web data. Section 3 presents previous findings from SWB literature,
focusing in particular on the role of working conditions. In Section 4 we present the
data qualities. In Section 5 we explore the role of individual characteristics and the
quality of working conditions in the different domains of SWB. Section 6 concludes.
2. The advantages and disadvantages of web-survey data.
Internet activity generates a lot of information. Reips (2006) distinguishes four methods
of web data collection: non-reactive web data; web-based experimenting; web-based
testing; and web-surveying. The strengths and weaknesses of web surveys are
discussed; arguments in favor of web data emphasize its cost benefits, the speed of data
collection in large quantities and in real time, the flexibility of questionnaire design, and
the potential to reach respondents across national borders, enabling multi-country,
multilingual, and quasi-global homogenized surveys (De Leeuw, 2008). Voluntary web
surveys are a specific type of web survey which entail particular problems and sources
of error (Couper, 2000): respondents voluntarily self-select themselves to participate in
the survey (sampling error), the sample does not reach respondents who are without
access to the Internet (coverage error), and the sample only includes people who are
willing or able to complete the survey (nonresponse error). This sample bias constitutes
a major problem for the usage of such data and, according to survey methodology, two
3
approaches can be implemented to minimize the sources of error. First, the sample bias
can be improved by applying “design-based” approaches, which may include, among
other measures, running a parallel survey targeted at groups that are likely
underrepresented in the sample, media and targeting campaigns, or providing Internet
access to those individuals without it. Second, the “model-based” approach attempts to
correct the bias of voluntary web surveys by applying weighting techniques. In this
paper we follow the model based approach2 using a representative sample to study the
bias and the national Labor Force Surveys to calibrate the sample using PSA weights.
This technique has been debated in the existing literature for its performance and the
ability to remove bias (e.g. Lee and Valliant, 2009; Schonlau et al., 2009; Pedraza et al.
2010; Steinmetz et al. 2014a).
Samples obtained from voluntary web surveys are, to a certain extent, comparable to the
non-reactive data generated by Internet activity. The collection method does not use a
sampling frame in either case, so the usability of the data in the social sciences is
limited due to uncertainty about the external validity of the findings. Researchers have
however shown that non-reactive web data can be used to describe socioeconomic
processes, such as health worsening during the economic downturn (Askitas and
Zimmermann, 2011), unemployment developments (Askitas and Zimmermann, 2009),
or automobile sales (Choi and Varian, 2012). Similarly, data about Internet diffusion
and Internet usage are used to show that technology has contributed to greater efficiency
in marriage matching (Bellou, 2014).
2 The Spanish website www.tusalario.es was promoted at its creation through trade unions, media releases and particularly via search engine optimization, practices suggested by the design-based approach. Key words such as “compara tu salario" and "comparar salario" appear on the first Google search page.
4
Common procedure when evaluating voluntary web surveys also includes
benchmarking the data (Yeager et al. 2011), either with information from other sources
(Pedraza et al., 2010), or by demonstrating their ability to empirically corroborate
theoretical models (Bustillo and Pedraza, 2010). Compared to non-reactive data,
voluntary web surveys include richer information about respondents, which may be
used in a multivariate analysis (Couper, 2013). In section five we show the comparison
of the Wage Indicator sample and probabilistic samples, and discuss findings from
analysis with existing literature.
3. An overview of SWB literature
Research into subjectively reported measures has received reasonable attention over the
last two decades. Kahneman and Krueger (2006) demonstrated that the validity of SWB
data can be assessed, in part, by identifying their correlations with other characteristics
of individuals. Many studies conclude that although subject to many caveats, SWB
measures complement traditional welfare analyses and their findings can be taken into
consideration when formulating economic policy (Layard, 2005).
The academic literature on SWB has studied the impact of various individual
characteristics such as gender (Clark, 1997; Graham and Chattopadhyay, 2013;
Stevenson and Wolfers, 2009), age (Clark et al. 1996; Blanchflower and Oswald, 2008),
education (Cuñado and de Gracia, 2012), marital status (Gardner and Oswald, 2006;
Stutzer and Frey, 2006) and children (Angeles, 2010). It has been found that SWB
correlates with macro-economic factors (Di Tella at al., 2001), and recent studies
document the impact of migration on SWB (Betz and Simpson, 2013; Longhi, 2014).
Standard face-to-face surveys are limited in terms of the number of observations per
country, and therefore researchers typically perform SWB analysis by pooling the
5
observations from several countries in order to obtain a robust estimate.3 Oswald (2002)
explores the relationship between quality of work and SWB by using pooled
Eurobarometer surveys from 1996. He demonstrates the positive impact of some
important job characteristics on job satisfaction, such as supervisory role, employment
in the public sector, job security, and short travelling time to work. These findings are
confirmed by Drobnic et al. (2010), who study the link between job characteristics and
overall level of life satisfaction using the 2003 European Quality of Life Survey, and
discover that the impact of working conditions on life satisfaction is stronger in
Southern and Eastern European countries compared with Western European countries.
Job insecurity, work commuting, long working-hours and a boring job are identified as
major negative factors to life satisfaction. By contrast, jobs involving greater autonomy,
more supervisory roles, and well-paid positions deliver higher satisfaction to workers.
The estimates from separate country regressions, however, show low statistical power to
corroborate the general findings, mainly due to their small sample size. Clark (2001)
observes that workers cite job security as the most important aspect of a job followed by
pay, the work itself, and the use of initiative. These same aspects are also identified as
correlating the most strongly with reported job satisfaction. Origo and Pagani (2009)
use the 2001 Eurobarometer surveys to show that in European countries what matters
for job satisfaction is not the type of contract, but the workers' perceived job security.
Psychology journals have demonstrated a strong link between work-life balance and job
satisfaction. There is a negative relationship between long work hours and satisfaction
with work-life balance (Valcour, 2007) and this effect is stronger among more
dissatisfied workers (McNamara et al. 2013). Findings from meta-analyses confirm that
3 Only a few countries organize household panel surveys in large numbers that are suitable for studying life-satisfaction determinants (e.g. Germany, the Netherlands, the United Kingdom, Australia and the USA). International evidence often relies on the European Social Survey, the European Quality of Life Survey, Eurobarometer and the World Values Surveys.
6
family satisfaction is explained by work related variables and that job satisfaction is
explained by family variables (Ford et al. 2007).
In our analysis we demonstrate that web survey data can replicate the findings obtained
in representative population surveys. The Spanish population has been closely studied
using ECTV samples4 (e.g. Alvarez and Sinde-Cantorna, 2014; Garcia-Serrano, 2009;
Gamero, 2007; 2009; Namkee, 2007). Their findings are consistent with previous
research showing that job insecurity, long working hours, commuting, inadequate wages
and over-qualification are negatively correlated with life satisfaction and job
satisfaction. Estimates based on contract type and work in the public sector are not
confirmed as significant, possibly because the influence of these factors is indirect
through other work attributes. Namkee (2007) evaluates the role work flexibility, work
independence, trust in superiors, and a pleasant and low-stress work environment have
in influencing satisfaction, and concludes that the combined effect of these intangible
job characteristics on life satisfaction is several times larger than that of doubling an
individual’s wage.
In general, the empirical evidence on SWB confirms that the quality of working
conditions is important. In the following sections, we contribute to the literature by
testing whether the above findings can be corroborated with the sample obtained from
the voluntary web survey.
4. Data and summary statistics
In our analysis we use samples from two sources. The first source is a web survey
posted at www.tusalario.es - the Spanish website of the Wage Indicator project.
Detailed information about the Wage Indicator project, the web survey's characteristics,
4 In 1999, the Spanish Ministry of Labor and Social Affairs initiated the Quality of Working Life Survey (ECTV). It was an annual representative survey of Spanish workers, which collected information about labor relations and quality of life in the workplace. The survey did not follow respondents over time and data collection was officially terminated in 2010.
7
the questionnaire and a description of variables can be found in Tijdens et al. (2010).
Secondly, we make use of the European Social Survey (ESS), which interviews all
respondents on a face-to-face basis and is representative of the Spanish population. Both
databases include information about individual and household characteristics, work
conditions and SWB. The desirable time coverage and representativeness makes the
ESS a suitable dataset to compare with the WageIndicator sample. ESS is commonly
used to study life satisfaction in the European context (e.g. Caporale, et al. 2009; Betz
and Simpson, 2013) as well as in Spain (e.g. Cuñado and de Gracia, 2012).
The samples are limited to employed individuals aged between 15 and 64 years and to
complete observations collected between 2005 and 2011. The advantage of the
WageIndicator sample is that it is collected in substantially larger numbers than ESS (in
total there are 3,445 observations in the ESS and 20,095 in the WageIndicator sample).
4.1. The representativeness of the sample
The online samples include information collected from voluntarily submitted
questionnaires and therefore their representativeness must be tested. Pedraza et al.
(2010) explore the Spanish WageIndicator sample and calculate PSA weights to adjust
the sample. We follow their approach and calculate weights based on the sample of
employed individuals, distinguished by gender, age, education and 17 regions using
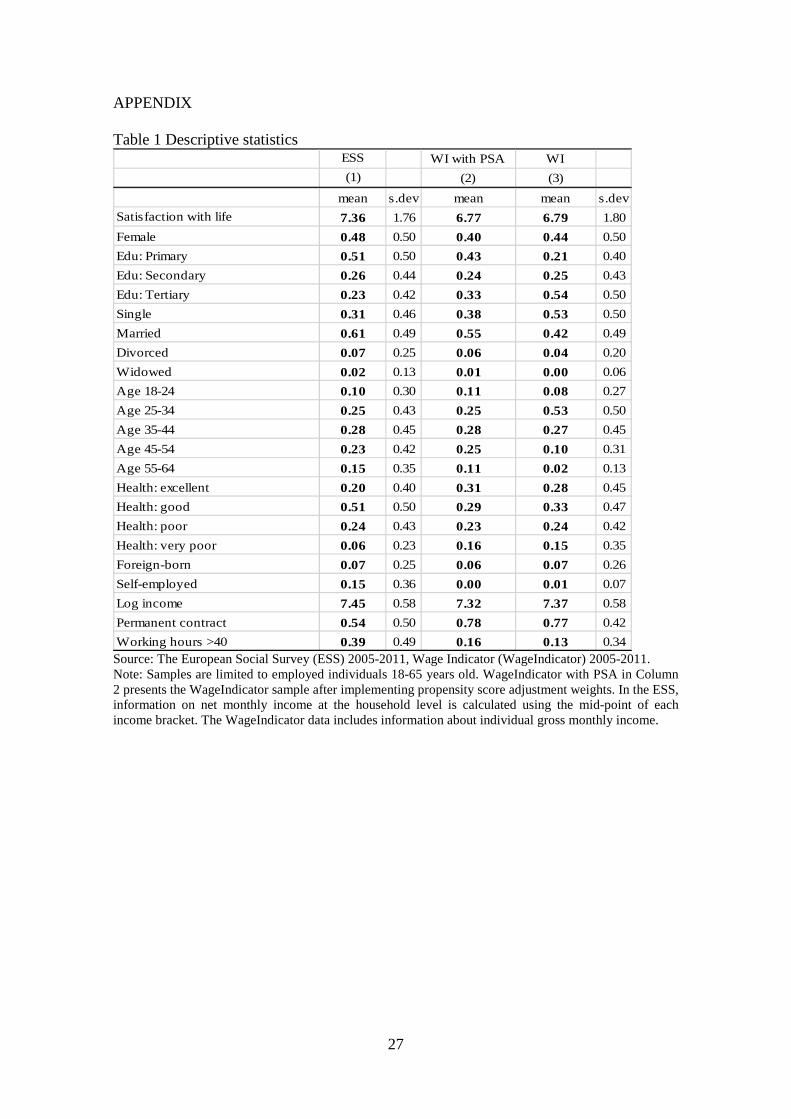
Spanish Labor Force Surveys. Table 1 shows the sample characteristics of the ESS and
WageIndicator samples. Column 2 presents the WageIndicator sample after
implementing the PSA weights, and Column 3 shows the statistics of the WageIndicator
sample without weights. If the ESS sample is taken to be representative of the Spanish
population, then younger and more highly educated participants are overrepresented in
the WageIndicator sample. It is unsurprising that younger and more educated web-
visitors are more prone to complete online questionnaires, and some discrepancies
8
between the WageIndicator and ESS samples can be attributed to lower Internet
accessibility among older and less educated groups. The application of the PSA weights
is effective in moving the estimated mean of the WageIndicator sample closer to that of
the whole population. Several sample characteristics, such as the share of females or the
share of foreign-born workers, are very similar in both samples. By contrast, self-
employed workers are largely underrepresented in the WageIndicator sample.
Comparison of the two data sets further reveals that respondents in the WageIndicator
sample report substantially lower life satisfaction levels. While the sample
characteristics of WageIndicator differ from the ESS in several ways, the lower reported
levels of life satisfaction in the WageIndicator sample could be caused by factors other
than the sample composition.5 In the next section, we contrast the WageIndicator
sample with the ESS in the life satisfaction regression framework.
5. Estimation and results
In our analysis, we follow SWB literature as regards dependent variable definition,
model specifications and estimation methodologies. Because the dependent variable is
an ordinal response variable, an ordered logit model is the most appropriate estimation
technique. The OLS method is however commonly used (for the benefit of coefficient
interpretation) and literature confirms that treating the aggregated answers as continuous
variables leads to the same conclusions (e.g. Ferrer-i-Carbonell and Frijters, 2004). The
results from the analysis cannot be interpreted in a causal way because these data sets
do not follow the same individuals each year, and therefore the analysis does not correct
for unobserved individual effects.
5.1 Comparisons of the WageIndicator and ESS samples
5 De Leeuw (2008) suggests that information provided in self-administered questionnaires is more reliable than that obtained in interviewer-assisted surveys, especially when questions intrude on sensitive or private matters.
9
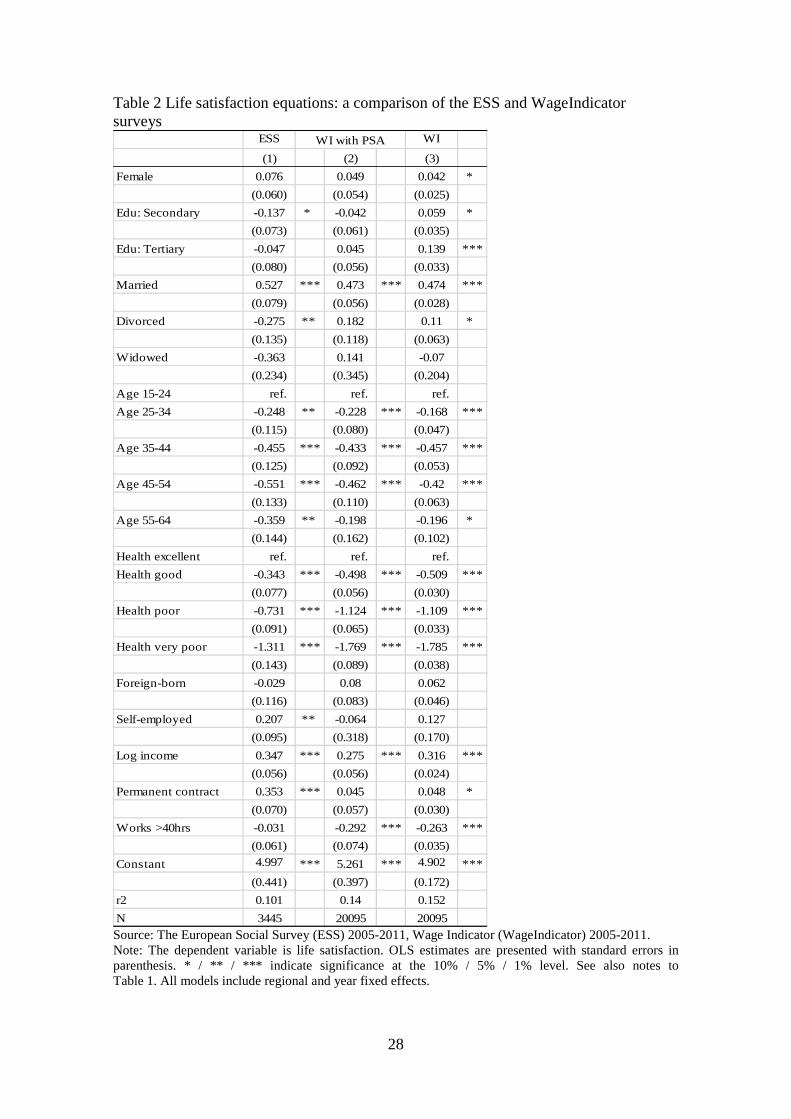
We use the OLS estimation method and include generally accepted determinants of
SWB that are available in both surveys.6 Table 2 presents our estimates for the ESS
sample (Column 1), for the WageIndicator sample with weights (Column 2) and for the
WageIndicator sample without weights (Column 3). The estimates are consistent with
the findings presented in the literature (e.g. Frey and Stutzer, 2002). The important
factors for SWB are health, marital status, age, and income, all of which are identified
as having a significant relationship, with the expected sign, in both samples. Income is a
prominent variable in life satisfaction models, however the measure of income is not
compatible between the two surveys, and therefore its marginal effects cannot be
compared.7 We identify a particularly strong impact from health variables, with
decreased health status leading to a sharp drop in well-being. The estimates from the
WageIndicator sample exhibit very similar patterns to the estimates from the ESS
sample. Furthermore, the coefficients from the WageIndicator sample with the PSA
weights applied are closer to those obtained from the ESS data. Even so, a few
differences are observed between the ESS and WageIndicator samples: for example, the
estimate on dummy variables for divorced individuals delivers different conclusions for
the two samples. The estimated coefficients relating to permanent contracts are positive
in both samples, although for the WageIndicator adjusted sample the standard error is
larger and the estimate is not significant. The variable indicating long working hours is
imprecisely estimated in the ESS sample, probably due to the high share of workers
working long hours (see Table 1). Long working hours are identified as having a
negative and highly significant effect in the WageIndicator sample. In our subsequent
6 The subjective well-being is determined in both surveys by the question, “All things considered, how satisfied are you with your life as a whole nowadays?” Possible answers range from 1 to 10 where 1 stands for "Not satisfied at all" and 10 "completely satisfied". The scale in the ESS ranges from 0 to 10, and therefore zeros are replaced with ones (0.6% of the cases). 7 ESS includes information on net monthly household income banded into eleven categories. We include log income calculated using the mid-point of each income bracket (the same approach is adopted in Betz and Simpson (2013)). The WI sample includes information on individual gross monthly income.
10
analysis, we will rely on the WageIndicator sample with PSA weights, as it delivers
estimated parameters closer to those obtained from the representative sample.
5.2. Estimates from web surveys
The analysis focuses on three areas. First, we compare the estimates to the findings
generally accepted in the literature. Second, we discuss the stability of baseline
estimates for the inclusion of variables indicating the quality of work. Third, we
demonstrate the importance of working conditions in the three domains of SWB (see
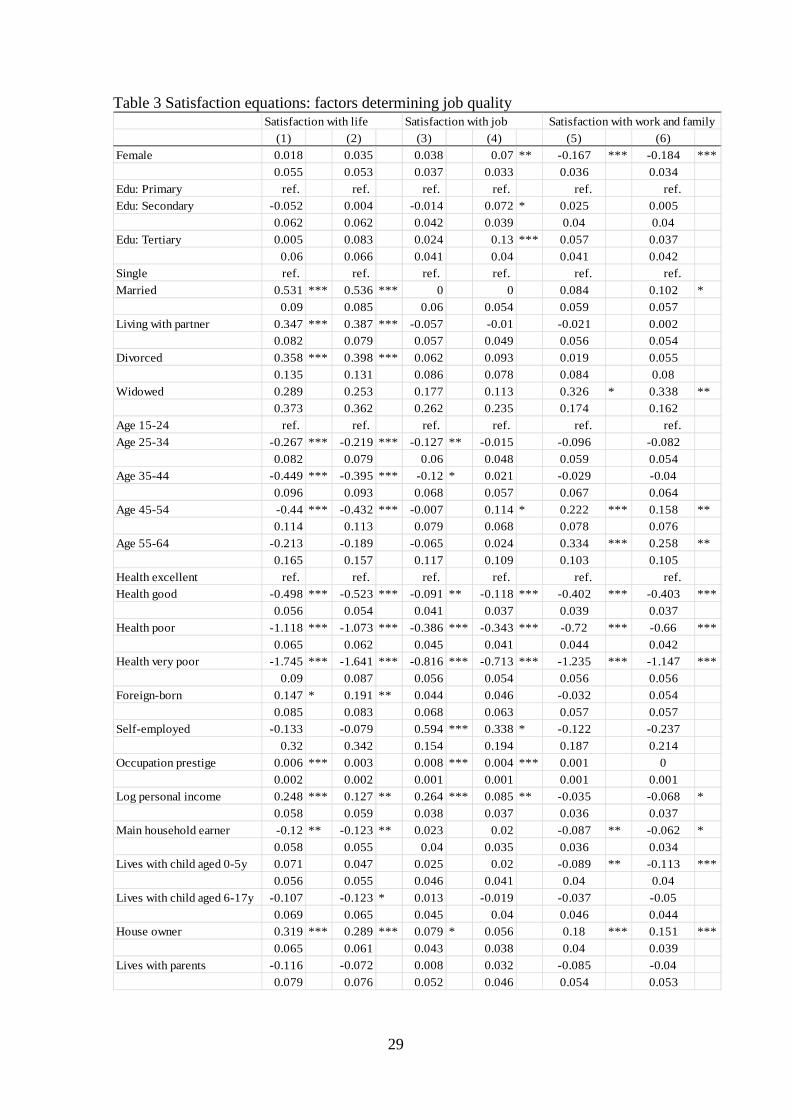
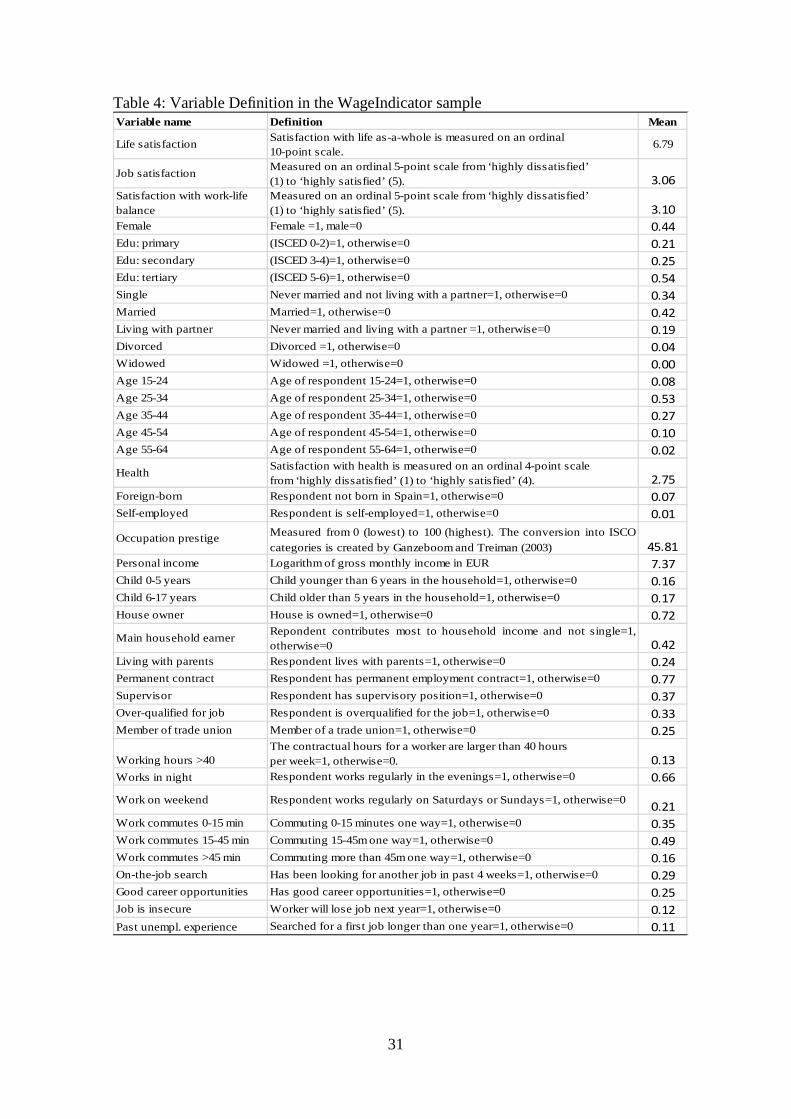
Table 4 for details of the variables). The remainder of this section discusses the findings
presented in Table 3.
Gender
Recent literature provides robust evidence that women are more satisfied than men, but
the difference has diminished substantially over recent years (Graham and
Chattopadhyay, 2013; Stevenson and Wolfers, 2009). Women are also observed to have
higher job satisfaction than men, despite women’s jobs being worse by most objective
standards. Clark (1997) argues that women are more satisfied with their jobs because
their expectations are lower, and he shows that this satisfaction differential disappears
among the young, the more highly educated, and in male-dominated workplaces.
Studies of the Spanish population find that Spanish women are more satisfied with their
jobs (e.g. Gamero, 2007, 2009), and our analysis confirms this finding. Furthermore, it
is reasonable to expect that ability to combine work and family varies between men and
women, given their traditionally different family responsibilities. Our results confirm
that women are significantly less satisfied with their work-life balance than men.
Education
The relationship between education and SWB is ambiguous; some studies find that it is
positive (e.g. Di Tella et al., 2001; Diener et al., 1999) and others find it negative (e.g.
11
Clark, 1997; Caporale et al., 2009). A possible explanation for this latter result is that
education raises aspirations that are subsequently not fulfilled, in part because highly
educated workers have a higher probability of skill mismatch in the labor market.
Cuñado and de Gracia (2012) use the Spanish ESS sample to show that coefficients for
education variables become insignificant in the life satisfaction equation when the
financial situation (proxy for income) is controlled. These results suggest that the effect
of education on SWB is mediated via income. In our analysis, education is identified as
having a positive impact on job satisfaction, while it is not confirmed as being
significant in other domains.
Marital status
There are a number of studies showing positive relationship between marriage and
SWB (e.g. Dienner et al., 1999). According to Becker (1981), married individuals enjoy
the benefits of household production and labor division. Sociologists and psychologists
emphasize the increased emotional support and relational gratification (Stutzer and
Frey, 2006). Our analysis supports these arguments since the variables describing
married and cohabiting individuals display a positive association with life satisfaction,
and their magnitudes do not change significantly when working conditions are
accounted for. The evidence indicates that people living as couples are often happier.
Gardner and Oswald (2006) provide longitudinal evidence that divorce produces a rise
in well-being. We obtain a positive coefficient for the divorce variable in life
satisfaction, which corroborates this finding. In the WageIndicator sample, marital
status is not identified as having any association with job satisfaction, but marriage
displays a positive correlation with work-life balance satisfaction.
Age
12
The U-shape relationship of life satisfaction and age is a robust finding in the literature
(Blanchflower and Oswald, 2008). The WageIndicator sample demonstrates that
younger and older people are generally more satisfied with life, while people in their
mid-40s report the lowest levels of life satisfaction. This pattern is preserved in the
augmented model, although minimum life satisfaction is observed at a slightly higher
age, which indicates that older workers are employed in occupations with potentially
better working conditions. Clark et al. (1996) provide evidence of a U-shape
relationship between age and job satisfaction, and point to the role of non-job factors in
this relationship. Our analysis shows that young workers record low levels of job
satisfaction and that workers in the 45-54 age group exhibit higher levels of job
satisfaction. Interestingly, estimates imply that, ceteris paribus, older workers also
report higher levels of satisfaction with work-life balance. We conclude that a non-
linear pattern (resembling U-shape) of satisfaction scores with age is present across all
domains.
Health status
Individual health status is ranked as one of the most valued aspects in people’s lives
(OECD, 2012). Results from the literature confirm that a robust relationship exists
between health and SWB (e.g. Betz and Simpson, 2013; Caporale et al., 2009). The
correlation between self-reported individual health status and satisfaction levels in
WageIndicator sample is very strong in all domains of SWB. The magnitude of the
health coefficients changes only slightly in the augmented models, which corroborates
the importance of good health for personal well-being.
National origin
Empirical evidence is not conclusive on whether migrants who move to new places in
search of a better life can indeed achieve that. They may have false expectations about
13
their future achievement, or their aspirations may change as their reference group
changes. Otrachshenko and Popova (2014) observe a stronger intention to migrate
among people with lower levels of satisfaction. This would point to the selection of
migrants with low satisfaction scores. Our analysis, however, finds that foreign-born
individuals experience higher life satisfaction in comparison with natives. This positive
effect does not translate to other domains of satisfaction, however. Gamero (2010) finds
lower job satisfaction scores among the migrant population in Spain, but this gap is
fully explained by the differences in their job characteristics.
Income and wealth
Personal income and wealth are essential components of individual well-being. Life
satisfaction increases with income, which is a fundamental finding in the literature (e.g.
Caporale, et al. 2009; Frey and Stutzer, 2002). Jobs with higher pay often come with
better conditions, so the decline in the coefficient on income is reasonable when work-
related variables are included in the model. Importantly, the negative coefficient for
personal income in the augmented model implies lower satisfaction with work-life
balance among high-income workers. Home ownership is used as a proxy for wealth in
the regressions. As expected, this variable exhibits a strong positive correlation to SWB.
Occupational prestige
Occupational prestige is measured as an index with 0 being the lowest possible score
and 100 being the highest, which records the perceived prestige (or admiration) of each
occupation in the society (for more details see Ganzeboom and Treiman, 2003). A
robust and positive relationship between prestige and job satisfaction indicates that
having a role that is respected in society serves as an additional benefit to the worker.
This effect, however, does not spill over into other satisfaction domains.
Self-employment
14
The literature has found that the self-employed exhibit higher levels of job satisfaction
than employees (e.g. Millan et al., 2013), and that this effect is a result of the flexibility
and autonomy that self-employment allows (Alvarez and Sinde-Cantorna, 2014). The
Spanish labor market is generally characterized by a high percentage of self-employed
workers (16 % in 2011), however this group is underrepresented in the WageIndicator
sample (the share is below 1%). Estimates obtained from our analysis are in line with
the literature: the self-employed are identified as reporting higher levels of satisfaction
with their job than employed workers. This relationship is not confirmed in the other
SWB domains.
Family arrangements
We have already demonstrated that marital status is correlated with SWB. Further to
this, we included variables describing family situation (whether children younger than 6
years of age, or older than 6 years of age live in the respondent's household) and
household commitments (the role of the breadwinner). Our estimates confirm a negative
association between life satisfaction and the presence of older children, while
satisfaction with work-life balance shows a negative association with the presence of
young children. The controls used in the literature for children take various formats (e.g.
total number of children, children by age category, etc.) and also there is substantial
ambiguity surrounding the direction of the effect, because evidence based on cross-
section analysis differs from findings obtained through fixed effects analysis. Angeles
(2010) estimates a negative correlation between life satisfaction and children, using a
pooled observation from a British household panel survey. However, when he applies a
fixed effects regression, the effects become closer to zero, and Angeles identifies
positive effects for married couples.
15
The breadwinner - the person supporting the family with his or her earnings - typically
bears the greatest amount of responsibility, but also has greater difficulty balancing
family life with work. In our analysis, the breadwinner variable captures a negative
association with life satisfaction and satisfaction with work-life balance, which is as
expected.
The variable indicating that the respondent lives with their parents may reflect difficulty
among young people with providing their housing, even though the presence of their
parents may also benefit them. It is difficult to conclude which effect prevails, also
especially as the estimates imply no association with SWB. The most important finding
in this area is that none of the variables referring to family arrangements are correlated
with job satisfaction (note that we obtained the same outcome for marital status).
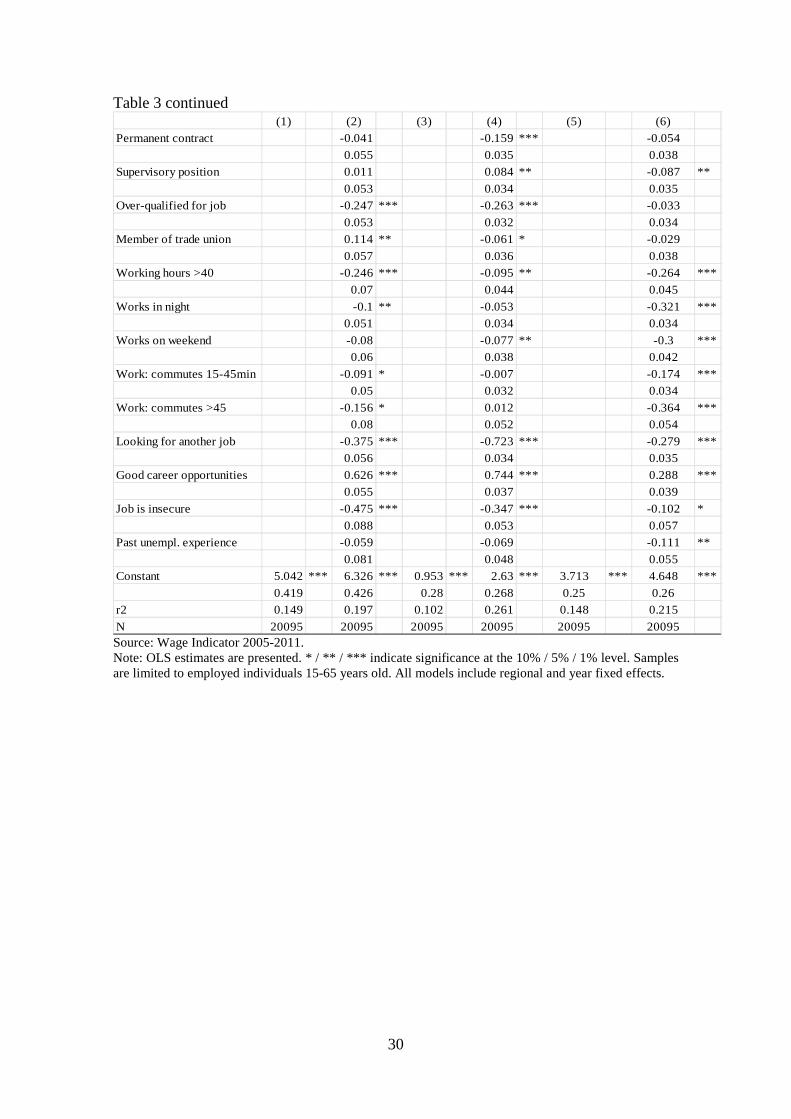
5.3 The role of working conditions
In this section, we explore the relationship between quality of work and worker
satisfaction in different domains. The characteristics of a good job are determined by
their reflection in SWB measurements. We explore a wide spectrum of indicators, such
as type of contract, supervisory position, union membership, working time schedule, job
qualification, work commuting, on-the-job search, job security and employment
prospects. As expected, the inclusion of working conditions substantially improves the
explanatory power of the models and the R-squared increases the most in the job
satisfaction model.
Type of contract
The Spanish labor market is characterized by a large share of workers employed on
fixed-term contracts, which are considered to be of lower quality (often characterized by
no severance pay, low benefits, fewer possibilities for on-the-job training and higher
16
turnover). Ferrer-i-Carbonell and Praag (2006) argue that in Spain fixed term contracts
are slow to transform into permanent contracts, and demonstrate that Spanish workers
with permanent contracts report higher levels of job satisfaction. Our estimates imply a
negative correlation between permanent contracts and job satisfaction. One explanation
for this is that the positive effect on satisfaction is delivered through other channels
made available by permanent contracts, such as higher pay, better job prospects,
supervisory positions, recognition at work and regular working hours.8
Being a supervisor
Supervisory positions are a step above the average employee and are associated with
higher pay, but also a higher degree of responsibility. Our estimates imply that holding
a supervisory position has no association with life satisfaction, but has a positive effect
on job satisfaction (this was also found by Gamero (2007)). Our estimates also imply
that workers in supervisory positions report lower satisfaction with their work-life
balance.
Working schedules
Irregular working schedules and long working hours have a negative impact on the
SWB of workers and reduce their level of job satisfaction (Clark, 2001; Namkee, 2007).
Drobnic et al. (2010) include working hours in quadratic form in their life satisfaction
regression and find that the point of inflection is around 41 hours per week. In our
analysis, working more than 40 hours a week or having an irregular working schedule
both display a negative association with all three well-being domains. Work in the
evenings or at weekends substantially decreases satisfaction with work-life balance.
Over-qualification
8 See Table 2: the coefficient relating to permanent contracts is significant and has positive sign when other working conditions are not controlled.
17
Over-qualification (also called over-education) refers to the situation when a worker’s
skills are beyond those required for their job. The literature documents that skill
mismatches impose significant wage penalties and result in lower levels of job
satisfaction (e.g. Badillo-Amador and Vila, 2013; Namkee 2007). On average, one-third
of the workers in the sample report that they are over-qualified for their job, while 6 per
cent of the workers report under-qualification. We estimate a negative impact from
over-qualification on a worker’s life and job satisfaction. This may be because workers
describing themselves as over-qualified may have invested in education but have
subsequently failed to receive the expected return or aspired status in their company. In
addition, these workers may be evaluating their status in relation to their counterparts
who have the same qualifications but are in better positions. The negative effect of job
mismatch does not translate, however, to the worker's satisfaction with work-life
balance.
Labor union membership
The activities people perform in order to contribute to the functioning of society
enhance their individual well-being (OECD, 2012). The literature, on the other hand,
suggests that the decision to join a trade union is a consequence of low job security and
job dissatisfaction; hence union membership shows a negative correlation with job
satisfaction (e.g. Clark 2001). Our analysis identifies union affiliation with both a
positive effect on life satisfaction, corresponding to the importance of civic engagement,
and a negative effect corresponding to job dissatisfaction.
Work commuting
Workers commute longer distances to work when it is financially rewarding to do so, or
because of additional welfare gained from a pleasant living environment. The literature
documents a significant negative effect on SWB caused by long commutes (e.g.
18
Drobnic et al. 2010; Gamero, 2009; Namkee, 2007). Our estimates imply that life
satisfaction and satisfaction with work-life balance are both negatively affected by long
commutes. This supports the theory that workers are likely to agree with commuting in
order to improve their situation in the labor market, but largely underestimate the
negative effects of commuting in other domains.
On-the-job search, job insecurity and future career prospects
Results from the literature demonstrate that employment stability is desirable for
workers, and significantly affects their SWB (e.g. Clark, 2001; Drobnic et al.,
2010;Origo and Pagani, 2009). In our model, we include variables indicating on-the-job
searches, job insecurity and good career prospects to demonstrate that employment
stability is positively related to SWB levels. Estimates from the WageIndicator sample
imply that workers employed in jobs with less security are less satisfied in all three
satisfaction domains. Similarly, individuals who are looking for another job while they
have a job indicate disappointment with their current employment situation, and this too
corresponds to lower SWB levels in all domains. In contrast, good career development
opportunities in one’s current place of work a positive effect. These findings illustrate
that favorable job prospects are very important determinants of satisfaction with work-
life balance.
The impact of past unemployment
It has not only been found that unemployed individuals feel frustrated, rejected, and left
out (e.g. Frey and Stutzer, 2002), but also that past unemployment negatively affects
SWB (e.g. Clark et al., 2001; Gamero, 2009). We test this hypothesis by including a
variable that identifies workers who have experienced a long-term spell of
unemployment in the past. The estimated coefficients are not significant at the
19
conventional level for life satisfaction or job satisfaction, but the stigma of past
unemployment persists in satisfaction with work-life balance.
6. Conclusions and discussion
This paper contributes to the literature from two different perspectives: the validity of
web survey data, and the role of job quality for SWB. In our analysis we have identified
several aspects of work characteristics that are particularly salient in the three different
domains of SWB ─ overall satisfaction with life, job satisfaction, and satisfaction with
work-life balance (the combination of family life and work). In general, our findings
support the theory of spillover perspectives (Georgellis and Lange, 2012), according to
which satisfaction in one domain (work) affects satisfaction in other domains (life and
family). Our analysis leads to several important conclusions:
1. Jobs with higher pay are often characterized by better working conditions. We
show that the positive impact of personal income is largely diminished (although not
entirely) when job-related variables are entered to the model. High-income earners are
however generally less satisfied with work-life balance.
2. Self-reported health appears to have the most important influence on SWB, with
those in very bad health reporting by far the lowest levels of SWB. This result is robust
to the inclusion of working conditions in the analysis.
3. Our findings confirm a strong link between job insecurity and low well-being.
Workers who deem that they will lose their job next year report lower satisfaction with
life, with their job, and with their work-life balance.
4. Conversely, good career development opportunities and job stability are
positively correlated with satisfaction scores in all three domains.
20
5. Our analysis suggests that certain job characteristics and working conditions,
such as long working hours, irregular working schedules and long work commutes have
strong detrimental effects on overall worker life quality. These findings confirm that
workers largely underestimate the negative effects of commuting on the quality of their
life when making decisions about commuting.
6. Job characteristics such as occupation prestige and a proper skill match have a
positive effect on life satisfaction and job satisfaction, but do not affect satisfaction with
work-life balance.
7. Past unemployment experience has a negative effect on satisfaction with work-
life balance.
In the current context of globalization and constant technological change, social
scientists should employ data generated on the Internet in their analysis in order to
benefit from the good quality of this type of data, and its ability to reflect
socioeconomic processes. Although web survey data do also have drawbacks, these can
be treated in tailored case-by-case approaches. In this paper, the findings obtained from
a web survey sample are found to be very comparable to estimates obtained from a
probabilistic sample, and consistent with the existing literature. We calibrate the web
data sample with PSA weights to reduce its bias, and this also brings the estimated
parameters closer to estimates from the reference sample. However, the application of
PSA cannot be done universally, as is debated in the literature (Steinmetz et al., 2014a).
More explorations and cases studies like this one would contribute to the discussion on
web data quality and data reliability for empirical research and statistical inference. The
WageIndicator project opens diverse research opportunities both from the perspective of
web survey methodology and in terms of exploring the survey content. As many non-
21
reactive data are generated on the web, future research will very likely focus on the
intersections and synergies between different types of web data that should be further
explored to improve web data quality and knowledge. This can be facilitated through
the existing multidisciplinary networking processes that are already proving efficient in
providing methodological solutions to problems related to web data (Steinmetz et al.,
2014b).
22
References
Álvarez, G. and I. Sinde-Cantorna, A. (2014), “Self-employment and job satisfaction: an empirical analysis”, International Journal of Manpower, Vol. 35 No. 5, pp. 688–702.
Angeles, L. (2010), “Children and life satisfaction”, Journal of happiness Studies, Springer, Vol. 11 No. 4, pp. 523–538.
Askitas, N. and Zimmermann, K.F. (2009), “Google Econometrics and Unemployment Forecasting”, Applied Economics Quarterly, Vol. 55 No. 2, pp. 107 – 120.
Askitas, N. and Zimmermann, K.F. (2011), Health and well-being in the crisis ( No. 5601), IZA Discussion Paper.
Badillo-Amador, L. and Vila, L.E. (2013), “Education and skill mismatches: wage and job satisfaction consequences”, International Journal of Manpower, Vol. 34 No. 5, pp. 416–428.
Becker, G.S. (1981), “Altruism in the Family and Selfishness in the Market Place”, Economica, Vol. 48 No. 189, pp. 1–15.
Bellou, A. (2014), “The impact of Internet diffusion on marriage rates: evidence from the broadband market”, Journal of Population Economics.
Betz, W. and Simpson, N.B. (2013), “The effects of international migration on the well-being of native populations in Europe”, IZA Journal of Migration, Vol. 2 No. 12.
Blanchflower, D.G. and Oswald, A.J. (2008), “Is well-being U-shaped over the life cycle?”, Social Science & Medicine, Vol. 66 No. 8, pp. 1733–1749.
Bustillo, R.M. de and Pedraza, P. de. (2010), “Determinants of job insecurity in five European countries”, European Journal of Industrial Relations, Vol. 16 No. 1, pp. 5–20.
Caporale, G.M., Georgellis, Y., Tsitsianis, N. and Yin, Y.P. (2009), “Income and happiness across Europe: Do reference values matter?”, Journal of Economic Psychology, Vol. 30 No. 1, pp. 42–51.
Choi, H. and Varian, H. (2012), “Predicting the present with google trends”, Economic Record, Vol. 88 No. s1, pp. 2–9.
Clark, A., Georgellis, Y. and Sanfey, P. (2001), “Scarring: The psychological impact of past unemployment”, Economica, Vol. 68 No. 270, pp. 221–241.
Clark, A., Oswald, A. and Warr, P. (1996), “Is job satisfaction U-shaped in age?”, Journal of occupational and organizational psychology, Vol. 69 No. 1, pp. 57–81.
Clark, A.E. (1997), “Job satisfaction and gender: Why are women so happy at work ?”, Labour Economics, Vol. 4 No. 4, pp. 341–372.
23
Clark, A.E. (2001), “What really matters in a job? Hedonic measurement using quit data”, Labour Economics, Vol. 8 No. 2, pp. 223–242.
Couper, M. (2013), “Is the sky falling? New technology, changing media, and the future of surveys”, Survey Research Methods, Vol. 7, pp. 145–156.
Couper, M.P. (2000), “Review: Web surveys: A review of issues and approaches”, Public opinion quarterly, Vol. 64 No. 4, pp. 464–494.
Cuñado, J. and de Gracia, F.P. (2012), “Does education affect happiness? Evidence for Spain”, Social indicators research, Vol. 108 No. 1, pp. 185–196.
Diener, E., Suh, E.M., Lucas, R.E. and Smith, H.L. (1999), “Subjective well-being: Three decades of progress.”, Psychological bulletin, American Psychological Association, Vol. 125 No. 2, p. 276.
Drobnič, S., Beham, B. and Präg, P. (2010), “Good job, good life? Working conditions and quality of life in Europe”, Social Indicators Research, Springer, Vol. 99 No. 2, pp. 205–225.
Ferrer-i-Carbonell, A. and Frijters, P. (2004), “How Important is Methodology for the estimates of the determinants of Happiness?”, The Economic Journal, Vol. 114 No. 497, pp. 641–659.
Ferrer-i-Carbonell, A. and van Praag, B.M.S. (2006), Insecurity in the labor market–The impact of the type of contract on job satisfaction in Spain and the Netherlands, Mimeo.
Ford, M.T., Heinen, B.A. and Langkamer, K.L. (2007), “Work and family satisfaction and conflict: A meta-analysis of cross-domain relations.”, Journal of Applied Psychology, Vol. 92 No. 1, pp. 57–80.
Frey, B.S. and Stutzer, A. (2002), “What can economists learn from happiness research?”, Journal of Economic literature, Vol. 40 No. 2, pp. 402–435.
Frey, B.S. and Stutzer, A. (2010), “Happiness and Public Choice”, Public Choice, Vol. 144 No. 3-4, pp. 557–573.
Gamero, C. (2007), “Satisfacción laboral y tipo de contrato en España”, Investigaciones económicas, Vol. 31 No. 3, pp. 415–444.
Gamero, C. (2009), “Job Satisfaction and On-the-Job Search: A Theoretical and Empirical Approach”, Revista de Economía Laboral, Vol. 6 No. 1, pp. 35–54.
Gamero, C. (2010), “Satisfacción laboral de los asalariados inmigrantes”, Revista de Economía Aplicada, Vol. 18 No. 54, pp. 33–56.
Ganzeboom, H.B.G. and Treiman, D.J. (2003), “Three internationally standardised measures for comparative research on occupational status”, Advances in Cross-National Comparison, Springer, pp. 159–193.
24
Garcia-Serrano, C. (2009), “Job satisfaction, union membership and collective bargaining”, European Journal of Industrial Relations, Vol. 15 No. 1, pp. 91–111.
Gardner, J. and Oswald, A.J. (2006), “Do divorcing couples become happier by breaking up ?”, Journal of the Royal Statistical Society, Vol. 169 No. 2, pp. 319–336.
Georgellis, Y. and Lange, T. (2012), “Traditional versus Secular Values and the Job-Life Satisfaction Relationship Across Europe”, British Journal of Management, Vol. 23 No. 4, pp. 437–454.
Graham, C. and Chattopadhyay, S. (2013), “Gender and well–being around the world”, International Journal of Happiness and Development, Vol. 1 No. 2, pp. 212–232.
Kahneman, D. and Krueger, A.B. (2006), “Developments in the Measurement of Subjective Well-Being”, Journal of Economic Perspectives, Vol. 20 No. 1, pp. 3–24.
Layard, R. (2005), “Rethinking Public Economics: The Implications of Rivalry and Habit”, Economics and Happiness: Framing the Analysis, Oxford and New York: Oxford University Press, pp. 147–169.
Lee, S. and Valliant, R. (2009), “Estimation for volunteer panel web surveys using propensity score adjustment and calibration adjustment”, Sociological Methods & Research, Vol. 37 No. 3, pp. 319–343.
De Leeuw, E.D. (2008), “Choosing the method of data collection.”, in de Leeuw, E.D., Hox, J.J. and Dillman, D.A. (Eds.),International handbook of survey methodology, Taylor & Francis Group, New York, pp. 113–135.
Longhi, S. (2014), “Cultural diversity and subjective well-being”, IZA Journal of Migration, Vol. 3 No. 13, pp. 1–19.
McNamara, T.K., Pitt-Catsouphes, M., Matz-Costa, C., Brown, M. and Valcour, M. (2013), “Across the continuum of satisfaction with work–family balance: Work hours, flexibility-fit, and work–family culture”, Social Science Research, Vol. 42 No. 2, pp. 283–298.
Millán, J., Hessels, J., Thurik, R. and Aguado, R. (2013), “Determinants of job satisfaction: a European comparison of self-employed and paid employees”, Small Business Economics, Springer US, Vol. 40 No. 3, pp. 651–670.
Namkee, A. (2007), Value of Intangible Job Characteristics in Workers ’ Job and Life Satisfaction : How much are they worth ?, Mimeo: Fedea.
OECD. (2012), How’s Life? Measuring well-being, OECD.
Origo, F. and Pagani, L. (2009), “Flexicurity and job satisfaction in Europe: The importance of perceived and actual job stability for well-being at work”, Labour economics, Vol. 16 No. 5, pp. 547–555.
25
Oswald, A. (2002), Are you happy at work? Job satisfaction and work-life balance in the US and Europe, Mimeo.
Otrachshenko, V. and Popova, O. (2014), “Life (Dis) Satisfaction and Decision to Migrate: Evidence from Central and Eastern Europe”, The Journal of Socio-Economics, Vol. 48 No. 1, pp. 40–49.
Pedraza, P. de, Tijdens, K., Bustillo, R.M. de and Steinmetz, S. (2010), “A Spanish Continuous Volunteer Web Survey: Sample Bias, Weighting and Efficiency”, Revista Española de Investigaciones Sociológicas, Vol. 131 No. -1, pp. 109–130.
Reips, U.D. (2006), “Web-based methods”, in Eid, M. and Diener, E. (Eds.),Handbook of multimethod measurement in psychology, American Psychological Association, Washington, DC, pp. 73–85.
Schonlau, M., Van Soest, A., Kapteyn, A. and Couper, M. (2009), “Selection bias in web surveys and the use of propensity scores”, Sociological Methods & Research, Vol. 37 No. 3, pp. 291–318.
Steinmetz, S., Bianchi, A., Tijdens, K. and Biffignandi, S. (2014a), “Improving web survey quality”, in Callegaro, M., Baker, M., Bethlehem, J., Göritz, A.S., Krosnick, J.A. and Lavrakas, J.P. (Eds.),A Data Quality Perspective, John Wiley & Sons, Ltd, pp. 273–298.
Steinmetz, S. et al. (2014b), “Innovation and quality in web-based data collection”, International Journal of Internet Science, Vol. 9 No. 1, pp. 64–71.
Stevenson, B. and Wolfers, J. (2009), “The Paradox of Declining Female Happiness”, American Economic Journal: Economic Policy, American Economic Journal: Economic Policy, Vol. 1 No. 2, pp. 190–225.
Stutzer, A. and Frey, B.S. (2006), “Does Marriage Make People Happy, or Do Happy People Get Married?”, Journal of Socio-Economics, Vol. 35 No. 2, pp. 326–347.
Di Tella, R., MacCulloch, R.J. and Oswald, A.J. (2001), “Preferences over Inflation and Unemployment: Evidence from Surveys of Happiness”, American Economic Review, Vol. 91 No. 1, pp. 335 – 341.
Tijdens, K., Zijl, S. van, Williams, M.H., Klaveren, M. and Steinmetz, S. (2010), Codebook and explanatory note on the WageIndicator dataset, Mimeo: AIAS.
Valcour, M. (2007), “Work-based resources as moderators of the relationship between work hours and satisfaction with work-family balance.”, Journal of Applied Psychology, Vol. 92 No. 6, p. 1512.
Yeager, D.S., Krosnick, J. a., Chang, L., Javitz, H.S., Levendusky, M.S., Simpser, A. and Wang, R. (2011), “Comparing the Accuracy of RDD Telephone Surveys and Internet Surveys Conducted with Probability and Non-Probability Samples”, Public Opinion Quarterly, Vol. 75 No. 4, pp. 709–747.

26
27
APPENDIX Table 1 Descriptive statistics
ESS WI with PSA WI
(1) (2) (3)
mean s.dev mean mean s.dev
Satisfaction with life 7.36 1.76 6.77 6.79 1.80
Female 0.48 0.50 0.40 0.44 0.50
Edu: Primary 0.51 0.50 0.43 0.21 0.40
Edu: Secondary 0.26 0.44 0.24 0.25 0.43
Edu: Tertiary 0.23 0.42 0.33 0.54 0.50
Single 0.31 0.46 0.38 0.53 0.50
Married 0.61 0.49 0.55 0.42 0.49
Divorced 0.07 0.25 0.06 0.04 0.20
Widowed 0.02 0.13 0.01 0.00 0.06
Age 18-24 0.10 0.30 0.11 0.08 0.27
Age 25-34 0.25 0.43 0.25 0.53 0.50
Age 35-44 0.28 0.45 0.28 0.27 0.45
Age 45-54 0.23 0.42 0.25 0.10 0.31
Age 55-64 0.15 0.35 0.11 0.02 0.13
Health: excellent 0.20 0.40 0.31 0.28 0.45
Health: good 0.51 0.50 0.29 0.33 0.47
Health: poor 0.24 0.43 0.23 0.24 0.42
Health: very poor 0.06 0.23 0.16 0.15 0.35
Foreign-born 0.07 0.25 0.06 0.07 0.26
Self-employed 0.15 0.36 0.00 0.01 0.07
Log income 7.45 0.58 7.32 7.37 0.58
Permanent contract 0.54 0.50 0.78 0.77 0.42
Working hours >40 0.39 0.49 0.16 0.13 0.34 Source: The European Social Survey (ESS) 2005-2011, Wage Indicator (WageIndicator) 2005-2011. Note: Samples are limited to employed individuals 18-65 years old. WageIndicator with PSA in Column 2 presents the WageIndicator sample after implementing propensity score adjustment weights. In the ESS, information on net monthly income at the household level is calculated using the mid-point of each income bracket. The WageIndicator data includes information about individual gross monthly income.
28
Table 2 Life satisfaction equations: a comparison of the ESS and WageIndicator surveys ESS WI with PSA WI
(1) (2) (3)
Female 0.076 0.049 0.042 *
(0.060) (0.054) (0.025)
Edu: Secondary -0.137 * -0.042 0.059 *
(0.073) (0.061) (0.035)
Edu: Tertiary -0.047 0.045 0.139 ***
(0.080) (0.056) (0.033)
Married 0.527 *** 0.473 *** 0.474 ***
(0.079) (0.056) (0.028)
Divorced -0.275 ** 0.182 0.11 *
(0.135) (0.118) (0.063)
Widowed -0.363 0.141 -0.07
(0.234) (0.345) (0.204)
Age 15-24 ref. ref. ref.
Age 25-34 -0.248 ** -0.228 *** -0.168 ***
(0.115) (0.080) (0.047)
Age 35-44 -0.455 *** -0.433 *** -0.457 ***
(0.125) (0.092) (0.053)
Age 45-54 -0.551 *** -0.462 *** -0.42 ***
(0.133) (0.110) (0.063)
Age 55-64 -0.359 ** -0.198 -0.196 *
(0.144) (0.162) (0.102)
Health excellent ref. ref. ref.
Health good -0.343 *** -0.498 *** -0.509 ***
(0.077) (0.056) (0.030)
Health poor -0.731 *** -1.124 *** -1.109 ***
(0.091) (0.065) (0.033)
Health very poor -1.311 *** -1.769 *** -1.785 ***
(0.143) (0.089) (0.038)
Foreign-born -0.029 0.08 0.062
(0.116) (0.083) (0.046)
Self-employed 0.207 ** -0.064 0.127
(0.095) (0.318) (0.170)
Log income 0.347 *** 0.275 *** 0.316 ***
(0.056) (0.056) (0.024)
Permanent contract 0.353 *** 0.045 0.048 *
(0.070) (0.057) (0.030)
Works >40hrs -0.031 -0.292 *** -0.263 ***
(0.061) (0.074) (0.035)
Constant 4.997 *** 5.261 *** 4.902 ***
(0.441) (0.397) (0.172)
r2 0.101 0.14 0.152
N 3445 20095 20095 Source: The European Social Survey (ESS) 2005-2011, Wage Indicator (WageIndicator) 2005-2011. Note: The dependent variable is life satisfaction. OLS estimates are presented with standard errors in parenthesis. * / ** / *** indicate significance at the 10% / 5% / 1% level. See also notes to Table 1. All models include regional and year fixed effects.
29
Table 3 Satisfaction equations: factors determining job quality
(1) (2) (3) (4) (5) (6)
Female 0.018 0.035 0.038 0.07 ** -0.167 *** -0.184 ***
0.055 0.053 0.037 0.033 0.036 0.034
Edu: Primary ref. ref. ref. ref. ref. ref.
Edu: Secondary -0.052 0.004 -0.014 0.072 * 0.025 0.005
0.062 0.062 0.042 0.039 0.04 0.04
Edu: Tertiary 0.005 0.083 0.024 0.13 *** 0.057 0.037
0.06 0.066 0.041 0.04 0.041 0.042
Single ref. ref. ref. ref. ref. ref.
Married 0.531 *** 0.536 *** 0 0 0.084 0.102 *
0.09 0.085 0.06 0.054 0.059 0.057
Living with partner 0.347 *** 0.387 *** -0.057 -0.01 -0.021 0.002
0.082 0.079 0.057 0.049 0.056 0.054
Divorced 0.358 *** 0.398 *** 0.062 0.093 0.019 0.055
0.135 0.131 0.086 0.078 0.084 0.08
Widowed 0.289 0.253 0.177 0.113 0.326 * 0.338 **
0.373 0.362 0.262 0.235 0.174 0.162
Age 15-24 ref. ref. ref. ref. ref. ref.
Age 25-34 -0.267 *** -0.219 *** -0.127 ** -0.015 -0.096 -0.082
0.082 0.079 0.06 0.048 0.059 0.054
Age 35-44 -0.449 *** -0.395 *** -0.12 * 0.021 -0.029 -0.04
0.096 0.093 0.068 0.057 0.067 0.064
Age 45-54 -0.44 *** -0.432 *** -0.007 0.114 * 0.222 *** 0.158 **
0.114 0.113 0.079 0.068 0.078 0.076
Age 55-64 -0.213 -0.189 -0.065 0.024 0.334 *** 0.258 **
0.165 0.157 0.117 0.109 0.103 0.105
Health excellent ref. ref. ref. ref. ref. ref.
Health good -0.498 *** -0.523 *** -0.091 ** -0.118 *** -0.402 *** -0.403 ***
0.056 0.054 0.041 0.037 0.039 0.037
Health poor -1.118 *** -1.073 *** -0.386 *** -0.343 *** -0.72 *** -0.66 ***
0.065 0.062 0.045 0.041 0.044 0.042
Health very poor -1.745 *** -1.641 *** -0.816 *** -0.713 *** -1.235 *** -1.147 ***
0.09 0.087 0.056 0.054 0.056 0.056
Foreign-born 0.147 * 0.191 ** 0.044 0.046 -0.032 0.054
0.085 0.083 0.068 0.063 0.057 0.057
Self-employed -0.133 -0.079 0.594 *** 0.338 * -0.122 -0.237
0.32 0.342 0.154 0.194 0.187 0.214
Occupation prestige 0.006 *** 0.003 0.008 *** 0.004 *** 0.001 0
0.002 0.002 0.001 0.001 0.001 0.001
Log personal income 0.248 *** 0.127 ** 0.264 *** 0.085 ** -0.035 -0.068 *
0.058 0.059 0.038 0.037 0.036 0.037
Main household earner -0.12 ** -0.123 ** 0.023 0.02 -0.087 ** -0.062 *
0.058 0.055 0.04 0.035 0.036 0.034
Lives with child aged 0-5y 0.071 0.047 0.025 0.02 -0.089 ** -0.113 ***
0.056 0.055 0.046 0.041 0.04 0.04
Lives with child aged 6-17y -0.107 -0.123 * 0.013 -0.019 -0.037 -0.05
0.069 0.065 0.045 0.04 0.046 0.044
House owner 0.319 *** 0.289 *** 0.079 * 0.056 0.18 *** 0.151 ***
0.065 0.061 0.043 0.038 0.04 0.039
Lives with parents -0.116 -0.072 0.008 0.032 -0.085 -0.04
0.079 0.076 0.052 0.046 0.054 0.053
Satisfaction with life Satisfaction with job Satisfaction with work and family
30
Table 3 continued (1) (2) (3) (4) (5) (6)
Permanent contract -0.041 -0.159 *** -0.054
0.055 0.035 0.038
Supervisory position 0.011 0.084 ** -0.087 **
0.053 0.034 0.035
Over-qualified for job -0.247 *** -0.263 *** -0.033
0.053 0.032 0.034
Member of trade union 0.114 ** -0.061 * -0.029
0.057 0.036 0.038
Working hours >40 -0.246 *** -0.095 ** -0.264 ***
0.07 0.044 0.045
Works in night -0.1 ** -0.053 -0.321 ***
0.051 0.034 0.034
Works on weekend -0.08 -0.077 ** -0.3 ***
0.06 0.038 0.042
Work: commutes 15-45min -0.091 * -0.007 -0.174 ***
0.05 0.032 0.034
Work: commutes >45 -0.156 * 0.012 -0.364 ***
0.08 0.052 0.054
Looking for another job -0.375 *** -0.723 *** -0.279 ***
0.056 0.034 0.035
Good career opportunities 0.626 *** 0.744 *** 0.288 ***
0.055 0.037 0.039
Job is insecure -0.475 *** -0.347 *** -0.102 *
0.088 0.053 0.057
Past unempl. experience -0.059 -0.069 -0.111 **
0.081 0.048 0.055
Constant 5.042 *** 6.326 *** 0.953 *** 2.63 *** 3.713 *** 4.648 ***
0.419 0.426 0.28 0.268 0.25 0.26
r2 0.149 0.197 0.102 0.261 0.148 0.215
N 20095 20095 20095 20095 20095 20095 Source: Wage Indicator 2005-2011. Note: OLS estimates are presented. * / ** / *** indicate significance at the 10% / 5% / 1% level. Samples are limited to employed individuals 15-65 years old. All models include regional and year fixed effects.
31
Table 4: Variable Definition in the WageIndicator sample Variable name Definition Mean
Life satisfactionSatisfaction with life as-a-whole is measured on an ordinal 10-point scale.
6.79
Job satisfactionMeasured on an ordinal 5-point scale from ‘highly dissatisfied’(1) to ‘highly satisfied’ (5). 3.06
Satisfaction with work-life balance
Measured on an ordinal 5-point scale from ‘highly dissatisfied’ (1) to ‘highly satisfied’ (5). 3.10
Female Female =1, male=0 0.44
Edu: primary (ISCED 0-2)=1, otherwise=0 0.21
Edu: secondary (ISCED 3-4)=1, otherwise=0 0.25
Edu: tertiary (ISCED 5-6)=1, otherwise=0 0.54
Single Never married and not living with a partner=1, otherwise=0 0.34
Married Married=1, otherwise=0 0.42
Living with partner Never married and living with a partner =1, otherwise=0 0.19
Divorced Divorced =1, otherwise=0 0.04
Widowed Widowed =1, otherwise=0 0.00
Age 15-24 Age of respondent 15-24=1, otherwise=0 0.08
Age 25-34 Age of respondent 25-34=1, otherwise=0 0.53
Age 35-44 Age of respondent 35-44=1, otherwise=0 0.27
Age 45-54 Age of respondent 45-54=1, otherwise=0 0.10
Age 55-64 Age of respondent 55-64=1, otherwise=0 0.02
HealthSatisfaction with health is measured on an ordinal 4-point scale from ‘highly dissatisfied’ (1) to ‘highly satisfied’ (4). 2.75
Foreign-born Respondent not born in Spain=1, otherwise=0 0.07
Self-employed Respondent is self-employed=1, otherwise=0 0.01
Occupation prestige Measured from 0 (lowest) to 100 (highest). The conversion into ISCOcategories is created by Ganzeboom and Treiman (2003) 45.81
Personal income Logarithm of gross monthly income in EUR 7.37
Child 0-5 years Child younger than 6 years in the household=1, otherwise=0 0.16
Child 6-17 years Child older than 5 years in the household=1, otherwise=0 0.17
House owner House is owned=1, otherwise=0 0.72
Main household earner Repondent contributes most to household income and not single=1,otherwise=0 0.42
Living with parents Respondent lives with parents=1, otherwise=0 0.24
Permanent contract Respondent has permanent employment contract=1, otherwise=0 0.77
Supervisor Respondent has supervisory position=1, otherwise=0 0.37
Over-qualified for job Respondent is overqualified for the job=1, otherwise=0 0.33
Member of trade union Member of a trade union=1, otherwise=0 0.25
Working hours >40The contractual hours for a worker are larger than 40 hours per week=1, otherwise=0. 0.13
Works in night Respondent works regularly in the evenings=1, otherwise=0 0.66
Work on weekend Respondent works regularly on Saturdays or Sundays=1, otherwise=00.21
Work commutes 0-15 min Commuting 0-15 minutes one way=1, otherwise=0 0.35
Work commutes 15-45 min Commuting 15-45m one way=1, otherwise=0 0.49
Work commutes >45 min Commuting more than 45m one way=1, otherwise=0 0.16
On-the-job search Has been looking for another job in past 4 weeks=1, otherwise=0 0.29
Good career opportunities Has good career opportunities=1, otherwise=0 0.25
Job is insecure Worker will lose job next year=1, otherwise=0 0.12
Past unempl. experience Searched for a first job longer than one year=1, otherwise=0 0.11