Embed Size (px)
Citation preview

DET NORSKE VERITAS
Report
Atmospheric Chemistry Modelling of
Components from Post-Combustion
Amine-Based CO2 Capture
Gassnova SF Frame Agreement No. 257430114
Contract No. 257430173
E-Room No. FM07-AQZ00-S-RA-0008, Rev 1
28 May 2012
DNV Ref. No.: PP011013
Rev 1 (Final), 28 May 2012

DET NORSKE VERITAS
Report for GASSNOVA SF
MANAGING RISK
Modelling air quality impacts from post-combustion amine-based CO2 capture
DNV Ref. No.: PP011013
Revision No.: 1
Date : 28 May 2012 Page i
CCM Mongstad Atmospheric Chemistry Modelling
DET NORSKE VERITAS LTD, UK
Palace House
SE19DE London, United Kingdom
Tel: +44 (0)20 7357 6080
Fax: +44 (0)20 7357 6048
http://www.dnv.com
For:
GASSNOVA SF
Dokkvegen 10
3920 PORSGRUNN
Norway
Account Ref.:
Date of First Issue: 28 May 2012 Project No.: PP011013
Report No.: PP011013 Organisation Unit: Power and CCS
Revision No.: 1 (Final) Subject Group: Environmental
Summary:
This report describes the derivation of a reaction scheme that involves chemical reactions of amines in the
atmosphere, photochemical reactions and physical equilibria processes involving condensed phase water
(moisture). The simplified scheme is derived from basic research reports and implemented as a modification to
the CALPUFF Modelling System dispersion tool.
Prepared by: Name and Position
Dr Tim Fowler Principal Consultant
Graham Vernon
Senior Consultant
Signature
Verified by: Name and Position
Stavros Yiannoukas Senior Consultant
Signature
Approved by: Name and Position
Frank Ketelaars
Associate Director
Signature
No distribution without permission from the client or responsible organisational unit (however, free distribution for internal use within
DNV after 3 years) Indexing Terms
No distribution without permission from the client or responsible organisational unit
Key Words
Strictly confidential Service Area
Unrestricted distribution Market Segment
Rev. No. / Date: Reason for Issue: Prepared by: Verified by: Accepted by:
0 / 5 April 2012 Draft Report TGF/ GV SY FK
1 / 28 May 2012 Final Report TGF/ GV SY FK
© 2012 Det Norske Veritas Ltd, UK
Reference to part of this report which may lead to misinterpretation is not permissible.

DET NORSKE VERITAS
Report for GASSNOVA SF
MANAGING RISK
Modelling air quality impacts from post-combustion amine-based CO2 capture
DNV Ref. No.: PP011013
Revision No.: 1
Date : 28 May 2012 Page ii
Table of Contents
EXECUTIVE SUMMARY .................................................................................................... IV
1 INTRODUCTION ............................................................................................................. 1
1.1 Background ................................................................................................................ 1
1.2 Overview of the CCM Project .................................................................................... 2
1.3 Scope and Objectives of Phase 2 Report .................................................................... 3
1.4 Report Layout ............................................................................................................. 4
2 AMINE CHEMISTRY ...................................................................................................... 5
2.1 Overview of Research Results ................................................................................... 5
2.1.1 Gas Phase Free Radical Reactions ....................................................................... 5
2.1.2 Gas Phase Photochemical Reactions ................................................................... 6
2.1.3 Chemical Reactions in the Aqueous Phase .......................................................... 7
2.1.4 Gas Liquid Equilibrium Processes ...................................................................... 7
2.2 Phase 2 Modelling Scheme ........................................................................................ 8
2.2.1 Introduction and Terminology ............................................................................. 8
2.2.2 Phase 2 Reaction Scheme .................................................................................... 9
2.2.3 Gas-Liquid Equilibria Processes........................................................................ 11
2.2.4 Gas Phase Chemical Processes .......................................................................... 12
2.2.5 Liquid Phase Chemical Processes ..................................................................... 13
2.3 Rate Constants and Other Parameters used in the Model ........................................ 14
3 IMPLEMENTATION OF AMINE ATMOSPHERIC CHEMISTRY ....................... 17
3.1 Overview of Approach to Model Development and Validation .............................. 17
3.2 Theoretical Background ........................................................................................... 18
3.3 Solving the Differential Equation System ................................................................ 20
3.4 Box Modelling in MathCad ...................................................................................... 20
3.4.1 MathCad Box Modelling Results ...................................................................... 22
3.5 Analytical Solution for a Sub-System. ..................................................................... 25
3.6 Box Modelling in FORTRAN .................................................................................. 26
3.6.1 Description ......................................................................................................... 26
3.6.2 Comparison of the FORTRAN and MathCad Box Models. ............................. 27
3.7 Implementation of the Chemistry Solver into CALPUFF ....................................... 28
4 RESULTS AND DISCUSSION ...................................................................................... 30
4.1 Description of Case Studies ..................................................................................... 31
4.2 Emissions Modelled ................................................................................................. 32
4.3 Results: Contour Plots of Annual Average Ground Level Concentration .............. 33
4.3.1 Results Summarised for the Entire Study Area ................................................. 33

DET NORSKE VERITAS
Report for GASSNOVA SF
MANAGING RISK
Modelling air quality impacts from post-combustion amine-based CO2 capture
DNV Ref. No.: PP011013
Revision No.: 1
Date : 28 May 2012 Page iii
4.3.2 Results Presented as Contour Plots.................................................................... 34
4.3.3 Results: Contour Plots for Case Study A ........................................................... 36
4.3.4 Results: Contour Plots for Case Study B ........................................................... 38
4.4 Results: As Function of Distance from Source ....................................................... 39
4.4.1 Results: By Distance for Case Study A ............................................................. 40
4.4.2 Results: By Distance for Case Study B ............................................................. 45
4.5 Discussion of General Appearance of Results ......................................................... 48
4.5.1 General Comments on the Concentration Profile Plots ..................................... 49
4.5.2 Concentration of Gas Phase Amine ................................................................... 49
4.5.3 Concentration of Gas Phase Nitrosamine and Nitramine .................................. 50
4.5.4 Concentration of Aqueous Phase Amine ........................................................... 51
4.5.5 Concentration of Astar (A*) .............................................................................. 51
4.6 Results for Case 00 ................................................................................................... 51
4.7 Air and Drinking Quality Criteria ............................................................................ 52
4.8 Comparison of Pollutant Concentrations to Air Quality Criteria ............................. 53
4.9 Discussion of Conservatism in the Case Studies ..................................................... 55
4.10 Application to Real Systems .................................................................................... 55
5 CONCLUSIONS .............................................................................................................. 56
6 REFERENCES, ACRONYMS AND ABBREVIATIONS ........................................... 58
6.1 References ................................................................................................................ 58
6.2 Acronyms and Abbreviations ................................................................................... 58
Appendix 1 Results of Additional Case Study (Case 0)
Appendix 2 Partial FORTRAN source code listing for Rosenbrock Differential Equation
system solver

DET NORSKE VERITAS
Report for GASSNOVA SF
MANAGING RISK
Modelling air quality impacts of post-combustion amine-based CO2 capture
DNV Ref. No.: PP011013
Revision No.: 1
Date : 28 May 2012 Page iv
EXECUTIVE SUMMARY
Overview
The CO2 Capture Mongstad Project (CCM Project) is organised jointly by Gassnova
SF and Statoil ASA with funding from the Norwegian government.
The purpose of CCM Project is to plan and build a large scale CO2 capture plant. The
facility will be situated next to the Mongstad refinery on the Mongstad industrial site,
north of Bergen on the west coast of Norway. The facility will capture CO2 from the
flue gas of a Combined Heat and Power plant (CHP), perhaps using amine-based
capture technology. The design basis is the capture of approximately 1.3 million
tonnes of CO2 per year. This will then be conditioned and compressed for pipeline
transport to geological storage under the Norwegian Continental Shelf.
An amine-based CO2 capture plant may cause harmful emissions to the atmosphere.
Amines and their degradation products, formed either in the process unit or after
release to the atmosphere, are of particular concern to CCM Project but there is
limited knowledge about the behaviour of such chemicals when released from large
scale industrial processes. CCM Project has therefore launched several studies to be
conducted during the capture plant development in order to improve our knowledge.
One of the studies is associated with the atmospheric dispersion (and the ultimate
fate) of components from post-combustion amine-based CO2 capture. The principal
pollutants of concern are: NOx (NO and NO2), NH3, amines, nitrosamines and
nitramines, amongst others. Nitrosamines and nitramines in particular are
acknowledged carcinogens. Very low environmental quality criteria have been
proposed for these pollutants and hence the formation, dispersion and destruction
processes of these pollutants are the main interest of this report.
This report has been prepared by Det Norske Veritas Limited (DNV). It describes
work done to develop and validate a computer model that can perform both complex
gas dispersion calculations and complex chemical transformation reactions
simultaneously. The amine chemistry model built includes photochemistry
(dependencies on time of day and season of the year), gas-liquid equilibria processes
and location dependent variables (NOx emitted from the process).
Results of model validation work are presented as well as the results from three case
studies.
Overview of the Phase 2 Chemical Scheme Implemented
The chemical scheme implemented in this report, which includes conventional free
radical gas phase reactions, photochemical (photolytic) reactions and phase equilibria

DET NORSKE VERITAS
Report for GASSNOVA SF
MANAGING RISK
Modelling air quality impacts of post-combustion amine-based CO2 capture
DNV Ref. No.: PP011013
Revision No.: 1
Date : 28 May 2012 Page v
processes (absorption and desorption of soluble species in liquid phase water
(moisture)) is shown in the figure below.
In the figure above A, NS, NA and NTP represent amine, nitrosamine, nitramine and
non-toxic products (mainly imine initially) respectively. A* is a reactive intermediate
and species with an “a” are in the condensed liquid phase. Some of the steps shown
are included to only provide future model flexibility and so their rate constants are set
to zero in the case studies described in this report. The concentration of the counter
species (OH., NO3
., NO, NO2 and O2) may depend on the time of day, the season of
the year or the location depending on the species as described in the report.
Conclusions
The key conclusions from the study are as follows:
DNV believe that the amine chemistry scheme implemented into the modified
CALPUFF model is both correct and is demonstrated to be correct (validated).
The modified CALPUFF model is flexible and capable of representing a
variety of different amine chemistry schemes, provided rate constants and
similar data are available from the academic reports.
The modified CALPUFF model is suitable to help support the evaluation of
different amine-based technology options under consideration by the CCM
Project.
A A*
NA
NTP
NSA a
NA a
NS a
Mass transfer between gas and aqueous phase
Chemical reaction
All species are in the gas phase unless stated as aqueous (a)
k1 OH.
k10 NO3.
k11 OH.
k12 NO3.
kA1
kA2 k2 NO
k3 NO2
k4 NO2k5 O2
kA3
kA4
kA5
kA6k14
k13
k6 hv

DET NORSKE VERITAS
Report for GASSNOVA SF
MANAGING RISK
Modelling air quality impacts of post-combustion amine-based CO2 capture
DNV Ref. No.: PP011013
Revision No.: 1
Date : 28 May 2012 Page vi
The results from the example case studies conclude that dispersion processes,
not chemical reaction processes, dominate the decrease of concentration of
amine emitted into the environment (when emitted at about 1 part per million).
Two of the case study results (A and 00) are about a factor of 5 lower than the
air quality criterion used (that is, they are compliant). However Case B (the
worst case) exceeded the air quality criterion by 60% (ratio of predicted
concentration to criterion of 1.6). The case studies continue to include
conservatism in a number of parameters and modelling assumptions as
discussed in the main report.
Finally, if required the modified CALPUFF model can be adapted to implement
different chemical schemes with significantly less effort than that used to develop this
report.
Recommendations
The key recommendations from the study are as follows:
The model validation process should be discussed with the regulator to ensure
that results from the model will be acceptable in an assessment of
environmental impacts.
The model should be used to evaluate the impacts to the environment for real
process emission parameters. That is, the emission parameters for the three
case studies should be refined to represent, as far as possible, real process
operating conditions.
The model results could be compared with ambient measurements of pollutant
concentrations (environmental monitoring results) if available.

DET NORSKE VERITAS
Report for GASSNOVA SF
MANAGING RISK
Modelling air quality impacts of post-combustion amine-based CO2 capture
DNV Ref. No.: PP011013
Revision No.: 1
Date : 28 May 2012 Page 1
1 INTRODUCTION
1.1 Background
The CO2 Capture Mongstad Project (CCM Project) is organised jointly by Gassnova
SF and Statoil ASA with funding from the Norwegian government. This report is
prepared by Det Norske Veritas Limited (DNV). Hereafter the joint clients
(Gassnova SF and Statoil ASA) will be referenced as “CCM Project”, whereas the
technology development process at Mongstad will be referred to as “the CCM
project”.
The purpose of CCM Project is to plan and build a large scale CO2 capture plant. The
facility will be situated next to the Mongstad refinery on the Mongstad industrial site,
north of Bergen on the west coast of Norway. The facility will capture CO2 from the
flue gas of a Combined Heat and Power plant (CHP), perhaps using amine-based
capture technology. The design basis is the capture of approximately 1.3 million
tonnes of CO2 per year. This will then be conditioned and compressed for pipeline
transport to geological storage under the Norwegian Continental Shelf.
An amine-based CO2 capture plant may cause harmful emissions to the atmosphere.
Amines and their degradation products, formed either in the process unit or after
release to the atmosphere, are of particular concern to CCM Project but there is
limited knowledge about the behaviour of such chemicals when released from large
scale industrial processes. CCM Project has therefore launched several studies to be
conducted during the capture plant development in order to improve our knowledge.
One of the studies is associated with the atmospheric dispersion (and the ultimate
fate) of components from post-combustion amine-based CO2 capture. The principal
pollutants of concern are: NOx (NO and NO2), NH3, amines, nitrosamines and
nitramines, amongst others. Nitrosamines and nitramines in particular are
acknowledged carcinogens. Very low environmental quality criteria have been
proposed for these pollutants and hence the formation, dispersion and destruction
processes of these pollutants are the main interest of this report.
The key environmental factors that determine the selection of the CO2 capture process
are:
How much amine, nitrosamine and nitramine is released from the CO2 capture
process.
How quickly does amine convert to nitrosamine and/ or nitramine in the
environment.
How quickly does nitrosamine and/ or nitramine decay in the environment.
How quickly does the released gas flow, including any released or
subsequently formed nitrosamine and/ or nitramine, disperse in the
environment.

DET NORSKE VERITAS
Report for GASSNOVA SF
MANAGING RISK
Modelling air quality impacts of post-combustion amine-based CO2 capture
DNV Ref. No.: PP011013
Revision No.: 1
Date : 28 May 2012 Page 2
The magnitude of the environmental impact due to nitrosamine and/ or nitramine will
be determined by the magnitude of the environmental quality criteria set by the
regulator and the inter-play between the key factors above.
The overall objective of the work described in this report is to develop and
demonstrate a model that is capable of assessing the environmental impacts of amines
and their degradation products. This model can then be used to help evaluate the
preferred CO2 capture process to be installed at Mongstad.
1.2 Overview of the CCM Project
The CCM project is required to address many aspects including technology selection,
detailed engineering, performance specification (including demonstrating acceptable
environmental impacts) and research of basic physical and chemical processes where
improvements in understanding are required.
In order to improve basic knowledge of amine chemistry in the process and in the
atmosphere the CCM Project has commissioned many studies involving researchers
and consultants. Some of these reports are referenced by this report.
DNV has produced 2 main reports for CCM Project prior to this one. These are
briefly described here.
During 2010 DNV was engaged by CCM Project to evaluate if relatively simple air
quality models could be used to satisfy the requirements of the CCM project (Call-Off
01). In this study, DNV reviewed the academic reports then available that described
amine chemistry (which we now define to include the chemistry of amine degradation
products) and DNV used an unmodified conventional Gaussian plume air dispersion
model (ADMS v4) to estimate environmental impacts of nitrosamine and nitramine
using various approaches and limiting assumptions /1/.
After Call-Off 01 it became clear that simple models that do not allow the definition of
amine chemical transformation processes would not provide sufficient flexibility to
predict the environmental impacts of amines and their degradation products with the
degree of confidence required.
In April 2011 DNV began their work under Call-Off 02 (this present contract).
DNV’s objective for Phase 1 of Call-Off 02 was to include simple gas-phase
chemistry in an open-source dispersion model called CALPUFF Modelling System
Version 6.4 (CALPUFF). CALPUFF has a number of advantages over ADMS. In
particular:
The “time” parameter is an important factor in the simulation of amine
chemical reactions. ADMS is a steady-state plume model, where the
parameter “time” is not explicitly considered. CALPUFF is a time-varying

DET NORSKE VERITAS
Report for GASSNOVA SF
MANAGING RISK
Modelling air quality impacts of post-combustion amine-based CO2 capture
DNV Ref. No.: PP011013
Revision No.: 1
Date : 28 May 2012 Page 3
model, where the pollutant can be followed step by step from the source to the
receptor. This capability provides a good base for a more accurate
implementation of an amine chemistry model using CALPUFF.
CALPUFF also allows for more accurate simulation of pollutant transport in
complex terrain areas. Within this context, the use of 3D LAM data as
meteorological input would maximise this capability.
Last but not least, CALPUFF is an open-source model written in FORTRAN. It can,
therefore, be modified to represent amine chemical processes. The CALPUFF model
as modified by DNV may be referenced as “the DNV model” or “the modified
CALPUFF model” below.
Within Phase 1, DNV demonstrated that CALPUFF was capable of meeting CCM
Project’s objectives by the implementation of a simple gas-phase amine chemistry
scheme /2/.
Another DNV report that assessed wet and dry deposition effects was produced under
Call-Off 02 during 2011 /3/. The objective of this report was to demonstrate a
methodology to assess the impacts of amines, nitrosamines and nitramines to surface
water and subsequent receptors.
This DNV report is the Phase 2 final report of Call-Off 02. It extends the complexity
of the physical and chemical transformation processes implemented in the modified
CALPUFF model. References to previous reports are used wherever practicable in
order to keep this report as concise as possible.
1.3 Scope and Objectives of Phase 2 Report
The key objective of this report is to achieve higher precision predictions of the
ambient air concentrations of amines and their degradation products (specifically
nitrosamines and nitramines) emitted from the amine-based CO2 capture process. It
does this by the inclusion of more representative and more complex physical and
chemical processes in the modified CALPUFF model, compared to Phase 1.
The primary goal of this report is to improve the flexibility of the modified CALPUFF
model to represent different physical and chemical processes, and to demonstrate that
the modified model gives reasonable results for different input parameters. If this can
be achieved, then it is possible that the modified model may be used to support a
technology selection process under a Call-Off 03 contract later in 2012.
The additional processes to be implemented during Phase 2 were initially specified as:
Inclusion of equilibria processes that could transfer chemical species to a
condensed aqueous phase (hereafter referred to as “moisture”).
Inclusion of transformation processes within atmospheric moisture.

DET NORSKE VERITAS
Report for GASSNOVA SF
MANAGING RISK
Modelling air quality impacts of post-combustion amine-based CO2 capture
DNV Ref. No.: PP011013
Revision No.: 1
Date : 28 May 2012 Page 4
Inclusion of amine activation reactions involving reactive species in addition to
OH. , such as Cl
. , NO3
. , etc.
Inclusion of photochemical reactions which will be slower in winter and may
be absent at night.
Consistent with the above, the following items are not within the scope of work of
Phase 2:
Consideration of non-steady state or abnormal operating conditions at the
Mongstad site.
Consideration of wet and dry deposition effects. These were considered in
another report /3/.
Consideration of what environmental receptors might be impacted, or the
appropriate environmental quality criteria that should be applied.
Identification or evaluation of physical or chemical data to be applied. These
are provided to DNV by the CCM Project as input data.
Consideration of emissions from emission sources other than the CHP absorber
source.
1.4 Report Layout
The remainder of this report is structured as follows:
Section 2 provides an overview of the research work into the physical and
chemical processes that were considered for implementation, or were actually
implemented, in this work. It also summarises the chemical and physical
processes and the corresponding input parameters that were used in the
modified CALPUFF model.
Section 3 summarises how the changes were implemented in CALPUFF and
why DNV believe that the implementation is correct and fit for its intended
purpose.
Section 4 presents the main results calculated by the modified CALPUFF
model.
Section 5 presents the conclusions and recommendations from the study.
Section 6 lists the references cited and the acronyms and abbreviations used.
The main report is supported by Appendix 1, which shows results of additional
chemistry validation work that was performed and Appendix 2 which provides a
listing of the new computer code included in the modified CALPUFF model.

DET NORSKE VERITAS
Report for GASSNOVA SF
MANAGING RISK
Modelling air quality impacts of post-combustion amine-based CO2 capture
DNV Ref. No.: PP011013
Revision No.: 1
Date : 28 May 2012 Page 5
2 AMINE CHEMISTRY
2.1 Overview of Research Results
CCM Project has contracted, via Tel-Tek (Norway), a number of research
organisations to improve the basic understanding of amines and amine chemistry as
relevant to the proposed process at Mongstad. These organisations include:
University of Oslo, Norway.
Leibniz-Institut für Tropospharenforschung, Germany.
Universität Innsbruck, Austria.
IRCELYON, France.
Universidad de Castilla-La Mancha, Spain.
Georgia Tech, USA.
Norwegian University of Life Sciences, Norway.
Section 2.1 briefly summarises the work areas investigated and the key results
obtained. Section 2.2 and 2.3 describe how this information has been included in the
modified CALPUFF model.
2.1.1 Gas Phase Free Radical Reactions
Previous DNV reports /1, 2, 3/ have described how the amine degradation reactions
are initiated in the gas phase by the abstraction of a hydrogen atom (H) by a reactive
free radical (X.) (conventionally, free radicals are denoted by a “
.”):
Amine + X. Amine radical
. + X-H
Where X. could be any one of several reactive free radicals that naturally exist in the
lower atmosphere. The most important initiating free radical was thought to be OH.
and this was confirmed by the latest research work.
Other candidate species for X. include: Cl
., Br
., NO3
., and other non-free radical
species such as NO, NO2 and HONO. The importance of all these species was
considered by the researchers with the following conclusions:
For Cl. and Br
., which both may have significant concentrations near the sea, it
was concluded that the rate constants were larger than for OH., but the natural
concentrations of Cl. and Br
. are so low that the overall rate of the pathway is
not significant. Thus reactions involving Cl. and Br
. are not modelled in the
chemistry scheme implemented and described in this report. (DNV expect that
any Cl. and Br
. present in the atmosphere will react preferentially with the vast
excess of water to form OH..)

DET NORSKE VERITAS
Report for GASSNOVA SF
MANAGING RISK
Modelling air quality impacts of post-combustion amine-based CO2 capture
DNV Ref. No.: PP011013
Revision No.: 1
Date : 28 May 2012 Page 6
The importance of NO3. in amine chemistry depends on the time of day.
During the day, the combination of its rate constant and its concentration
means that OH. is the dominant reaction species with amine and so the
presence of NO3. can be neglected. However OH
. is formed by the photolysis
of ozone and NO3. is destroyed by photolysis, so during the night the
concentration of OH. reduces and the concentration of NO3
. increases such that
NO3. then becomes the more significant species reacting with amine. The
researchers concluded that NO3. could be modelled by adding a correction
factor to the concentration of OH. but DNV has explicitly included reactions
with NO3. in the chemistry scheme implemented and described in this report.
For NO, NO2 and HONO the researchers concluded that these species did not
have a significant influence on the initiation of the amine gas phase chemistry
reactions. Thus these species are not modelled in the chemistry scheme
implemented and described in this report.
Thus OH. and NO3
. are the only species that react with amine and the subsequently
formed activated amine then reacts with NO, NO2 or O2 to complete the gas phase
chemistry modelled.
2.1.2 Gas Phase Photochemical Reactions
As discussed in Section 2.1.1 above, many atmospheric chemistry reactions are
initiated by, or influenced by, sun light. Thus the chemistry at night or the chemistry
during the day and in the winter at northern latitudes is likely to be significantly
different compared to the chemistry near mid-day on a bright summer day. A range of
different possible photochemical reactions and pathways in both the gas phase and the
aqueous phase were considered by the researchers but the only three that were
considered sufficiently important for implementation in the chemistry scheme were as
follows:
The influence of sun light on the concentration of OH. should be considered.
This concentration will be significantly reduced at night and during the day in
the winter near the poles, see Section 2.3.
Nitrosamine can absorb sun light and in so doing dissociates to nitric oxide
and the amine radical, as follows for dimethyl nitrosamine.
(CH3)2NNO + h (CH3)2N. + NO
This reaction has the effect of reducing the concentration of nitrosamine
observed and increasing the concentration of nitramine observed. It is
included in the chemistry scheme implemented and described in this report.
The influence of sun light on the concentration of NO3. should be considered.
This concentration is reduced during the day by photolysis of NO3. and hence

DET NORSKE VERITAS
Report for GASSNOVA SF
MANAGING RISK
Modelling air quality impacts of post-combustion amine-based CO2 capture
DNV Ref. No.: PP011013
Revision No.: 1
Date : 28 May 2012 Page 7
increases at night or in winter months due to reduced or absent photolysis, see
Section 2.3.
2.1.3 Chemical Reactions in the Aqueous Phase
The researchers considered a range of possible chemical reactions that could occur in
the aqueous phase, but it was concluded that no reactions that might influence the rate
of formation of nitrosamine or nitramine could be identified. DNV note that in
general aqueous chemistry is predominantly ionic chemistry whereas gas phase
chemistry is predominantly radical chemistry. This generalisation appears to be valid
for amines where researchers found that the dominant reactions in the aqueous phase
are acid-base proton transfer reactions, such as:
CH3NH2 + H+ CH3NH3
+
Thus no aqueous chemistry reactions are modelled in the chemistry scheme
implemented and described in this report.
2.1.4 Gas Liquid Equilibrium Processes
The researchers were also asked to comment on the position of equilibrium (Henry’s
Law constant) and the speed at which equilibrium is achieved for processes such as:
CH3NH2 (gas) CH3NH2 (aqueous)
Only limited information resulted from the research reports in this area. DNV do not
consider this to be a problem in this work because:
In the absence of any significant chemistry in the aqueous phase, gas-aqueous
equilibria processes cannot increase the maximum concentration of
nitrosamine or nitramine formed, they can only reduce the maximum
concentration observed.
Even if Henry’s Law constants were identified, it would be necessary to
estimate the amount of moisture (liquid phase water) present in order to use
this information. The approach proposed by DNV in Section 2.2.3 below
based on an uncertainty analysis avoids this challenge.

DET NORSKE VERITAS
Report for GASSNOVA SF
MANAGING RISK
Modelling air quality impacts of post-combustion amine-based CO2 capture
DNV Ref. No.: PP011013
Revision No.: 1
Date : 28 May 2012 Page 8
2.2 Phase 2 Modelling Scheme
2.2.1 Introduction and Terminology
This section provides an overview to the relevant amine chemistry and defines some
terminology that will be used throughout this report.
Figure 2.1 summarises the key gas phase amine chemistry processes relevant to the
Phase 2 chemistry scheme. It also defines some short-hand nomenclature that will be
used in this report.
Figure 2.1 Key Gas Phase Amine Chemistry Processes and Useful Nomenclature
Figure 2.1 shows that gas phase amines (Ag, where subscript “g” is used to denote a
species in the gas phase and subscript “a” is used to denote a species in the condensed
liquid aqueous phase (moisture)) can be attacked in two main locations:
CH3NH2
X = OH., NO3., Cl., Br.
.CH2NH2 CH3N.H
XXA(1)
A*(1)
CH3NHNO2
NA(1)
CH3NHNO
NS(1)
NO2NO
NTP
A = Generic Amine
A(1) = MMA
A(2) = DMA
A(3) = MEA
A* = Amine activated by abstraction of H from amine group
NA = Nitramine
NS = Nitrosamine
NTP = Non Toxic product (not amine, not nitrosamine, not nitramine)
All species and reactions are only in the gas phase (subscript “g” omitted)

DET NORSKE VERITAS
Report for GASSNOVA SF
MANAGING RISK
Modelling air quality impacts of post-combustion amine-based CO2 capture
DNV Ref. No.: PP011013
Revision No.: 1
Date : 28 May 2012 Page 9
At the amine group. This can, but does not always, lead to nitrosamine (NS) or
nitramine (NA) formation.
Not at the amine group. This always leads to the formation of Non-Toxic
product (NTP) which is defined as not NS and not NA. The first product
formed may be an imine.
The amine radical, A*, can then react with NO or NO2 to form NS or NA respectively.
This report will consider 3 specific amines (mono-methyl amine (MMA or A(1)), di-
methyl amine (DMA or A(2)) and monoethanolamine (MEA or A(3)) and generic
amine (A). Any other amine may readily be assessed by the model provided that its
chemistry can be sufficiently represented by the reactions shown in Figure 2.2 and
provided the corresponding rate constants are known.
2.2.2 Phase 2 Reaction Scheme
The Phase 2 reaction scheme is show in Figure 2.2.
Note, Figure 2.2 contains a number of reactions which are included to provide future
model flexibility. Thus a number of the rate constants may be set equal to 0.0 in order
to “turn off” the pathway, see Table 2.1.
In Figure 2.2 only longer lived and relevant species (that is, A, NA, NS) are allowed to
equilibrate with moisture (if present). This is because reactive species are assumed to
be short-lived and thus will react in the phase in which they are formed rather than
equilibrate into a different phase. NTP is not allowed to equilibrate because it is the
end-point of the scheme and once formed it is no longer of interest.

DET NORSKE VERITAS
Report for GASSNOVA SF
MANAGING RISK
Modelling air quality impacts of post-combustion amine-based CO2 capture
DNV Ref. No.: PP011013
Revision No.:10
Date : 28 May 2012 Page 10
Figure 2.2 Phase 2 Gas Phase Chemistry and Phase Equilibria Scheme
A A*
NA
NTP
NSA a
NA a
NS a
Mass transfer between gas and aqueous phase
Chemical reaction
All species are in the gas phase unless stated as aqueous (a)
k1 OH.
k10 NO3.
k11 OH.
k12 NO3.
kA1
kA2 k2 NO
k3 NO2
k4 NO2k5 O2
kA3
kA4
kA5
kA6k14
k13
k6 hv
DET NORSKE VERITAS
Report for GASSNOVA SF
MANAGING RISK
Modelling air quality impacts of post-combustion amine-based CO2 capture
DNV Ref. No.: PP011013
Revision No.: 1
Date : 28 May 2012 Page 11
2.2.3 Gas-Liquid Equilibria Processes
In Norway the atmosphere always contains some water (H2O species) (the relative
humidity is never zero). This water exists in 4 forms:
Vapour (gas) phase water. Individual H2O molecules behaving as a gas, each
molecule separated from its neighbours.
Micro-aqueous phase water or aerosol water. This is condensed phase (liquid)
water formed on natural (e.g. pollen) and process (e.g. soot) particulates. This
is invisible (not sufficiently large to scatter visible light) but each micro drop
may consist of thousands or millions (or more) of water molecules. These will
be continually evaporating and re-condensing. Micro-aqueous water behaves
as a gas.
Visible plume water. This is similar to micro-aqueous water, but the particle
sizes are sufficiently large to scatter visible light. It behaves as a gas.
Fog and precipitation (rain, snow, etc.). These conditions will tend to collect
(scavenge) micro-aqueous and visible plume water and transfer it to the ground
and other surfaces via wet-deposition processes. This process is modelled by
the wet deposition option in CALPUFF (not within the scope of Phase 2). This
form of water is sufficiently heavy to fall under gravity (no longer behaves like
a gas).
The water described under bullets 2, 3 and 4 is aqueous phase water, which is also
called moisture in this report. At least some moisture must be present for aqueous
phase chemistry and gas-aqueous phase equilibration to occur. Unfortunately we do
not have an estimate of the distribution of water between these different forms for
different weather conditions, but the volume of moisture available is a parameter that
is required to apply Henry’s Law (because Henry’s law expresses an equilibrium
between a partial pressure of a gas and the concentration (moles per litre) in the liquid
phase).
In order to avoid the need to estimate the quantity of moisture in different atmospheric
conditions, DNV has developed a set of equations that represent the important
processes for our model. For the gas-liquid equilibrium:
Ag Aa
The position of equilibrium is represented by the Henry’s Law constant.
H (atmosphere moles-1
L) = (Partial pressure of A in the gas phase)
(Concentration of A in moisture)

DET NORSKE VERITAS
Report for GASSNOVA SF
MANAGING RISK
Modelling air quality impacts of post-combustion amine-based CO2 capture
DNV Ref. No.: PP011013
Revision No.: 1
Date : 28 May 2012 Page 12
The Henry’s Law constant represents a position of dynamic equilibrium between
absorption and desorption processes that can be represented by 2 first order rate
processes as follows:
Gas phase amine to aqueous phase (absorption) -d[Ag]/dt = kA1 [Ag]
Aqueous phase amine to gas phase (desorption) -d[Aa]/dt = kA2 [Aa]
At equilibrium, these rates will be equal and there will be defined fraction of amine in
the aqueous phase (moisture). We now define the equilibrium ratio Re which varies
between 0.0 and 1.0 and is related to the Henry’s Law constant H, as:
Re = Moles of amine in the aqueous phase/ (total moles amine available)
= [Aa] /( [Ag] + [Aa] )
Equilibrium will be achieved with a characteristic half-life (τ) as with any first order
rate process. If the following two expressions are used for kA1 and kA2
kA1 (s-1
) = Re ln(2)/ τ
kA2 (s-1
) = (1-Re) ln(2)/ τ
Then the concentration in the aqueous phase (of A, NS or NA) will move towards the
value of Re set at a rate that corresponds to the value of τ that has been set. Note the
absolute units of species in the aqueous phase are arbitrary, but have a one-to-one
correspondence with the units used by the model in the gas phase (that is, if 3ng/m3 is
transferred from the gas phase to the aqueous phase then the aqueous phase
concentration increases by 3ng/m3).
The value of Re is set to a larger value (0.1 assumed) if both sufficient aqueous phase
water (moisture) is assumed to be available and the gas/ vapour is very soluble in
water. Conversely Re is set to lower values (0.0001 assumed) if either aqueous phase
water is assumed to be unavailable or if the gas/ vapour is mostly insoluble in water.
The value of τ is set smaller (120s assumed) if equilibrium should be quickly
achieved and it is set larger (1800s assumed) if equilibrium should be achieved more
slowly.
2.2.4 Gas Phase Chemical Processes
Figure 2.2 defines a number of conventional second order, pseudo first order and first
order chemical transformation reactions. These processes and their associated
parameters are defined in detail in Section 2.3 below.

DET NORSKE VERITAS
Report for GASSNOVA SF
MANAGING RISK
Modelling air quality impacts of post-combustion amine-based CO2 capture
DNV Ref. No.: PP011013
Revision No.: 1
Date : 28 May 2012 Page 13
In the model developed by DNV all second order rate processes are implemented as
pseudo first order rate processes. That is, when the amine species (A, A*, NS, NA)
reacts with another species the concentration of the other species is assumed to be
unchanged by the reaction. In the scheme in Figure 2.2, there are 5 other species as
follows: OH., NO3
., NO, NO2 and O2. Collectively these are referred to as “counter
species”. The behaviour of each is discussed here.
The OH. radical is formed in the atmosphere mainly by photolysis of ozone. Its
concentration in the model varies with the time of day and with the time of year as
described in Section 2.3 below. The depletion of OH. by reactions such as k1 is not
represented in the model because OH. will diffuse into the emitted plume from the
bulk atmosphere where the quantity of OH. present is very large compared to the
quantity of amine emitted in the plume. This assumption is conservative with respect
to the formation of NS and NA (if the assumption was not made the predicted
concentration of NS and NA would be reduced).
The NO3. radical is destroyed in the atmosphere by photolysis. Thus its concentration
is highest at night and when the light flux is low (e.g. in winter and on cloudy days).
The concentration of NO3. in the model varies with the time of day and with the time
of year as described in Section 2.3 below. Its depletion is not represented in the
model and this assumption is conservative for the same reasons as given for OH..
Both NO and NO2 are emitted in the absorber plume at relatively high concentration
but also exist in the ambient atmosphere at a lower concentration. In addition, /4/
quotes a weak variation of concentration with time of year which is not represented in
the DNV model. The concentration of NO and NO2 is assumed to be equal to the sum
of the emitted concentration calculated by CALPUFF plus the background
concentration. The depletion of NO or NO2 is not represented in the model and this
assumption is conservative for the same reasons as given for OH..
Oxygen (O2) is the second most abundant component of the atmosphere at 20.95% in
dry air. In comparison with the amines emitted O2 is in vast excess and thus the
pseudo first order approximation needs no additional justification.
2.2.5 Liquid Phase Chemical Processes
The work performed by the research groups for CCM Project concluded that the rate
constants for chemical transformation reactions that form nitrosamine or nitramine
from amines in the aqueous phase are negligible. Hence DNV and CCM Project
agreed that no reactions in the aqueous would be implemented in Phase 2.

DET NORSKE VERITAS
Report for GASSNOVA SF
MANAGING RISK
Modelling air quality impacts of post-combustion amine-based CO2 capture
DNV Ref. No.: PP011013
Revision No.: 1
Date : 28 May 2012 Page 14
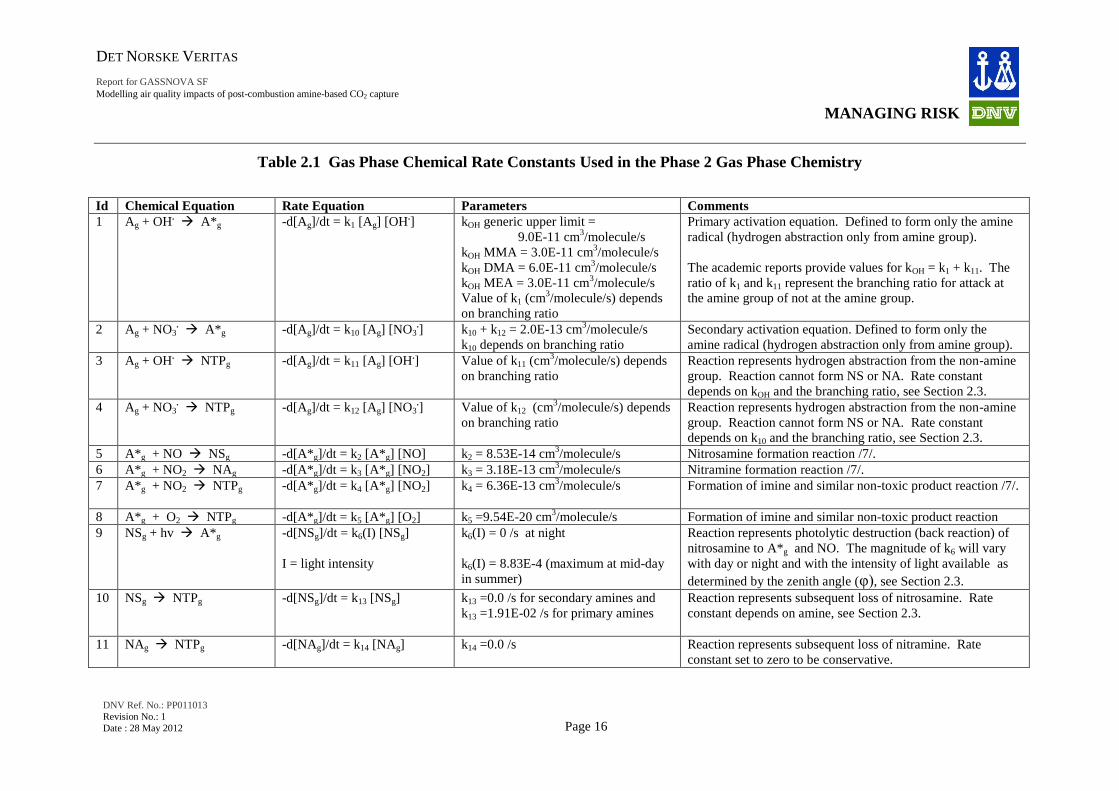
2.3 Rate Constants and Other Parameters used in the Model
Tables 2.1 summarises the rate constants used by the Phase 2 chemistry scheme.
Some of these constants vary with time of the day, time of the year and/ or location as
described here.
The values of k1 and k11 are not independent. The value given for kOH in Table 2.1 is
the maximum value provided in the academic reports. It represents the sum of rates
for H abstraction from the amine group and from the non-amine group. The
following relationships are used to calculate k1 and k11 from kOH:
kOH = k1 + k11
OH. branching ratio = k1/( k1 + k11) = k1/kOH
The branching ratio represents the balance between initial attack at the amine group
compared to attack not at the amine group. A low branching ratio reduces the amount
of NS and NA that can be formed.
The values of k10 and k12 behave in an exactly analogous manner to k1 and k11. In the
absence of firm data the NO3. branching ratio is assumed to be equal to the OH
.
branching ratio.
The only directly represented photochemical reaction in the implemented model is the
photo dissociation of the nitrosamine (k6). In /4/ the rate constant for this process is
deduced to be 3.90e-4, 8.83e-4, 4.22e-4 and 9.02e-6s-1
for March, June, September
and December respectively (from jNO2 and jrel = 0.32). DNV understand these values
take account of cloud cover in the Mongstad area as well as the angle of the sun.
The CALPUFF model calculates the zenith angle (φ) (how many degrees from
directly overhead) made by the sun at the modelled location as a function of time of
day and the time of the year. Night time occurs when this angle is greater than 90o.
The maximum zenith angle observed at Mongstad (at noon in high summer) is its
latitude north (63.97o) minus the latitude north of the Tropic of Cancer (23.43
o). The
zenith angle has been used as a convenient way of determining the time of day and the
season of the year. Using the maximum summer value of k6 taken from /4/, k6 is
calculated in the modified CALPUFF model by the relationship:
k6 = maximum(8.83E-04×cos(φ) / cos(63.97-23.43), 0) s-1
Thus k6 varies between 8.83E-04s-1
at noon in high summer and 0 s-1
at night.

DET NORSKE VERITAS
Report for GASSNOVA SF
MANAGING RISK
Modelling air quality impacts of post-combustion amine-based CO2 capture
DNV Ref. No.: PP011013
Revision No.: 1
Date : 28 May 2012 Page 15
The value of k13 represents various possible transformation processes of NS to NTP.
This could be by oxidation (thought to be relatively slow and not represented in the
modified model) or, for primary amines, by intra-molecular re-arrangement to imine.
This latter process is known to be fast. DNV estimated the maximum rate of
formation of NS along the k2 pathway and assigned a value to k13 that gave a rate of
loss 20 times faster than this maximum rate of formation.
The remaining parameters that influence the amine chemistry are the concentrations
of counter species. The concentration of OH. is controlled by photochemical
processes, thus its concentration has been linked to the zenith angle in a similar way
to k6. It was reported /4/ that OH. concentration is 3.90E5, 2.57E6, 8.88E5 and
6.77E5 molecules per cubic centimetre in March, June, September and December at
Mongstad. DNV calculate the concentration of OH. by the equation:
OH. = maximum ( 2.57E6×cos()/cos(63.97-23.43), 1.0E4) molecules∙cm
-3
Thus OH. varies between 8.83E-04 molecules cm
-3 at noon at high summer and 1.0E4
molecules∙cm-3
at night (this night time value is a DNV assumption). (The
concentration of OH. is also calculated by CALPUFF using a different set of
equations. The advantage of the equation above is that it allows the concentration to
be determined by the analyst.)
The concentration of NO3. is higher at night than during the day. The average night
time concentration is given as 3.20E7 molecules cm-3
/5, 6/. DNV has assumed that
its daytime concentration is a factor of 10 lower than the night time concentration.
The concentration is calculated from:
If cos(φ) < 0.0 then [NO3.] = 3.20E7 molecules∙cm
-3
else [NO3.] = 3.20E6 molecules∙cm
-3
Both NO and NO2 are emitted in the CHP emission source along with the amine. The
CALPUFF model calculates these concentrations as a function of location.
Background values of NO and NO2 at Mongstad are given as about the same and
equal to 1.25E11 molecules cm-3
(about 5ppb as measured /6/). The concentration of
NO and NO2 are calculated in the modified CALPUFF model as:
[NO] = (concentration NO calculated from the source by CALPUFF) + 1.25E11
molecules∙cm-3
[NO2] = (concentration NO2 calculated from the source by CALPUFF) + 1.25E11
molecules∙cm-3
DET NORSKE VERITAS
Report for GASSNOVA SF
MANAGING RISK
Modelling air quality impacts of post-combustion amine-based CO2 capture
DNV Ref. No.: PP011013
Revision No.: 1
Date : 28 May 2012 Page 16
Table 2.1 Gas Phase Chemical Rate Constants Used in the Phase 2 Gas Phase Chemistry
Id Chemical Equation Rate Equation Parameters Comments
1 Ag + OH. A*g -d[Ag]/dt = k1 [Ag] [OH
.] kOH generic upper limit =
9.0E-11 cm3/molecule/s
kOH MMA = 3.0E-11 cm3/molecule/s
kOH DMA = 6.0E-11 cm3/molecule/s
kOH MEA = 3.0E-11 cm3/molecule/s
Value of k1 (cm3/molecule/s) depends
on branching ratio
Primary activation equation. Defined to form only the amine
radical (hydrogen abstraction only from amine group).
The academic reports provide values for kOH = k1 + k11. The
ratio of k1 and k11 represent the branching ratio for attack at
the amine group of not at the amine group.
2 Ag + NO3. A*g -d[Ag]/dt = k10 [Ag] [NO3
.] k10 + k12 = 2.0E-13 cm
3/molecule/s
k10 depends on branching ratio
Secondary activation equation. Defined to form only the
amine radical (hydrogen abstraction only from amine group).
3 Ag + OH. NTPg -d[Ag]/dt = k11 [Ag] [OH
.] Value of k11 (cm
3/molecule/s) depends
on branching ratio
Reaction represents hydrogen abstraction from the non-amine
group. Reaction cannot form NS or NA. Rate constant
depends on kOH and the branching ratio, see Section 2.3.
4 Ag + NO3. NTPg -d[Ag]/dt = k12 [Ag] [NO3
.] Value of k12 (cm
3/molecule/s) depends
on branching ratio
Reaction represents hydrogen abstraction from the non-amine
group. Reaction cannot form NS or NA. Rate constant
depends on k10 and the branching ratio, see Section 2.3.
5 A*g + NO NSg -d[A*g]/dt = k2 [A*g] [NO] k2 = 8.53E-14 cm3/molecule/s Nitrosamine formation reaction /7/.
6 A*g + NO2 NAg -d[A*g]/dt = k3 [A*g] [NO2] k3 = 3.18E-13 cm3/molecule/s Nitramine formation reaction /7/.
7 A*g + NO2 NTPg -d[A*g]/dt = k4 [A*g] [NO2] k4 = 6.36E-13 cm3/molecule/s
Formation of imine and similar non-toxic product reaction /7/.
8 A*g + O2 NTPg -d[A*g]/dt = k5 [A*g] [O2] k5 =9.54E-20 cm3/molecule/s Formation of imine and similar non-toxic product reaction
9 NSg + hv A*g -d[NSg]/dt = k6(I) [NSg]
I = light intensity
k6(I) = 0 /s at night
k6(I) = 8.83E-4 (maximum at mid-day
in summer)
Reaction represents photolytic destruction (back reaction) of
nitrosamine to A*g and NO. The magnitude of k6 will vary
with day or night and with the intensity of light available as
determined by the zenith angle (φ), see Section 2.3.
10 NSg NTPg -d[NSg]/dt = k13 [NSg] k13 =0.0 /s for secondary amines and
k13 =1.91E-02 /s for primary amines
Reaction represents subsequent loss of nitrosamine. Rate
constant depends on amine, see Section 2.3.
11 NAg NTPg -d[NAg]/dt = k14 [NAg] k14 =0.0 /s
Reaction represents subsequent loss of nitramine. Rate
constant set to zero to be conservative.

DET NORSKE VERITAS
Report for GASSNOVA SF
MANAGING RISK
Modelling air quality impacts of post-combustion amine-based CO2 capture
DNV Ref. No.: PP011013
Revision No.: 1
Date : 28 May 2012 Page 17
3 IMPLEMENTATION OF AMINE ATMOSPHERIC CHEMISTRY
3.1 Overview of Approach to Model Development and Validation
The aim of this chapter is to present the approach used by DNV to modify the CALPUFF
modelling system to account for the Phase 2 amine chemistry reactions described in Section 2.
The objective of the modified CALPUFF model is to perform both complex dispersion
calculations and complex chemistry calculations simultaneously. This presents particular
problems for the validation of the work performed, since the model results depend on many input
variables. Whilst it may be relatively easy to develop a modified model that appears to work for
specific inputs, it is not easy to demonstrate that the modified model is correct in general.
It is not usually practicable or efficient to validate a model amendment by line-by-line code
verification. Instead, DNV’s approach to model development and validation is to separate the
dispersion processes from the chemistry processes and to validate them separately. These
validated processes are then combined together and final verification checks are performed. The
model development and validation process is summarised in Table 3.1.
Table 3.1 Overview of Model Development and Validation Process
Stage Description Comments
MathCad Box Model of chemical
and equilibrium processes.
Differential equations solved
numerically by several different
methods.
This evaluates the effect of the Phase
2 chemical scheme using mostly
constant variables (no dependence
on time of day, season of year,
location) and no dispersion
processes.
Enabled DNV to evaluate the most
robust numerical method for solving
the differential equations that
represent the chemical scheme.
Analytical Box Model. Reduced set
of differential equations solved
analytically.
This evaluates a sub-set of the Phase
2 chemical scheme using mostly
constant values and no dispersion
processes as described for the
MathCad Box Model.
Results verified against MathCad
Box Model and shown to be
consistent.
FORTRAN Box Model of chemical
and equilibrium processes.
Differential equations solved
numerically using the best numerical
method selected from the work with
MathCad.
Numerical differential equation
solver code implemented in
FORTRAN. This was written to
mimic the MathCad Box Model
solutions exactly.
Results verified against the MathCad
Box Model and the Analytical Box
Model. The results agree both
quantitatively and qualitatively
(trends are consistent with
expectations). This agreement
validates the solution of the chemical
scheme differential equations that
represent the Phase 2 chemical
scheme (Figure 2.2) in the modified
CALPUFF model.
Modified CALPUFF Model
combines existing dispersion
calculation with the FORTRAN Box
Model of the chemical processes
required by the Phase 2 chemical
scheme (Figure 2.2).
The FORTRAN Box Model was
modified into a FORTRAN
subroutine which was then called by
CALPUFF. This step completes the
required chemistry capability in the
modified CALPUFF model.
The CALPUFF dispersion
calculations are already validated.
The chemistry calculations are
validated by the above checking
process.

DET NORSKE VERITAS
Report for GASSNOVA SF
MANAGING RISK
Modelling air quality impacts of post-combustion amine-based CO2 capture
DNV Ref. No.: PP011013
Revision No.: 1
Date : 28 May 2012 Page 18
As a final check of the modified CALPUFF model, DNV included a tracer species in the
emission profile for each case calculation. The tracer species has identical physical properties to
the emitted amine, but does not undergo chemical reactions. This enables the following
comparisons to be performed:
The effect of dispersion without chemistry is evaluated from the concentration of the
tracer.
The effect of dispersion and chemistry together is evaluated from the concentration of
amine and its degradation products (NS, NA, NTP and A*).
An estimate of the effect of chemistry without dispersion can be obtained by calculating
the extent of dilution from the tracer species and so the concentration of other species
without dispersion can be estimated. This is only an estimate because the concentration
of a species reduces with dispersion and the rate of chemical reaction decreases with
reduced concentration of the reactants, but only the former process is compensated by the
estimate of the number of dilutions achieved. Thus it is not expected that the modified
CALPUFF model results can mimic the results from the box models even with the
correction for dispersion.
These final comparisons enabled DNV to demonstrate the complex qualitative trends that were
expected by examination of the reaction scheme (Figure 2.2).
3.2 Theoretical Background
The reaction scheme as shown in Section 2 (Figure 2.2) is exactly equivalent to a system of
ordinary differential equations (ODEs). Discovering how the concentrations of the chemical
species varies with time is the same problem as solving a particular system of ODEs.
For each iteration of the chemistry scheme, the initial value of the variables (the concentration of
the chemical species) is known (in this case, it is provided by CALPUFF) and the final value,
after the progression of a finite period of time, is determined by the differential equations. Such
problems are known as Initial Value Problems (IVPs).
In order to solve the general amine chemistry scheme as described in Section 2, eight variables
are defined as shown in Table 3.2.

DET NORSKE VERITAS
Report for GASSNOVA SF
MANAGING RISK
Modelling air quality impacts of post-combustion amine-based CO2 capture
DNV Ref. No.: PP011013
Revision No.: 1
Date : 28 May 2012 Page 19
Table 3.2 Species defined in the amine chemistry scheme and
corresponding system of DEs
Species Short Species
Name
Variable name in
DE System
Amine Amine y1
Activated Amine Astar (A*) y2
Nitramine NA y3
Nitrosamine NS y4
Total Non-Toxic Products NTP y5
Aqueous Amine Amine(aq) y6
Aqueous Nitramine NA(aq) y7
Aqueous Nitrosamine NA(aq) y8
The system of differential equations that corresponds to the amine chemistry scheme as discussed
in this document is shown in Figure 3.1. The independent variable t represents time. The initial
conditions are set at t = 0.
Figure 3.1 The full system of differential equations corresponding to
the Amine Chemistry Scheme (Figure 2.2).
[( )[ ] ( )[ ] ]
[ [ ] [ ]] [( )[ ] [ ] [ ]]
[ ] ( )
[ ] ( )
( [ ] [ ]) ( [ ] [ ])
We are interested in the values of the eight variables after a certain time interval has elapsed. In
general, that time interval is determined by the CALPUFF modelling system and is variable.

DET NORSKE VERITAS
Report for GASSNOVA SF
MANAGING RISK
Modelling air quality impacts of post-combustion amine-based CO2 capture
DNV Ref. No.: PP011013
Revision No.: 1
Date : 28 May 2012 Page 20
IVPs such as this one are known to have unique solutions provided that certain conditions of
continuity are met by the differential equations. These conditions are certainly met in this case,
because all the functions on the right hand sides of the equations in the system above as well all
their derivatives with respect to t are continuous over their whole domains.
Therefore we can be confident that a unique solution exists for every set of initial conditions and
we can set about solving this IVP.
3.3 Solving the Differential Equation System
In order to provide the most flexible model to benefit possible future assessments that may be
required by CCM Project, it was decided early in the model development process to solve the
systems of DEs by numerical methods. This means that if a decision is made in the future to
model a different chemical scheme, this CALPUFF+Amine Chemistry modelling system could
be changed to model that revised scheme, tested and the results obtained in a very much shorter
time than that from either this first model development process or than would be the case if the
DEs had to be solved analytically.
DNV conducted research into the most appropriate numerical method that should be implemented
to solve the DE system in the most robust and easily editable way. The method selected is
described in a later section of the present document, but the process for its selection included the
parallel development of the DE system in MathCad. MathCad is a symbolic mathematics engine
that includes some methods for the solutions of such IVPs. This provided insight into the
behaviour of the system and the suitability of different numerical solution methods for its
solution.
The MathCad model became a box model for the chemistry that takes place in the absence of
dispersion, and location or time of day or seasonal variation of variables. It proved to be a very
useful tool for quality checking and will help in the presentation of the chemistry results. It is
described in Section 3.4.
3.4 Box Modelling in MathCad
In order to establish a quality check for the chemistry module as finally implemented into
CALPUFF, a box model was developed in MathCad first. This model formed an important check
in the development of the model and is also useful for discussion of the nature and progression of
the chemical reactions that have been modelled.
A box model is a model of the chemistry alone. That is, no dispersion is modelled and the
chemistry is allowed to proceed in isolation with the assumptions of good mixing and constant
reaction conditions.
In the box model, the counter species were modelled as time-independent constant
concentrations. This is in contrast to the final model version as implemented in FORTRAN as

DET NORSKE VERITAS
Report for GASSNOVA SF
MANAGING RISK
Modelling air quality impacts of post-combustion amine-based CO2 capture
DNV Ref. No.: PP011013
Revision No.: 1
Date : 28 May 2012 Page 21
part of CALPUFF in which there were multiple dependencies of those counter species on the
time of day and the season, et cetera. These conditions and assumptions allow the examination of
the behaviour of the amine chemistry, as described by the system of DEs shown above, to be
evaluated alone and checked against expectation.
The reaction rates and the concentrations of their corresponding counter species as implemented
in the box model are shown in Table 3.3, below. Note that the reaction rates do not all have the
same units, because some of them are first order rates (to be multiplied by one concentration in
the differential equations) and some of them are second order rates (to be multiplied by two
concentrations).
Table 3.3 Constants used in Box Modelling
Constant
Label
Value used in box model Counter Species and
concentration
(molecules.cm-3
)
k1 7.2E-11 cm3.molecules
-1.s
-1 [OH
.]= 2.57E6
k2 8.53E-14 cm3.molecules
-1.s
-1 [NO]= 1.25E11
k3 3.18E-13 cm3.molecules
-1.s
-1 [NO2]= 1.25E11
k4 6.36E-13 cm3.molecules
-1.s
-1 [NO2]= 1.25E11
k5 9.54E-20 cm3.molecules
-1.s
-1 [O2]= 5.01E18
k6 8.83E-4 s-1
n/a
k10 1.6E-13 cm3.molecules
-1.s
-1 [NO3
.]= 3.2E7
k11 1.8E-11 cm3.molecules
-1.s
-1 [OH
.]= 2.57E6
k12 4.0E-14 cm3.molecules
-1.s
-1 [NO3
.]= 3.2E7
k13 0 s-1
n/a
k14 0 s-1
n/a
kA1 2.89E-3 s-1
n/a
kA2 2.89E-3 s-1
n/a
kA3 2.89E-3 s-1
n/a
kA4 2.89E-3 s-1
n/a
kA5 2.89E-3 s-1
n/a
kA6 2.89E-3 s-1
n/a
In the modified CALPUFF model the initial concentrations are provided by CALPUFF, but for
the purposes of testing the implementation in the box model, the initial concentrations of all eight
species are set to zero, except for amine which is set to an arbitrary initial value of 100
molecules.cm-3
.

DET NORSKE VERITAS
Report for GASSNOVA SF
MANAGING RISK
Modelling air quality impacts of post-combustion amine-based CO2 capture
DNV Ref. No.: PP011013
Revision No.: 1
Date : 28 May 2012 Page 22
For testing purposes the model calculates the values of all eight variables after 3 hours have
elapsed. (In the modified CALPUFF model, this interval is provided by CALPUFF, it is variable
and in general it is much shorter than 3 hours, but this relatively long period is useful for testing
purposes because it allows the species to develop significantly and all the expected behaviours to
be observed.)
MathCad makes available to the user various different numerical methods for the solution of
systems of ordinary differential equations with initial conditions. Following experimentation
with the DE system shown above, it was quickly discovered that only methods designed for so-
called “stiff” systems were suitable. This corresponds with generally accepted wisdom that
chemical reactions usually result in stiff systems.
The specific methods built into MathCad that are designed for stiff systems are the Bulirsch-Stoer
method for stiff systems and the Rosenbrock method. The results from the MathCad box model
showed no discernible variation between these methods, so only one set of results is shown.
3.4.1 MathCad Box Modelling Results
With the initial conditions arbitrarily set at amine = 100 units and all the other species set initially
to zero, the results of the MathCad box modelling as described above are shown in Table 3.4.
There are 15 intermediate results shown in this table, but that figure is merely a parameter of the
numerical method and can be altered at will, providing it is sufficiently high to yield smooth
results.
Note that, owing to a limitation in MathCad, only seven dependent variables can be modelled
simultaneously, and therefore the total Non-Toxic Products (NTP) are omitted from the MathCad
results. (The FORTRAN box model, described in Section 3.6, and which become the final
implementation in CALPUFF reported in Section 4, does not suffer from this limitation.) Note
also that the concentration units are arbitrary. The results are exactly linear with the
multiplicative factor of the initial concentration of amine, so the units are immaterial. The choice
of an initial value of 100 for amine means that all the results in Table 3.4 can be read as a simple
yield (per cent) for each species as a function of time.
Table 3.4 Tabulated Results of MathCad Box Modelling (arbitrary units).
(All results quoted to 3 decimal places, no judgement of accuracy implied)
Time / s Amine Astar (A*) NA NS A(aq) NA(aq) NS(aq)
0.000 100.000 0.000 0.000 0.000 0.000 0.000 0.000
720.000 44.834 0.014 0.312 0.065 45.228 0.209 0.046
1.440e3 40.557 0.013 0.497 0.088 42.238 0.407 0.077
2.160e3 37.286 0.012 0.670 0.103 38.851 0.587 0.096
2.880e3 34.289 0.011 0.829 0.111 35.728 0.752 0.107

DET NORSKE VERITAS
Report for GASSNOVA SF
MANAGING RISK
Modelling air quality impacts of post-combustion amine-based CO2 capture
DNV Ref. No.: PP011013
Revision No.: 1
Date : 28 May 2012 Page 23
Time / s Amine Astar (A*) NA NS A(aq) NA(aq) NS(aq)
3.600e3 31.532 0.010 0.975 0.114 32.855 0.905 0.113
4.320e3 28.997 9.239e-3 1.111 0.114 30.214 1.046 0.114
5.040e3 26.666 8.506e-3 1.235 0.112 27.785 1.175 0.113
5.760e3 24.522 7.829e-3 1.349 0.108 25.551 1.294 0.109
6.480e3 22.550 7.205e-3 1.455 0.102 23.497 1.404 0.105
7.200e3 20.737 6.629e-3 1.552 0.097 21.608 1.505 0.099
7.920e3 19.070 6.099e-3 1.641 0.091 19.870 1.598 0.093
8.640e3 17.537 5.611e-3 1.723 0.085 18.273 1.683 0.087
9.360e3 16.127 5.161e-3 1.798 0.079 16.804 1.762 0.082
1.008e4 14.830 4.747e-3 1.868 0.074 15.453 1.834 0.076
1.080e4 13.638 4.366e-3 1.931 0.068 14.210 1.901 0.070
These results are presented in graphical form in Figure 3.2 to Figure 3.4 below. They are shown
as three separate graphs because of the very different vertical scales. Note that more than 15
intermediate values are shown in the graphs. Note that the scales are linear in arbitrary
concentration units, with 100 units of amine concentration present at t=0.
Figure 3.2 Box Model Results for Amine and Aqueous Amine
0
10
20
30
40
50
60
70
80
90
100
0,0 0,5 1,0 1,5 2,0 2,5 3,0
Co
nce
ntr
atio
n
Time / hours
Amine
A(aq)

DET NORSKE VERITAS
Report for GASSNOVA SF
MANAGING RISK
Modelling air quality impacts of post-combustion amine-based CO2 capture
DNV Ref. No.: PP011013
Revision No.: 1
Date : 28 May 2012 Page 24
Figure 3.3 Box Model Results for NA, NA(aq), NS, NS(aq) and AStar
Figure 3.4 Box Model Results for NS, NS(aq) and AStar
0
0,5
1
1,5
2
2,5
0,0 0,5 1,0 1,5 2,0 2,5 3,0
Co
nce
ntr
atio
n
Time / hours
NA
NA(aq)
NS
NS(aq)
AStar
0
0,02
0,04
0,06
0,08
0,1
0,12
0,0 0,5 1,0 1,5 2,0 2,5 3,0
Co
nce
ntr
atio
n
Time / hours
NS
NS(aq)
AStar
DET NORSKE VERITAS
Report for GASSNOVA SF
MANAGING RISK
Modelling air quality impacts of post-combustion amine-based CO2 capture
DNV Ref. No.: PP011013
Revision No.: 1
Date : 28 May 2012 Page 25
Amine, nitramine and nitrosamine all equilibrate rapidly in 50/50 proportion with their aqueous
equivalents, with the aqueous versions showing a small lag behind the gaseous species. This is as
expected since the forward and backward “reaction rates” for the phase transitions are equal (see
Table 3.3). Amine in the aqueous phase rises to equilibrium with gas phase amine and then falls
as the gas phase amine concentration falls, as expected.
Amine reduces monotonically and exponentially, correctly reflecting the loss-only process that is
dependent only on the amine species itself.
Nitramine grows monotonically but with reducing gradient, correctly reflecting the fact that there
are no loss processes for nitramine in this box model (k14=0 here) and the reducing stock of
amine which is its precursor.
Nitrosamine behaves initially in a similar way, but grows more slowly than nitramine because
k2∙[NO] is smaller than k3∙[NO2]. In fact the ratio is about 3.7. Interrogation of the box model
for the early part of the reaction period has revealed that the ratio between these species is indeed
about 3.7. In time, the concentration of nitrosamine grows sufficiently and the precursor amine
reduces sufficiently that the back-reaction k6 begins to dominate and the concentration of
nitrosamine begins to reduce again, as expected.
The intermediate product AStar grows rapidly at the very beginning of the reaction period, but
quickly reaches a peak and then declines slowly as the concentration of amine starts to deplete
significantly (more than about 67% consumed). This provides an indication of the range of
values over which the steady state concentration for reactive species approximation is valid
(though this approximation is not used by DNV in the work reported here). Finally, as expected,
the concentration of Astar is never high relative to all the other species. This reflects the much
faster reaction rates downstream of Astar (activated amine is more reactive than amine itself).
More specific comparisons against an analytical solution of a particular special case of this
scheme are presented in the following section.
3.5 Analytical Solution for a Sub-System.
To further verify the behaviour of the box model, a smaller reaction scheme was considered,
namely the sub-system involving only amine and amine(aq). In this system there is net loss of
mass overall and phase transfer between amine(g) and amine(aq). This sub-system is described
in Figure 3.5.
Figure 3.5 DE system for amine-amine(aq) sub-system
( )

DET NORSKE VERITAS
Report for GASSNOVA SF
MANAGING RISK
Modelling air quality impacts of post-combustion amine-based CO2 capture
DNV Ref. No.: PP011013
Revision No.: 1
Date : 28 May 2012 Page 26
where y1 is [Amine]
y2 is [Amine(aq)], and
K = (k1 + k11)[OH] + (k10 + k12)[NO3]
The initial conditions are y1(0)=A0 and y2(0)=0.
If the following definitions are made,
√
it can be shown that the solution to the sub-system above is as follows:
( ) ( ) ( ( )
( ))
( ) ( ) ( )
Using the constant values for the MathCad box model shown in Section 3.4, and the initial
condition A0=100, these solutions take on the numerical values:
Amineg(3 hours) = 13.638
Amineaq(3 hours) = 14.210
These numerical values confirm the results in the final row of Table 3.4. The values for
intermediate values of t agree also.
This analytical solution to a subset of the full chemistry scheme gives DNV confidence that the
numerical methods implemented in MathCad have provided a reliable solution to the full scheme.
3.6 Box Modelling in FORTRAN
3.6.1 Description
One of the numerical methods built into MathCad is the Rosenbrock method (appropriate for stiff
systems), so it was decided to adopt this method for implementation into FORTRAN and
ultimately into the modified CALPUFF model.
Standard code libraries were consulted and an implementation of the Rosenbrock method was
selected and adapted. In the first instance, the method was implemented as a stand-alone box
model to verify that it reproduced the results of the MathCad box model.

DET NORSKE VERITAS
Report for GASSNOVA SF
MANAGING RISK
Modelling air quality impacts of post-combustion amine-based CO2 capture
DNV Ref. No.: PP011013
Revision No.: 1
Date : 28 May 2012 Page 27
To allow for full computation of the chemistry scheme within CALPUFF, the scheme shown in
Figure 3.1 was coded into FORTRAN and linked to the DE solver. The Rosenbrock method
allows for a full specification of the precision that is required from the solutions. The algorithm
is implemented with adaptive step-size so that the initial guess at an appropriate step size is never
a sensitive parameter.
This implementation acts as a simple “stepper” from time=0 to time = endpoint, so it provides
only results at time = endpoint with the user-specified precision. It is possible to extract
intermediate results from this implementation too, but comparison of the results at the endpoint
with the corresponding results from the analytical solution and MathCad was regarded as a
sufficient test of the implementation in this instance.
The code for the FORTRAN box model is provided at Appendix 2 for inspection. The
implementation of the DE system is shown in the main program “TROS”.
3.6.2 Comparison of the FORTRAN and MathCad Box Models.
Various different implementations of the box models were tested, as shown in Table 3.5 below.
These models were run repeatedly with differing constants and time periods, including those
described in Section 3.4 above.
Table 3.5 Different Implementations and Cases Tested in the Development Process
Implementation Description
Implementations with no aqueous phases.
Gassnova scheme 1.mcd MathCad. Bulirsch-Stoer method for stiff systems.
5 Species (Amine, AStar, NA, NS, NTP)
Fully numerical solution.
Gassnova scheme 2.mcd MathCad. Bulirsch-Stoer method for stiff systems.
5 Species (Amine, AStar, NA, NS, NTP)
Exact analytical solution for Amine(t), other species numerical.
Gassnova scheme 3.mcd MathCad. Bulirsch-Stoer method for stiff systems.
Steady-State assumption for AStar.
4 Species (Amine, NA, NS, NTP)
Fully numerical solution.
Gassnova scheme 4.mcd MathCad. Analytical solution for 3 species steady-state case.
3 Species (Amine, NA, NS)
TROS4a.f90 FORTRAN. Rosenbrock Method.
5 Species (Amine, AStar, NA, NS, NTP)
Fully numerical solution.

DET NORSKE VERITAS
Report for GASSNOVA SF
MANAGING RISK
Modelling air quality impacts of post-combustion amine-based CO2 capture
DNV Ref. No.: PP011013
Revision No.: 1
Date : 28 May 2012 Page 28
Implementation Description
Implementations including aqueous phases.
Gassnova 5.mcd MathCad. Bulirsch-Stoer method for stiff systems.
7 Species (Amine, AStar, NA, NS, A(aq), NA(aq), NS(aq))
Fully numerical solution.
(NTP omitted owing to a limitation in MathCad)
Gassnova 6.mcd MathCad. Analytical solution for a 2 species sub-system.
2 Species (Amine, A(aq))
TROS4b.f90 FORTRAN. Rosenbrock Method.
8 Species (Amine, AStar, NA, NS, NTP, A(aq), NA(aq), NS(aq))
Fully numerical solution.
In every case the results for all implementations agreed exactly, to within the precision that the
implementation allowed, and for those species that were included in that implementation. In the
case of the MathCad implementations, the results agreed for all intermediate time intervals and in
the case of the FORTRAN implementations, the result at the final time-point agreed with all other
implementations.
It is the final FORTRAN module shown above, TROS4b.f90, that forms the final version of the
amine chemistry processor and that is incorporated into the modified CALPUFF model.
3.7 Implementation of the Chemistry Solver into CALPUFF
In its native modes, CALPUFF performs certain chemical transformations on the species that are
normally considered in a CALPUFF application. DNV has expanded that list of species to
accommodate amine atmospheric chemistry and expanded the FORTRAN routine that performs
the chemical transformations. In particular, the FORTRAN method discussed in Section 3.6
above is added to the CALPUFF code as an additional module. The parts of the code that are
required for the amine chemistry modelling are activated by a switch in the CALPUFF input file
(MCHEM=8).
The FORTRAN box model is converted into a CALPUFF module by converting its main
program into a subroutine that accepts inputs from the CALPUFF chemistry module and passes
results back to that module. The main subroutines that participate in the amine chemistry are
shown with brief descriptions in the following table.

DET NORSKE VERITAS
Report for GASSNOVA SF
MANAGING RISK
Modelling air quality impacts of post-combustion amine-based CO2 capture
DNV Ref. No.: PP011013
Revision No.: 1
Date : 28 May 2012 Page 29
Table 3.6 Amine Chemistry Subroutines in the DNV-modified version of CALPUFF
Subroutine
Name
Relative
Level in code
structure
Description
<Higher Levels
in CALPUFF>
1 (by
definition)
Main body of CALPUFF code, handling user input, initialisation,
dispersion and results reporting. DNV-modified only for “admin”
purposes to allow new MCHEM=8 option.
CHEM 2 Main chemistry subroutine. Code-technical changes only. Calls CHEMI
and CHEMRIV8.
CHEMI 3 Initialisation for chemistry modules. Reads user input for chemistry
required. Minor changes.
CHEMRIV8 3 Preliminary work for chemistry. Gathers species information for each puff
from CALPUFF as well as relevant met data. Calls CHMRIV8
CHMRIV8 4 Main chemistry subroutine, including amine chemistry. Performs all the
conventional CALPUFF chemical transformations and calls Amine DE
solver. Calls TROS4.
TROS4 5 The Amine DE solver. Defines the DE system and sets up the Rosenbrock
method and sets time step required and stopping conditions. Reports
success/failure condition back to CHMRIV8 as well as the results. Calls
further subroutines.
<Rosenbrock
Method
subroutines>
6+ Further subroutines of the Rosenbrock method (standard library code).
Includes the adaptive stepsize layer and the algorithm itself.
The parts critical to the implementation of the amine chemistry scheme into CALPUFF are in the
routines CHMRIV8 and TROS4.
With the amine chemistry option (MCHEM=8) turned on, CALPUFF tracks 16 species in total,
eight of which are the active amine chemistry participants. One other is the inert “tracer”
compound that is assumed to be emitted at the same rate as the amine under consideration with
the same molar mass. The purpose of this tracer is to allow the consideration of the effect of
dispersion only by the inclusion of a compound that does not participate in any chemistry
processes.
CHMRIV8 prepares the species list, selecting from the main list of species the eight that are to be
submitted for processing with the Rosenbrock method using the amine chemistry scheme.
CHMRIV8 then submits a call to TROS4 for each dispersion “puff”. In particular, Table 3.7
shows the data that is passed between CHMRIV8 and TROS for each puff.

DET NORSKE VERITAS
Report for GASSNOVA SF
MANAGING RISK
Modelling air quality impacts of post-combustion amine-based CO2 capture
DNV Ref. No.: PP011013
Revision No.: 1
Date : 28 May 2012 Page 30
Table 3.7 Data passed between CHMRIV8 and TROS4.
Data Comments
The initial concentrations of the 8 species
that participate in the amine chemistry.
CHMRIV8 converts concentrations from grams / puff (the units used
in higher CALPUFF levels for dispersion) to molecules.cm-3
.
The time-step required. In hours, converted to seconds by TROS4. This is a variable quantity
determined by the dispersion routines.
The cosine of the zenith angle of the sun at
this time.
Scalar, computed by CALPUFF. Used for the calculation of the OH
radical concentration and other parameters as described in the
sections above.
Concentrations of NO, NO2 and OH radicals
as computed by CALPUFF.
The NO and NO2 concentrations passed here are the concentration
resulting only from the emissions at the source. Background
concentrations are added by TROS4 as discussed in Section 2.3.
The concentration of OH radicals is not used at present, but is
included in the parameter list in case a future change is required to re-
link the OH-modelling to the in-built CALPUFF methods. At
present, the OH radical concentration is determined by TROS
according to the methods described in Section 2.3.
Success / failure flag Boolean. The Rosenbrock method generates a success or failure flag
that is passed upwards to CHMRIV8. The processing run halts if this
flag is ever set to failure.
The final concentrations of the 8 species
that participate in the amine chemistry.
The concentration of the species after the passing of time-step as
determined by the system of DEs and the Rosenbrock method is
passed upwards to CHMRIV8.
Finally, the results from TROS4 are converted back to the units used by CALPUFF and go on to
participate in the dispersion routines of standard CALPUFF.
4 RESULTS AND DISCUSSION
This section summarises the results obtained from the modified version of CALPUFF and the
interpretation of these results.
Consistent with previous work /2/, CALPUFF outputs results in the form of airborne
concentrations for each species at ground level at every point on a 140×140 grid with regular
spacing of 500m. This results in too much data to tabulate exhaustively. Instead the results are
displayed in two ways in this report. The following results are shown for the two main case
studies (described in Section 4.1):
Firstly, the full results are displayed as a contour plot of annual average ground level
concentration.
Secondly, the annual average ground level concentrations are shown graphically as a
function of distance from the source, along a line drawn from the source to a point on the
edge of the study area North-West along the main plume (see Figure 4.1). For

DET NORSKE VERITAS
Report for GASSNOVA SF
MANAGING RISK
Modelling air quality impacts of post-combustion amine-based CO2 capture
DNV Ref. No.: PP011013
Revision No.: 1
Date : 28 May 2012 Page 31
comparison with the contour plots, the coordinates of the point furthest from the source
are (x=600km, y=6780km). The source itself is at (x=610.9km, y=6743.2km).
It should be noted that annual average meteorological conditions for 2009 are applied to all of the
case calculations, consistent with previous work /2/. Thus, although the concentration plots with
distance will tend to correspond with increasing time, the correspondence will not be exact.
4.1 Description of Case Studies
Table 4.1 summarises the key inputs and assumptions for the first two case studies presented in
this report.
Table 4.1 Summary of Case Studies Presented for Case A and Case B
Case Name Case A Case B
General features Low impact case High impact case
Emissions Light primary amine (50 g/mol) emitted at
1ppm.
Heavy secondary amine (100 g/mol)
emitted at 1ppm.
NO emitted at 4.62ppm NO emitted at 4.62ppm
NO2 emitted at 0.502ppm NO2 emitted at 0.502ppm
No nitrosamine or nitramine emitted No nitrosamine or nitramine emitted
Nothing emitted in the aqueous phase. Nothing emitted in the aqueous phase.
Solubility properties Fast equilibration of amine, nitramine and
nitrosamine to aqueous phase during
dispersion with high transfer
(Re = 0.1) .
Fast equilibration of amine, nitramine
and nitrosamine to aqueous phase during
dispersion with low transfer
(Re = 0.0001) .
Reactivity with OH
radicals
k1+ k11 =
3.0E-11 cm3 molecule
-1 s
-1
k1+ k11 =
9.0E-11 cm3 molecule
-1 s
-1
20% branching to amine radical A* for
reaction with OH∙
50% branching to amine radical A* for
reaction with OH∙
Reactivity with NO3
radicals k10+ k12 = 2.0E-13 cm
3 molecule
-1 s
-1 k10+ k12 = 2.0E-13 cm
3 molecule
-1 s
-1
20% branching to amine radical A* for
reaction with NO3∙
50% branching to amine radical A* for
reaction with NO3∙
Reactions of NS k6 is as described in Section 2.3
k13 = 1.91E-02 s-1
k6 is as described in Section 2.3
k13 = 0.0 s-1
The chief differences between these case studies are as follows.
Case B has a faster overall reaction rate for amine (k1+k11+k10+k12).
Case B has a higher branching ratio to the amine radical that leads to the compounds of
interest.
Case B allows far less transfer to the aqueous phase for the source amine, which will
reduce the “buffering” effect of the aqueous phase (since no amine chemistry takes place
in the aqueous phase).
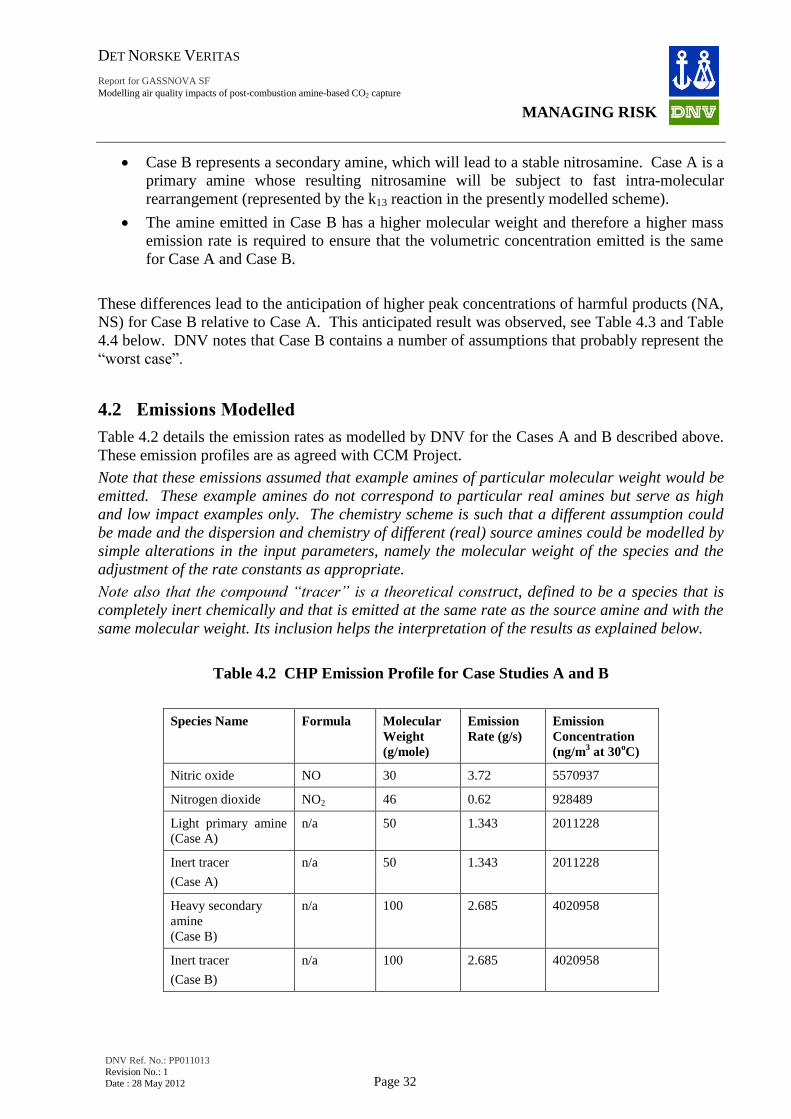
DET NORSKE VERITAS
Report for GASSNOVA SF
MANAGING RISK
Modelling air quality impacts of post-combustion amine-based CO2 capture
DNV Ref. No.: PP011013
Revision No.: 1
Date : 28 May 2012 Page 32
Case B represents a secondary amine, which will lead to a stable nitrosamine. Case A is a
primary amine whose resulting nitrosamine will be subject to fast intra-molecular
rearrangement (represented by the k13 reaction in the presently modelled scheme).
The amine emitted in Case B has a higher molecular weight and therefore a higher mass
emission rate is required to ensure that the volumetric concentration emitted is the same
for Case A and Case B.
These differences lead to the anticipation of higher peak concentrations of harmful products (NA,
NS) for Case B relative to Case A. This anticipated result was observed, see Table 4.3 and Table
4.4 below. DNV notes that Case B contains a number of assumptions that probably represent the
“worst case”.
4.2 Emissions Modelled
Table 4.2 details the emission rates as modelled by DNV for the Cases A and B described above.
These emission profiles are as agreed with CCM Project.
Note that these emissions assumed that example amines of particular molecular weight would be
emitted. These example amines do not correspond to particular real amines but serve as high
and low impact examples only. The chemistry scheme is such that a different assumption could
be made and the dispersion and chemistry of different (real) source amines could be modelled by
simple alterations in the input parameters, namely the molecular weight of the species and the
adjustment of the rate constants as appropriate.
Note also that the compound “tracer” is a theoretical construct, defined to be a species that is
completely inert chemically and that is emitted at the same rate as the source amine and with the
same molecular weight. Its inclusion helps the interpretation of the results as explained below.
Table 4.2 CHP Emission Profile for Case Studies A and B
Species Name Formula Molecular
Weight
(g/mole)
Emission
Rate (g/s)
Emission
Concentration
(ng/m3 at 30
oC)
Nitric oxide NO 30 3.72 5570937
Nitrogen dioxide NO2 46 0.62 928489
Light primary amine
(Case A)
n/a 50 1.343 2011228
Inert tracer
(Case A)
n/a 50 1.343 2011228
Heavy secondary
amine
(Case B)
n/a 100 2.685 4020958
Inert tracer
(Case B)
n/a 100 2.685 4020958
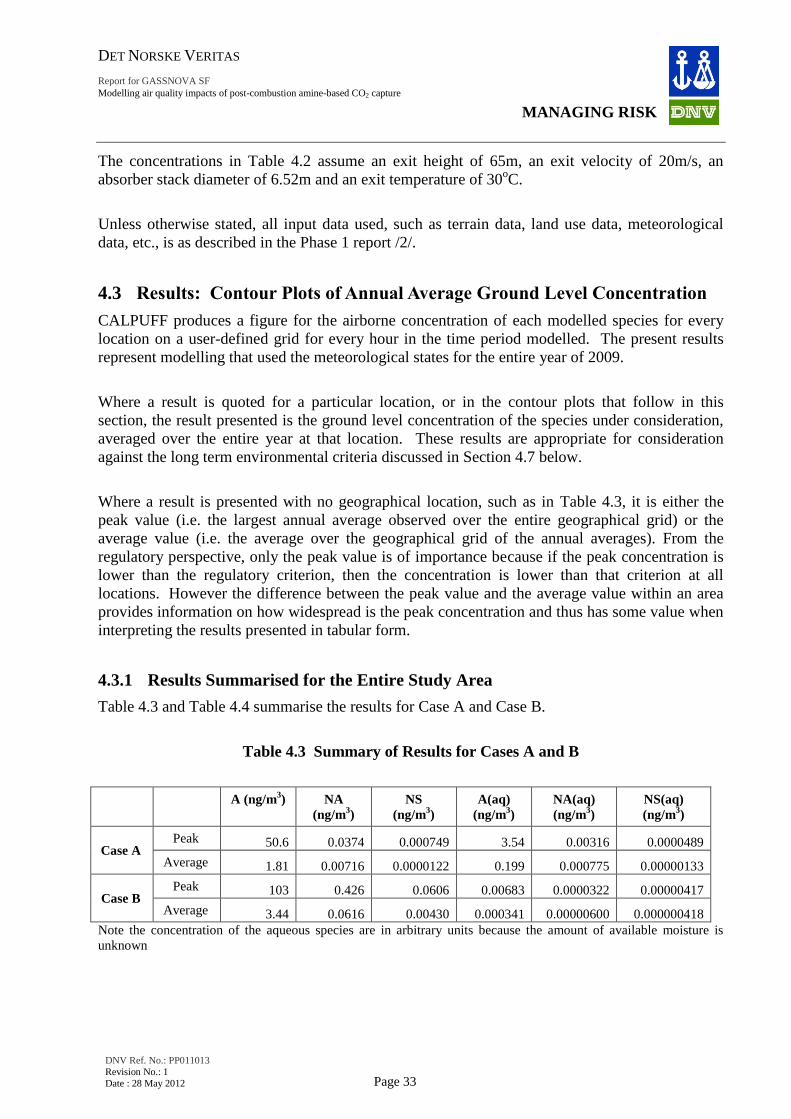
DET NORSKE VERITAS
Report for GASSNOVA SF
MANAGING RISK
Modelling air quality impacts of post-combustion amine-based CO2 capture
DNV Ref. No.: PP011013
Revision No.: 1
Date : 28 May 2012 Page 33
The concentrations in Table 4.2 assume an exit height of 65m, an exit velocity of 20m/s, an
absorber stack diameter of 6.52m and an exit temperature of 30oC.
Unless otherwise stated, all input data used, such as terrain data, land use data, meteorological
data, etc., is as described in the Phase 1 report /2/.
4.3 Results: Contour Plots of Annual Average Ground Level Concentration
CALPUFF produces a figure for the airborne concentration of each modelled species for every
location on a user-defined grid for every hour in the time period modelled. The present results
represent modelling that used the meteorological states for the entire year of 2009.
Where a result is quoted for a particular location, or in the contour plots that follow in this
section, the result presented is the ground level concentration of the species under consideration,
averaged over the entire year at that location. These results are appropriate for consideration
against the long term environmental criteria discussed in Section 4.7 below.
Where a result is presented with no geographical location, such as in Table 4.3, it is either the
peak value (i.e. the largest annual average observed over the entire geographical grid) or the
average value (i.e. the average over the geographical grid of the annual averages). From the
regulatory perspective, only the peak value is of importance because if the peak concentration is
lower than the regulatory criterion, then the concentration is lower than that criterion at all
locations. However the difference between the peak value and the average value within an area
provides information on how widespread is the peak concentration and thus has some value when
interpreting the results presented in tabular form.
4.3.1 Results Summarised for the Entire Study Area
Table 4.3 and Table 4.4 summarise the results for Case A and Case B.
Table 4.3 Summary of Results for Cases A and B
A (ng/m3) NA
(ng/m3)
NS
(ng/m3)
A(aq)
(ng/m3)
NA(aq)
(ng/m3)
NS(aq)
(ng/m3)
Case A Peak 50.6 0.0374 0.000749 3.54 0.00316 0.0000489
Average 1.81 0.00716 0.0000122 0.199 0.000775 0.00000133
Case B Peak 103 0.426 0.0606 0.00683 0.0000322 0.00000417
Average 3.44 0.0616 0.00430 0.000341 0.00000600 0.000000418
Note the concentration of the aqueous species are in arbitrary units because the amount of available moisture is
unknown

DET NORSKE VERITAS
Report for GASSNOVA SF
MANAGING RISK
Modelling air quality impacts of post-combustion amine-based CO2 capture
DNV Ref. No.: PP011013
Revision No.: 1
Date : 28 May 2012 Page 34
It is of particular interest where in the study area the peak concentrations are observed. In all
cases, because of the dispersive effect of the atmosphere the peaks are close to the emission
source, but there is some variation in distance from the source.
Table 4.4 Cases A and B. Location of peak concentrations
Amine NA+NS+NA(aq)+NS(aq)
Peak value
(ng/m3)
Distance from
source / km
Peak value
(ng/m3)
Distance from
source / km
Case A 50.6 0.80 0.0414 0.34
Case B 103 0.80 0.486 0.34
The location of the peak values can also be seen in the contour plots in the following sub-section.
4.3.2 Results Presented as Contour Plots
In the series of figures below, ground level annual average contour plots are shown for the
species amine and the sum of all the harmful compounds (NA+NS+NA(aq)+NS(aq)) for Cases A
and B.
Figure 4.1 includes an underlay showing the geographical location and context. The thick black
line in Figure 4.1 indicates the line along which results are sampled for presentation in Section
4.4.

DET NORSKE VERITAS
Report for GASSNOVA SF
MANAGING RISK
Modelling air quality impacts of post-combustion amine-based CO2 capture
DNV Ref. No.: PP011013
Revision No.: 1
Date : 28 May 2012 Page 35
Figure 4.1 General Layout for Results Presentations.
Illustrative example only
The contour plots that follow show real results for Case A and Case B.
Please note that all the contour plots presented in this report have units of g/m3 and the x and y
scales are in kilometres.

DET NORSKE VERITAS
Report for GASSNOVA SF
MANAGING RISK
Modelling air quality impacts of post-combustion amine-based CO2 capture
DNV Ref. No.: PP011013
Revision No.: 1
Date : 28 May 2012 Page 36
4.3.3 Results: Contour Plots for Case Study A
In all the plots in this section, and in all contour plots in this report, the source is located at
x=610.9km, y=6743.2km.
Species: Amine
Average: 1.81 ng/m3
Maximum: 50.6 ng/m3
590 600 610 620 630 640 650
6710
6720
6730
6740
6750
6760
6770
3E-010
1E-009
3E-009
1E-008
4E-008

DET NORSKE VERITAS
Report for GASSNOVA SF
MANAGING RISK
Modelling air quality impacts of post-combustion amine-based CO2 capture
DNV Ref. No.: PP011013
Revision No.: 1
Date : 28 May 2012 Page 37
Species: Nitramine(g)+Nitrosamine(g)
Average: 0.00717 ng/m3 Maximum: 0.0381 ng/m
3
590 600 610 620 630 640 650
6710
6720
6730
6740
6750
6760
6770
3E-012
5E-012
1E-011
3E-011
3.4E-011

DET NORSKE VERITAS
Report for GASSNOVA SF
MANAGING RISK
Modelling air quality impacts of post-combustion amine-based CO2 capture
DNV Ref. No.: PP011013
Revision No.: 1
Date : 28 May 2012 Page 38
4.3.4 Results: Contour Plots for Case Study B
Species: Amine
Average: 3.44 ng/m3
Maximum: 103 ng/m3
590 600 610 620 630 640 650
6710
6720
6730
6740
6750
6760
6770
3E-010
1E-009
3E-009
1E-008
3E-008
9E-008

DET NORSKE VERITAS
Report for GASSNOVA SF
MANAGING RISK
Modelling air quality impacts of post-combustion amine-based CO2 capture
DNV Ref. No.: PP011013
Revision No.: 1
Date : 28 May 2012 Page 39
Species: Nitramine+Nitrosamine (g)
Average: 0.0659 ng/m3 Maximum: 0.486 ng/m
3
4.4 Results: As Function of Distance from Source
In order to more easily compare the results from the modified CALPUFF model with the results
from the box models (concentration with time), the full gridded results were sampled along a line
drawn from the source to a point at the boundary of the study area approximately along the line of
the main plume over the annual average weather conditions (see Figure 4.1). These results are
shown in the sequence of figures below. Note that the concentrations of the inert “tracer”
compound are shown in each case, showing the effect of dispersion alone.
For each case study, two groups of figures are shown:
Unmodified concentration.
Concentration divided by the dilution factor. The dilution factor, shown in Table 4.5, is
the extent to which the tracer compound has been diluted by dispersion alone compared to
590 600 610 620 630 640 650
6710
6720
6730
6740
6750
6760
6770
3E-011
1E-010
3E-010
4E-010

DET NORSKE VERITAS
Report for GASSNOVA SF
MANAGING RISK
Modelling air quality impacts of post-combustion amine-based CO2 capture
DNV Ref. No.: PP011013
Revision No.: 1
Date : 28 May 2012 Page 40
the first location on the plume centreline. These results estimate the effect of the
chemistry in isolation.
Table 4.5 Observed dilution factor as a function of distance from the source
Distance / km
(at ground level
unless otherwise
stated)
Concentration of the
tracer compound
(g/m3)
(for Case A)
Dilution factor
(relative to 0km
mark)
Dilution factor
(relative to
emission)
At stack mouth, 65m
above ground level 2.01E-03 n/a 1.00E+00
0, at ground level 2.98E-08 1.00E+00 1.48E-05
1 5.08E-08 1.70E+00 2.53E-05
2 4.09E-08 1.37E+00 2.04E-05
3 2.92E-08 9.77E-01 1.45E-05
4 2.47E-08 8.29E-01 1.23E-05
5 2.90E-08 9.70E-01 1.44E-05
10 1.93E-08 6.47E-01 9.60E-06
15 1.37E-08 4.59E-01 6.82E-06
20 1.06E-08 3.57E-01 5.29E-06
25 8.56E-09 2.87E-01 4.26E-06
30 6.98E-09 2.34E-01 3.47E-06
35 5.20E-09 1.74E-01 2.59E-06
Table 4.5 shows that the assumed 65m stack achieves dilutions in excess of about 40,000 for all
locations sampled along the plume centreline compared to the concentration at the stack exit.
4.4.1 Results: By Distance for Case Study A
In each of the following figures, the horizontal axis is the distance from the source in kilometres
and the vertical axis is the species annual average ground level concentration in g/m3. Note that
in some figures the concentration of some species is obscured by others.

DET NORSKE VERITAS
Report for GASSNOVA SF
MANAGING RISK
Modelling air quality impacts of post-combustion amine-based CO2 capture
DNV Ref. No.: PP011013
Revision No.: 1
Date : 28 May 2012 Page 41
Case Study A. Concentration Results
Figure 4.2 Case Study A: Concentration, Tracer and Amine
Figure 4.3 Case Study A: Concentration, NTP and Amine(aq)
0,0E+00
1,0E-08
2,0E-08
3,0E-08
4,0E-08
5,0E-08
6,0E-08
0 10 20 30 40
Co
nce
ntr
atio
n (
g/m
3 )
Distance from source (km)
Tracer
Amine
0,0E+00
5,0E-10
1,0E-09
1,5E-09
2,0E-09
2,5E-09
3,0E-09
3,5E-09
0 10 20 30 40
Co
nce
ntr
atio
n (
g/m
3 )
Distance from source (km)
NTP
Amine(aq)

DET NORSKE VERITAS
Report for GASSNOVA SF
MANAGING RISK
Modelling air quality impacts of post-combustion amine-based CO2 capture
DNV Ref. No.: PP011013
Revision No.: 1
Date : 28 May 2012 Page 42
Figure 4.4 Case Study A: Concentration, NA and NA(aq)
Figure 4.5 Case Study A: Concentration, NS, NS(aq), A*
0,0E+00
5,0E-12
1,0E-11
1,5E-11
2,0E-11
2,5E-11
3,0E-11
3,5E-11
0 10 20 30 40
Co
nce
ntr
atio
n (
g/m
3 )
Distance from source (km)
NA
NA(aq)
0,0E+00
1,0E-13
2,0E-13
3,0E-13
4,0E-13
5,0E-13
6,0E-13
7,0E-13
0 10 20 30 40
Co
nce
ntr
atio
n (
g/m
3)
Distance from source (km)
Astar
NS
NS(aq)

DET NORSKE VERITAS
Report for GASSNOVA SF
MANAGING RISK
Modelling air quality impacts of post-combustion amine-based CO2 capture
DNV Ref. No.: PP011013
Revision No.: 1
Date : 28 May 2012 Page 43
Case Study A. Dilution-corrected Results (relative to ground level concentration at 0km)
Figure 4.6 Case Study A: Dilution-corrected, Tracer and Amine
Figure 4.7 Case Study A: Dilution-corrected, NTP and Amine(aq)
0,0E+00
5,0E-09
1,0E-08
1,5E-08
2,0E-08
2,5E-08
3,0E-08
3,5E-08
0 10 20 30 40
Co
nce
ntr
atio
n (
g/m
3 )
Distance from source (km)
Tracer
Amine
0,0E+00
5,0E-10
1,0E-09
1,5E-09
2,0E-09
2,5E-09
3,0E-09
3,5E-09
4,0E-09
4,5E-09
0 10 20 30 40
Co
nce
ntr
atio
n (
g/m
3 )
Distance from source (km)
NTP
Amine(aq)

DET NORSKE VERITAS
Report for GASSNOVA SF
MANAGING RISK
Modelling air quality impacts of post-combustion amine-based CO2 capture
DNV Ref. No.: PP011013
Revision No.: 1
Date : 28 May 2012 Page 44
Figure 4.8 Case Study A: Dilution-corrected, NA and NA(aq)
Figure 4.9 Case Study A: Dilution-corrected, NS, NS(aq), A*
0,0E+00
1,0E-11
2,0E-11
3,0E-11
4,0E-11
5,0E-11
6,0E-11
7,0E-11
0 10 20 30 40
Co
nce
ntr
atio
n (
g/m
3 )
Distance from source (km)
NA
NA(aq)
0,0E+00
1,0E-13
2,0E-13
3,0E-13
4,0E-13
5,0E-13
6,0E-13
0 10 20 30 40
Co
nce
ntr
atio
n (
g/m
3)
Distance from source (km)
Astar
NS
NS(aq)

DET NORSKE VERITAS
Report for GASSNOVA SF
MANAGING RISK
Modelling air quality impacts of post-combustion amine-based CO2 capture
DNV Ref. No.: PP011013
Revision No.: 1
Date : 28 May 2012 Page 45
4.4.2 Results: By Distance for Case Study B
Case Study B. Concentration Results
Figure 4.10 Case Study B: Concentration, Tracer and Amine
Figure 4.11 Case Study B: Concentration, NTP and Amine(aq)
0,0E+00
2,0E-08
4,0E-08
6,0E-08
8,0E-08
1,0E-07
1,2E-07
0 10 20 30 40
Co
nce
ntr
atio
n (
g/m
3 )
Distance from source (km)
Tracer
Amine
0,0E+00
1,0E-09
2,0E-09
3,0E-09
4,0E-09
5,0E-09
6,0E-09
7,0E-09
8,0E-09
0 10 20 30 40
Co
nce
ntr
atio
n (
g/m
3 )
Distance from source (km)
NTP
Amine(aq)

DET NORSKE VERITAS
Report for GASSNOVA SF
MANAGING RISK
Modelling air quality impacts of post-combustion amine-based CO2 capture
DNV Ref. No.: PP011013
Revision No.: 1
Date : 28 May 2012 Page 46
Figure 4.12 Case Study B: Concentration, NA and NA(aq)
Figure 4.13 Case Study B: Concentration, NS, NS(aq), A*
0,0E+00
5,0E-11
1,0E-10
1,5E-10
2,0E-10
2,5E-10
3,0E-10
3,5E-10
0 10 20 30 40
Co
nce
ntr
atio
n (
g/m
3 )
Distance from source (km)
NA
NA(aq)
0,0E+00
5,0E-12
1,0E-11
1,5E-11
2,0E-11
2,5E-11
3,0E-11
3,5E-11
4,0E-11
4,5E-11
5,0E-11
0 10 20 30 40
Co
nce
ntr
atio
n (
g/m
3)
Distance from source (km)
Astar
NS
NS(aq)

DET NORSKE VERITAS
Report for GASSNOVA SF
MANAGING RISK
Modelling air quality impacts of post-combustion amine-based CO2 capture
DNV Ref. No.: PP011013
Revision No.: 1
Date : 28 May 2012 Page 47
Case Study B. Dilution-corrected Results (relative to ground level concentration at 0km)
Figure 4.14 Case Study B: Dilution-corrected, Tracer and Amine
Figure 4.15 Case Study B: Dilution-corrected, NTP and Amine(aq)
0,0E+00
1,0E-08
2,0E-08
3,0E-08
4,0E-08
5,0E-08
6,0E-08
7,0E-08
0 10 20 30 40
Co
nce
ntr
atio
n (
g/m
3 )
Distance from source (km)
Tracer
Amine
0,0E+00
2,0E-09
4,0E-09
6,0E-09
8,0E-09
1,0E-08
1,2E-08
1,4E-08
0 10 20 30 40
Co
nce
ntr
atio
n (
g/m
3 )
Distance from source (km)
NTP
Amine(aq)
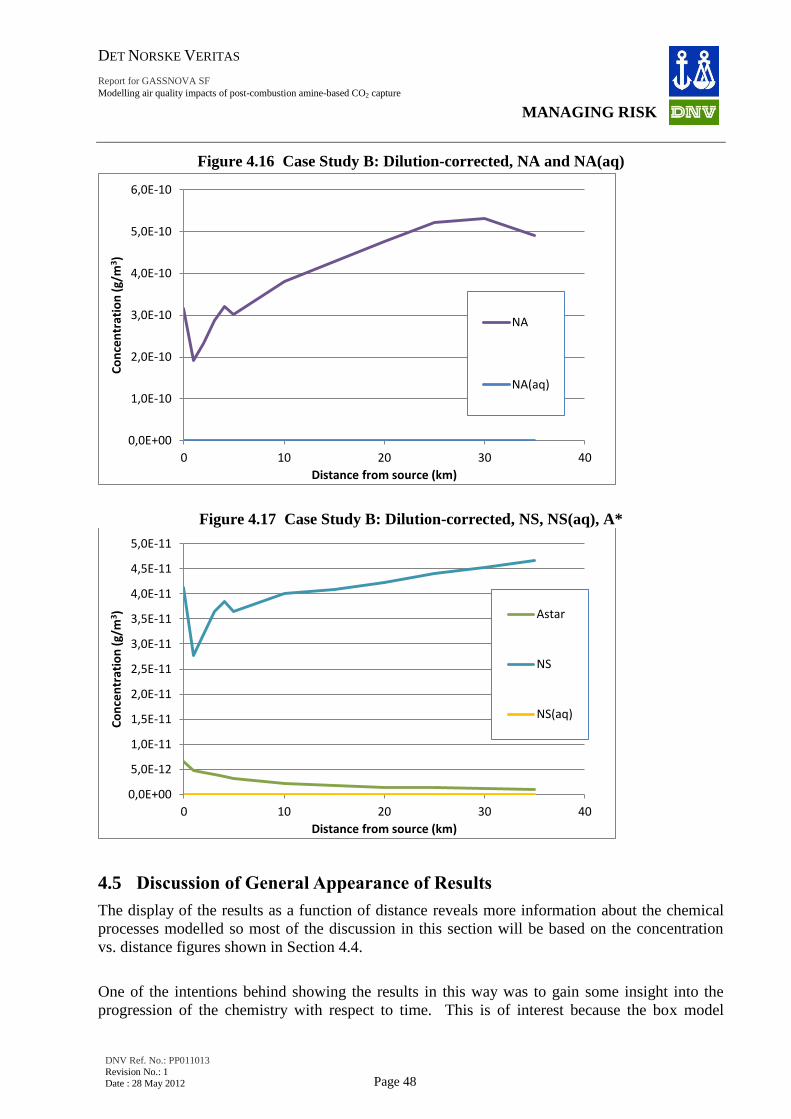
DET NORSKE VERITAS
Report for GASSNOVA SF
MANAGING RISK
Modelling air quality impacts of post-combustion amine-based CO2 capture
DNV Ref. No.: PP011013
Revision No.: 1
Date : 28 May 2012 Page 48
Figure 4.16 Case Study B: Dilution-corrected, NA and NA(aq)
Figure 4.17 Case Study B: Dilution-corrected, NS, NS(aq), A*
4.5 Discussion of General Appearance of Results
The display of the results as a function of distance reveals more information about the chemical
processes modelled so most of the discussion in this section will be based on the concentration
vs. distance figures shown in Section 4.4.
One of the intentions behind showing the results in this way was to gain some insight into the
progression of the chemistry with respect to time. This is of interest because the box model
0,0E+00
1,0E-10
2,0E-10
3,0E-10
4,0E-10
5,0E-10
6,0E-10
0 10 20 30 40
Co
nce
ntr
atio
n (
g/m
3 )
Distance from source (km)
NA
NA(aq)
0,0E+00
5,0E-12
1,0E-11
1,5E-11
2,0E-11
2,5E-11
3,0E-11
3,5E-11
4,0E-11
4,5E-11
5,0E-11
0 10 20 30 40
Co
nce
ntr
atio
n (
g/m
3)
Distance from source (km)
Astar
NS
NS(aq)

DET NORSKE VERITAS
Report for GASSNOVA SF
MANAGING RISK
Modelling air quality impacts of post-combustion amine-based CO2 capture
DNV Ref. No.: PP011013
Revision No.: 1
Date : 28 May 2012 Page 49
results are with respect to time rather than distance from a source. It is clear that because of the
dispersive forces at work, there is a correlation between time and distance from the source in
CALPUFF, although it has not been possible so far to extract data to establish how firm that
correlation is. From a physical point of view however, it is clear that it must (in general) take
longer for a species to be transported to a ground location far from the source than to one close to
it. In uniform conditions of constant wind at all vertical levels, this relationship would be one-to-
one and linear. The present results were averaged over a full year’s worth of real meteorological
data however and therefore the real relationship between distance from the source and the time
elapsed since emission is less clear. However, DNV considers that the distance from the source
is a useful surrogate for time since emission when considering the changes in the concentrations
due to chemistry.
4.5.1 General Comments on the Concentration Profile Plots
Before discussion of the detailed results it is important to first note two specific observations seen
in the plots in Section 4.4. In some of the dilution-corrected plots, the concentration curve
reduces in the far field, see for example NTP in Figure 4.7. The chemistry scheme (Figure 2.2)
cannot result in a loss of NTP by chemical reaction, so DNV conclude this must be some form of
model edge effect (the final point is at the edge of the study boundary). DNV note that the effect
is also seen slightly for the tracer species in the uncorrected concentration profiles (e.g. Figure 4.2
and Figure 4.10). The tracer does not undergo chemical transformation. It is concluded that this
effect is a native characteristic of CALPUFF and is unrelated to DNV’s new chemistry
calculations.
Some superficially odd observations are also seen in the near field profiles (e.g. Figure 4.2 and
Figure 4.10). The concentrations rise and fall as expected, then rise and fall again. DNV’s first
idea was that this was due to the relatively coarse resolution of the CALPUFF calculation grid
(500m x 500m) and the simplicity of our approach to interpolation along the profile line (Figure
4.1), but we improved the interpolation method and the observation was not materially changed.
However the observation is not always seen if the direction of the profile line (Figure 4.1) is
changed. This leads DNV to assign this observation to a combination of terrain variations and
complex meteorology data, though the coarse calculation grid could also be relevant. This
conclusion is supported by the observation that the variations appear at the same distance from
the source for all species and for each case study.
4.5.2 Concentration of Gas Phase Amine
Examining the results, the first impression gained from the way that the concentration of amine in
the gas phase decreases as a function of distance from the source (and therefore, roughly
speaking, time), is that dispersion is the dominant factor. In Figure 4.2 and Figure 4.10, it is clear
that both the tracer species (which undergoes no chemical transformations) and the gaseous
amine drop away in concentration in a very similar way, although the amine concentration
decreases faster. The difference is due to losses in amine due to the chemical transformations.
(In this report “chemical transformations” will normally include phase equilibria processes, for
the sake of brevity.)

DET NORSKE VERITAS
Report for GASSNOVA SF
MANAGING RISK
Modelling air quality impacts of post-combustion amine-based CO2 capture
DNV Ref. No.: PP011013
Revision No.: 1
Date : 28 May 2012 Page 50
Figure 4.6 and Figure 4.14, in contrast, shows an estimate of the chemical transformations alone.
This is accomplished by dividing the concentrations at each distance from the source by the
degree to which the inert tracer compound has undergone dilution. (This is why the tracer
compound is constant). Together these results show that chemical reactions are responsible for
only a small proportion of the loss of amine concentration. That is, at the low concentration of
emitted amine, the dispersion processes reduce this concentration much faster than chemical
transformation processes. This conclusion is consistent with the Phase 1 report /2/.
By comparing the total amounts of tracer compound and amine observed at all the ground level
receptors in the study area (proportional to the “average” figures in Table 4.3), enables an
estimate of the total proportion of the amine that has been consumed by chemical reactions to be
made. This figure is 22% for Case A and 25% for Case B.
It is interesting to compare this chemical loss of amine to the loss of amine in the box model
(Figure 3.2). In Figure 3.2, even after the gaseous and aqueous phases have equilibrated (after
about 0.5h), there is a much greater loss of amine due to the reactions with OH radicals and the
other chemical reactants compared to that seen in the CALPUFF calculations. This difference is
to be expected because:
In the CALPUFF calculations, the effect of dispersion has 2 effects. First it reduces the
concentration of amine by dispersion. Second it reduces the rate of loss of amine by
chemical reactions because these rates are dependent on the absolute concentration of the
amine. This means that in addition to dilution, the rate of the amine chemistry is also
slowed down and much less chemical transformation occurs.
The Case A and Case B studies shown here include a time-dependency that severely
reduces the availability of OH radicals. The night-time first order reaction rate is
calculated to be just over 1/10 of the maximum reaction rate with the sun closest to its
zenith (using reaction rates and counter species concentrations from Table 2.1).
Therefore, the incorporation of the true sun zenith angles as included in the full
CALPUFF model is very significant. A further test case (Case 0) that removes this effect
by removing the time-dependency has been run and indeed shows increased loss of amine
due to chemistry. This is reported in Appendix 1.
The first of these two factors demonstrates the necessity of modelling the dispersion and
chemistry simultaneously, as opposed to imposing a box-model derived yield factor for each
chemical pathway onto a standard dispersion model (which will always over-estimate the
concentration of NA and NS formed).
4.5.3 Concentration of Gas Phase Nitrosamine and Nitramine
In Case B, nitrosamine rises very much more slowly than nitramine and, in contrast to the box
model results, shows no apparent rise and fall shape beyond the near field. Nitrosamine is
regulated by the destruction mechanism corresponding to the reaction rate k6 and by the reduction
of the precursor concentration by dilution. A small “rise and fall” shape can be observed in the
dilution-corrected graphs if very high (unrealistic) concentrations of NO are forced into the

DET NORSKE VERITAS
Report for GASSNOVA SF
MANAGING RISK
Modelling air quality impacts of post-combustion amine-based CO2 capture
DNV Ref. No.: PP011013
Revision No.: 1
Date : 28 May 2012 Page 51
model. However for the Case B chemistry parameters the dispersion processes dominate and this
masks the rise and fall behaviour that might be expected from the chemistry equations alone.
In contrast, the chemical scheme does not allow for the destruction of NA (k14 = 0.0) and so the
concentration NA would continue to grow because of chemical transformation (whilst A and NS
is still available) in the absence of dispersion, but is actually observed to reduce because of the
dominance of dispersion processes over chemical transformation processes.
In Case A, the primary amine is allowed to undergo internal re-arrangement to imine (NTP) via
the fast step represented by k13 (see Section 2.3). The peak concentration of NS for Case A
(Figure 4.5) is therefore a factor of 75 times lower than that seen for Case B (Figure 4.13) (in
Case B k13 is set to zero because the secondary nitrosamine cannot perform this rearrangement
reaction).
4.5.4 Concentration of Aqueous Phase Amine
These observations are based on the Case A study because very little transition to the aqueous
phase is observed in Case B. The aqueous phase of amine rises sharply from zero as the phases
equilibrate (
Figure 4.3). Its concentration reaches a peak at about 2km from the source and then adopts a
shape that is very similar to the gaseous amine curve. This corresponds with expectation since it
remains in lagging equilibrium with the concentration of the gaseous phase amine from that point
onwards.
4.5.5 Concentration of Astar (A*)
Finally, Figure 4.5 and Figure 4.13 shows the calculated absolute concentration of the reactive
intermediate A*. This is observed to be higher in the near field and then reduces with distance
from the source. DNV note that a standard assumption often used by chemists to solve systems
of rate equations is to assume that the concentration of the reactive intermediate is in steady state.
Whilst this assumption is usually justified in closed systems (though even in the box model
results the concentration of A* does decay with time, see Figure 3.4), the results presented here
indicate that this is not a valid assumption for open systems where the species both disperse and
react simultaneously.
4.6 Results for Case 00
In the third case study, Case 00, the emission conditions modelled in Phase 1 of the present
project are replicated as closely as possible taking account of the many changes between Phase 1
and Phase 2. Where conflicts between Phase 1 and Phase 2 methods existed, then the newer
methods used in Phase 2 were applied to Case 00. The emission profile for this case study was a
mixture of three different amines, plus a small quantity of the nitrosamine of dimethylamine
(NDMA), as shown in the Table 4.6. MEA and its daughter species were assumed to have high
solubility in water (like in Case A), whereas MMA and DMA and their daughter species were

DET NORSKE VERITAS
Report for GASSNOVA SF
MANAGING RISK
Modelling air quality impacts of post-combustion amine-based CO2 capture
DNV Ref. No.: PP011013
Revision No.: 1
Date : 28 May 2012 Page 52
assumed to have lower solubility (like in Case B). Other input parameters were as given in Table
2.1.
Table 4.6 CHP Emission Profile for Case 00
Species Name Formula Molecular
Weight
(g/mole)
Emission
Rate (g/s)
Nitric oxide NO 30 3.72
Nitrogen dioxide NO2 46 0.62
Monoethanolamine “MEA” 61 1.64
Dimethylamine “DMA” 45 0.06
Monomethylamine “MMA” 31 0.08
Nitrosdimethylamine “NDMA” 74 0.0005
The concentrations assume an exit height of 65m, an exit velocity of 20m/s, an exit diameter of
6.52m and an exit temperature of 30oC, exactly as for Case A and Case B.
This case study was included mainly as a demonstration of the modified modelling system’s
ability to model multi-amine emission cases and for continuity with Phase 1 of the work stream.
The modified CALPUFF model can, at the moment, only calculate chemistry for one amine
system at a time. Thus the results for Case 00, which has 3 amine systems (MMA, DMA and
NDMA, MEA), were calculated separately and then combined together in a post-processing step.
This is possible because the different amine systems (amines and their degradation products) do
not interact (react together across the amine systems) at these very low concentrations.
The results for this study are presented here only in the form of the summary statistics.
Table 4.7 Summary of Results for Case 00
A
(ng/m3)
NA
(ng/m3)
NS
(ng/m3)
A(aq)
(ng/m3)
NA(aq)
(ng/m3)
NS(aq)
(ng/m3)
Case 00 Peak 64.3 0.0458 0.0188 4.35 0.00350 0.000226
Average 2.45 0.00950 0.000586 0.259 0.000928 0.00000175
Note the concentration of the aqueous species are in arbitrary units because the amount of available moisture is
unknown.
These results, along with the results for Case A and Case B, are discussed in Section 4.8.

DET NORSKE VERITAS
Report for GASSNOVA SF
MANAGING RISK
Modelling air quality impacts of post-combustion amine-based CO2 capture
DNV Ref. No.: PP011013
Revision No.: 1
Date : 28 May 2012 Page 53
4.7 Air and Drinking Quality Criteria
The primary objective of this report is to develop and demonstrate an enhanced air dispersion
model with sufficient capability to represent the diverse chemical and physical processes of
interest. Nevertheless, it is instructive to compare some of the results obtained to proposed
environmental quality criteria as this will be the ultimate application of the work performed.
Of all the primary or secondary pollutants released by the proposed process, nitrosamines and
nitramines have the strictest proposed environmental quality criteria. Thus this report will focus
only on this comparison.
The proposed environmental quality criteria are based on the Norwegian Institute of Public
Health (NIPH) recommended values. The basis for this is the evaluation study conducted by
NIPH in response to the Climate and Pollution Agency (Klif) request /8/. The NIPH study is
based on evaluation of existing risk estimates related to N-nitrosodimethlyamine (NDMA) for air
and drinking water, and included an evaluation of the EPA / IRIS risk estimates.
The NIPH evaluation has calculated the concentration of nitrosamines (NDMA) in air and water
associated with risks (to humans) in the range of 10-5
to 10-6
. This means that life-long exposure
at the indicated levels would give an excess life-long risk of cancer of either 10-5
or 10-6
. The
recommended tolerable nitrosamine concentrations are summarised in Table 4.8. As limited
information is available on the health effects of nitramines, NIPH has suggested that the risk
estimate for NDMA is also used for exposure to nitramines. This may be conservative as NDMA
is likely to be more potent than any of the nitramines.
DNV understands that these values correspond to a long term annual criterion. The emphasis for
this study is the long term results given that the criteria refer to the life-time risk of cancer.
DNV also understands that results from other studies currently on-going are utilised in order to
help establish environmental quality criteria relevant for environmental studies. These values are
considered as guidelines and criteria have not yet been officially set by Klif.
Table 4.8: NIPH recommended tolerable drinking water and air quality criteria
Pollutant Drinking Water Quality
1 Air Quality
1
Long Term (Annual) (ng/l) Long Term (Annual) (ng/m3)
Nitrosamines/Nitramines 40 2 / 4
3 0.3
4
Notes:
1 The cumulative nitrosamine and nitramine concentration (in air or drinking water) should be judged against the
recommended criteria.
2 Corresponds to a life-long risk of cancer level of 10-5
.
3 Corresponds to a life-long risk of cancer level of 10-6
.
4 Corresponds to a life-long risk of cancer level below 10-5
.

DET NORSKE VERITAS
Report for GASSNOVA SF
MANAGING RISK
Modelling air quality impacts of post-combustion amine-based CO2 capture
DNV Ref. No.: PP011013
Revision No.: 1
Date : 28 May 2012 Page 54
4.8 Comparison of Pollutant Concentrations to Air Quality Criteria
The peak ground level annual average concentrations observed within the study area for Case A,
Case B and Case 00 are shown in Table 4.9. Also shown is the peak of the sum of NS and NA in
both the gas phase and the aqueous phase. It is not clear if NA and NS in the (micro) aqueous
phase should contribute against the air quality criteria shown in Section 4.7, but since the aqueous
phase is inhalable DNV assume that it should (the responsible authority should clarify this point).
It should be noted that, in general, the peak values for the individual species do not occur at the
same location, thus “sum of the peaks” is greater than the “peak of the sums”.
Table 4.9 also compares the “peak of the sums” (the maximum combined concentration of NS
and NA in the gaseous and the aqueous phase at any location) to the air quality criteria described
in Section 4.7.
Table 4.9: Summary Statistics for Nitramine and Nitrosamine over Study Area
Case study Peak Gas Phase
Nitramine
(ng/m3)
Peak Gas Phase
Nitrosamine
(ng/m3)
Peak Aqueous
Phase
Nitramine
(ng/m3
equivalent)
Peak Gas
Aqueous
Nitrosamine
(ng/m3
equivalent)
Case A 0.0374 0.000749 0.00316 0.0000489
Case A peak of summed values 0.0413
Peak of summed values relative
to 0.3ng/m3
14%
Case B 0.426 0.0606 0.0000322 0.00000417
Case B peak of summed values 0.486
Peak of summed values relative
to 0.3ng/m3
162%
Case 00 0.0458 0.0188 0.00350 0.000226
Case 00 peak of summed values 0.0632
Peak of summed values relative
to 0.3ng/m3
21%
Note: “Peak” refers to the greatest modelled concentration observed across the receptor locations.
Comparing Case A and Case B, the high molecular weight of the heavy secondary amine, the
greater chemical stability of the secondary nitrosamine (k13 = 0s-1
) and the faster reaction rate
(kOH) have all resulted in a much greater burden of potentially harmful compounds in mass terms
for Case B.
Furthermore, the high transfer of amine from the gaseous to aqueous phase in Case A has allowed
the amine to be “hidden” from the chemistry that produces the potentially harmful compounds
DET NORSKE VERITAS
Report for GASSNOVA SF
MANAGING RISK
Modelling air quality impacts of post-combustion amine-based CO2 capture
DNV Ref. No.: PP011013
Revision No.: 1
Date : 28 May 2012 Page 55
until such time as dispersion has taken effect, as expected. Therefore lower concentrations of
nitramine and nitrosamine are seen in Case A, relative to Case B.
The concentration of the harmful species generally decreases as a function of distance from the
source (Figure 4.4, for example). This is due to the overwhelming effect of dilution, as can be
seen by comparing Figure 4.4 to Figure 4.8 in which steady chemical production is seen for
nitramine, whereas growth of nitrosamine is limited by chemical instability (k13 > 0s-1
) in Case A
as seen in Figure 4.9, consistent with the input parameters chosen for these case studies.
The significance of the absolute values of these concentrations of harmful compounds will be
discussed in the conclusion of the present report.
4.9 Discussion of Conservatism in the Case Studies
The calculations reported as Case A, Case B and Case 00 all retain elements of conservatism
within them, as noted here:
The literature states that NOx reacts preferentially with OH. and in so doing could limit
the availability of OH. in the near field of the emission plume where the NOx
concentration is highest and where most amine transformation chemistry occurs. This
effect is not included in the current version of the modified CALPUFF model.
Similarly, the presence of Volatile Organic Compounds (VOCs) will also compete for
OH. and hence reduce the concentration of OH
. available to react with amine. Since
VOCs are present in the natural background, this effect may already be included in the
measurements of OH. concentration observed at Mongstad.
As noted in Section 2.3, the modified model does not reduce the concentrations of counter
species due to chemical reaction.
The branching ratios and initiating rate constants (k1, k10, k11, k12)assumed in the case
studies are all set to conservatively compared to literature values.
Oxidation processes which might destroy NA and NS are not represented in the modified
model.
Case B does not allow any significant equilibration to the aqueous phase, which is
probably conservative as most amines are soluble in water.
All the above factors will result in over-prediction of the concentration of NS and NA formed
4.10 Application to Real Systems
The modified CALPUFF model developed by DNV and described above can evaluate the ground
level concentrations of amines and amine degradation products for any one emitted amine plus
degradation products (provided that the chemistry can be represented by Figure 2.2). If the
chemistry differs from the scheme shown in Figure 2.2, DNV considers that a modification of the

DET NORSKE VERITAS
Report for GASSNOVA SF
MANAGING RISK
Modelling air quality impacts of post-combustion amine-based CO2 capture
DNV Ref. No.: PP011013
Revision No.: 1
Date : 28 May 2012 Page 56
DE system representing the scheme is probably a relatively simple matter thanks to the very
general method that has been used in this implementation.
If multiple amines need to be assessed, and assuming the reactions schemes for different amines
do not interact together, there are two choices:
CALPUFF could be further modified to be able to accept variables for multiple amines.
This is, essentially, a code administrative task that will expand the number of variables
that CALPUFF can handle at any one time.
The present version of CALPUFF can be run multiple times to evaluate each amine in
turn. This was the option used in Section 4.6 above.
If the chemistry schemes for the different amines do interact with each other, then the work
required may be more complicated, but should not be insurmountable.
5 CONCLUSIONS
A general amine chemistry capability has been successfully added to the CALPUFF atmospheric
dispersion modelling system. It performs chemical reactions according to the general scheme
shown below.
Figure 5.1 The generalised amine chemistry scheme incorporated into CALPUFF
A A*
NA
NTP
NSA a
NA a
NS a
Mass transfer between gas and aqueous phase
Chemical reaction
All species are in the gas phase unless stated as aqueous (a)
k1 OH.
k10 NO3.
k11 OH.
k12 NO3.
kA1
kA2 k2 NO
k3 NO2
k4 NO2k5 O2
kA3
kA4
kA5
kA6k14
k13
k6 hv

DET NORSKE VERITAS
Report for GASSNOVA SF
MANAGING RISK
Modelling air quality impacts of post-combustion amine-based CO2 capture
DNV Ref. No.: PP011013
Revision No.: 1
Date : 28 May 2012 Page 57
All reaction rates shown in this scheme are editable by the user as are the constants used in the
calculation of counter species concentrations. Modifications to the way in which those
calculations are made are probably relatively easy to make given knowledge of the CALPUFF
code architecture. In particular, a link to the CALPUFF-generated OH-radical concentration
could be restored easily if required.
The concentrations of the species in the scheme are determined by the solution of a system of
ordinary differential equations with known initial conditions. This initial value problem is solved
by a numerical technique known as the Rosenbrock method, a standard technique in numerical
analysis that has been shown to be suitable for “stiff” problems of this type. The required
accuracy for each invocation of the DE solver can be set by the user.
The behaviour of the implemented gas phase amine chemistry in the updated CALPUFF model is
robust (no problems have yet been observed). The chemistry module added to CALPUFF has
been extensively tested by comparison with a box model developed in MathCad using various
competing numerical methods and exact solutions for certain special cases and no problems have
been observed in the results obtained.
The box model, and therefore the model as appended to CALPUFF, behaves as expected with
respect to all input parameters, be they counter-species concentrations, emission rates or reaction
rate constants. Evidence has been provided in the present document showing that the model
meets expectations in the general characteristics of its output.
All these factors, together with the expected emission rates can now be altered quickly and easily
by the user, so this modelling system can be used efficiently to model cases in which altered
assumptions are made. This was the main objective of this work and this has been achieved.
Three main case studies were run and the results presented in this report. Two of the case study
results (A and 00) are about a factor of 5 lower than the air quality criterion used (that is, they are
compliant). However Case B (the worst case) exceeded the air quality criterion by 60% (ratio of
predicted concentration to criterion of 1.6). All these case studies continue to include
conservatism in a number of parameters and modelling assumptions as discussed in the main
report.
Uncertainties surrounding the solubility and rate of phase transfer for amines, nitramines and
nitrosamines remain particularly important as the difference between the results for the Case A
and Case B indicate.
DET NORSKE VERITAS
Report for GASSNOVA SF
MANAGING RISK
Modelling air quality impacts of post-combustion amine-based CO2 capture
DNV Ref. No.: PP011013
Revision No.: 1
Date : 28 May 2012 Page 58
6 REFERENCES, ACRONYMS AND ABBREVIATIONS
6.1 References
/1/
DNV Call-Off 01, “Modelling for Atmospheric Dispersion of Components from post-
combustion amine-based CO2 capture”, 5th
October 2010.
/2/ DNV Call-Off 02, Phase 1 Report, “Atmospheric Chemistry Modelling of Components
from post-combustion amine-based CO2 capture”, 5th October 2011.
/3/ DNV Call-Off 02, Deposition Report. “Deposition and Soil Transport Modelling of
Components from post-combustion amine-based CO2 capture”, 22 August 2011.
/4/ Tel-Tek Report Number 2211030-NP05 v2, “Atmospheric Chemistry – Nitrosamine
Photolysis”, 28.10.2011.
/5/ Tel-Tek Report Number 2211030-DC06 v2, “Atmospheric Chemistry – Dark
Chemistry”, 01.11.2011.
/6/ Tel-Tek Report Number 2211030-DC01 v2, “Specification of Atmospheric Dark
Conditions”, 16.09.2011.
/7/ Norwegian Institute for Air Research, “Atmospheric Degradation of Amines”, CLIMIT
project no. 201604, OR 2/2011.
/8/ Norwegian Institute of Public Health (NIPH) Health effects of amines and derivatives
associated with CO2 capture: Nitrosamines and nitramines.
6.2 Acronyms and Abbreviations
3D 3-Dimension(al)
A Amine
CCM CO2 Capture Mongstad
DE Differential Equation
DMA Dimethylamine
DNV Det Norske Veritas Limited
IVP Initial Value Problem
LAM Local Area Model
MEA Monoethanolamine
MMA Monomethylamine
NA Nitramine
NDMA N-nitrosodimethlyamine
NILU Norwegian Institute for Air Research
NIPH Norwegian Institute of Public Health
NS Nitrosamine
NTP Non-Toxic products (mainly imine initially)
ODE Ordinary Differential Equation
VOC Volatile Organic Compound
- o0o -

Det Norske Veritas:
Det Norske Veritas (DNV) is a leading, independent provider of services for managing risk with a global presence and a network of 300 offices in 100 different countries. DNV’s objective is to safeguard life, property and the environment. DNV assists its customers in managing risk by providing three categories of service: classification, certification and consultancy. Since establishment as an independent foundation in 1864, DNV has become an internationally recognised provider of technical and managerial consultancy services and one of the world’s leading classification societies. This means continuously developing new approaches to health, safety, quality and environmental management, so businesses can run smoothly in a world full of surprises.
Global impact for a safe and sustainable future:
Learn more on www.dnv.com