Embed Size (px)
Citation preview
Atmospheric Dispersion Modelling Assessment of a Proposed Plastic Pyrolysis Plant Near Chelveston
Dallol Energy Limited
Report Issue No: 2 Report Date: January 2018
Report Author: Amanda Owen
Dispersion Modelling Assessment – Dallol; Chelveston
Environmental Visage Ltd i
Executive Summary
Environmental Visage Limited (Envisage) was commissioned to prepare an atmospheric dispersion modelling assessment for a proposed plastic pyrolysis plant to be located near Chelveston in East Northamptonshire. The purpose of the model is to consider the likely potential impact of the proposed operations on local air quality, including an assessment of the potential impacts on sensitive ecological receptors in the local area, and to inform a human health impact assessment. As agreed between the development team and the Environment Agency, the assessment has been based on the pollutant emission levels specified by the Industrial Emissions Directive (IED) for waste incineration processes (the relevant Regulations), and includes consideration of NOx, SO2, CO, Particulates, VOCs, HCl, HF, Cadmium, Mercury, Heavy (Group 3) Metals, and Dioxins and Furans. The required height of the site chimney was first indicated using a D1 (stack height) calculation and iterative modelling, using the Atmospheric Dispersion Modelling System (ADMS) Version 5.2 model, was then used to confirm the final most appropriate stack height. Further modelling at the chosen stack height then provided detailed results for assessment against the relevant time averaging periods consistent with Air Quality Standard (AQS) values and other Environmental Assessment Levels (EALs) recommended by the Environment Agency, collectively referred to as Environmental Quality Standards (EQS). The detailed assessment also considered the impact of emissions on local designated ecological habitats within 10 km of the development site, with reference made to critical levels specified by the Environment Agency, and site-specific critical loads specified on the APIS website.
This report presents the results of the atmospheric dispersion modelling study to assess the potential impacts on air quality and deposition from the proposed process, and concludes that these can largely be screened as insignificant. The emissions data applied are in line with proposals from a credible technology provider, which has confirmed that the engines can meet the proposed discharge rate releases proposed, using available technologies. The results of the modelling exercise have demonstrated that the Process Contribution of all pollutants, and the Predicted Environmental Concentrations of the pollutants across the area, remain within the Air Quality Standards or Environmental Assessment Levels. Not all Process Contributions can immediately be screened as insignificant, however the Predicted Environmental Concentration of all species remain within 70 % of the Standards, and are therefore screened at the secondary stage. When considering the potential impact on sensitive ecological receptors, Process Contributions of NOx, and SO2 cannot automatically be screened as insignificant at some of the local woodland receptors. However, as none of the affected sites are designated sites and as the Process Contributions remain within 100 % of the relevant environmental standard, the impacts are screened as insignificant. Contributions to the Critical Loads specified for the Yelden Meadow SSSI site are less than 1 % of the minimum nutrient Nitrogen and acid deposition Critical Loads and hence are screened as insignificant.
Dispersion Modelling Assessment – Dallol; Chelveston
Environmental Visage Ltd ii
Contents
Executive Summary ............................................................................................................. i Contents .............................................................................................................................. ii 1. Introduction.................................................................................................................. 1 2. Principal Objectives and Scope of Work ..................................................................... 1 3. Preliminary Chimney Height Assessment ................................................................... 2 Table 1 Variation in the Maximum Annual Average and Hourly Average NO2 Process Contributions with Increasing Chimney Height .................................................................. 4 Figure 2 Variation in the Maximum Annual Average and Hourly Average NOx Process Contributions with Increasing Chimney Height .................................................................. 5 4 Detailed Air Quality Modelling ..................................................................................... 5 4.1 Emission Parameters .............................................................................................. 5 Table 2 Emission Point Parameters - Dallol Energy; Chelveston ................................. 5 Table 3 Modelled Emissions to Atmosphere - Dallol Energy; Chelveston ................... 6 NOx or NO2 ......................................................................................................................... 6 Deposition Factors ............................................................................................................. 7 Table 4 Recommended Deposition Factors .................................................................. 7 Pollutant Combinations ...................................................................................................... 7 4.2 Background ............................................................................................................. 8 Table 5 Background Pollutant Concentrations Applied in the Chelveston Study ......... 9 4.3 Nearby Buildings and Structures ............................................................................. 9 Table 6 Details of the Building Data for Dallol Energy; Chelveston ............................. 9 4.4 Meteorological Data ............................................................................................... 10 4.5 Surface Roughness ............................................................................................... 10 4.6 Terrain Data ........................................................................................................... 10 4.7 Model Output Parameters ..................................................................................... 10 Table 7 Sensitive Receptors Modelled in the Dallol Energy; Cheveston Study .......... 11 Table 8 UK Air Quality Limits, Targets and Objectives for Modelled Pollutants ........ 12 Table 9 Relevant Assessment Levels for Other Modelled Pollutants ......................... 13 4.8 Additional Model Considerations ........................................................................... 13 Table 10 Short Term Modelled Emissions to Atmosphere - Dallol Energy; Chelveston ……………………………………………………………………………………….13 4.9 Modelling Assumptions.......................................................................................... 14 5. Results and Discussion ............................................................................................. 14 6. Conclusions ............................................................................................................... 17 7. References ................................................................................................................ 18
APPENDIX A MODELLING RESULTS TABLES FIGURES APPENDIX B D1 SUMMARY SHEETS
Dispersion Modelling Assessment – Dallol; Chelveston
Environmental Visage Ltd 1
1. Introduction Dallol Energy Limited are proposing to develop a waste plastic pyrolysis plant to be located close to Chelveston in East Northamptonshire. The site will receive non-recyclable plastic (including waste polystyrene, polyethylene and polypropylene) which will be unloaded for storage in a warehouse before processing. Processing will include the densification of the plastic wastes, before heating in a reduced Oxygen environment and in the presence of a Bauxite catalyst in order to depolymerise the waste into hydrocarbon gases ranging from Liquid Petroleum Gas (LPG) to heavy wax. The majority of the gases produced are in the liquid fuel range (petrol and diesel), and are separated into their individual components in a fractionation column. The cyclone combustor providing heat to the process uses LPG for start-up after which a mixture of LPG and non-condensable gases provide fuel for the burner. Hot combustion gases flowing from the combustor at over 1,100 oC are mixed with recycled flue gas and enter the interstitial spaces between the catalytic reactor and outer cylinder at 900 oC in order to heat the waste plastics. Hot vapour ducts remove the gaseous hydrocarbons produced in the depolymerisation reaction to a scrubber, where they are cooled and washed free of particulates by the reflux diesel stream. Solid particles, dust (including any residual metal dust) and heavier oils and waxes are removed by the reflux diesel stream and fall back into the catalytic reactor to undergo further depolymerisation. A number of individual process kilns will discharge to air from the proposed facility, and the cyclone combustor will also include a release to atmosphere. However, these points will all discharge through a common chimney for emissions monitoring and control, with the incorporation of a blower fan to ensure that the exhaust velocity is constant no matter how many kilns are connected. Hence, the flow rate from the discharge will remain essentially constant, and as a worst-case scenario, the discharge is assumed to release at the emission limit concentrations specified in the Industrial Emissions Directive (IED). Where one or more kilns are not operational, the measured concentration in the flue will reduce, as the addition of fresh air to maintain the exhaust flow will essentially reduce the concentration of the pollutants. There are not thought to be any other significant releases to atmosphere which may impact on the discharges from the process. This report details the modelling work undertaken, and presents the findings of the study.
2. Principal Objectives and Scope of Work The principal aim of the work undertaken was to determine the nature of the dispersion of air borne pollutants from a proposed plastic pyrolysis plant neat Chelveston, in order to predict the environmental impact of the development on the surrounding area. The process will include a single release point to atmosphere through which a number of processing kilns and a cyclone combustor will discharge. The study details the likely impact of discharges to atmosphere from the site, when considering both human health and ecological receptors, and demonstrates an acceptable level of potential impact on the closest designated sites. The local area includes a number of sensitive receptors including the Upper Nene Valley Gravel Pits Ramsar site, Special Protection Area (SPA), and Site of Special Scientific Interest (SSSI), as well as the Yelden Meadow SSSI, ancient woodlands, workplaces and residential properties. As such, the impact of the proposed operations must be sufficiently small to ensure the continued protection of human health, and the protection of sensitive ecological sites. The Yelden Meadow SSSI is a sensitive ecological grassland and as such has been designated stringent Critical Loads for its protection. A Critical Load is defined as "a quantitative estimate of exposure to one or more pollutants below which significant harmful effects on specified sensitive elements of the environment do not occur according to present knowledge"(1). As a sensitive geological site, the European designated Upper Nene Valley Gravel Pits are not assigned Critical Loads for air pollution.
Dispersion Modelling Assessment – Dallol; Chelveston
Environmental Visage Ltd 2
It is recognised that there will always be a level of emission from an installation which is so small that the resultant impact would constitute an ‘inconsequential effect’, and this is deemed to be 1% of the long-term Critical Level or Critical Load, or 10 % of any short-term level. Hence, in order to present a precautionary approach to the consideration of impacts on the Yelden Meadow, the ability of the discharges from the installation to result in an inconsequential effect, is considered. The only definitive means of quantifying the impact of process emissions on air quality and the surrounding area is to undertake a comprehensive programme of environmental monitoring around the site in question. As an alternative, atmospheric dispersion modelling provides a means of estimating the potential impacts of emissions with a reasonable degree of confidence, by modelling the dispersion of a plume or plumes exiting a chimney in relation to a number of key parameters. This enables the calculation of an estimated contribution to ground level pollutant concentrations arising from the releases, prior to the development of new, or modification of existing plant. For the purpose of this study, the latest version of the UK Atmospheric Dispersion Modelling System was used (ADMS 5.2). The ADMS model is one of the leading atmospheric dispersion models available in the UK and can be used to assess ambient pollutant concentrations from a wide variety of emissions sources associated with an industrial installation.
3. Preliminary Chimney Height Assessment Initial details of the release characteristics to be considered were supplied by Integrated Green Energy Solutions Limited, and were applied to the emission limit values specified by the IED - Annex VI (Technical provisions relating to waste incineration plants and waste co-incineration plants) of the Industrial Emissions Directive (Directive 2010/75/EU of the European Parliament and of the Council of 24 November 2010 on Industrial Emissions (Integrated Pollution Prevention and Control) (Recast)), which provides the current regulatory standard for gasification and incineration plants. It is recognised here that the Best Available Techniques (BAT) guidance note for waste incineration plant (WI BREF) is currently in the process of review, and when issued, will essentially specify new binding requirements for site emissions, which will likely be more stringent than currently. However, as agreed in pre-application discussions with the Environment Agency, the emission limit values specified in the IED, as supported by the current WI BREF, are applied to this study. Within the IED, emission limit values are specified for both incineration and co-incineration processes, with co-incineration discharges being calculated from a combination of fuel and waste emissions. However, the Dallol Energy Limited scheme will use LPG from the waste process as the fuel for the cyclone combustor, and this by-product of the process will remain a fuel until it is burned. As such, the IED mixing formula which combines emission limit values for waste incineration plants (the waste emissions) with emissions from the normally authorised fuels (wastes excluded), reduces back to the emission limit values for waste. Hence, within this study, the emission limits and thus discharges applied are assumed to be the waste incineration emission limit values. Modelling a proposed site which is not yet built and operational enables full consideration to be given to the potential for dispersion, and thus enables the design of the chimney structure and process equipment to take the results of the modelling work into account. It does however also mean that all of the input data is calculated rather than being drawn from actual measured values, and some additional assumptions may also have to be made.
Dispersion Modelling Assessment – Dallol; Chelveston
Environmental Visage Ltd 3
The study began by assessing the required height of the site chimney using the D1(2) (stack height) calculation methodology. The chimney serving the plastic pyrolysis plant kilns and the cyclone combustor will be designed to provide effective dispersion of the emissions generated from the processes. The D1 guidance was followed initially to calculate the height of the chimney required to provide effective dispersion, and was based upon the anticipated flue-gas volumetric flowrate and the maximum emission limit values specified for regulation by the Industrial Emissions Directive. Reference was also made to estimates of background air quality data typical of the locality, obtained from the DEFRA 2013 Background Maps website(3). The D1 guidance defines the basis of the method for calculating chimney height as follows: The calculation method assumes that the discharge stack height is governed by the need to limit local ground level pollutant concentrations below a maximum level that might occur for short periods. Local ground level pollutant concentrations are controlled by the Air Quality Standards (AQS). The reference to “local” is defined as the region within a distance of about one hundred stack heights (or approximately 3.5 km in the case of the plastic pyrolysis plant chimney) where occasional contributions of a pollution source to short term pollution levels can be large. The target period is 15 - 30 minutes, but a range of between about 5 minutes and an hours’ duration is acceptable. The presumption of the D1 assessment is that human health effects are the major consideration. The assessment was run twice, considering Nitrogen Dioxide (NO2) as 100 % of the Oxides of Nitrogen (NOx) discharge value, and NO2 as 50 % of the NOx value. The results from the D1 calculation indicated that a chimney height of between 25 and 29 metres (m) was required to ensure effective dispersion of emissions from the process, depending on whether NOx was considered to comprise 50 % NO2 with the remainder comprising Nitric Oxide (NO), or 100 % NO2. The D1 calculation procedure is a screening technique, and makes the following statement with regard to accuracy: It lays out a relatively simple, non-specific method of approximately determining the heights of discharge stacks for polluting emissions, which should be adequate in normal circumstances. Accordingly, the chimney height predicted by the D1 calculation procedure should be taken as indicative of the height required to ensure effective dispersion of pollutant emissions from the process. A copy of the D1 calculation printouts are appended to this document. To provide a more reliable estimate of the required chimney height for the Dallol Energy Limited site, an iterative chimney height assessment was then undertaken, based upon the results of the D1 calculations and applying atmospheric dispersion modelling using the ADMS Version 5.2 tool. Modelling was undertaken to assess the impact of emissions of NOx from the process, and the results are summarised in the following table and figure. The model applied meteorological data from 2008, and both the maximum annual average Process Contributions (PC) reported across the modelled grid, and the maximum relevant hourly average Process Contributions (99.79th percentile value when comparing against the AQS) are presented over page for each modelled stack height. Oxides of Nitrogen have been assumed to comprise 100 % Nitrogen Dioxide for the long-term Process Contribution in the table over page, and 50 % NO2 for the short-term Process Contribution.
Dispersion Modelling Assessment – Dallol; Chelveston
Environmental Visage Ltd 4
Although the results of the D1 calculations suggested a chimney height of 25 – 29 m, depending on the inputs, the reduction in process contributions with increasing stack height appear to be relatively steady across the modelled discharge heights. The results from the iterative chimney height assessment for the process stack indicate that reductions in the Process Contributions of NO2 continue with increasing stack height, although the rate of the reduction slows beyond a 35 m discharge point. The maximum Process Contributions occur at between approximately 155 m to the south, south west, and 216 m to the north, north east of the stack location, for the short-term and long-term averaging periods respectively. These locations are likely to be just outside of the site boundary.
Table 1 Variation in the Maximum Annual Average and Hourly Average NO2 Process Contributions with Increasing Chimney
Height
Chimney Height (m)
Annual Average PC
(µg m-3)
Maximum Annual Average PC as a
Percentage of AQS
Maximum Hourly Average PC
(µg m-3)
Maximum Hourly Average PC as a
Percentage of AQS
21 26.16 65 % 61.43 31 %
22 19.68 49 % 57.62 29 %
23 16.03 40 % 52.90 26 %
24 15.18 38 % 48.38 24 %
25 14.32 36 % 44.13 22 %
26 13.42 34 % 39.65 20 %
27 12.51 31 % 37.06 19 %
28 11.58 29 % 34.78 17 %
29 10.63 27 % 32.23 16 %
30 9.65 24 % 30.28 15 %
31 8.68 22 % 28.70 14 %
32 7.69 19 % 25.35 13 %
33 6.76 17 % 23.96 12 %
34 6.24 16 % 22.40 11 %
35 5.71 14 % 20.52 10 %
36 5.18 13 % 18.95 9 %
38 4.65 12 % 17.91 9 %
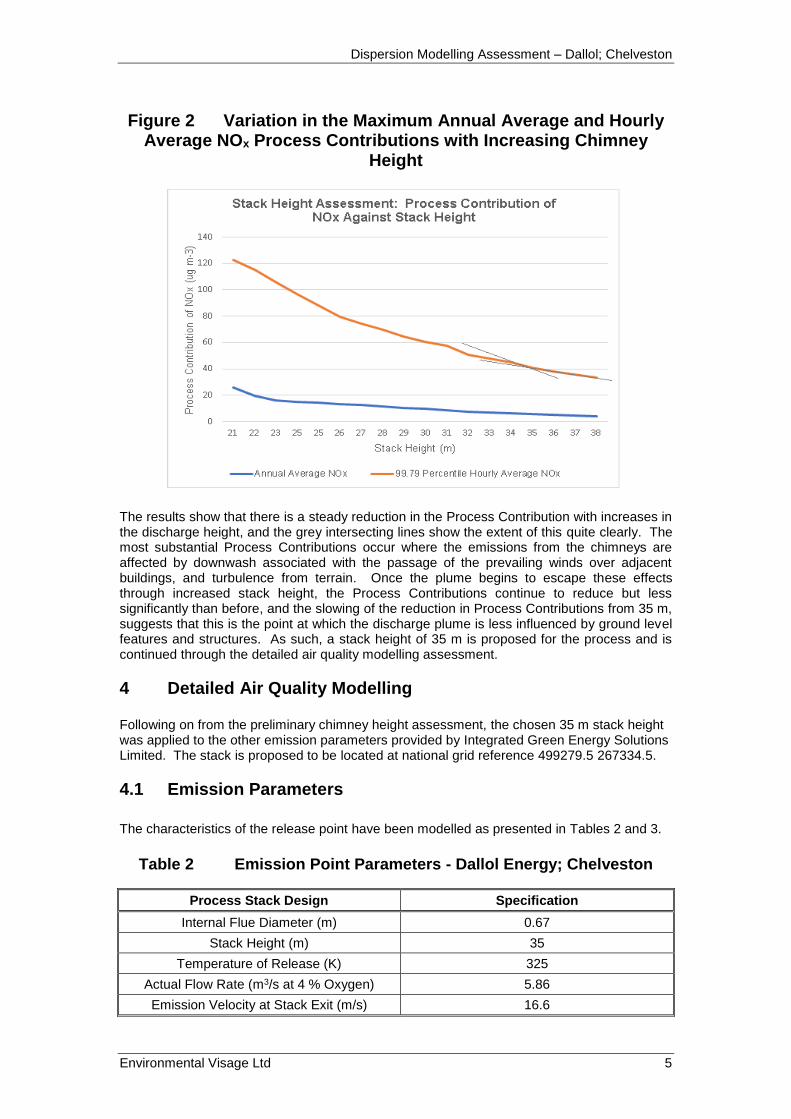
When the above results are plotted, the following trends are observed for the annual average and hourly average NOx Process Contributions.
Dispersion Modelling Assessment – Dallol; Chelveston
Environmental Visage Ltd 5
Figure 2 Variation in the Maximum Annual Average and Hourly Average NOx Process Contributions with Increasing Chimney
Height
The results show that there is a steady reduction in the Process Contribution with increases in the discharge height, and the grey intersecting lines show the extent of this quite clearly. The most substantial Process Contributions occur where the emissions from the chimneys are affected by downwash associated with the passage of the prevailing winds over adjacent buildings, and turbulence from terrain. Once the plume begins to escape these effects through increased stack height, the Process Contributions continue to reduce but less significantly than before, and the slowing of the reduction in Process Contributions from 35 m, suggests that this is the point at which the discharge plume is less influenced by ground level features and structures. As such, a stack height of 35 m is proposed for the process and is continued through the detailed air quality modelling assessment.
4 Detailed Air Quality Modelling Following on from the preliminary chimney height assessment, the chosen 35 m stack height was applied to the other emission parameters provided by Integrated Green Energy Solutions Limited. The stack is proposed to be located at national grid reference 499279.5 267334.5.
4.1 Emission Parameters
The characteristics of the release point have been modelled as presented in Tables 2 and 3.
Table 2 Emission Point Parameters - Dallol Energy; Chelveston
Process Stack Design Specification
Internal Flue Diameter (m) 0.67
Stack Height (m) 35
Temperature of Release (K) 325
Actual Flow Rate (m3/s at 4 % Oxygen) 5.86
Emission Velocity at Stack Exit (m/s) 16.6
Dispersion Modelling Assessment – Dallol; Chelveston
Environmental Visage Ltd 6
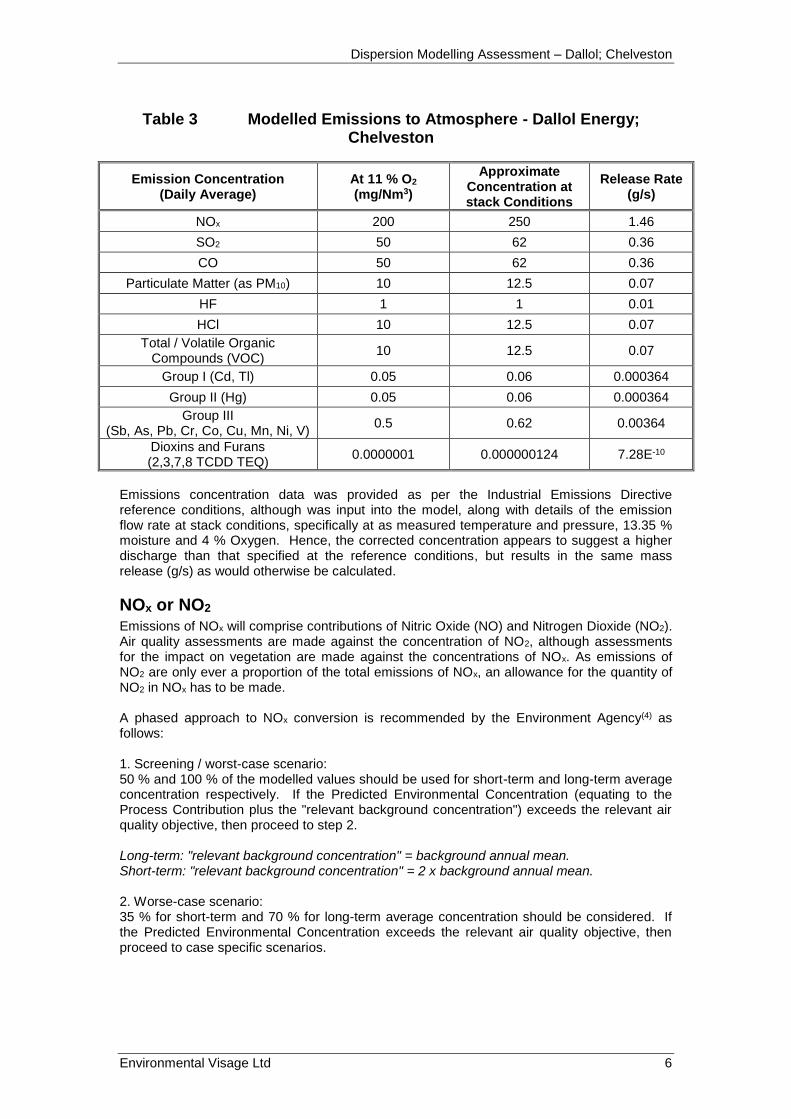
Table 3 Modelled Emissions to Atmosphere - Dallol Energy; Chelveston
Emission Concentration (Daily Average)
At 11 % O2 (mg/Nm3)
Approximate Concentration at stack Conditions
Release Rate (g/s)
NOx 200 250 1.46
SO2 50 62 0.36
CO 50 62 0.36
Particulate Matter (as PM10) 10 12.5 0.07
HF 1 1 0.01
HCl 10 12.5 0.07
Total / Volatile Organic Compounds (VOC)
10 12.5 0.07
Group I (Cd, Tl) 0.05 0.06 0.000364
Group II (Hg) 0.05 0.06 0.000364
Group III (Sb, As, Pb, Cr, Co, Cu, Mn, Ni, V)
0.5 0.62 0.00364
Dioxins and Furans (2,3,7,8 TCDD TEQ)
0.0000001 0.000000124 7.28E-10
Emissions concentration data was provided as per the Industrial Emissions Directive reference conditions, although was input into the model, along with details of the emission flow rate at stack conditions, specifically at as measured temperature and pressure, 13.35 % moisture and 4 % Oxygen. Hence, the corrected concentration appears to suggest a higher discharge than that specified at the reference conditions, but results in the same mass release (g/s) as would otherwise be calculated.
NOx or NO2 Emissions of NOx will comprise contributions of Nitric Oxide (NO) and Nitrogen Dioxide (NO2). Air quality assessments are made against the concentration of NO2, although assessments for the impact on vegetation are made against the concentrations of NOx. As emissions of NO2 are only ever a proportion of the total emissions of NOx, an allowance for the quantity of NO2 in NOx has to be made. A phased approach to NOx conversion is recommended by the Environment Agency(4) as follows: 1. Screening / worst-case scenario: 50 % and 100 % of the modelled values should be used for short-term and long-term average concentration respectively. If the Predicted Environmental Concentration (equating to the Process Contribution plus the "relevant background concentration") exceeds the relevant air quality objective, then proceed to step 2. Long-term: "relevant background concentration" = background annual mean. Short-term: "relevant background concentration" = 2 x background annual mean. 2. Worse-case scenario: 35 % for short-term and 70 % for long-term average concentration should be considered. If the Predicted Environmental Concentration exceeds the relevant air quality objective, then proceed to case specific scenarios.
Dispersion Modelling Assessment – Dallol; Chelveston
Environmental Visage Ltd 7
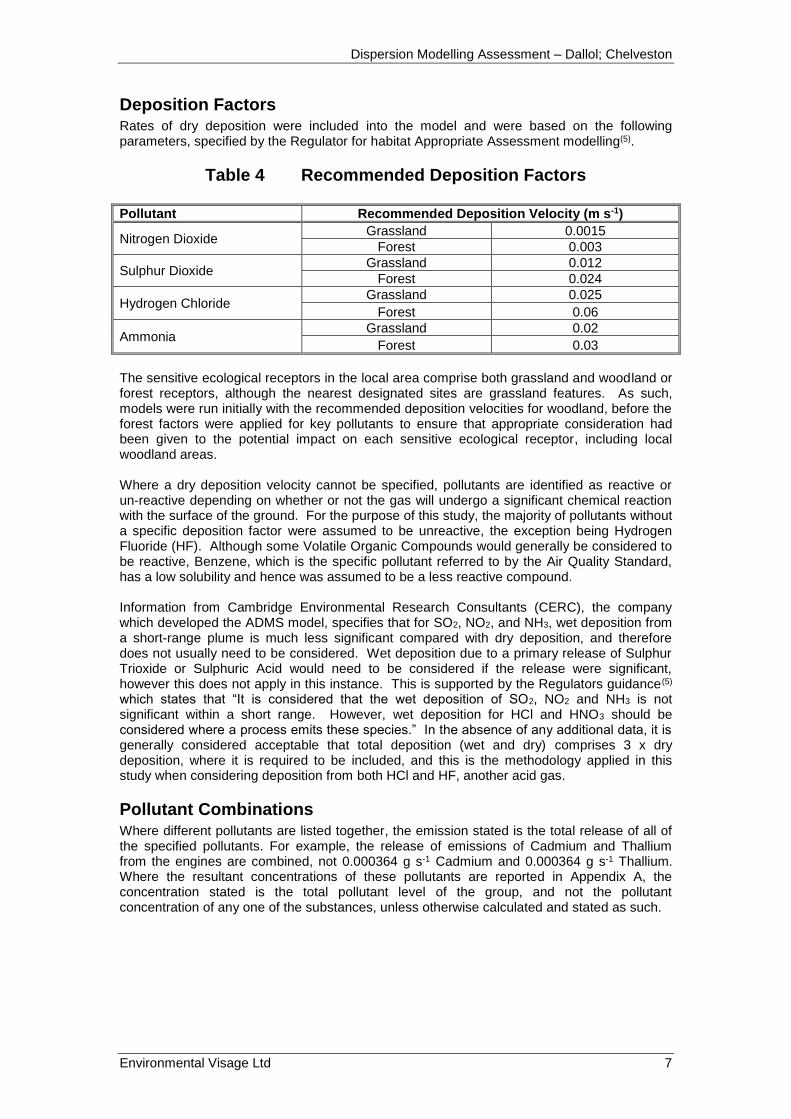
Deposition Factors Rates of dry deposition were included into the model and were based on the following parameters, specified by the Regulator for habitat Appropriate Assessment modelling(5).
Table 4 Recommended Deposition Factors
Pollutant Recommended Deposition Velocity (m s-1)
Nitrogen Dioxide Grassland 0.0015
Forest 0.003
Sulphur Dioxide Grassland 0.012
Forest 0.024
Hydrogen Chloride Grassland 0.025
Forest 0.06
Ammonia Grassland 0.02
Forest 0.03
The sensitive ecological receptors in the local area comprise both grassland and woodland or forest receptors, although the nearest designated sites are grassland features. As such, models were run initially with the recommended deposition velocities for woodland, before the forest factors were applied for key pollutants to ensure that appropriate consideration had been given to the potential impact on each sensitive ecological receptor, including local woodland areas. Where a dry deposition velocity cannot be specified, pollutants are identified as reactive or un-reactive depending on whether or not the gas will undergo a significant chemical reaction with the surface of the ground. For the purpose of this study, the majority of pollutants without a specific deposition factor were assumed to be unreactive, the exception being Hydrogen Fluoride (HF). Although some Volatile Organic Compounds would generally be considered to be reactive, Benzene, which is the specific pollutant referred to by the Air Quality Standard, has a low solubility and hence was assumed to be a less reactive compound. Information from Cambridge Environmental Research Consultants (CERC), the company which developed the ADMS model, specifies that for SO2, NO2, and NH3, wet deposition from a short-range plume is much less significant compared with dry deposition, and therefore does not usually need to be considered. Wet deposition due to a primary release of Sulphur Trioxide or Sulphuric Acid would need to be considered if the release were significant, however this does not apply in this instance. This is supported by the Regulators guidance(5) which states that “It is considered that the wet deposition of SO2, NO2 and NH3 is not significant within a short range. However, wet deposition for HCl and HNO3 should be considered where a process emits these species.” In the absence of any additional data, it is generally considered acceptable that total deposition (wet and dry) comprises 3 x dry deposition, where it is required to be included, and this is the methodology applied in this study when considering deposition from both HCl and HF, another acid gas.
Pollutant Combinations Where different pollutants are listed together, the emission stated is the total release of all of the specified pollutants. For example, the release of emissions of Cadmium and Thallium from the engines are combined, not 0.000364 g s-1 Cadmium and 0.000364 g s-1 Thallium. Where the resultant concentrations of these pollutants are reported in Appendix A, the concentration stated is the total pollutant level of the group, and not the pollutant concentration of any one of the substances, unless otherwise calculated and stated as such.
Dispersion Modelling Assessment – Dallol; Chelveston
Environmental Visage Ltd 8
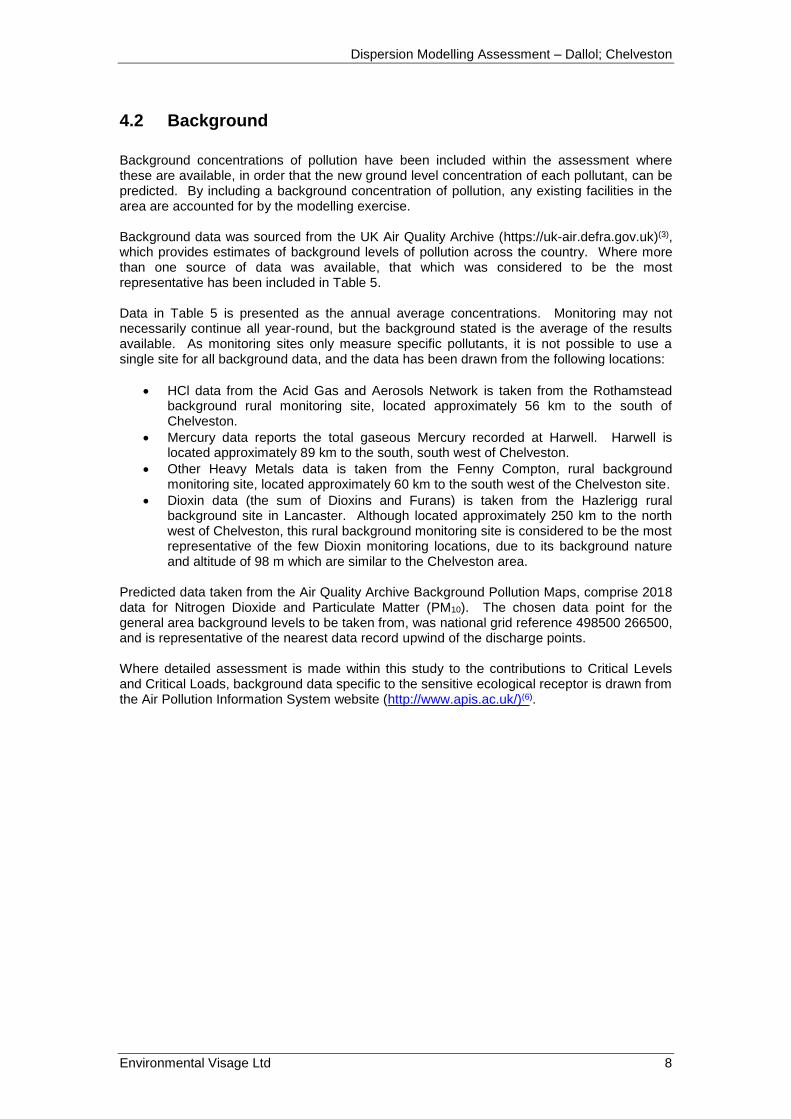
4.2 Background
Background concentrations of pollution have been included within the assessment where these are available, in order that the new ground level concentration of each pollutant, can be predicted. By including a background concentration of pollution, any existing facilities in the area are accounted for by the modelling exercise. Background data was sourced from the UK Air Quality Archive (https://uk-air.defra.gov.uk)(3), which provides estimates of background levels of pollution across the country. Where more than one source of data was available, that which was considered to be the most representative has been included in Table 5.
Data in Table 5 is presented as the annual average concentrations. Monitoring may not necessarily continue all year-round, but the background stated is the average of the results available. As monitoring sites only measure specific pollutants, it is not possible to use a single site for all background data, and the data has been drawn from the following locations:
• HCl data from the Acid Gas and Aerosols Network is taken from the Rothamstead background rural monitoring site, located approximately 56 km to the south of Chelveston.
• Mercury data reports the total gaseous Mercury recorded at Harwell. Harwell is located approximately 89 km to the south, south west of Chelveston.
• Other Heavy Metals data is taken from the Fenny Compton, rural background monitoring site, located approximately 60 km to the south west of the Chelveston site.
• Dioxin data (the sum of Dioxins and Furans) is taken from the Hazlerigg rural background site in Lancaster. Although located approximately 250 km to the north west of Chelveston, this rural background monitoring site is considered to be the most representative of the few Dioxin monitoring locations, due to its background nature and altitude of 98 m which are similar to the Chelveston area.
Predicted data taken from the Air Quality Archive Background Pollution Maps, comprise 2018 data for Nitrogen Dioxide and Particulate Matter (PM10). The chosen data point for the general area background levels to be taken from, was national grid reference 498500 266500, and is representative of the nearest data record upwind of the discharge points. Where detailed assessment is made within this study to the contributions to Critical Levels and Critical Loads, background data specific to the sensitive ecological receptor is drawn from the Air Pollution Information System website (http://www.apis.ac.uk/)(6).
Dispersion Modelling Assessment – Dallol; Chelveston
Environmental Visage Ltd 9
Table 5 Background Pollutant Concentrations Applied in the Chelveston Study
Pollutant Pollution / Interactive Maps Data
Measured Network Data
NOx (µg m-3) 2018 10.58
NO2 (µg m-3) 2018 8.05
PM10 (µg m-3) 2018 13.52
PM2.5 (µg m-3) 2018 9.14
SO2 (µg m-3) 2015 < 2
CO (mg m-3) 2015 1.1 – 1.6
Benzene (µg m-3) 2015 < 0.5
HCl (µg m-3) 2015 0.283 (Acid Gases)
Mercury (ng m-3) - 2015 1.89 (Gaseous Mercury)
Arsenic (ng m-3) – 2016 0.880 (Heavy Metals)
Cadmium (ng m-3) – 2016 0.134 (Heavy Metals)
Chromium (ng m-3) – 2016 0.220 (Heavy Metals)
Cobalt (ng m-3) – 2016 0.043 (Heavy Metals)
Copper (ng m-3) – 2016 3.155 (Heavy Metals)
Lead (ng m-3) – 2016 6.313 (Heavy Metals)
Manganese (ng m-3) – 2016 2.440 (Heavy Metals)
Nickel (ng m-3) – 2016 0.139 (Heavy Metals)
Vanadium (µg m-3) – 2016 0.591 (Heavy Metals)
Dioxins (fg TEQ m-3) 2015 5.29 (TOMPS)
4.3 Nearby Buildings and Structures For processes which have a stack or stacks located on top of a building, or adjacent to a tall building, the effect of surrounding structures may need to be taken into account. As a general guide, building downwash problems (where emissions are caught in the turbulent wake of the wind blowing around a building), may occur if the stack height is less than 2.5 times the height of the building upon which it sits. Buildings which sit adjacent to stacks may need to be considered if they are within 5 stack heights of the point of release. Although the main stack height of 35 m would suggest limited impact from the site buildings, the most significant buildings and structures around the site were included in the model to ensure a robust approach. Building shapes must be simplified for incorporation into the ADMS model, and hence a series of shapes represent the site buildings. The data included in the model were provided in the form of site layout drawings, provided by Dallol Energy Limited. Building dimensions are specified in metres.
Table 6 Details of the Building Data for Dallol Energy; Chelveston
Building Data X (m) Y (m) Height Length Width
Process Building 499292.3 267328.7 20 75.5 32.6
Workshop 499265.5 267349.7 12 30 15
Feedstock Building 499175.3 267384.7 15 57.6 48.4
Neighbouring Unit 499282.1 267250.5 15 70 40
Dispersion Modelling Assessment – Dallol; Chelveston
Environmental Visage Ltd 10
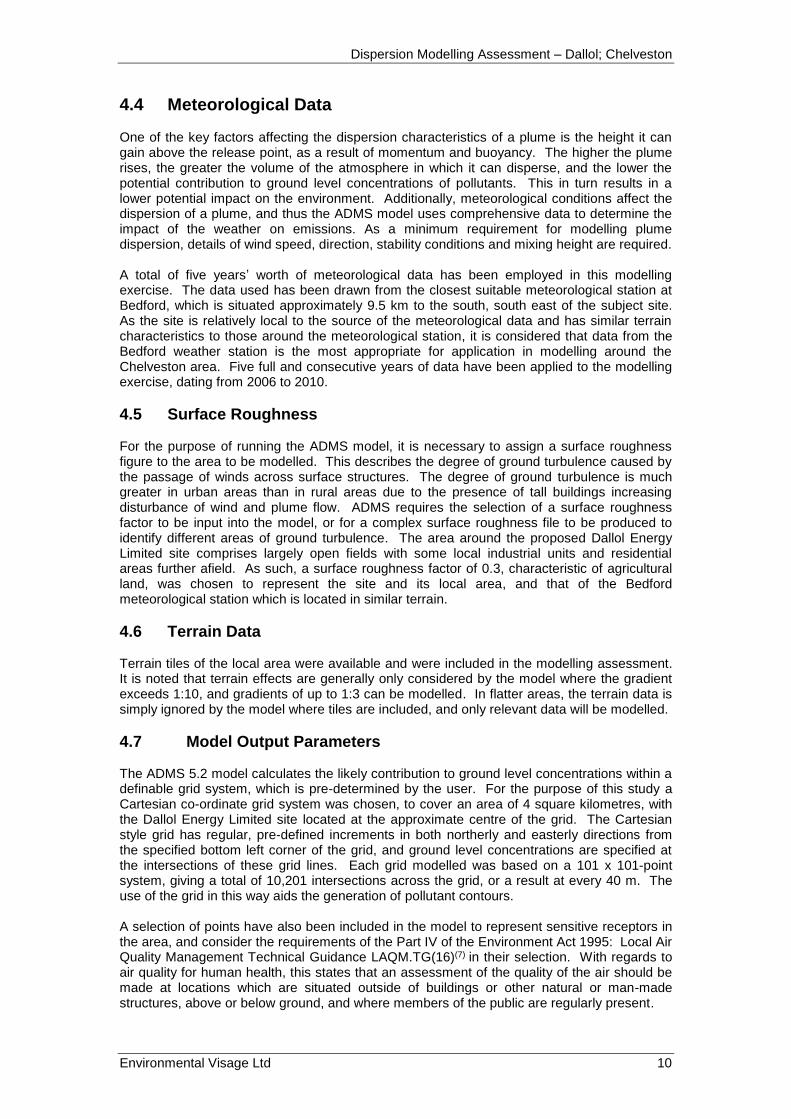
4.4 Meteorological Data One of the key factors affecting the dispersion characteristics of a plume is the height it can gain above the release point, as a result of momentum and buoyancy. The higher the plume rises, the greater the volume of the atmosphere in which it can disperse, and the lower the potential contribution to ground level concentrations of pollutants. This in turn results in a lower potential impact on the environment. Additionally, meteorological conditions affect the dispersion of a plume, and thus the ADMS model uses comprehensive data to determine the impact of the weather on emissions. As a minimum requirement for modelling plume dispersion, details of wind speed, direction, stability conditions and mixing height are required. A total of five years’ worth of meteorological data has been employed in this modelling exercise. The data used has been drawn from the closest suitable meteorological station at Bedford, which is situated approximately 9.5 km to the south, south east of the subject site. As the site is relatively local to the source of the meteorological data and has similar terrain characteristics to those around the meteorological station, it is considered that data from the Bedford weather station is the most appropriate for application in modelling around the Chelveston area. Five full and consecutive years of data have been applied to the modelling exercise, dating from 2006 to 2010.
4.5 Surface Roughness For the purpose of running the ADMS model, it is necessary to assign a surface roughness figure to the area to be modelled. This describes the degree of ground turbulence caused by the passage of winds across surface structures. The degree of ground turbulence is much greater in urban areas than in rural areas due to the presence of tall buildings increasing disturbance of wind and plume flow. ADMS requires the selection of a surface roughness factor to be input into the model, or for a complex surface roughness file to be produced to identify different areas of ground turbulence. The area around the proposed Dallol Energy Limited site comprises largely open fields with some local industrial units and residential areas further afield. As such, a surface roughness factor of 0.3, characteristic of agricultural land, was chosen to represent the site and its local area, and that of the Bedford meteorological station which is located in similar terrain.
4.6 Terrain Data Terrain tiles of the local area were available and were included in the modelling assessment. It is noted that terrain effects are generally only considered by the model where the gradient exceeds 1:10, and gradients of up to 1:3 can be modelled. In flatter areas, the terrain data is simply ignored by the model where tiles are included, and only relevant data will be modelled.
4.7 Model Output Parameters The ADMS 5.2 model calculates the likely contribution to ground level concentrations within a definable grid system, which is pre-determined by the user. For the purpose of this study a Cartesian co-ordinate grid system was chosen, to cover an area of 4 square kilometres, with the Dallol Energy Limited site located at the approximate centre of the grid. The Cartesian style grid has regular, pre-defined increments in both northerly and easterly directions from the specified bottom left corner of the grid, and ground level concentrations are specified at the intersections of these grid lines. Each grid modelled was based on a 101 x 101-point system, giving a total of 10,201 intersections across the grid, or a result at every 40 m. The use of the grid in this way aids the generation of pollutant contours. A selection of points have also been included in the model to represent sensitive receptors in the area, and consider the requirements of the Part IV of the Environment Act 1995: Local Air Quality Management Technical Guidance LAQM.TG(16)(7) in their selection. With regards to air quality for human health, this states that an assessment of the quality of the air should be made at locations which are situated outside of buildings or other natural or man-made structures, above or below ground, and where members of the public are regularly present.
Dispersion Modelling Assessment – Dallol; Chelveston
Environmental Visage Ltd 11
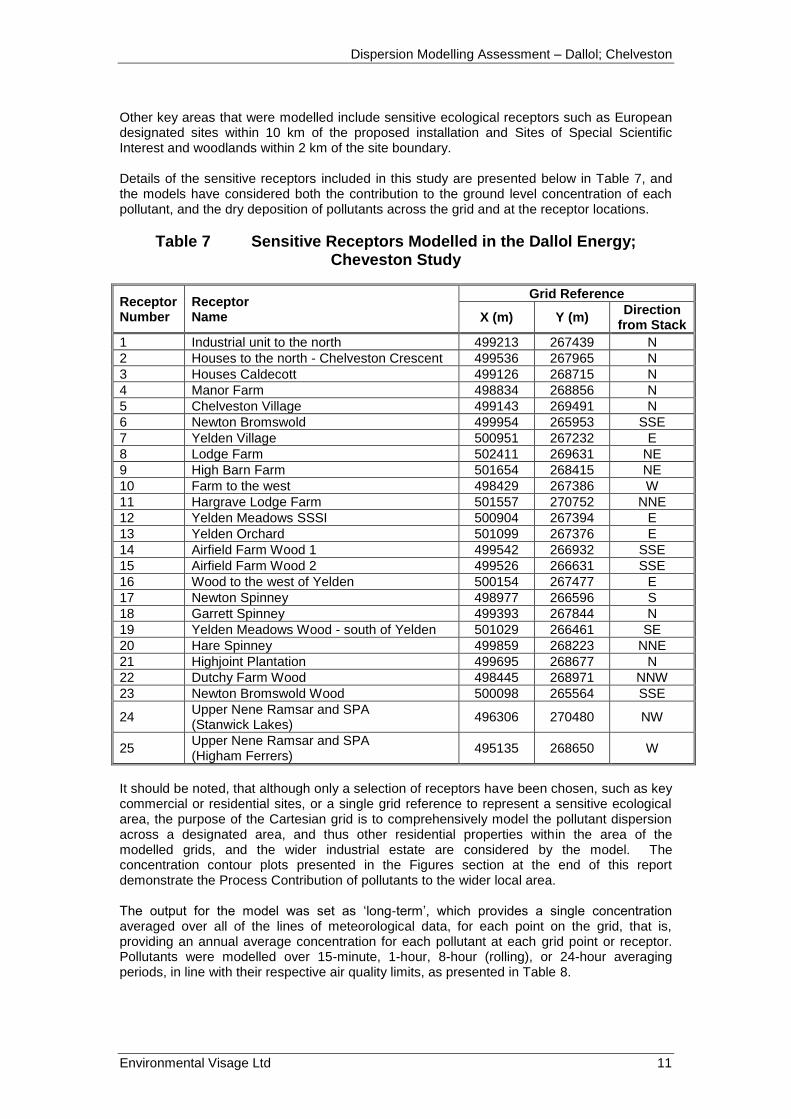
Other key areas that were modelled include sensitive ecological receptors such as European designated sites within 10 km of the proposed installation and Sites of Special Scientific Interest and woodlands within 2 km of the site boundary. Details of the sensitive receptors included in this study are presented below in Table 7, and the models have considered both the contribution to the ground level concentration of each pollutant, and the dry deposition of pollutants across the grid and at the receptor locations.
Table 7 Sensitive Receptors Modelled in the Dallol Energy; Cheveston Study
Receptor Number
Receptor Name
Grid Reference
X (m) Y (m) Direction
from Stack
1 Industrial unit to the north 499213 267439 N
2 Houses to the north - Chelveston Crescent 499536 267965 N
3 Houses Caldecott 499126 268715 N
4 Manor Farm 498834 268856 N
5 Chelveston Village 499143 269491 N
6 Newton Bromswold 499954 265953 SSE
7 Yelden Village 500951 267232 E
8 Lodge Farm 502411 269631 NE
9 High Barn Farm 501654 268415 NE
10 Farm to the west 498429 267386 W
11 Hargrave Lodge Farm 501557 270752 NNE
12 Yelden Meadows SSSI 500904 267394 E
13 Yelden Orchard 501099 267376 E
14 Airfield Farm Wood 1 499542 266932 SSE
15 Airfield Farm Wood 2 499526 266631 SSE
16 Wood to the west of Yelden 500154 267477 E
17 Newton Spinney 498977 266596 S
18 Garrett Spinney 499393 267844 N
19 Yelden Meadows Wood - south of Yelden 501029 266461 SE
20 Hare Spinney 499859 268223 NNE
21 Highjoint Plantation 499695 268677 N
22 Dutchy Farm Wood 498445 268971 NNW
23 Newton Bromswold Wood 500098 265564 SSE
24 Upper Nene Ramsar and SPA (Stanwick Lakes)
496306 270480 NW
25 Upper Nene Ramsar and SPA (Higham Ferrers)
495135 268650 W
It should be noted, that although only a selection of receptors have been chosen, such as key commercial or residential sites, or a single grid reference to represent a sensitive ecological area, the purpose of the Cartesian grid is to comprehensively model the pollutant dispersion across a designated area, and thus other residential properties within the area of the modelled grids, and the wider industrial estate are considered by the model. The concentration contour plots presented in the Figures section at the end of this report demonstrate the Process Contribution of pollutants to the wider local area. The output for the model was set as ‘long-term’, which provides a single concentration averaged over all of the lines of meteorological data, for each point on the grid, that is, providing an annual average concentration for each pollutant at each grid point or receptor. Pollutants were modelled over 15-minute, 1-hour, 8-hour (rolling), or 24-hour averaging periods, in line with their respective air quality limits, as presented in Table 8.
Dispersion Modelling Assessment – Dallol; Chelveston
Environmental Visage Ltd 12
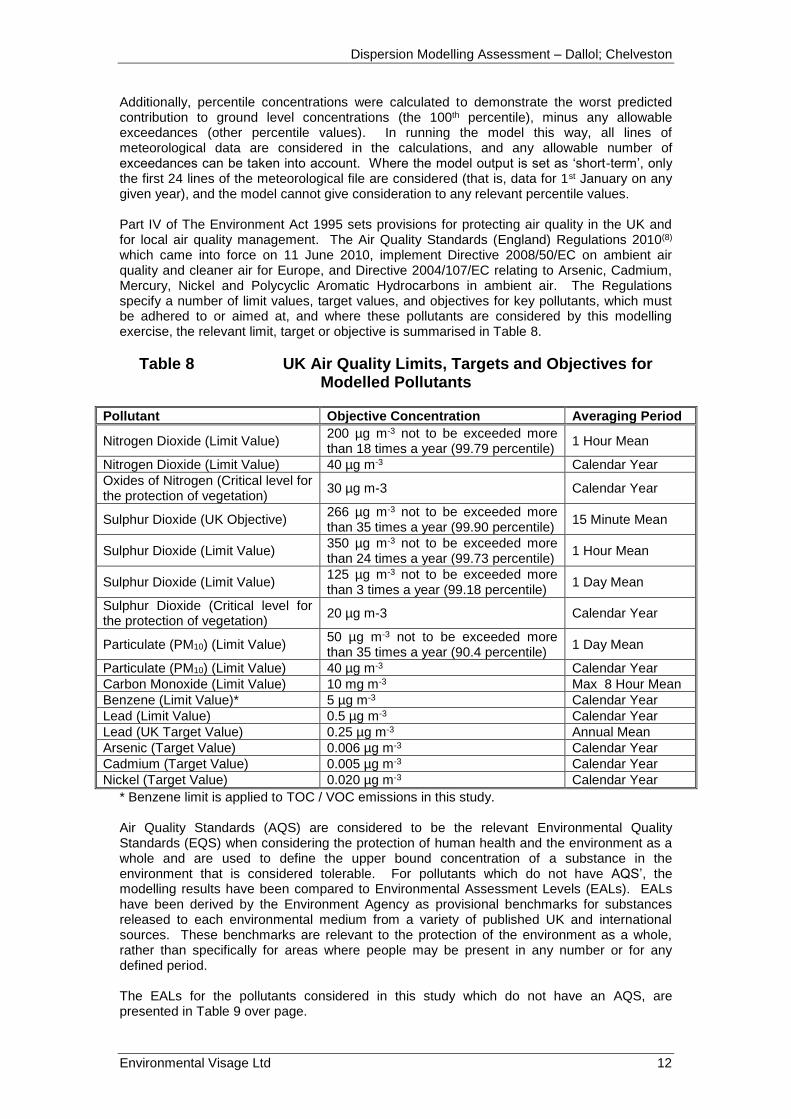
Additionally, percentile concentrations were calculated to demonstrate the worst predicted contribution to ground level concentrations (the 100th percentile), minus any allowable exceedances (other percentile values). In running the model this way, all lines of meteorological data are considered in the calculations, and any allowable number of exceedances can be taken into account. Where the model output is set as ‘short-term’, only the first 24 lines of the meteorological file are considered (that is, data for 1st January on any given year), and the model cannot give consideration to any relevant percentile values. Part IV of The Environment Act 1995 sets provisions for protecting air quality in the UK and for local air quality management. The Air Quality Standards (England) Regulations 2010(8) which came into force on 11 June 2010, implement Directive 2008/50/EC on ambient air quality and cleaner air for Europe, and Directive 2004/107/EC relating to Arsenic, Cadmium, Mercury, Nickel and Polycyclic Aromatic Hydrocarbons in ambient air. The Regulations specify a number of limit values, target values, and objectives for key pollutants, which must be adhered to or aimed at, and where these pollutants are considered by this modelling exercise, the relevant limit, target or objective is summarised in Table 8.
Table 8 UK Air Quality Limits, Targets and Objectives for Modelled Pollutants
Pollutant Objective Concentration Averaging Period
Nitrogen Dioxide (Limit Value) 200 µg m-3 not to be exceeded more than 18 times a year (99.79 percentile)
1 Hour Mean
Nitrogen Dioxide (Limit Value) 40 µg m-3 Calendar Year
Oxides of Nitrogen (Critical level for the protection of vegetation)
30 µg m-3 Calendar Year
Sulphur Dioxide (UK Objective) 266 µg m-3 not to be exceeded more than 35 times a year (99.90 percentile)
15 Minute Mean
Sulphur Dioxide (Limit Value) 350 µg m-3 not to be exceeded more than 24 times a year (99.73 percentile)
1 Hour Mean
Sulphur Dioxide (Limit Value) 125 µg m-3 not to be exceeded more than 3 times a year (99.18 percentile)
1 Day Mean
Sulphur Dioxide (Critical level for the protection of vegetation)
20 µg m-3 Calendar Year
Particulate (PM10) (Limit Value) 50 µg m-3 not to be exceeded more than 35 times a year (90.4 percentile)
1 Day Mean
Particulate (PM10) (Limit Value) 40 µg m-3 Calendar Year
Carbon Monoxide (Limit Value) 10 mg m-3 Max 8 Hour Mean
Benzene (Limit Value)* 5 µg m-3 Calendar Year
Lead (Limit Value) 0.5 µg m-3 Calendar Year
Lead (UK Target Value) 0.25 µg m-3 Annual Mean
Arsenic (Target Value) 0.006 µg m-3 Calendar Year
Cadmium (Target Value) 0.005 µg m-3 Calendar Year
Nickel (Target Value) 0.020 µg m-3 Calendar Year
* Benzene limit is applied to TOC / VOC emissions in this study. Air Quality Standards (AQS) are considered to be the relevant Environmental Quality Standards (EQS) when considering the protection of human health and the environment as a whole and are used to define the upper bound concentration of a substance in the environment that is considered tolerable. For pollutants which do not have AQS’, the modelling results have been compared to Environmental Assessment Levels (EALs). EALs have been derived by the Environment Agency as provisional benchmarks for substances released to each environmental medium from a variety of published UK and international sources. These benchmarks are relevant to the protection of the environment as a whole, rather than specifically for areas where people may be present in any number or for any defined period. The EALs for the pollutants considered in this study which do not have an AQS, are presented in Table 9 over page.
Dispersion Modelling Assessment – Dallol; Chelveston
Environmental Visage Ltd 13
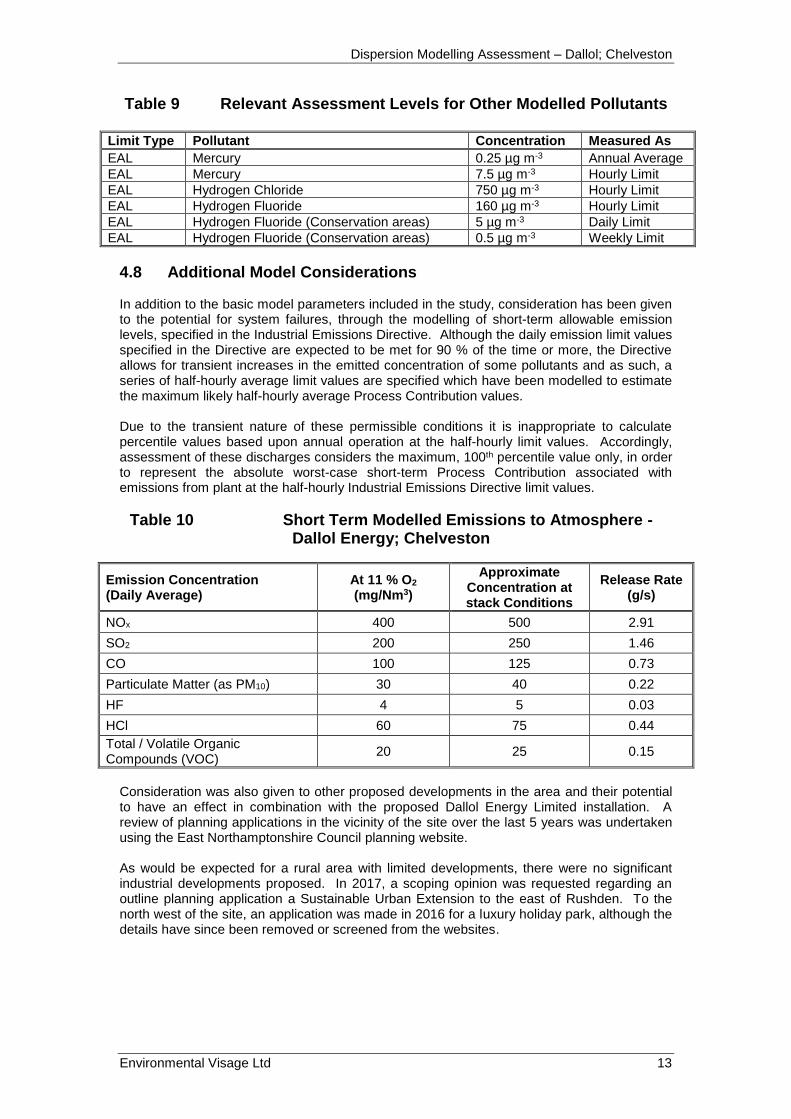
Table 9 Relevant Assessment Levels for Other Modelled Pollutants
Limit Type Pollutant Concentration Measured As
EAL Mercury 0.25 µg m-3 Annual Average
EAL Mercury 7.5 µg m-3 Hourly Limit
EAL Hydrogen Chloride 750 µg m-3 Hourly Limit
EAL Hydrogen Fluoride 160 µg m-3 Hourly Limit
EAL Hydrogen Fluoride (Conservation areas) 5 µg m-3 Daily Limit
EAL Hydrogen Fluoride (Conservation areas) 0.5 µg m-3 Weekly Limit
4.8 Additional Model Considerations In addition to the basic model parameters included in the study, consideration has been given to the potential for system failures, through the modelling of short-term allowable emission levels, specified in the Industrial Emissions Directive. Although the daily emission limit values specified in the Directive are expected to be met for 90 % of the time or more, the Directive allows for transient increases in the emitted concentration of some pollutants and as such, a series of half-hourly average limit values are specified which have been modelled to estimate the maximum likely half-hourly average Process Contribution values. Due to the transient nature of these permissible conditions it is inappropriate to calculate percentile values based upon annual operation at the half-hourly limit values. Accordingly, assessment of these discharges considers the maximum, 100th percentile value only, in order to represent the absolute worst-case short-term Process Contribution associated with emissions from plant at the half-hourly Industrial Emissions Directive limit values.
Table 10 Short Term Modelled Emissions to Atmosphere - Dallol Energy; Chelveston
Emission Concentration (Daily Average)
At 11 % O2 (mg/Nm3)
Approximate Concentration at stack Conditions
Release Rate (g/s)
NOx 400 500 2.91
SO2 200 250 1.46
CO 100 125 0.73
Particulate Matter (as PM10) 30 40 0.22
HF 4 5 0.03
HCl 60 75 0.44
Total / Volatile Organic Compounds (VOC)
20 25 0.15
Consideration was also given to other proposed developments in the area and their potential to have an effect in combination with the proposed Dallol Energy Limited installation. A review of planning applications in the vicinity of the site over the last 5 years was undertaken using the East Northamptonshire Council planning website. As would be expected for a rural area with limited developments, there were no significant industrial developments proposed. In 2017, a scoping opinion was requested regarding an outline planning application a Sustainable Urban Extension to the east of Rushden. To the north west of the site, an application was made in 2016 for a luxury holiday park, although the details have since been removed or screened from the websites.
Dispersion Modelling Assessment – Dallol; Chelveston
Environmental Visage Ltd 14
The most significant local industrial development appears to be that associated with the Chelveston Renewable Energy Park at the Airfield, situated to the north, north west of the Dallol Energy site. As the proposals for the energy park include mainly photovoltaic and wind turbine developments, B2 uses and continued grazing of the land, there are not through to be any discharges to atmosphere which may combine with discharges from the Dallol Energy pyrolysis process and have a combined impact on the local air quality. That said, the presence of wind turbines locally to the plastic pyrolysis plant must be considered. The potential for modified wind flow field effects on the discharges from the plastic pyrolysis plant has been considered, but was not included within the model. This is because, although wake effects including velocity deficit and enhanced turbulence are thought to potentially still be noticeable after fifteen turbine diameters downstream of a wind turbine(9), and thus within a wind farm it is considered appropriate that turbines are placed at least fifteen turbine diameters apart for a cost-efficient power generation(10), the dimeters of the fourteen turbines located at the Cheveston Renewable Energy Park are understood to be 90 m in diameter, but are located more than 1.4 km from the Dallol Energy emission point. Therefore, it is considered that there are unlikely to be significant negative effects on the dispersion of the plume from the plastic pyrolysis plant by the presence and operation of the wind turbines.
4.9 Modelling Assumptions In addition to the parameters described in the sections above, some assumptions have had to be made for the modelling study and these are listed below:
• All normal operational emissions are assumed to be continuous although may not necessarily be running constantly, with for example time for scheduled and un-planned shut downs. Thus, the model can be seen to represent a worst-case as emissions are considered to occur on a 24-hour, 365 days per year basis, whereas in reality, the planned operations will include periods of shut-down each year for maintenance.
• Emission characteristics have been supplied by the technology providers. Pollutant emission levels are assumed to be in line with the emission limit values specified by the Industrial Emissions Directive. This assessment can therefore be considered to represent a worst-case as the plant will be regulated to the limits specified in the Directive, and will likely discharge at lower levels for the majority of the time.
5. Results and Discussion Tabulated results are presented in Appendix A and consider the Process Contribution to ground level concentrations of pollutants, and the deposition of pollutants to sensitive infrastructure and ecological receptors. Appendix A Table 1 presents the maximum Process Contribution of each pollutant for each year of meteorological data modelled, with the maximum value of each species highlighted. The Process Contribution of all pollutants, and the Predicted Environmental Concentrations of the pollutants across the area remain within the Air Quality Standards or Environmental Assessment Levels. This is true whether considering the impact on individual receptors, or the maximum calculated concentration across the modelled grid.
Dispersion Modelling Assessment – Dallol; Chelveston
Environmental Visage Ltd 15
An assessment of ‘insignificance’ can be made by comparing the Process Contribution, or the Predicted Environmental Concentration (where available), to the relevant Environmental Quality Standard. Environment Agency guidance on undertaking Air Emissions Risk Assessments(11) specifies that:
• the short-term Process Contribution must be less than 10% of the short-term environmental standard; and
• the long-term Process Contribution must be less than 1% of the long-term environmental standard.
Where process contributions cannot immediately be screened as insignificant, The Environment Agency propose a second stage of screening whereby results which meet both of the following requirements are insignificant:
• the short-term Process Contribution is less than 20 % of the short-term environmental standards minus twice the long-term background concentration; and
• the long-term Predicted Environmental Concentration is less than 70 % of the long-term environmental standards.
Appendix A Table 2 demonstrates that Process Contributions of most pollutants are screened as insignificant in terms of their impact during the initial assessment, with the short-term contributions of Nitrogen Dioxide (for human health) and Oxides of Nitrogen (for vegetation), being carried onto the secondary assessment. Nitrogen Dioxide is screened as insignificant in Table 3, as the short-term Process Contribution remains below 20 % of the revised Environmental Quality Standard, calculated from the Air Quality Standard minus twice the background concentration. The secondary assessment of the maximum 24-hour Process Contribution of Oxides of Nitrogen is undertaken in Table 6D when the impact on sensitive ecological receptors is assessed, as this EQS relates specifically to impacts on vegetation. Appendix A Table 4 considers the combined Heavy Metal releases in more detail, using a methodology advised by the Environment Agency(12). The guidance recommends a stepwise approach to assessment of emissions of Heavy (Group 3) Metals, proposing that, after an initial assessment where all species are assumed to be discharged at the emission limit value, a second stage screening assessment should be carried out for those metals which cannot be screened as insignificant, and this should be based on measured emissions data from currently operational MSW incineration and waste wood co-incineration plant. From measurements undertaken at facilities between 2007 and 2015, the Environment Agency has published emissions data for use as an indicative basis for the assessment of species whose Process Contributions were above 1 % of the long-term assessment levels. Maximum, minimum and mean emissions concentrations are detailed, as are the corresponding percentage values of the Industrial Emissions Directive Group 3 Metals limit value. Hence, Table 4 presents the calculated Process Contribution of each metal species, and where background concentrations are available from the nearby Heavy Metals Monitoring Network site at Fenny Compton, these are included in order that the Predicted Environmental Concentration of each species can be calculated. Although Process Contributions of Arsenic, Manganese and Nickel are not screened at the initial assessment stage, the Predicted Environmental Concentrations remain below 30 % of the Environmental Assessment Levels, and thus can be screened as insignificant (defined as less than 70 % of the EAL).
Dispersion Modelling Assessment – Dallol; Chelveston
Environmental Visage Ltd 16
The impact of short-term operational releases are considered in Appendix A Table 5, with the likely Process Contributions from discharges at the maximum half-hourly limit values presented. With the exception of the Process Contribution of Total Organic Compounds when assessed against the Air Quality Standard for Benzene, the Process Contributions remain within the stated Environmental Quality Standard, and can therefore be screened as insignificant. It is noted, that assessment of short-term, transient contributions against standards which have different referencing periods and may include percentile values, is not a strictly relevant comparison, and presents a worst-case approach. Additionally, although the maximum hourly contribution of Total Organic Compounds (TOC) cannot be screened as insignificant when compared against the Air Quality Standard for Benzene, the TOC release represents a mixed species pollutant which will comprise only a portion of Benzene. Hence, although the assessment cannot screen the potential Process Contribution as insignificant, because there is insufficient information on the likely contribution of Benzene to the TOC release, the assessment provides a significant over-estimate of the impact as it compares a mixed species short-term contribution with a specific species annual average assessment level. Tables 6 A – C in Appendix A present the Process Contribution results at sensitive human health receptors (Receptors 1 – 11), and are highlighted to show pollutants which represent more than 1 % of the long-term, or more than 10 % of the short-term assessment level, and which therefore cannot immediately be screened as insignificant. Receptors 1 and 2, the industrial unit to the north of the proposed development site and the residential properties at Chelveston Crescent, cannot immediately have the long-term Process Contributions of Nitrogen Dioxide, Heavy Metals (presented as Nickel), or Cadmium screened as insignificant. Cadmium and / or Heavy Metals from the process also contribute slightly more than 1 % (although less than 2 %) at receptors 3, 7 and 9. Although the Process Contributions of these pollutants cannot immediately be screened as insignificant, the PC and the resultant calculated Predicted Environmental Concentrations are all lower than the maximum PECs reported in Table 2, which screened as insignificant for all long-term contributions. Hence the impact on the human health receptors are also screened as insignificant. Table 6 D in Appendix A presents the Process Contribution results at sensitive ecological receptors (Receptors 12 – 25), and are highlighted to show pollutants which represent more than 1 % of the long-term, or more than 10 % of the short-term assessment level, and which therefore cannot immediately be screened as insignificant. Although Process Contributions of NOx, and SO2 cannot automatically be screened as insignificant at some of the woodland receptors, none of the affected sites are designated sites and as such, the secondary screening assessment simply requires that the short-term and long-term Process Contributions remain within 100 % of the relevant environmental standard. The most significant reported Process Contribution is that of the maximum 24-hour NOx level, which equates to approximately 15 % of the Environmental Quality Standard. As such, the impact of the proposed development on local sensitive ecological sites can be screened as insignificant. Contributions of Dioxins to local receptors are not included in the receptor tables as there is no direct assessment level to compare the contributions to. The results of Dioxin contributions at human health receptors have been considered separately in a health impact assessment report.
Dispersion Modelling Assessment – Dallol; Chelveston
Environmental Visage Ltd 17
Finally, the potential contributions to nutrient Nitrogen and acid deposition levels at Yelden Meadow are calculated in Appendix A Table 7, with assessment being made against the lower end of the Critical Loads. Contributions to nutrient Nitrogen deposition are calculated from the dry deposition of Nitrogen Dioxide only, as Nitric Oxide does not deposit at any significant rate. The overall dry deposition of NO2 has therefore been calculated as 70 % of the NOx deposition rate. Levels of acid deposition comprise keq/ha/year emissions taking contributions from emissions of Nitrogen Dioxide, Sulphur Dioxide, Hydrogen Chloride and Hydrogen Fluoride. The results show that levels of both nutrient Nitrogen and acid deposition are predicted to equate to less than 1 % of the Critical Loads specified for the Yelden Meadow SSSI site, and therefore can be screened as insignificant. As the Upper Nene Ramsar and SPA site is designated due to its geological importance, and resultant wetland habitat, there are no Critical Loads specified for this receptor on the APIS website(6). It is important to note here that, by definition, a Critical Load is "a quantitative estimate of exposure to one or more pollutants below which significant harmful effects on specified sensitive elements of the environment do not occur according to present knowledge"(3). It is not a quantitative estimate of damage to a particular habitat, but represents the potential for damage to occur. As such, and in support of the result of the insignificance screening methodology, such small contributions to the Critical Loads proposed by the plastic pyrolysis plant are highly unlikely to result in any significant harmful effect on the sensitive elements of the Yelden Meadow SSSI.
6. Conclusions Dallol Energy Limited are proposing to develop a waste plastic pyrolysis plant to be located close to Chelveston in East Northamptonshire. The site will receive non-recyclable plastic (including waste polystyrene, polyethylene and polypropylene) which will be depolymerised into hydrocarbon gases ranging from Liquid Petroleum Gas (LPG) to heavy wax. A cyclone combustor will provide heat to the process, using LPG for start-up after which a mixture of LPG and non-condensable gases will provide fuel for the burner. Hot vapour ducts remove the gaseous hydrocarbons produced in the depolymerisation reaction to a scrubber, where they are cooled and washed free of particulates by the reflux diesel stream. Solid particles, dust (including any residual metal dust) and heavier oils and waxes are removed by the reflux diesel stream and fall back into the catalytic reactor to undergo further depolymerisation. A number of individual process kilns will discharge to air from the proposed facility, and the cyclone combustor will also include a release to atmosphere. However, these points will all discharge through a common chimney stack for emissions monitoring and control, with the incorporation of a blower fan to ensure that the exhaust velocity is constant no matter how many kilns are connected. Hence, the flow rate from the discharge will remain essentially constant, and as a worst-case scenario, the discharge is assumed to release at the emission limit concentrations specified in the Industrial Emissions Directive (IED). This assessment has considered the effects of the discharges to atmosphere from the process, on the air quality in the local area. A worst-case operational assessment has been provided, which assumes that all plant are operational, 24-hours per day, 365 days per year. The Process Contribution of all pollutants, and the Predicted Environmental Concentrations of the pollutants across the area remain within the Air Quality Standards or Environmental Assessment Levels. This is true whether considering the impact on individual receptors, or the maximum calculated concentration across the modelled grid. Not all of the Process Contributions of emissions from the proposed facility can immediately be screened as insignificant, however the Predicted Environmental Concentration of all species remain within 70 % of the Standards, and are therefore screened at the secondary stage. There are a number of sensitive receptors in the vicinity of the plant and these have been modelled specifically. Similarly to the gridded results, the few Process Contributions which cannot be screened at the initial assessment stage, are screened by the second, Predicted Environmental Concentration, assessment.
Dispersion Modelling Assessment – Dallol; Chelveston
Environmental Visage Ltd 18
When considering the potential impact on sensitive ecological receptors, Process Contributions of NOx, and SO2 cannot automatically be screened as insignificant at some of the local woodland receptors. However, as none of the affected sites are designated sites and as the Process Contributions remain within 100 % of the relevant environmental standard, the impacts are screened as insignificant at the secondary assessment stage. Contributions to the Critical Loads specified for the Yelden Meadow SSSI are less than 1 % of the minimum nutrient Nitrogen and acid deposition Critical Loads and hence, are screened as insignificant.
7. References
1. Definition of Critical Levels and Loads. (http://www.unece.org/env/lrtap/WorkingGroups/wge/definitions.htm)
2. Technical Guidance Note (Dispersion) D1, Her Majesty’s Inspectorate of Pollution (1993).
3. Air Quality Archive Estimated UK Background Air Pollution Concentrations (https://uk-air.defra.gov.uk/data/laqm-background-home).
4. Conversion ratios for NOx and NO2. Environment Agency. http://webarchive.nationalarchives.gov.uk/20140328232919/http://www.environment-agency.gov.uk/static/documents/Conversion_ratios_for__NOx_and_NO2_.pdf
5. Technical guidance on detailed modelling approach for an appropriate assessment for emissions to air. Status: Updated version (Approved March 2014). Environment Agency.
6. Air Pollution Information System (http://www.apis.ac.uk/).
7. Local Air Quality Management. Technical Guidance LAQM.TG(16). April 2016. DEFRA. Crown Copyright 2016.
8. The Air Quality Standards (England) Regulations 2010, Statutory Instrument No. 1001. 25th March 2010.
9. Chamorro, L., Porté-Agel, F. (2009). A Wind-Tunnel Investigation of Wind-Turbine Wakes: Boundary-Layer Turbulence Effects. Boundary-Layer Meteorol 132(1): 129-149.
10. Meneveau, C., & Meyers, J. (2012). Optimal turbine spacing in fully developed wind-
farm boundary layers. Wind Energy 15, 305-317. doi:10.1002/we.469
11. Air emissions risk assessment for your environmental permit. Environment Agency. (https://www.gov.uk/guidance/air-emissions-risk-assessment-for-your-environmental-permit)
12. https://www.gov.uk/government/uploads/system/uploads/attachment_data/file/532474/LIT_7349.pdf
APPENDIX A MODELLING RESULTS TABLES
Notes: Within the tables the concentration units vary by pollutant. Please refer to each individual table for details. Highlighted cells denote the maximum reported value. The insignificance test tables compare all relevant concentrations to an assessment level, however the reporting period of the pollutant and limit concentrations may not be directly comparable.
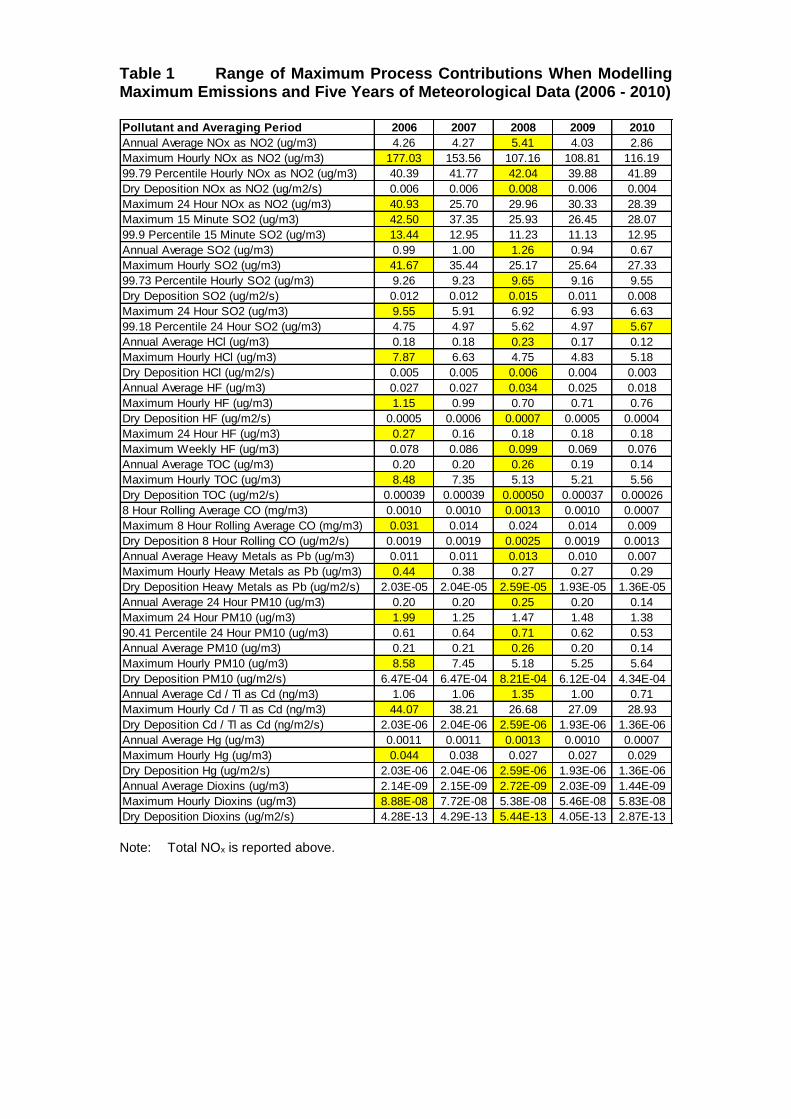
Table 1 Range of Maximum Process Contributions When Modelling Maximum Emissions and Five Years of Meteorological Data (2006 - 2010) Pollutant and Averaging Period 2006 2007 2008 2009 2010
Annual Average NOx as NO2 (ug/m3) 4.26 4.27 5.41 4.03 2.86
Maximum Hourly NOx as NO2 (ug/m3) 177.03 153.56 107.16 108.81 116.19
99.79 Percentile Hourly NOx as NO2 (ug/m3) 40.39 41.77 42.04 39.88 41.89
Dry Deposition NOx as NO2 (ug/m2/s) 0.006 0.006 0.008 0.006 0.004
Maximum 24 Hour NOx as NO2 (ug/m3) 40.93 25.70 29.96 30.33 28.39
Maximum 15 Minute SO2 (ug/m3) 42.50 37.35 25.93 26.45 28.07
99.9 Percentile 15 Minute SO2 (ug/m3) 13.44 12.95 11.23 11.13 12.95
Annual Average SO2 (ug/m3) 0.99 1.00 1.26 0.94 0.67
Maximum Hourly SO2 (ug/m3) 41.67 35.44 25.17 25.64 27.33
99.73 Percentile Hourly SO2 (ug/m3) 9.26 9.23 9.65 9.16 9.55
Dry Deposition SO2 (ug/m2/s) 0.012 0.012 0.015 0.011 0.008
Maximum 24 Hour SO2 (ug/m3) 9.55 5.91 6.92 6.93 6.63
99.18 Percentile 24 Hour SO2 (ug/m3) 4.75 4.97 5.62 4.97 5.67
Annual Average HCl (ug/m3) 0.18 0.18 0.23 0.17 0.12
Maximum Hourly HCl (ug/m3) 7.87 6.63 4.75 4.83 5.18
Dry Deposition HCl (ug/m2/s) 0.005 0.005 0.006 0.004 0.003
Annual Average HF (ug/m3) 0.027 0.027 0.034 0.025 0.018
Maximum Hourly HF (ug/m3) 1.15 0.99 0.70 0.71 0.76
Dry Deposition HF (ug/m2/s) 0.0005 0.0006 0.0007 0.0005 0.0004
Maximum 24 Hour HF (ug/m3) 0.27 0.16 0.18 0.18 0.18
Maximum Weekly HF (ug/m3) 0.078 0.086 0.099 0.069 0.076
Annual Average TOC (ug/m3) 0.20 0.20 0.26 0.19 0.14
Maximum Hourly TOC (ug/m3) 8.48 7.35 5.13 5.21 5.56
Dry Deposition TOC (ug/m2/s) 0.00039 0.00039 0.00050 0.00037 0.00026
8 Hour Rolling Average CO (mg/m3) 0.0010 0.0010 0.0013 0.0010 0.0007
Maximum 8 Hour Rolling Average CO (mg/m3) 0.031 0.014 0.024 0.014 0.009
Dry Deposition 8 Hour Rolling CO (ug/m2/s) 0.0019 0.0019 0.0025 0.0019 0.0013
Annual Average Heavy Metals as Pb (ug/m3) 0.011 0.011 0.013 0.010 0.007
Maximum Hourly Heavy Metals as Pb (ug/m3) 0.44 0.38 0.27 0.27 0.29
Dry Deposition Heavy Metals as Pb (ug/m2/s) 2.03E-05 2.04E-05 2.59E-05 1.93E-05 1.36E-05
Annual Average 24 Hour PM10 (ug/m3) 0.20 0.20 0.25 0.20 0.14
Maximum 24 Hour PM10 (ug/m3) 1.99 1.25 1.47 1.48 1.38
90.41 Percentile 24 Hour PM10 (ug/m3) 0.61 0.64 0.71 0.62 0.53
Annual Average PM10 (ug/m3) 0.21 0.21 0.26 0.20 0.14
Maximum Hourly PM10 (ug/m3) 8.58 7.45 5.18 5.25 5.64
Dry Deposition PM10 (ug/m2/s) 6.47E-04 6.47E-04 8.21E-04 6.12E-04 4.34E-04
Annual Average Cd / Tl as Cd (ng/m3) 1.06 1.06 1.35 1.00 0.71
Maximum Hourly Cd / Tl as Cd (ng/m3) 44.07 38.21 26.68 27.09 28.93
Dry Deposition Cd / Tl as Cd (ng/m2/s) 2.03E-06 2.04E-06 2.59E-06 1.93E-06 1.36E-06
Annual Average Hg (ug/m3) 0.0011 0.0011 0.0013 0.0010 0.0007
Maximum Hourly Hg (ug/m3) 0.044 0.038 0.027 0.027 0.029
Dry Deposition Hg (ug/m2/s) 2.03E-06 2.04E-06 2.59E-06 1.93E-06 1.36E-06
Annual Average Dioxins (ug/m3) 2.14E-09 2.15E-09 2.72E-09 2.03E-09 1.44E-09
Maximum Hourly Dioxins (ug/m3) 8.88E-08 7.72E-08 5.38E-08 5.46E-08 5.83E-08
Dry Deposition Dioxins (ug/m2/s) 4.28E-13 4.29E-13 5.44E-13 4.05E-13 2.87E-13
Note: Total NOx is reported above.
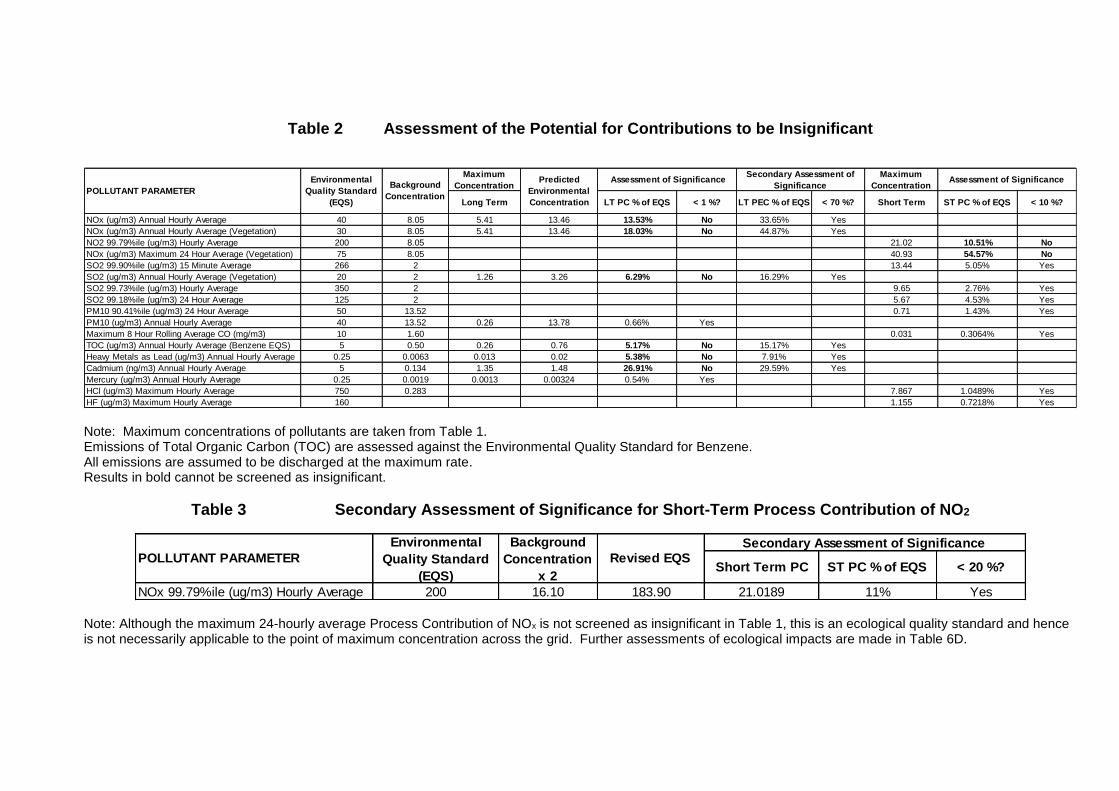
Table 2 Assessment of the Potential for Contributions to be Insignificant
Maximum
Concentration
Maximum
Concentration
Long Term LT PC % of EQS < 1 %? LT PEC % of EQS < 70 %? Short Term ST PC % of EQS < 10 %?
NOx (ug/m3) Annual Hourly Average 40 8.05 5.41 13.46 13.53% No 33.65% Yes
NOx (ug/m3) Annual Hourly Average (Vegetation) 30 8.05 5.41 13.46 18.03% No 44.87% Yes
NO2 99.79%ile (ug/m3) Hourly Average 200 8.05 21.02 10.51% No
NOx (ug/m3) Maximum 24 Hour Average (Vegetation) 75 8.05 40.93 54.57% No
SO2 99.90%ile (ug/m3) 15 Minute Average 266 2 13.44 5.05% Yes
SO2 (ug/m3) Annual Hourly Average (Vegetation) 20 2 1.26 3.26 6.29% No 16.29% Yes
SO2 99.73%ile (ug/m3) Hourly Average 350 2 9.65 2.76% Yes
SO2 99.18%ile (ug/m3) 24 Hour Average 125 2 5.67 4.53% Yes
PM10 90.41%ile (ug/m3) 24 Hour Average 50 13.52 0.71 1.43% Yes
PM10 (ug/m3) Annual Hourly Average 40 13.52 0.26 13.78 0.66% Yes
Maximum 8 Hour Rolling Average CO (mg/m3) 10 1.60 0.031 0.3064% Yes
TOC (ug/m3) Annual Hourly Average (Benzene EQS) 5 0.50 0.26 0.76 5.17% No 15.17% Yes
Heavy Metals as Lead (ug/m3) Annual Hourly Average 0.25 0.0063 0.013 0.02 5.38% No 7.91% Yes
Cadmium (ng/m3) Annual Hourly Average 5 0.134 1.35 1.48 26.91% No 29.59% Yes
Mercury (ug/m3) Annual Hourly Average 0.25 0.0019 0.0013 0.00324 0.54% Yes
HCl (ug/m3) Maximum Hourly Average 750 0.283 7.867 1.0489% Yes
HF (ug/m3) Maximum Hourly Average 160 1.155 0.7218% Yes
Assessment of Significance
POLLUTANT PARAMETER
Environmental
Quality Standard
(EQS)
Background
Concentration
Predicted
Environmental
Concentration
Assessment of SignificanceSecondary Assessment of
Significance
Note: Maximum concentrations of pollutants are taken from Table 1. Emissions of Total Organic Carbon (TOC) are assessed against the Environmental Quality Standard for Benzene. All emissions are assumed to be discharged at the maximum rate. Results in bold cannot be screened as insignificant.
Table 3 Secondary Assessment of Significance for Short-Term Process Contribution of NO2
Short Term PC ST PC % of EQS < 20 %?
NOx 99.79%ile (ug/m3) Hourly Average 200 16.10 183.90 21.0189 11% Yes
POLLUTANT PARAMETER
Environmental
Quality Standard
(EQS)
Background
Concentration
x 2
Revised EQSSecondary Assessment of Significance
Note: Although the maximum 24-hourly average Process Contribution of NOx is not screened as insignificant in Table 1, this is an ecological quality standard and hence is not necessarily applicable to the point of maximum concentration across the grid. Further assessments of ecological impacts are made in Table 6D.
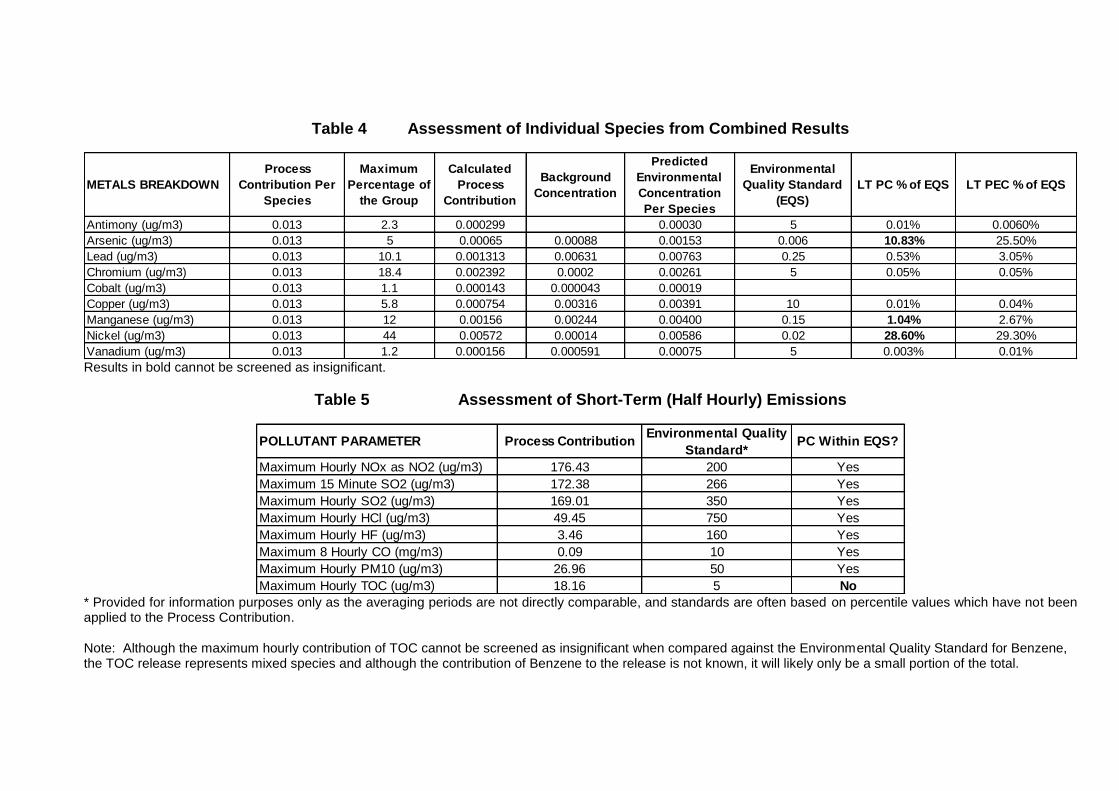
Table 4 Assessment of Individual Species from Combined Results
METALS BREAKDOWN
Process
Contribution Per
Species
Maximum
Percentage of
the Group
Calculated
Process
Contribution
Background
Concentration
Predicted
Environmental
Concentration
Per Species
Environmental
Quality Standard
(EQS)
LT PC % of EQS LT PEC % of EQS
Antimony (ug/m3) 0.013 2.3 0.000299 0.00030 5 0.01% 0.0060%
Arsenic (ug/m3) 0.013 5 0.00065 0.00088 0.00153 0.006 10.83% 25.50%
Lead (ug/m3) 0.013 10.1 0.001313 0.00631 0.00763 0.25 0.53% 3.05%
Chromium (ug/m3) 0.013 18.4 0.002392 0.0002 0.00261 5 0.05% 0.05%
Cobalt (ug/m3) 0.013 1.1 0.000143 0.000043 0.00019
Copper (ug/m3) 0.013 5.8 0.000754 0.00316 0.00391 10 0.01% 0.04%
Manganese (ug/m3) 0.013 12 0.00156 0.00244 0.00400 0.15 1.04% 2.67%
Nickel (ug/m3) 0.013 44 0.00572 0.00014 0.00586 0.02 28.60% 29.30%
Vanadium (ug/m3) 0.013 1.2 0.000156 0.000591 0.00075 5 0.003% 0.01% Results in bold cannot be screened as insignificant.
Table 5 Assessment of Short-Term (Half Hourly) Emissions
POLLUTANT PARAMETER Process ContributionEnvironmental Quality
Standard*PC Within EQS?
Maximum Hourly NOx as NO2 (ug/m3) 176.43 200 Yes
Maximum 15 Minute SO2 (ug/m3) 172.38 266 Yes
Maximum Hourly SO2 (ug/m3) 169.01 350 Yes
Maximum Hourly HCl (ug/m3) 49.45 750 Yes
Maximum Hourly HF (ug/m3) 3.46 160 Yes
Maximum 8 Hourly CO (mg/m3) 0.09 10 Yes
Maximum Hourly PM10 (ug/m3) 26.96 50 Yes
Maximum Hourly TOC (ug/m3) 18.16 5 No * Provided for information purposes only as the averaging periods are not directly comparable, and standards are often based on percentile values which have not been applied to the Process Contribution. Note: Although the maximum hourly contribution of TOC cannot be screened as insignificant when compared against the Environmental Quality Standard for Benzene, the TOC release represents mixed species and although the contribution of Benzene to the release is not known, it will likely only be a small portion of the total.
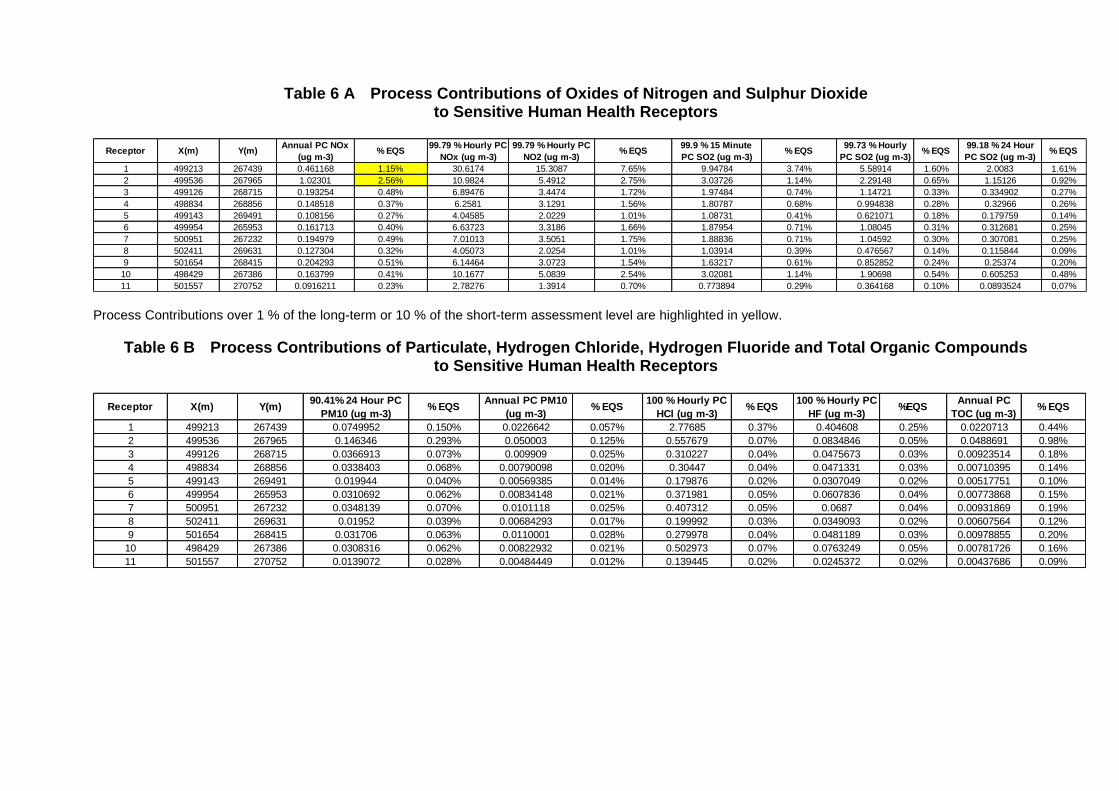
Table 6 A Process Contributions of Oxides of Nitrogen and Sulphur Dioxide
to Sensitive Human Health Receptors
Receptor X(m) Y(m)Annual PC NOx
(ug m-3)% EQS
99.79 % Hourly PC
NOx (ug m-3)
99.79 % Hourly PC
NO2 (ug m-3)% EQS
99.9 % 15 Minute
PC SO2 (ug m-3)% EQS
99.73 % Hourly
PC SO2 (ug m-3)% EQS
99.18 % 24 Hour
PC SO2 (ug m-3)% EQS
1 499213 267439 0.461168 1.15% 30.6174 15.3087 7.65% 9.94784 3.74% 5.58914 1.60% 2.0083 1.61%
2 499536 267965 1.02301 2.56% 10.9824 5.4912 2.75% 3.03726 1.14% 2.29148 0.65% 1.15126 0.92%
3 499126 268715 0.193254 0.48% 6.89476 3.4474 1.72% 1.97484 0.74% 1.14721 0.33% 0.334902 0.27%
4 498834 268856 0.148518 0.37% 6.2581 3.1291 1.56% 1.80787 0.68% 0.994838 0.28% 0.32966 0.26%
5 499143 269491 0.108156 0.27% 4.04585 2.0229 1.01% 1.08731 0.41% 0.621071 0.18% 0.179759 0.14%
6 499954 265953 0.161713 0.40% 6.63723 3.3186 1.66% 1.87954 0.71% 1.08045 0.31% 0.312681 0.25%
7 500951 267232 0.194979 0.49% 7.01013 3.5051 1.75% 1.88836 0.71% 1.04592 0.30% 0.307081 0.25%
8 502411 269631 0.127304 0.32% 4.05073 2.0254 1.01% 1.03914 0.39% 0.476567 0.14% 0.115844 0.09%
9 501654 268415 0.204293 0.51% 6.14464 3.0723 1.54% 1.63217 0.61% 0.852852 0.24% 0.25374 0.20%
10 498429 267386 0.163799 0.41% 10.1677 5.0839 2.54% 3.02081 1.14% 1.90698 0.54% 0.605253 0.48%
11 501557 270752 0.0916211 0.23% 2.78276 1.3914 0.70% 0.773894 0.29% 0.364168 0.10% 0.0893524 0.07% Process Contributions over 1 % of the long-term or 10 % of the short-term assessment level are highlighted in yellow.
Table 6 B Process Contributions of Particulate, Hydrogen Chloride, Hydrogen Fluoride and Total Organic Compounds to Sensitive Human Health Receptors
Receptor X(m) Y(m)90.41% 24 Hour PC
PM10 (ug m-3)% EQS
Annual PC PM10
(ug m-3)% EQS
100 % Hourly PC
HCl (ug m-3)% EQS
100 % Hourly PC
HF (ug m-3)%EQS
Annual PC
TOC (ug m-3)% EQS
1 499213 267439 0.0749952 0.150% 0.0226642 0.057% 2.77685 0.37% 0.404608 0.25% 0.0220713 0.44%
2 499536 267965 0.146346 0.293% 0.050003 0.125% 0.557679 0.07% 0.0834846 0.05% 0.0488691 0.98%
3 499126 268715 0.0366913 0.073% 0.009909 0.025% 0.310227 0.04% 0.0475673 0.03% 0.00923514 0.18%
4 498834 268856 0.0338403 0.068% 0.00790098 0.020% 0.30447 0.04% 0.0471331 0.03% 0.00710395 0.14%
5 499143 269491 0.019944 0.040% 0.00569385 0.014% 0.179876 0.02% 0.0307049 0.02% 0.00517751 0.10%
6 499954 265953 0.0310692 0.062% 0.00834148 0.021% 0.371981 0.05% 0.0607836 0.04% 0.00773868 0.15%
7 500951 267232 0.0348139 0.070% 0.0101118 0.025% 0.407312 0.05% 0.0687 0.04% 0.00931869 0.19%
8 502411 269631 0.01952 0.039% 0.00684293 0.017% 0.199992 0.03% 0.0349093 0.02% 0.00607564 0.12%
9 501654 268415 0.031706 0.063% 0.0110001 0.028% 0.279978 0.04% 0.0481189 0.03% 0.00978855 0.20%
10 498429 267386 0.0308316 0.062% 0.00822932 0.021% 0.502973 0.07% 0.0763249 0.05% 0.00781726 0.16%
11 501557 270752 0.0139072 0.028% 0.00484449 0.012% 0.139445 0.02% 0.0245372 0.02% 0.00437686 0.09%
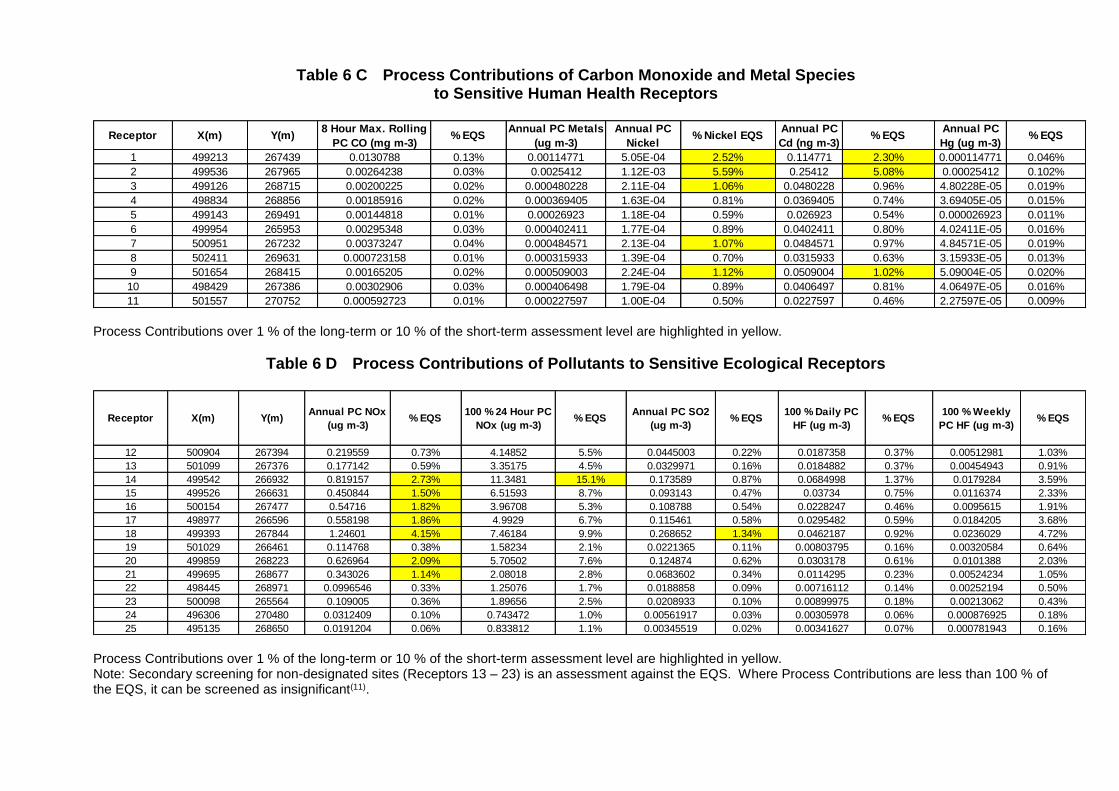
Table 6 C Process Contributions of Carbon Monoxide and Metal Species to Sensitive Human Health Receptors
Receptor X(m) Y(m)8 Hour Max. Rolling
PC CO (mg m-3)% EQS
Annual PC Metals
(ug m-3)
Annual PC
Nickel% Nickel EQS
Annual PC
Cd (ng m-3)% EQS
Annual PC
Hg (ug m-3)% EQS
1 499213 267439 0.0130788 0.13% 0.00114771 5.05E-04 2.52% 0.114771 2.30% 0.000114771 0.046%
2 499536 267965 0.00264238 0.03% 0.0025412 1.12E-03 5.59% 0.25412 5.08% 0.00025412 0.102%
3 499126 268715 0.00200225 0.02% 0.000480228 2.11E-04 1.06% 0.0480228 0.96% 4.80228E-05 0.019%
4 498834 268856 0.00185916 0.02% 0.000369405 1.63E-04 0.81% 0.0369405 0.74% 3.69405E-05 0.015%
5 499143 269491 0.00144818 0.01% 0.00026923 1.18E-04 0.59% 0.026923 0.54% 0.000026923 0.011%
6 499954 265953 0.00295348 0.03% 0.000402411 1.77E-04 0.89% 0.0402411 0.80% 4.02411E-05 0.016%
7 500951 267232 0.00373247 0.04% 0.000484571 2.13E-04 1.07% 0.0484571 0.97% 4.84571E-05 0.019%
8 502411 269631 0.000723158 0.01% 0.000315933 1.39E-04 0.70% 0.0315933 0.63% 3.15933E-05 0.013%
9 501654 268415 0.00165205 0.02% 0.000509003 2.24E-04 1.12% 0.0509004 1.02% 5.09004E-05 0.020%
10 498429 267386 0.00302906 0.03% 0.000406498 1.79E-04 0.89% 0.0406497 0.81% 4.06497E-05 0.016%
11 501557 270752 0.000592723 0.01% 0.000227597 1.00E-04 0.50% 0.0227597 0.46% 2.27597E-05 0.009% Process Contributions over 1 % of the long-term or 10 % of the short-term assessment level are highlighted in yellow.
Table 6 D Process Contributions of Pollutants to Sensitive Ecological Receptors
Receptor X(m) Y(m)Annual PC NOx
(ug m-3)% EQS
100 % 24 Hour PC
NOx (ug m-3)% EQS
Annual PC SO2
(ug m-3)% EQS
100 % Daily PC
HF (ug m-3)% EQS
100 % Weekly
PC HF (ug m-3)% EQS
12 500904 267394 0.219559 0.73% 4.14852 5.5% 0.0445003 0.22% 0.0187358 0.37% 0.00512981 1.03%
13 501099 267376 0.177142 0.59% 3.35175 4.5% 0.0329971 0.16% 0.0184882 0.37% 0.00454943 0.91%
14 499542 266932 0.819157 2.73% 11.3481 15.1% 0.173589 0.87% 0.0684998 1.37% 0.0179284 3.59%
15 499526 266631 0.450844 1.50% 6.51593 8.7% 0.093143 0.47% 0.03734 0.75% 0.0116374 2.33%
16 500154 267477 0.54716 1.82% 3.96708 5.3% 0.108788 0.54% 0.0228247 0.46% 0.0095615 1.91%
17 498977 266596 0.558198 1.86% 4.9929 6.7% 0.115461 0.58% 0.0295482 0.59% 0.0184205 3.68%
18 499393 267844 1.24601 4.15% 7.46184 9.9% 0.268652 1.34% 0.0462187 0.92% 0.0236029 4.72%
19 501029 266461 0.114768 0.38% 1.58234 2.1% 0.0221365 0.11% 0.00803795 0.16% 0.00320584 0.64%
20 499859 268223 0.626964 2.09% 5.70502 7.6% 0.124874 0.62% 0.0303178 0.61% 0.0101388 2.03%
21 499695 268677 0.343026 1.14% 2.08018 2.8% 0.0683602 0.34% 0.0114295 0.23% 0.00524234 1.05%
22 498445 268971 0.0996546 0.33% 1.25076 1.7% 0.0188858 0.09% 0.00716112 0.14% 0.00252194 0.50%
23 500098 265564 0.109005 0.36% 1.89656 2.5% 0.0208933 0.10% 0.00899975 0.18% 0.00213062 0.43%
24 496306 270480 0.0312409 0.10% 0.743472 1.0% 0.00561917 0.03% 0.00305978 0.06% 0.000876925 0.18%
25 495135 268650 0.0191204 0.06% 0.833812 1.1% 0.00345519 0.02% 0.00341627 0.07% 0.000781943 0.16% Process Contributions over 1 % of the long-term or 10 % of the short-term assessment level are highlighted in yellow. Note: Secondary screening for non-designated sites (Receptors 13 – 23) is an assessment against the EQS. Where Process Contributions are less than 100 % of the EQS, it can be screened as insignificant(11).
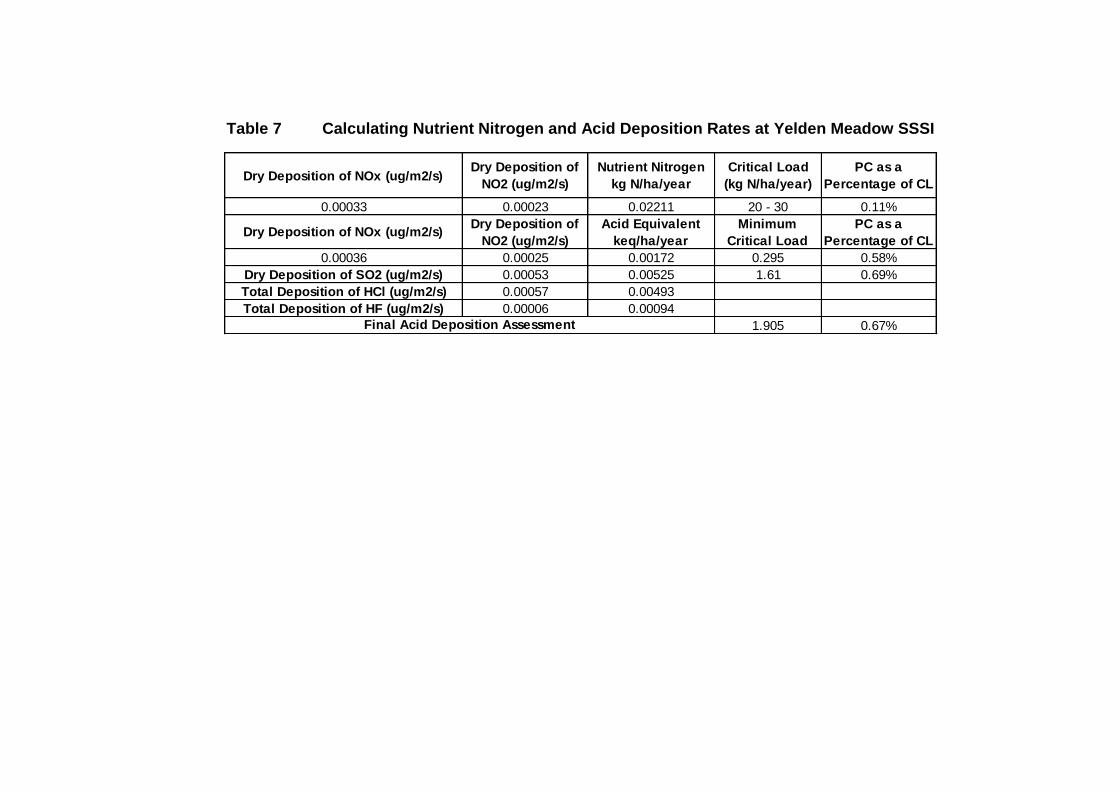
Table 7 Calculating Nutrient Nitrogen and Acid Deposition Rates at Yelden Meadow SSSI
Dry Deposition of NOx (ug/m2/s)Dry Deposition of
NO2 (ug/m2/s)
Nutrient Nitrogen
kg N/ha/year
Critical Load
(kg N/ha/year)
PC as a
Percentage of CL
0.00033 0.00023 0.02211 20 - 30 0.11%
Dry Deposition of NOx (ug/m2/s)Dry Deposition of
NO2 (ug/m2/s)
Acid Equivalent
keq/ha/year
Minimum
Critical Load
PC as a
Percentage of CL
0.00036 0.00025 0.00172 0.295 0.58%
Dry Deposition of SO2 (ug/m2/s) 0.00053 0.00525 1.61 0.69%
Total Deposition of HCl (ug/m2/s) 0.00057 0.00493
Total Deposition of HF (ug/m2/s) 0.00006 0.00094
1.905 0.67%Final Acid Deposition Assessment

FIGURES
Figures of normal operational conditions with all kilns discharging through a 35 m high stack.
Base map reproduced by kind permission of Ordnance Survey On behalf of the Controller of Her Majesty’s Stationary Office, © Crown Copyright 100055158
Environmental Visage Limited.
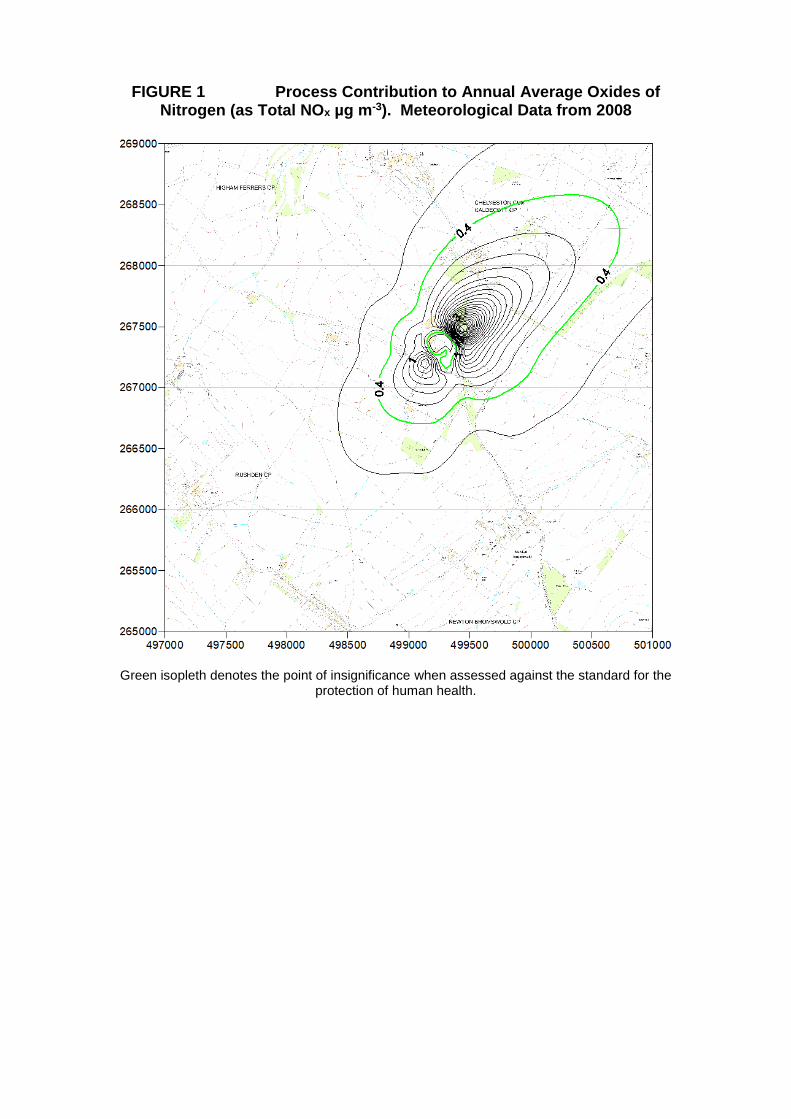
FIGURE 1 Process Contribution to Annual Average Oxides of
Nitrogen (as Total NOx µg m-3). Meteorological Data from 2008
Green isopleth denotes the point of insignificance when assessed against the standard for the protection of human health.
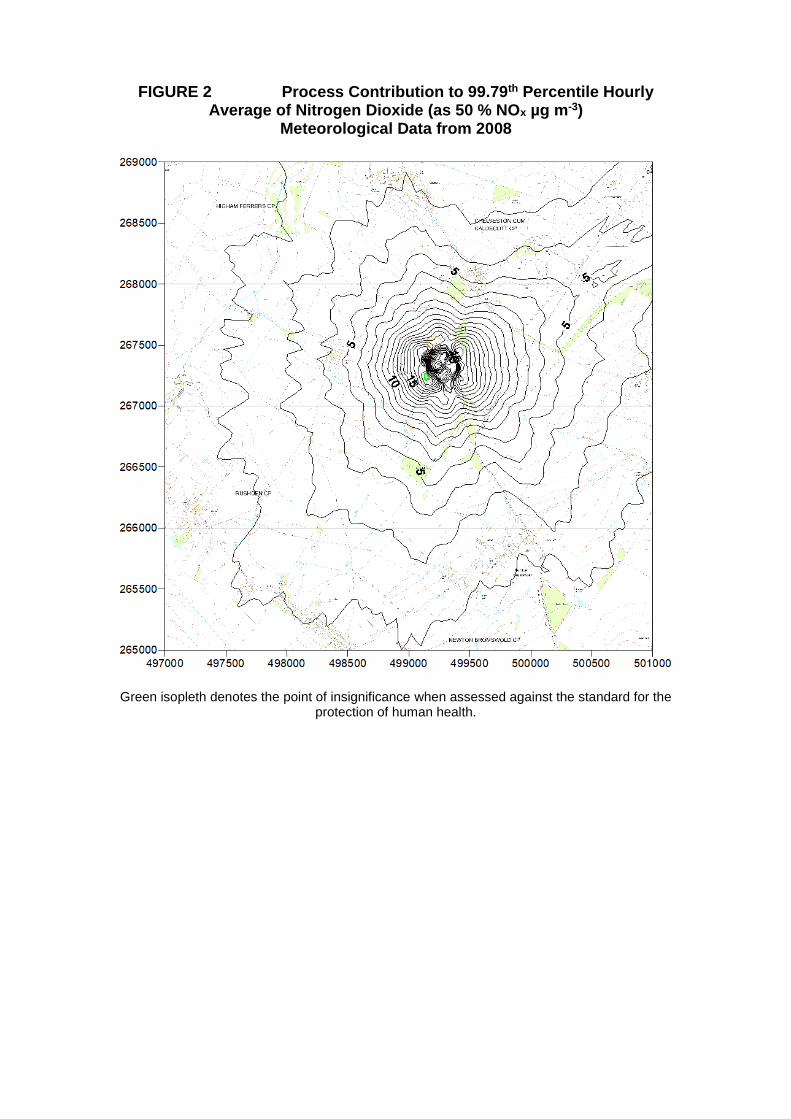
FIGURE 2 Process Contribution to 99.79th Percentile Hourly
Average of Nitrogen Dioxide (as 50 % NOx µg m-3) Meteorological Data from 2008
Green isopleth denotes the point of insignificance when assessed against the standard for the protection of human health.
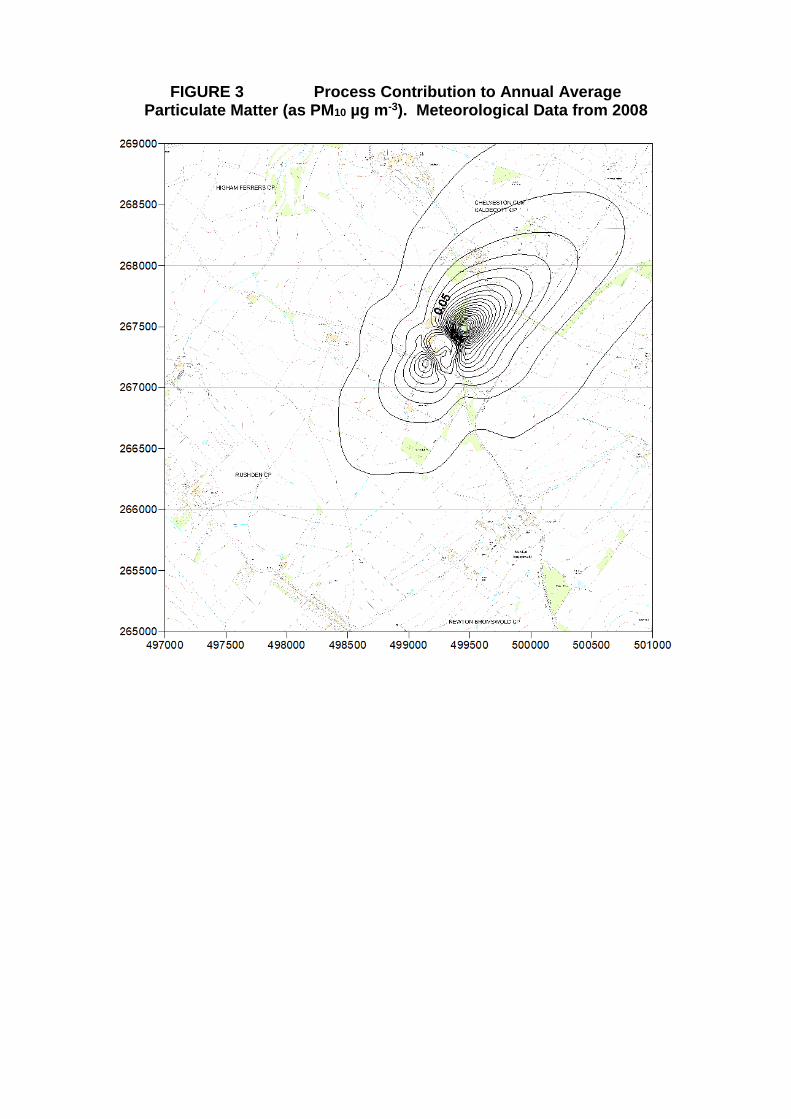
FIGURE 3 Process Contribution to Annual Average
Particulate Matter (as PM10 µg m-3). Meteorological Data from 2008
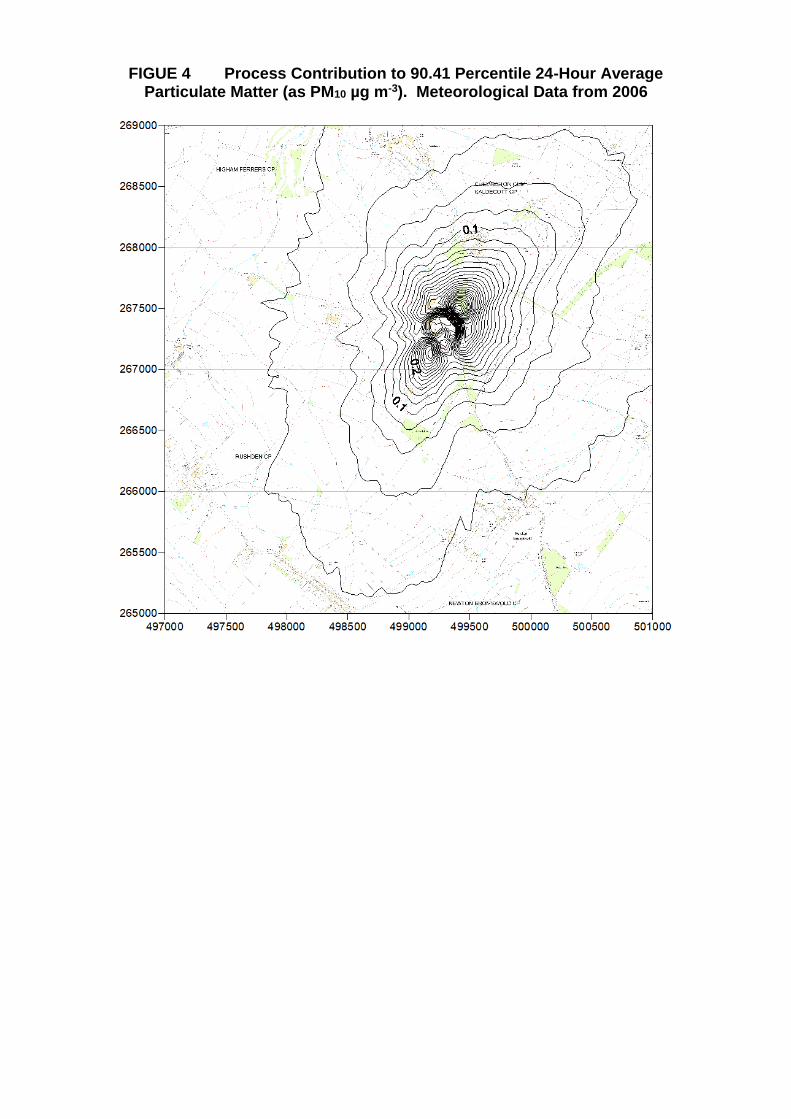
FIGUE 4 Process Contribution to 90.41 Percentile 24-Hour Average Particulate Matter (as PM10 µg m-3). Meteorological Data from 2006
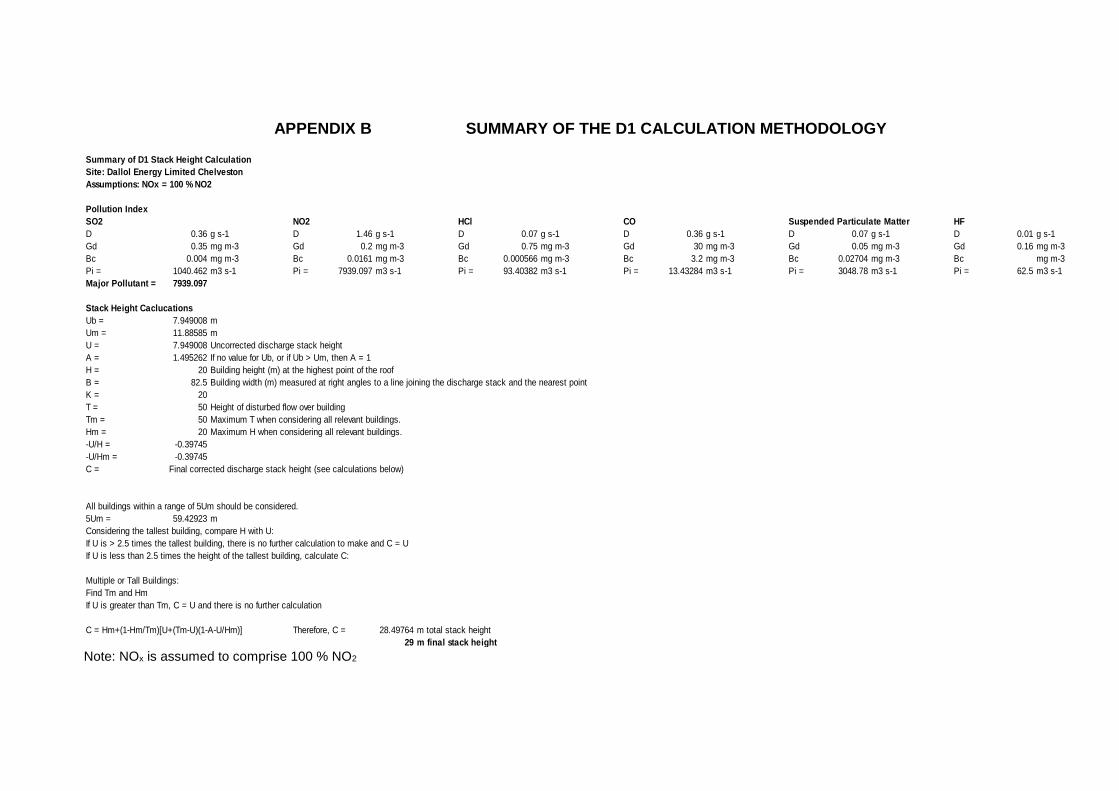
APPENDIX B SUMMARY OF THE D1 CALCULATION METHODOLOGY Summary of D1 Stack Height Calculation
Site: Dallol Energy Limited Chelveston
Assumptions: NOx = 100 % NO2
Pollution Index
SO2 NO2 HCl CO Suspended Particulate Matter HF
D 0.36 g s-1 D 1.46 g s-1 D 0.07 g s-1 D 0.36 g s-1 D 0.07 g s-1 D 0.01 g s-1
Gd 0.35 mg m-3 Gd 0.2 mg m-3 Gd 0.75 mg m-3 Gd 30 mg m-3 Gd 0.05 mg m-3 Gd 0.16 mg m-3
Bc 0.004 mg m-3 Bc 0.0161 mg m-3 Bc 0.000566 mg m-3 Bc 3.2 mg m-3 Bc 0.02704 mg m-3 Bc mg m-3
Pi = 1040.462 m3 s-1 Pi = 7939.097 m3 s-1 Pi = 93.40382 m3 s-1 Pi = 13.43284 m3 s-1 Pi = 3048.78 m3 s-1 Pi = 62.5 m3 s-1
Major Pollutant = 7939.097
Stack Height Caclucations
Ub = 7.949008 m
Um = 11.88585 m
U = 7.949008 Uncorrected discharge stack height
A = 1.495262 If no value for Ub, or if Ub > Um, then A = 1
H = 20 Building height (m) at the highest point of the roof
B = 82.5 Building width (m) measured at right angles to a line joining the discharge stack and the nearest point
K = 20
T = 50 Height of disturbed flow over building
Tm = 50 Maximum T when considering all relevant buildings.
Hm = 20 Maximum H when considering all relevant buildings.
-U/H = -0.39745
-U/Hm = -0.39745
C = Final corrected discharge stack height (see calculations below)
All buildings within a range of 5Um should be considered.
5Um = 59.42923 m
Considering the tallest building, compare H with U:
If U is > 2.5 times the tallest building, there is no further calculation to make and C = U
If U is less than 2.5 times the height of the tallest building, calculate C:
Multiple or Tall Buildings:
Find Tm and Hm
If U is greater than Tm, C = U and there is no further calculation
C = Hm+(1-Hm/Tm)[U+(Tm-U)(1-A-U/Hm)] Therefore, C = 28.49764 m total stack height
29 m final stack height Note: NOx is assumed to comprise 100 % NO2
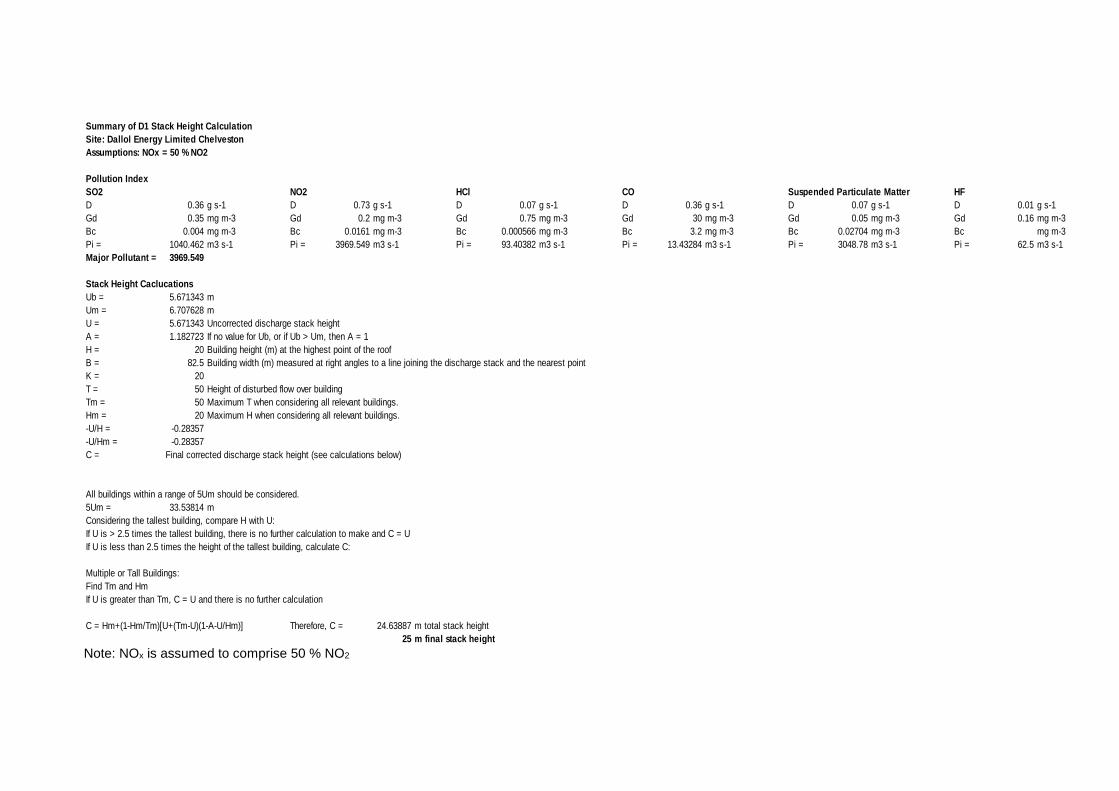
Summary of D1 Stack Height Calculation
Site: Dallol Energy Limited Chelveston
Assumptions: NOx = 50 % NO2
Pollution Index
SO2 NO2 HCl CO Suspended Particulate Matter HF
D 0.36 g s-1 D 0.73 g s-1 D 0.07 g s-1 D 0.36 g s-1 D 0.07 g s-1 D 0.01 g s-1
Gd 0.35 mg m-3 Gd 0.2 mg m-3 Gd 0.75 mg m-3 Gd 30 mg m-3 Gd 0.05 mg m-3 Gd 0.16 mg m-3
Bc 0.004 mg m-3 Bc 0.0161 mg m-3 Bc 0.000566 mg m-3 Bc 3.2 mg m-3 Bc 0.02704 mg m-3 Bc mg m-3
Pi = 1040.462 m3 s-1 Pi = 3969.549 m3 s-1 Pi = 93.40382 m3 s-1 Pi = 13.43284 m3 s-1 Pi = 3048.78 m3 s-1 Pi = 62.5 m3 s-1
Major Pollutant = 3969.549
Stack Height Caclucations
Ub = 5.671343 m
Um = 6.707628 m
U = 5.671343 Uncorrected discharge stack height
A = 1.182723 If no value for Ub, or if Ub > Um, then A = 1
H = 20 Building height (m) at the highest point of the roof
B = 82.5 Building width (m) measured at right angles to a line joining the discharge stack and the nearest point
K = 20
T = 50 Height of disturbed flow over building
Tm = 50 Maximum T when considering all relevant buildings.
Hm = 20 Maximum H when considering all relevant buildings.
-U/H = -0.28357
-U/Hm = -0.28357
C = Final corrected discharge stack height (see calculations below)
All buildings within a range of 5Um should be considered.
5Um = 33.53814 m
Considering the tallest building, compare H with U:
If U is > 2.5 times the tallest building, there is no further calculation to make and C = U
If U is less than 2.5 times the height of the tallest building, calculate C:
Multiple or Tall Buildings:
Find Tm and Hm
If U is greater than Tm, C = U and there is no further calculation
C = Hm+(1-Hm/Tm)[U+(Tm-U)(1-A-U/Hm)] Therefore, C = 24.63887 m total stack height
25 m final stack height Note: NOx is assumed to comprise 50 % NO2