Embed Size (px)
Citation preview
Atmospheric dispersion modelling withAERMOD for comparative impact assessmentof different pollutant emission sources in anAlpine valley
E. Tomasi1,2, G. Antonacci3, L. Giovannini1,2, D. Zardi1,2 &M. Ragazzi1
1Department of Civil, Environmental and Mechanical Engineering,University of Trento, Italy2National Consortium of Universities for Atmospheric and HydrosphericPhysics (CINFAI), Rome, Italy3CISMA - Centro di Ingegneria e Sviluppo Modelli per l’Ambiente,Bolzano, Italy
Abstract
High-resolution simulations are performed with the AERMOD dispersion modelto assess the impact on air quality in the area surrounding the town of Vipiteno,in the Alps, from the main pollutant sources: the Brenner motorway, the townof Vipiteno, three major industrial plants and a big parking lot. The combinationof terrain complexity and specific emission sources makes the air pollution loadparticularly critical for such a valley environment. AERMOD is run with a spatialresolution of 25 m and fed with specific meteorological data and emission factors,modulated according to hourly and seasonal emission patterns. The resultingannual means of NO2 and PM10 concentration are validated against measurementsfrom a local air quality station and then compared with the limits set by legalprovisions. Finally, the contributions of single sources are analysed, highlightingtheir relative relevance to the pollution load of the area.Keywords: atmospheric dispersion modelling, AERMOD, complex terrain,atmospheric emission, idling vehicles.
Air Pollution XXIII 431
www.witpress.com, ISSN 1743-3541 (on-line) WIT Transactions on Ecology and The Environment, Vol 198, © 2015 WIT Press
doi:10.2495/AIR150371
1 Introduction
Air quality assessment over complex terrain is a delicate issue, especially whenmany different sources of pollutants act simultaneously. In this context, air qualitymodelling is a crucial tool to evaluate the spatial distribution of the overallpollutant concentration. In particular, the AERMOD model (from the AMS/USEPA, [1]) suits the need for applications at local scales, over complex terrain [2].Nevertheless, great attention must also be paid to the meteorological and emissionrate input data fed to the model, which significantly affect simulation results. Ingeneral, meteorological input data can be obtained from a reliable weather stationlocated within the area of interest, or from simulations with a meteorologicalnumerical model (e.g. Kesarkara et al. [3]). On the other hand, emission ratedata are usually difficult to find and their uncertainty is usually high, varyingsignificantly among different sources. The best practices for the estimation ofemission rates from diffuse sources are reported in the European EnvironmentAgency (EEA) guidelines [4], which were used to develop the regional ItalianINEMAR emission inventory [5]. Considering the emissions from linear sources,such as road networks, a reference method is the COPERT model [6], while nostandard approach exists in literature concerning the calculation of idling vehicleemissions. However, some examples are found in Rahman et al. andShancita et al. [8].
2 Study area
The present study focuses on the area surrounding Vipiteno, a small town in theNorth Eastern Italian Alps, close to the Austrian border. This area is particularlyinteresting for the interaction between a complex geomorphological configurationand several relevant pollution sources. Vipiteno, indeed, is located in a basin at950 m above mean sea level in the Isarco Valley, which runs from north to south,at its connection with two lateral valleys, the Ridanna Valley and the Vizze Valley,on its western and eastern sides respectively. The main pollutant source in thisarea is the motorway axis (A22) leading to the Brenner pass and running alongthe Isarco Valley. Besides the air pollution load caused by this major source,the emissions from domestic, manufacturing and industrial settlements as well asfrom secondary traffic are also relevant. The present study also takes into accountthe emissions produced by a big parking lot which might be relevant due to itsdimensions and location. Figure 1 shows the area of Vipiteno and the location ofthe main pollution sources taken into account in the present work. The weatherand air quality stations, providing meteorological and concentration data used torun the simulation and to validate model results, respectively, are also shown.
3 Model set-up
In the present study the AERMOD [1] model is used to evaluate the impact on airquality of different emission sources in terms of NOx and PM10. AERMOD is an
432 Air Pollution XXIII
www.witpress.com, ISSN 1743-3541 (on-line) WIT Transactions on Ecology and The Environment, Vol 198, © 2015 WIT Press
[7]
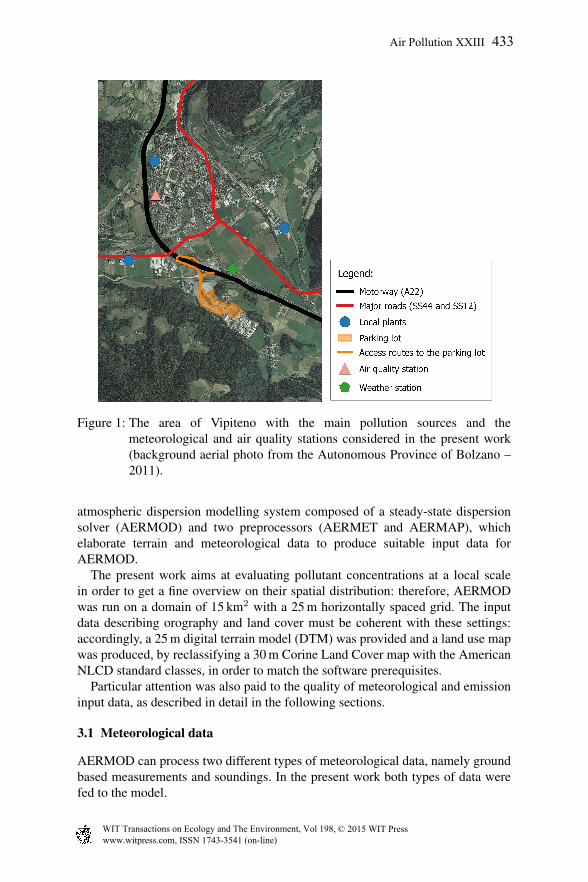
Figure 1: The area of Vipiteno with the main pollution sources and themeteorological and air quality stations considered in the present work(background aerial photo from the Autonomous Province of Bolzano –2011).
atmospheric dispersion modelling system composed of a steady-state dispersionsolver (AERMOD) and two preprocessors (AERMET and AERMAP), whichelaborate terrain and meteorological data to produce suitable input data forAERMOD.
The present work aims at evaluating pollutant concentrations at a local scalein order to get a fine overview on their spatial distribution: therefore, AERMODwas run on a domain of 15 km2 with a 25 m horizontally spaced grid. The inputdata describing orography and land cover must be coherent with these settings:accordingly, a 25 m digital terrain model (DTM) was provided and a land use mapwas produced, by reclassifying a 30 m Corine Land Cover map with the AmericanNLCD standard classes, in order to match the software prerequisites.
Particular attention was also paid to the quality of meteorological and emissioninput data, as described in detail in the following sections.
3.1 Meteorological data
AERMOD can process two different types of meteorological data, namely groundbased measurements and soundings. In the present work both types of data werefed to the model.
Air Pollution XXIII 433
www.witpress.com, ISSN 1743-3541 (on-line) WIT Transactions on Ecology and The Environment, Vol 198, © 2015 WIT Press
The reference weather station chosen to run the AERMOD simulation isrepresentative for the meteorological conditions of the area, as its data are scarcelyaffected by local effects. It is operated by the local weather service and has beenworking since 1999: data were validated and compared with observations fromother meteorological stations within the area. After the validation process, thedata recorded in 2012 were chosen for the AERMOD simulation, considering theconsistency, the continuity and the age of the data.
Information passed to the model includes global insolation, pressure,temperature, wind speed and direction and relative humidity. All the variables aremeasured at 10 m above ground level, with a 10 min time resolution (except for thetemperature, recorded each hour), and were fed to the model as hourly averages.
Due to the lack of vertical soundings close to the area of interest, near groundmeasurements taken at different elevations were used to produce 2-level pseudo-vertical soundings. The two stations used to this scope are Ladurns and AnticimaCima Libera, respectively located at 1960 and 3399 m above mean sea level. Thesemeteorological stations provided information on the vertical profile of temperatureand wind direction and speed.
3.2 Emission sources
In the present work, four major pollutant emission sources are taken into account,namely: the town of Vipiteno, the main road network, the major local industriesand a parking lot, offering park spaces for up to 260 trucks and 50 cars. Each ofthese sources was analysed in detail in order to properly evaluate its influence onthe overall pollutant concentration.
3.2.1 Town of VipitenoPollutant emissions from the town of Vipiteno are primarily due to an intensive useof biomass for house heating (as no gas pipeline is available in the area) and thendue to secondary traffic and small manufacturing industry. Emission rates for thissource were evaluated starting from the Regional air pollutant emission inventory(INEMAR 2010 [5]): the inventory allows to calculate an average emission ratefor each municipality, taking into account its specific activities and small scaleindustry (i.e. those not accounted for explicitly) and weighting them accordingto the number of people involved, the production volume, etc. The emission rateof Vipiteno was modelled as an annual mean value with temporal and spatialmodulations. The latter was estimated from data coming from the 2011 populationcensus, weighting the overall emission rate considering the population densityof each census tract. On the other hand, the temporal modulation was evaluatedconsidering the evolution in time of the main activities taken into account: thehouse heating and the secondary traffic. House heating is strongly characterizedby seasonal and hourly cycles, while secondary traffic mainly varies per hour-of-day and day-of-week. These different patterns were conveniently combined byweighting them on the basis of each activity contribution to the total amount ofemission rate, according to the INEMAR emission inventory.
434 Air Pollution XXIII
www.witpress.com, ISSN 1743-3541 (on-line) WIT Transactions on Ecology and The Environment, Vol 198, © 2015 WIT Press
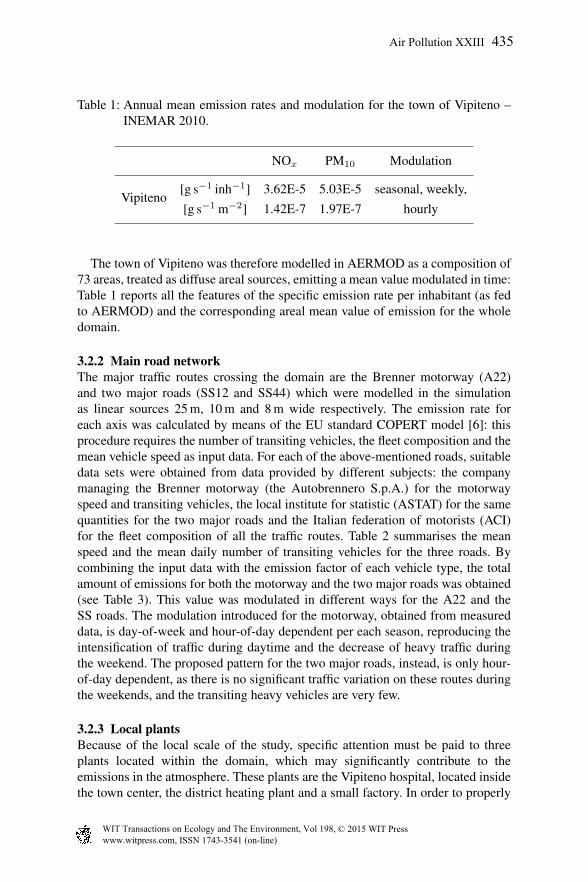
Table 1: Annual mean emission rates and modulation for the town of Vipiteno –INEMAR 2010.
NOx PM10 Modulation
Vipiteno[g s−1 inh−1] 3.62E-5 5.03E-5 seasonal, weekly,[g s−1 m−2] 1.42E-7 1.97E-7 hourly
The town of Vipiteno was therefore modelled in AERMOD as a composition of73 areas, treated as diffuse areal sources, emitting a mean value modulated in time:Table 1 reports all the features of the specific emission rate per inhabitant (as fedto AERMOD) and the corresponding areal mean value of emission for the wholedomain.
3.2.2 Main road networkThe major traffic routes crossing the domain are the Brenner motorway (A22)and two major roads (SS12 and SS44) which were modelled in the simulationas linear sources 25 m, 10 m and 8 m wide respectively. The emission rate foreach axis was calculated by means of the EU standard COPERT model [6]: thisprocedure requires the number of transiting vehicles, the fleet composition and themean vehicle speed as input data. For each of the above-mentioned roads, suitabledata sets were obtained from data provided by different subjects: the companymanaging the Brenner motorway (the Autobrennero S.p.A.) for the motorwayspeed and transiting vehicles, the local institute for statistic (ASTAT) for the samequantities for the two major roads and the Italian federation of motorists (ACI)for the fleet composition of all the traffic routes. Table 2 summarises the meanspeed and the mean daily number of transiting vehicles for the three roads. Bycombining the input data with the emission factor of each vehicle type, the totalamount of emissions for both the motorway and the two major roads was obtained(see Table 3). This value was modulated in different ways for the A22 and theSS roads. The modulation introduced for the motorway, obtained from measureddata, is day-of-week and hour-of-day dependent per each season, reproducing theintensification of traffic during daytime and the decrease of heavy traffic duringthe weekend. The proposed pattern for the two major roads, instead, is only hour-of-day dependent, as there is no significant traffic variation on these routes duringthe weekends, and the transiting heavy vehicles are very few.
3.2.3 Local plantsBecause of the local scale of the study, specific attention must be paid to threeplants located within the domain, which may significantly contribute to theemissions in the atmosphere. These plants are the Vipiteno hospital, located insidethe town center, the district heating plant and a small factory. In order to properly
Air Pollution XXIII 435
www.witpress.com, ISSN 1743-3541 (on-line) WIT Transactions on Ecology and The Environment, Vol 198, © 2015 WIT Press
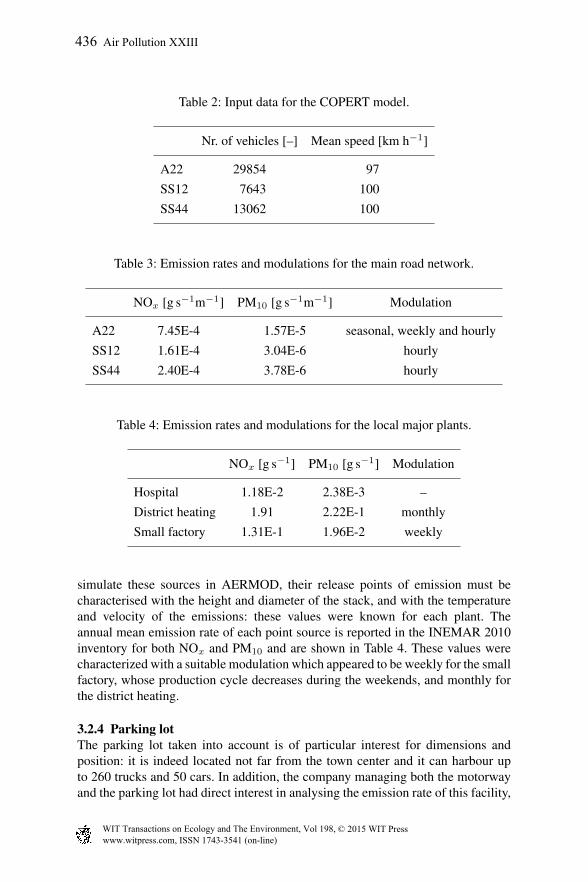
Table 2: Input data for the COPERT model.
Nr. of vehicles [–] Mean speed [km h−1]
A22 29854 97SS12 7643 100SS44 13062 100
Table 3: Emission rates and modulations for the main road network.
NOx [g s−1m−1] PM10 [g s−1m−1] Modulation
A22 7.45E-4 1.57E-5 seasonal, weekly and hourlySS12 1.61E-4 3.04E-6 hourlySS44 2.40E-4 3.78E-6 hourly
Table 4: Emission rates and modulations for the local major plants.
NOx [g s−1] PM10 [g s−1] Modulation
Hospital 1.18E-2 2.38E-3 –District heating 1.91 2.22E-1 monthlySmall factory 1.31E-1 1.96E-2 weekly
simulate these sources in AERMOD, their release points of emission must becharacterised with the height and diameter of the stack, and with the temperatureand velocity of the emissions: these values were known for each plant. Theannual mean emission rate of each point source is reported in the INEMAR 2010inventory for both NOx and PM10 and are shown in Table 4. These values werecharacterized with a suitable modulation which appeared to be weekly for the smallfactory, whose production cycle decreases during the weekends, and monthly forthe district heating.
3.2.4 Parking lotThe parking lot taken into account is of particular interest for dimensions andposition: it is indeed located not far from the town center and it can harbour upto 260 trucks and 50 cars. In addition, the company managing both the motorwayand the parking lot had direct interest in analysing the emission rate of this facility,
436 Air Pollution XXIII
www.witpress.com, ISSN 1743-3541 (on-line) WIT Transactions on Ecology and The Environment, Vol 198, © 2015 WIT Press
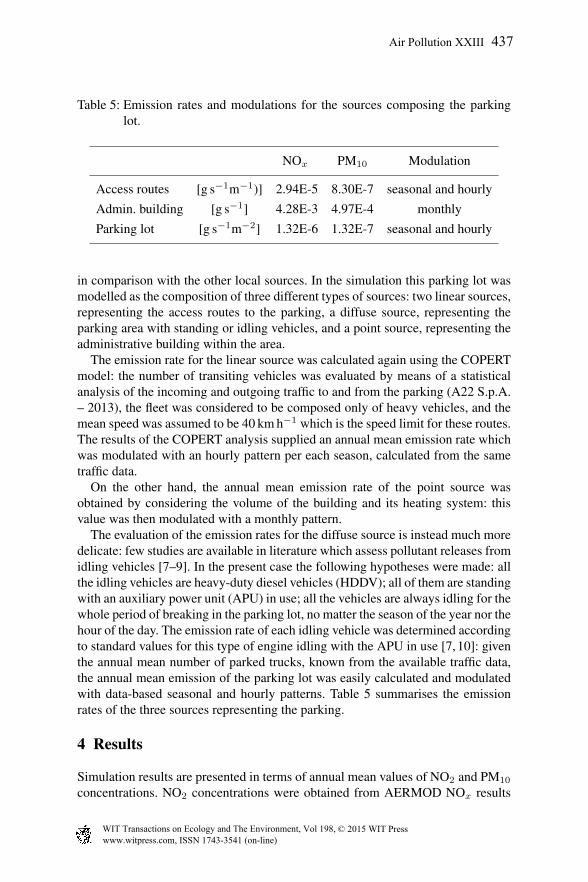
Table 5: Emission rates and modulations for the sources composing the parkinglot.
NOx PM10 Modulation
Access routes [g s−1m−1)] 2.94E-5 8.30E-7 seasonal and hourlyAdmin. building [g s−1] 4.28E-3 4.97E-4 monthlyParking lot [g s−1m−2] 1.32E-6 1.32E-7 seasonal and hourly
in comparison with the other local sources. In the simulation this parking lot wasmodelled as the composition of three different types of sources: two linear sources,representing the access routes to the parking, a diffuse source, representing theparking area with standing or idling vehicles, and a point source, representing theadministrative building within the area.
The emission rate for the linear source was calculated again using the COPERTmodel: the number of transiting vehicles was evaluated by means of a statisticalanalysis of the incoming and outgoing traffic to and from the parking (A22 S.p.A.– 2013), the fleet was considered to be composed only of heavy vehicles, and themean speed was assumed to be 40 km h−1 which is the speed limit for these routes.The results of the COPERT analysis supplied an annual mean emission rate whichwas modulated with an hourly pattern per each season, calculated from the sametraffic data.
On the other hand, the annual mean emission rate of the point source wasobtained by considering the volume of the building and its heating system: thisvalue was then modulated with a monthly pattern.
The evaluation of the emission rates for the diffuse source is instead much moredelicate: few studies are available in literature which assess pollutant releases fromidling vehicles [7–9]. In the present case the following hypotheses were made: allthe idling vehicles are heavy-duty diesel vehicles (HDDV); all of them are standingwith an auxiliary power unit (APU) in use; all the vehicles are always idling for thewhole period of breaking in the parking lot, no matter the season of the year nor thehour of the day. The emission rate of each idling vehicle was determined accordingto standard values for this type of engine idling with the APU in use [7, 10]: giventhe annual mean number of parked trucks, known from the available traffic data,the annual mean emission of the parking lot was easily calculated and modulatedwith data-based seasonal and hourly patterns. Table 5 summarises the emissionrates of the three sources representing the parking.
4 Results
Simulation results are presented in terms of annual mean values of NO2 and PM10
concentrations. NO2 concentrations were obtained from AERMOD NOx results
Air Pollution XXIII 437
www.witpress.com, ISSN 1743-3541 (on-line) WIT Transactions on Ecology and The Environment, Vol 198, © 2015 WIT Press
by means of the Romberg approach, Romberg et al. [11]. Results from a regional-scale dispersion model run [12] were used as background values to be added to thesimulated local concentrations: while NO2 background values were too low to besignificant with respect to the local simulation uncertainty, and therefore neglected,background values from 3.9 to 7.3µg m−3 were added to PM10 results.
In order to validate the simulations, numerical results were compared withobservations from an air quality station (see Figure 1). A good agreement betweenmodel results, in the nearest cell to the station, and observations was found,in terms of annual mean values. In fact, the measured and simulated NO2
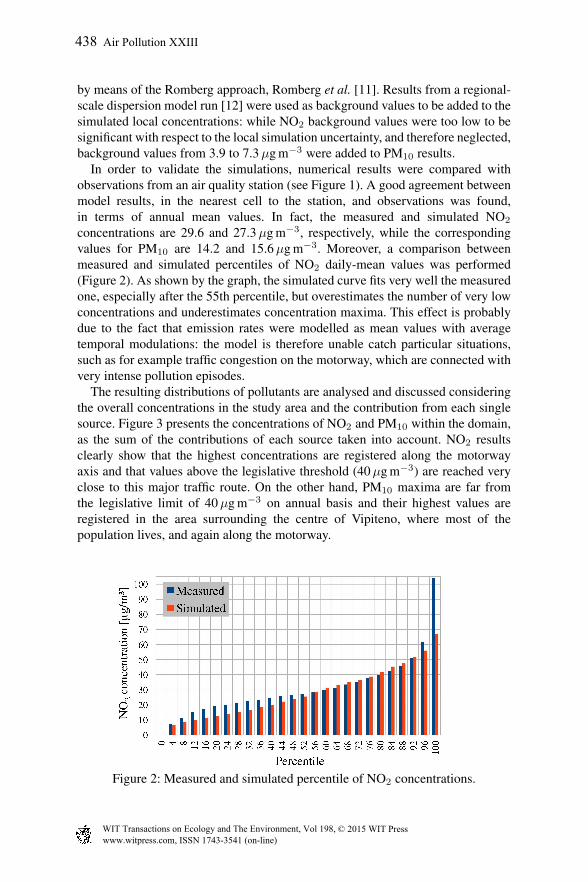
concentrations are 29.6 and 27.3µg m−3, respectively, while the correspondingvalues for PM10 are 14.2 and 15.6µg m−3. Moreover, a comparison betweenmeasured and simulated percentiles of NO2 daily-mean values was performed(Figure 2). As shown by the graph, the simulated curve fits very well the measuredone, especially after the 55th percentile, but overestimates the number of very lowconcentrations and underestimates concentration maxima. This effect is probablydue to the fact that emission rates were modelled as mean values with averagetemporal modulations: the model is therefore unable catch particular situations,such as for example traffic congestion on the motorway, which are connected withvery intense pollution episodes.
The resulting distributions of pollutants are analysed and discussed consideringthe overall concentrations in the study area and the contribution from each singlesource. Figure 3 presents the concentrations of NO2 and PM10 within the domain,as the sum of the contributions of each source taken into account. NO2 resultsclearly show that the highest concentrations are registered along the motorwayaxis and that values above the legislative threshold (40µg m−3) are reached veryclose to this major traffic route. On the other hand, PM10 maxima are far fromthe legislative limit of 40µg m−3 on annual basis and their highest values areregistered in the area surrounding the centre of Vipiteno, where most of thepopulation lives, and again along the motorway.
Figure 2: Measured and simulated percentile of NO2 concentrations.
438 Air Pollution XXIII
www.witpress.com, ISSN 1743-3541 (on-line) WIT Transactions on Ecology and The Environment, Vol 198, © 2015 WIT Press
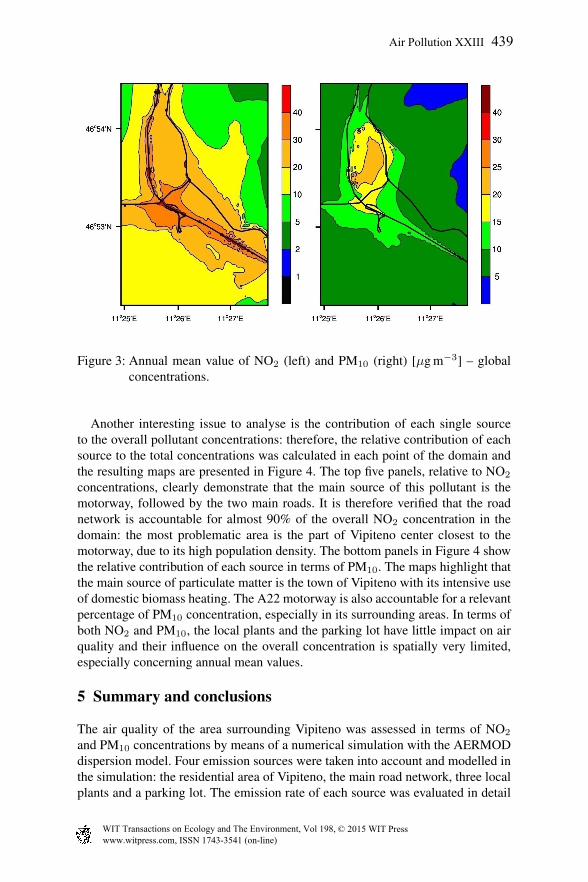
Figure 3: Annual mean value of NO2 (left) and PM10 (right) [µg m−3] – globalconcentrations.
Another interesting issue to analyse is the contribution of each single sourceto the overall pollutant concentrations: therefore, the relative contribution of eachsource to the total concentrations was calculated in each point of the domain andthe resulting maps are presented in Figure 4. The top five panels, relative to NO2
concentrations, clearly demonstrate that the main source of this pollutant is themotorway, followed by the two main roads. It is therefore verified that the roadnetwork is accountable for almost 90% of the overall NO2 concentration in thedomain: the most problematic area is the part of Vipiteno center closest to themotorway, due to its high population density. The bottom panels in Figure 4 showthe relative contribution of each source in terms of PM10. The maps highlight thatthe main source of particulate matter is the town of Vipiteno with its intensive useof domestic biomass heating. The A22 motorway is also accountable for a relevantpercentage of PM10 concentration, especially in its surrounding areas. In terms ofboth NO2 and PM10, the local plants and the parking lot have little impact on airquality and their influence on the overall concentration is spatially very limited,especially concerning annual mean values.
5 Summary and conclusions
The air quality of the area surrounding Vipiteno was assessed in terms of NO2
and PM10 concentrations by means of a numerical simulation with the AERMODdispersion model. Four emission sources were taken into account and modelled inthe simulation: the residential area of Vipiteno, the main road network, three localplants and a parking lot. The emission rate of each source was evaluated in detail
Air Pollution XXIII 439
www.witpress.com, ISSN 1743-3541 (on-line) WIT Transactions on Ecology and The Environment, Vol 198, © 2015 WIT Press
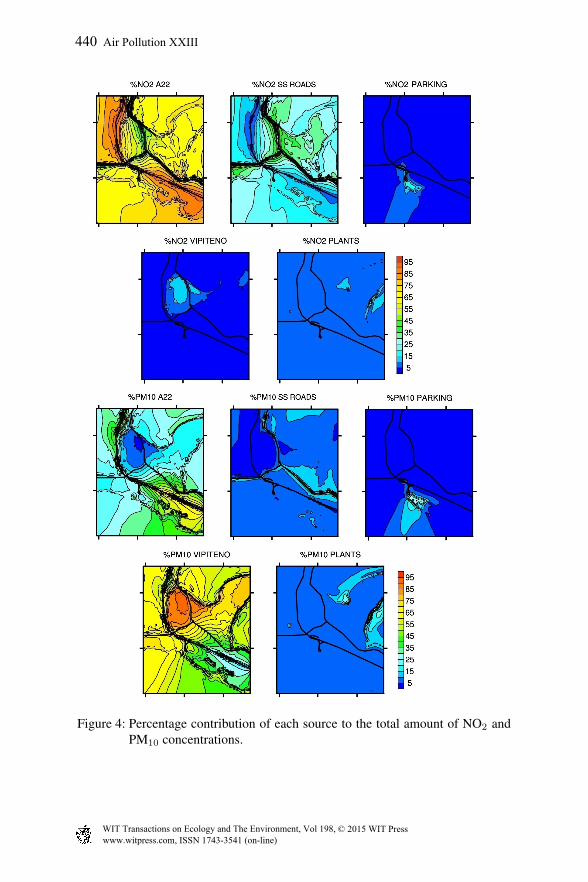
Figure 4: Percentage contribution of each source to the total amount of NO2 andPM10 concentrations.
440 Air Pollution XXIII
www.witpress.com, ISSN 1743-3541 (on-line) WIT Transactions on Ecology and The Environment, Vol 198, © 2015 WIT Press
and reproduced within the model as an annual mean value modulated in time withhourly, monthly or seasonal patterns. The comparison of numerical results againstobserved values from an air quality station, located near the motorway, assessedthe reliability of the performed simulation. The results of the study demonstratethat the principal source of NO2 is the main road network which causes theannual mean concentration to exceed the European legislative limit of 40µg m−3
in the areas very close to the motorway. The main advantage of adopting a finecomputational grid is that it allows a clear identification of concentration gradientsnear the emission points, and therefore an exact verification of where the limits areexceeded. On the other hand, the annual mean PM10 concentration is lower thanthe prescribed limit and the main source of this type of pollutant is the residentialarea of Vipiteno. The local plants and the parking lot have little impact on theoverall pollution of the area.
Acknowledgements
The present study was funded by the Autobrennero S.p.A. which is also kindlyacknowledged for providing vehicular traffic data along the Brenner motorwayand within the Sadobre parking lot. The Meteorological Office of the AutonomousProvince of Bolzano, the local and national institutes for statistic (ASTAT andISTAT) and the Italian federation of motorists (ACI) are all kindly acknowledgedfor providing meteorological, vehicular traffic, population density and fleetcomposition data, respectively.
References
[1] A. J. Cimorelli, S. G. Perry, A. Venkatram, J. C. Weil, R. J. Paine, R. B.Wilson, R. F. Lee, W. D. Peters, R. W. Brode & J. O. Paumier, AERMOD:description of model formulation. Technical report, U.S. EnvironmentalProtection Agency – EPA, 2004.
[2] Holmes, N.S. & Morawska, L., A review of dispersion modelling and itsapplication to the dispersion of particles: an overview of different dispersionmodels available. Atmospheric Environment, 40, pp. 5902–5928, 2006.
[3] Kesarkara, A.P., Dalvia, M., Kaginalkara, A. & Ojhab, A., Coupling ofthe Weather Research and Forecasting Model with AERMOD for pollutantdispersion modeling. A case study for PM10 dispersion over Pune, India.Atmospheric Environment, 41, pp. 1976–1988, 2006.
[4] EMEP/EEA air pollutant emission inventory guidebook 2013. Technicalguidance to prepare national emission inventories. Technical report,European Environmental Agency – EEA, 2013.
[5] Inventario delle emissioni in atmosfera della Provincia Autonoma diBolzano. Technical report, Autonomous Province of Bolzano, 2010.
Air Pollution XXIII 441
www.witpress.com, ISSN 1743-3541 (on-line) WIT Transactions on Ecology and The Environment, Vol 198, © 2015 WIT Press
[6] D. Gkatzoflias, C. Kouridis, L. Ntziachristos & Z. Samaras, COPERT IVComputer programme to calculate emissions from road transport. Technicalreport, European Environmental Agency – EEA, 2012.
[7] Rahman, S.M.A., Masjuki, H.H., Kalam, M.A., Abedin, M.J., Sanjid, A. &Sajjad, H., Impact of idling on fuel consumption and exhaust emissions andavailable idle-reduction technologies for diesel vehicles – A review. EnergyConversion and Management, 74, pp. 171–182, 2013.
[8] Shancita, I., Masjuki, H.H., Kalam, M.A., Fattah, I.M.R., Rashed, M.M.& Rashedul, H.K., A review on idling reduction strategies to improvefuel economy and reduce exhaust emissions of transport vehicles. EnergyConversion and Management, 88, pp. 794–807, 2014.
[9] Office of Transportation and Air Quality, Idling vehicle emissions forpassenger cars, Light-duty trucks, and heavy-duty trucks. Technical report,U.S. Environmental Protection Agency – EPA, 2008.
[10] Frey, H.C. & Kuo, P.Y., Real-world energy use and emission rates for idlinglong-haul trucks and selected Idle reduction technologies. Journal of the Airand Waste Management Association, 59(7), pp. 857–864, 2009.
[11] Romberg, E., Bosinger, R., Lohmeyer, A., Ruhnke, R. & Roth, R., NO-NO2-Umwandlung fur die Anwendung bei Immissionsprognosen fur Kfz-Abgase– Gefahrstoffe. Reinhaltung der Luft, 56, pp. 215–218, 1996.
[12] Valutazione della qualita dell′aria 2005-2015. Technical report, Environmen-tal Protection Agency – Autonomous Province of Bolzano, 2010.
442 Air Pollution XXIII
www.witpress.com, ISSN 1743-3541 (on-line) WIT Transactions on Ecology and The Environment, Vol 198, © 2015 WIT Press
![Atmospheric Dispersion Modelling and Spatial Analysis to … · 2018-08-23 · Protection Agency (EPA) Regulatory Model AERMOD [27], it is written in Python language [28] (Version](https://img.pdfslide.us/doc/110x75/5e762ad5cf30343d0c216fbd/atmospheric-dispersion-modelling-and-spatial-analysis-to-2018-08-23-protection.jpg)