Embed Size (px)
Citation preview
INTRODUCTION TO METEOROLOGY I - GPH212
ATMOSPHERE AND CLIMATE EXERCISE I TEMPERATURE CONTROLS
Introduction This lab will provide the student with the opportunity to become familiar with the concepts ofclimate controls and their affect on regional temperature. Print out the instructional materials toassist you with the exercise. Materials needed: atlas, pencil, calculator, and Arizona Map (provided on the last page of this
lab) Part I. Global Heating and Temperature The temperature of a place depends on its location in terms of several variables. These include: latitude, elevation, continentality, proximity to warm or cold ocean currents, influence of topographic barriers and storm systems. All of these variables must be considered when attempting to assess the average temperature of a particular place. In this exercise the student will be required to rank order various cities according to their average or annual or seasonal temperature, using only one of the above variables per question. It is the student’s task to determine the variable most responsible for average annual temperature variance, and to employ this variable in ranking of each group of cities. A. Use the temperature graph below (Figure G-1) to answer the following questions.
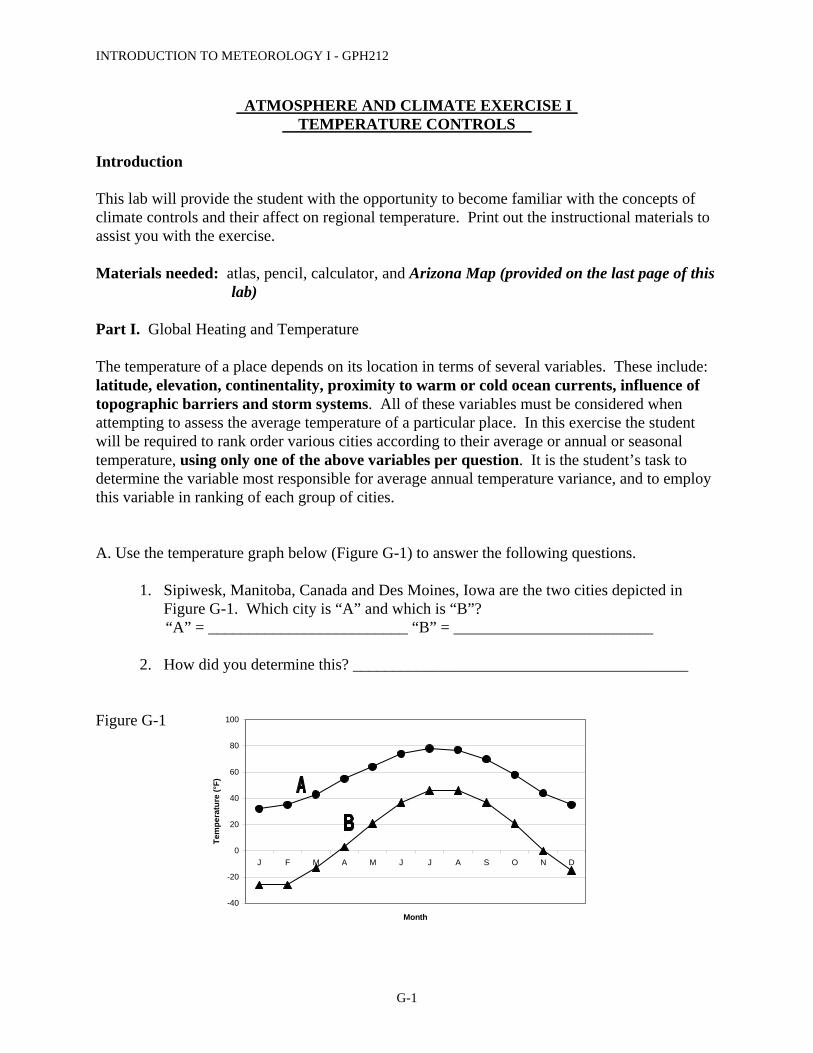
1. Sipiwesk, Manitoba, Canada and Des Moines, Iowa are the two cities depicted in Figure G-1. Which city is “A” and which is “B”?
“A” = _________________________ “B” = _________________________ 2. How did you determine this? __________________________________________
-40
-20
0
20
40
60
80
100
J F M A M J J A S O N D
Month
Tem
pera
ture
(°F)
Figure G-1
G-1
INTRODUCTION TO METEOROLOGY I - GPH212
3. Rank the following cities. Assign a numerical value of 1 for the warmest through 7 for the coolest.
Omaha, Nebraska ______ San Antonio, Texas ______ Bismarck, North Dakota ______ Dallas, Texas ______ Lynn Lake, Manitoba, Canada ______ Oklahoma City, Oklahoma ______ Rapid City, South Dakota ______ a. Which variable was employed to rank these cities? ________________________
b. How does this factor affect temperature? _____________________________________ _______________________________________________________________________
B. Use the temperature graph below (Figure G-2) to answer the following question.
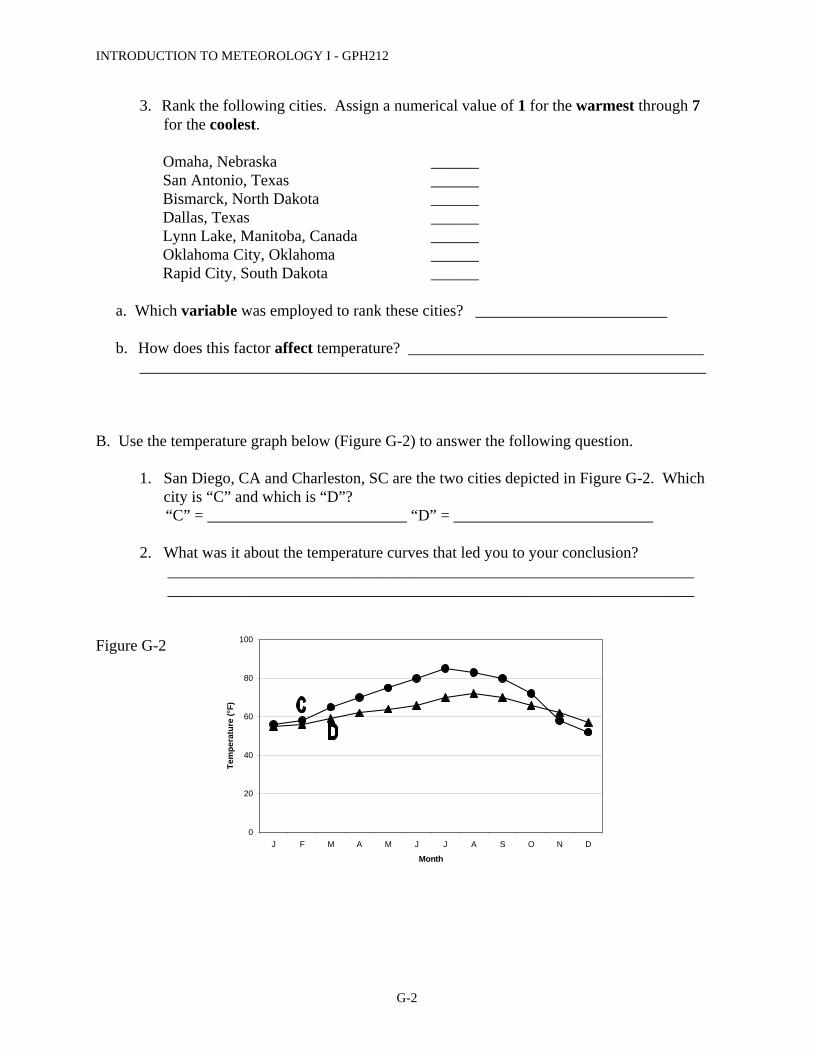
1. San Diego, CA and Charleston, SC are the two cities depicted in Figure G-2. Which city is “C” and which is “D”?
“C” = _________________________ “D” = _________________________ 2. What was it about the temperature curves that led you to your conclusion? __________________________________________________________________
__________________________________________________________________
0
20
40
60
80
100
J F M A M J J A S O N D
Month
Tem
pera
ture
(°F)
Figure G-2
G-2
INTRODUCTION TO METEOROLOGY I - GPH212
3. Indicate which city in each of the following pairs of cities would exhibit a higher average annual temperature.
San Francisco, California or Norfolk, Virginia _______________
Luanda, Angola or Dar es Salaam, Tanzania _______________ Rio de Janeiro, Brazil or Antofogasta, Chile _______________ Nouakchott, Mauritania or Bur Sudan, Sudan _______________ Sydney, Australia or Perth, Australia _______________ a. Which variable was used to determine the warmer city? _______________________
b. How does this variable influence average annual temperatures? __________________ _______________________________________________________________________
C. Use the temperature graph (Figure G-3) below to answer the following questions.
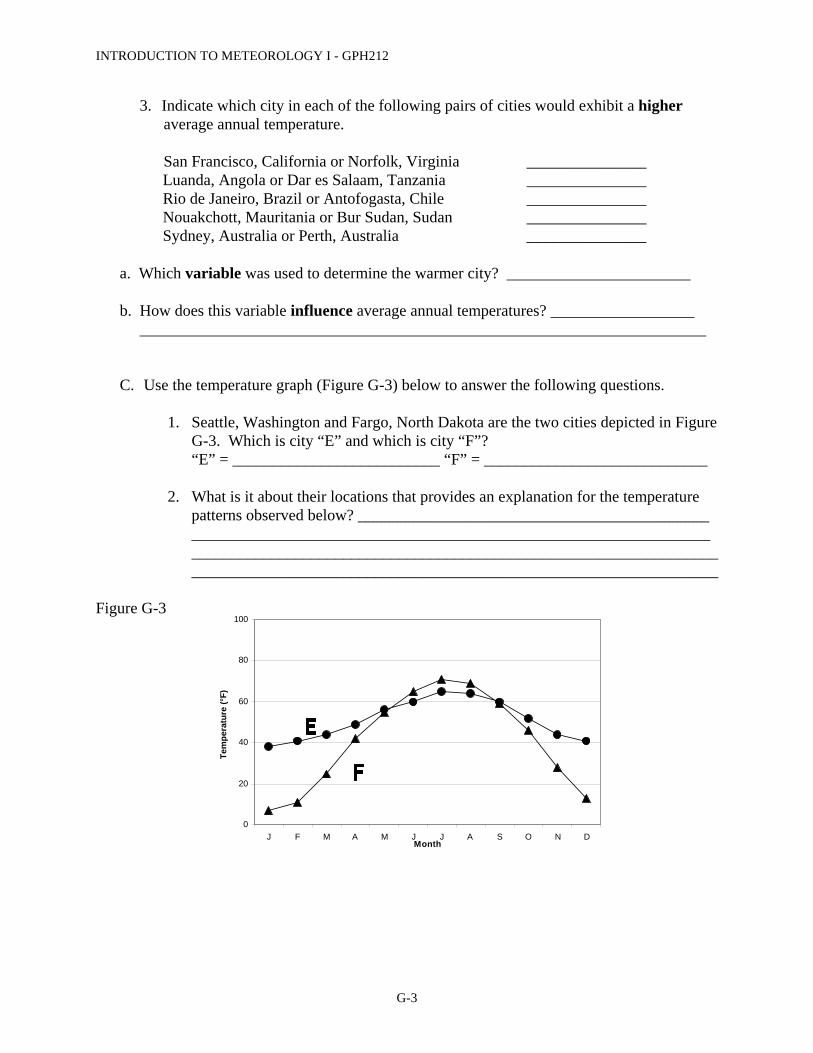
1. Seattle, Washington and Fargo, North Dakota are the two cities depicted in Figure G-3. Which is city “E” and which is city “F”?
“E” = __________________________ “F” = ____________________________
2. What is it about their locations that provides an explanation for the temperature patterns observed below? ____________________________________________ _________________________________________________________________ ____________________________________________________________________________________________________________________________________
Figure G-3
0
20
40
60
80
100
J F M A M J J A S O N DMonth
Tem
pera
ture
(°F)
G-3
INTRODUCTION TO METEOROLOGY I - GPH212
3. Indicate which city in each of the following pairs of cities would exhibit warmer summers and cooler winters? Brussels, Belgium or Munich, Germany _____________________ Casablanca, Morocco or In Salah, Algeria _____________________ Perth, Australia or Broken Hill, Australia _____________________ Córdoba, Argentina or Valparaíso, Chile _____________________ Chengdu, China or Shanghai, China _____________________ St. John’s, Canada or Stevens Point, Wisconsin _____________________ a. Which variable was used to determine the city with warmer summers and cooler winters? _________________________________
b. How does this variable influence average seasonal temperatures?
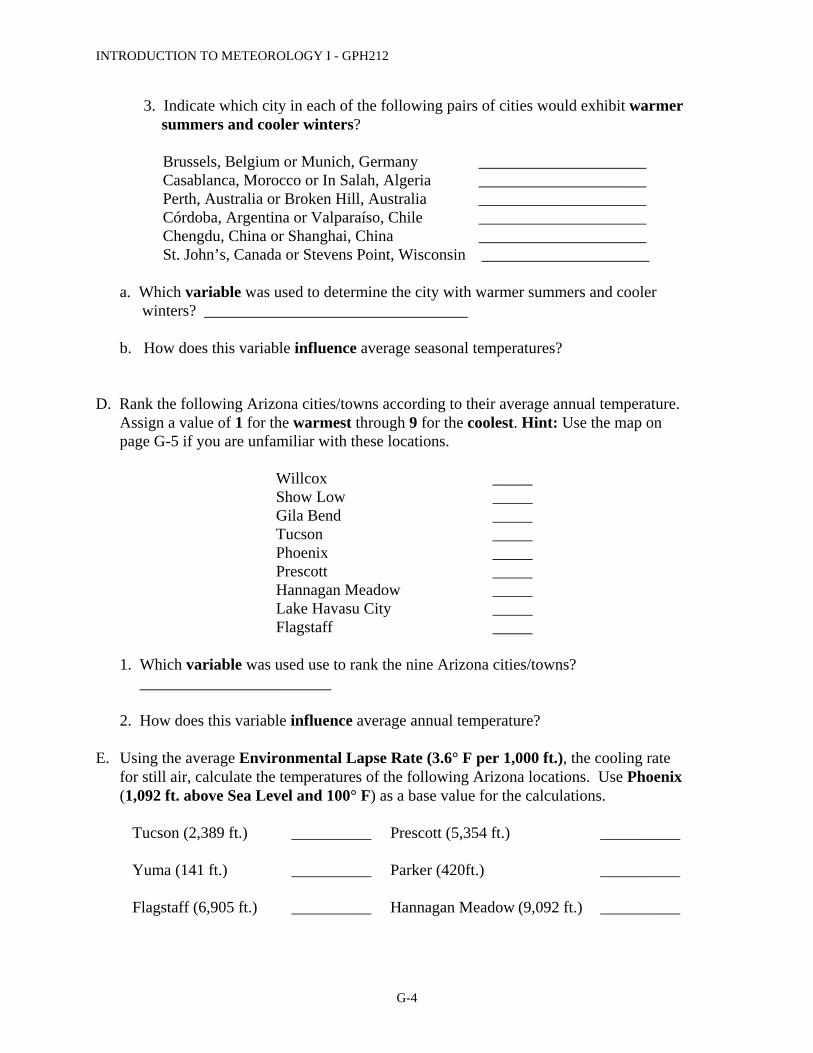
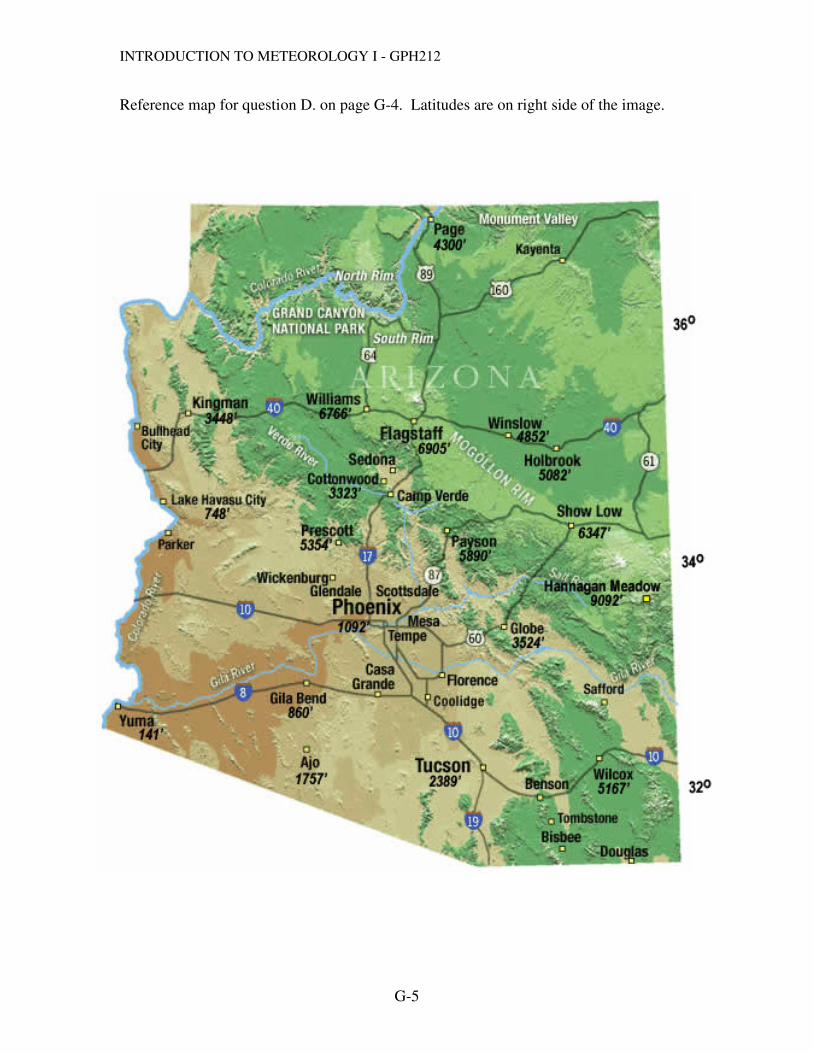
D. Rank the following Arizona cities/towns according to their average annual temperature. Assign a value of 1 for the warmest through 9 for the coolest. Hint: Use the map on page G-5 if you are unfamiliar with these locations.
Willcox _____ Show Low _____ Gila Bend _____ Tucson _____ Phoenix _____ Prescott _____ Hannagan Meadow _____ Lake Havasu City _____ Flagstaff _____
1. Which variable was used use to rank the nine Arizona cities/towns? ________________________ 2. How does this variable influence average annual temperature? E. Using the average Environmental Lapse Rate (3.6° F per 1,000 ft.), the cooling rate for still air, calculate the temperatures of the following Arizona locations. Use Phoenix (1,092 ft. above Sea Level and 100° F) as a base value for the calculations.
Tucson (2,389 ft.) __________ Prescott (5,354 ft.) __________
Yuma (141 ft.) __________ Parker (420ft.)
__________
Flagstaff (6,905 ft.) __________ Hannagan Meadow (9,092 ft.)
__________
G-4
INTRODUCTION TO METEOROLOGY I - GPH212
G-5
Reference map for question D. on page G-4. Latitudes are on right side of the image.