Embed Size (px)
Citation preview
Astron. Astrophys. 359, 651–662 (2000) ASTRONOMYAND
ASTROPHYSICS
Circumstellar dust shells around long-period variables
VIII. CO infrared line profiles from dynamical models for C-stars
J.M. Winters1,2, J.J. Keady3, A. Gauger4, and P.V. Sada5
1 Max-Planck-Institut fur Radioastronomie, Auf dem Hugel 69, 53121 Bonn, Germany2 Technische Universitat Berlin, Institut fur Astronomie und Astrophysik, PN 8-1, Hardenbergstrasse 36, 10623 Berlin, Germany3 Los Alamos National Laboratory, Theoretical Division, Group T–4, MS B268, Los Alamos, NM 87545, USA4 Fachhochschule Fulda, Marquardstrasse 35, 36039 Fulda, Germany5 Universidad de Monterrey, Departamento de Fısica y Matematicas, Av. Moromes Prieto 4500 Pte., Garza Garcıa, N.L., 66238 Mexico
Received 16 February 2000 / Accepted 26 April 2000
Abstract. We present simplified non-LTE radiative transfercalculations for CO (v 0-1) fundamental and (v 0-2) overtonelines, using the structure of dynamical models for dust shellsaround carbon-rich long-period variables, which result from aconsistent treatment of hydro- and thermodynamics, radiativetransfer, chemistry and carbon grain formation.
Owing to the saturation of the fundamental band absorptioncores the most useful information is provided by the P-Cygniemission component, which can be used to constrain the dustoptical depth in the5 µm region. The first overtone lines clearlyreflect the shocked, layered structure of the inner shell regionby showing a multi-component structure of the profiles. At leastthe lines of higher rotational excitation (Jl > 10) are not satu-rated even for mass loss rates of the order of10−5M�yr−1 andthus can be used to constrain the mass loss rate. Furthermore,the dynamics of the dust formation process is reflected in thetemporal evolution of the synthetic CO first overtone line pro-files resulting from the models. The formation of a new dustlayer in the inner shell region leads to a secondary (low veloc-ity) absorption component which evolves on the time scale ofa dust formation event, usually longer than the pulsation periodof the star.
The synthetic overtone line profiles calculated on the basisof one dust shell model resemble the time variations of corre-sponding lines in the observed high resolution CO line spectraof the carbon-Mira IRC +10216, which thereby are interpretedas result of a dust formation event taking place on a time scaleof ≈ 10 yr corresponding to6 pulsation periods of the star.However, the calculated fundamental line absorption cores arebroader than observed and the first overtone line strengths aretoo high, indicating that the density and thus probably the massloss rate of the model is too high by a factor of about 3 and shouldbe closer to the value of1 10−5 M�yr−1 given for IRC +10216in the literature.
Key words: hydrodynamics – line: profiles – stars: circumstellarmatter – stars: individual: IRC +10216 – stars: AGB and post-AGB – stars: winds, outflows
Send offprint requests to: J.M. Winters ([email protected])
1. Introduction
Almost all Miras and most long–period variables (LPVs) arehighly evolved low and intermediate mass stars located on theAsymptotic Giant Branch (AGB). These objects are large am-plitude pulsators with typical periods of the order ofP ≈ 1 yr,high luminositiesL∗ ≈ 104L�, low effective temperaturesT∗ ≤ 3000 K and high mass loss rates up toM ≈ 10−4M�yr−1
(e.g. Habing 1996). The outflows from these cool stars are sitesof copious grain formation, which is sometimes so effective, thatthe circumstellar dust shell (CDS) totally obscures the centralobject. In fact, these shells are considered to be the major sourcesfor the replenishment of the interstellar medium with processedmaterial, in particular in the form of complex molecules and ofsolid dust particles (e.g. Gehrz 1989).
These high mass loss winds cannot be a long-lasting phe-nomenon, since the stars themselves, when reaching the AGB,typically have masses of the order of one solar mass. Therefore,this high mass loss has a profound impact on the final evolu-tionary phase of the mass losing star, thereby producing theremaining Planetary Nebula or even single, thin detached shells(cf. Schroder et al. 1998, 1999)
To study the structure and dynamics of such CDS, the COmolecule is an especially well suited diagnostic probe. It isone of the most abundant species, both, in oxygen–rich andin carbon–rich objects. Due to its stability it forms already athigh temperatures deep in the photosphere. In the subsequentoutflow it remains relatively chemically inert out to large dis-tances, thus, covering the whole range of physical conditions inthe CDS. Its infrared and microwave spectrum is fairly simple,and line positions and oscillator strengths are well determined.
Probably the best studied representative of its class is thebright, carbon–rich, infrared Mira IRC +10216, which has beenobserved at many wavelengths with significant spectral and spa-tial resolution since its discovery by Neugebauer & Leighton(1969). The combined information obtained from the spectralenergy distribution, molecular line spectra, brightness profilesand spatial spectra yields strong constraints on the propertiesof the CDS around IRC +10216, such as the flow velocity, the
652 J.M. Winters et al.: Circumstellar dust shells around long-period variables. VIII
temperature and density distribution of the gas, the gas phasechemistry and the molecular composition and its distribution(e.g. Groenewegen et al. 1998, Groenewegen 1997, Crosas &Menten 1997, Jura 1994, Winters et al. 1994a, Cherchneff et al.1993, Keady & Ridgway 1993, Keady et al. 1988).
Keady and his collaborators performed detailed modeling ofthe infrared molecular line profiles of the CO molecule using asemi-empirical approach. With an assumed dust density distri-bution, the static radiative transfer equation was solved, subjectto the radiative equilibrium constraint. The resultant fluxes andspecific intensities would be compared to spectral and spatialobservations. Independently, a chosen velocity field and mass-loss-rate yielded, via the stationary continuity equation, a gasdensity distribution. It was found that fitting the observed in-frared line profiles required a flow velocity field having a numberof acceleration regions. The suggestion was that such a velocityfield might result from successive formation of different dustgrain species at different temperatures. More complicated situ-ations could be imagined, e.g. distinct shells, multiple shocksetc. However, without an ab-initio (and much more internallyconsistent) simulation, the number of adjustable parameters isunreasonably large, making the semi-empirical approach tooarbitrary.
On the other hand, hydrodynamic models have been devel-oped to investigate the mass loss mechanism of these pulsatingstars. It was found, that the pulsation of the star alone cannot ac-count for the generation of a wind exhibiting the observed massloss rates and outflow velocities. Therefore, Wood (1979) intro-duced an additional term into the equation of motion (in formof a parameterized step function) in order to account for radi-ation pressure on dust. The resulting models in fact were ableto reproduce the observed mass loss rates and terminal outflowvelocities. While Wood (1979) considered the limiting cases ofadiabatic shocks and isothermal shocks, respectively, Bowen(1988) extended this kind of model calculations by introducingparameterized cooling laws to treat the relaxation of the gas afterthe passage of a shock. In these models, a thermally driven windis generated by a ‘calorisphere’ which results from the ratherinefficient cooling laws used by Bowen (1988). Also in thesemodels, the mass loss rate is strongly enhanced by introducinga temperature sensitive parameterized step-function to accountfor radiation pressure on dust. The first time-dependent modelswhich considered in detail the formation of dust and its inter-action with the hydrodynamic and thermodynamic structure ofthe wind have been presented by Fleischer et al. (1991, 1992)and, using a different numerical scheme for the solution of theequation system, by Feuchtinger et al. (1993). These modelsrevealed, that a proper treatment of the dust formation problemis essential to disclose the dominant role of the dust not onlyfor the local hydrodynamic and thermodynamic conditions butalso for the temporal behavior of the wind (e.g. Winters et al.1994b, Fleischer et al. 1995, Hofner et al. 1995).
This consistent modeling approach already has been suc-cessfully applied to the extreme carbon star AFGL 3068 byWinters et al. (1997), reproducing the observed outflow veloc-ity, spectral energy distribution at different phases, and the light
curves of this object. In the present paper we investigate infraredCO molecular line profiles as they result from from this kind ofmodel calculations.
In Sect. 2 we summarize how our dynamical models of cir-cumstellar dust shells around LPVs are calculated and describethe method adopted here for the molecular line calculations.Our general results are presented in Sect. 3. In particular, wediscuss the dependence of the synthetic line profiles on the themodel parameters and analyze their temporal evolution. Fol-lowing these theoretical considerations, in Sect. 4.1 a short de-scription of high resolution infrared CO line observations ofIRC +10216 is given and the theoretical results are comparedwith the observed CO line profiles in Sects. 4.2 and 4.3 for spe-cific model calculations. We finish this paper in Sect. 5 with asummary of the results obtained from the present models.
2. Modeling method
2.1. Time–dependent hydrodynamical model calculation
Our approach to model circumstellar dust shells around LPVsis described in detail in Fleischer et al. (1992) and Winterset al. (1997). It comprises
– the explicit solution of the time dependent hydro–equati-ons in Lagrangian coordinates for a spherical symmetricgeometry according to the scheme of Richtmyer & Morton(1967),
– a detailed treatment of the formation, growth and evapora-tion of carbon grains by means of the moment method (Gail& Sedlmayr 1988, Gauger et al. 1990), which includes anequilibrium chemistry for the important hydrocarbons,
– the treatment of continuum radiative transfer in terms offrequency integrated moments by a generalized Eddingtonapproximation for a spherical grey atmosphere (see Unno& Kondo (1976) and Hashimoto (1995) for details),
– the description of post-shock cooling of the gas by an LTEcooling function
– the simulation of the interior pulsation by a sinusoidallymoving inner boundary (piston).
These models are determined by the four stellar parameters:present massM∗, luminosity of the initial modelL∗(t = 0) =L0, effective temperature of the initial modelT∗(t = 0) = T0,and the element abundancesεi (especially the carbon abundanceεC , all other elements are assumed to have solar abundance), andby the pulsation periodP and velocity amplitude∆vp of thepiston motion. The stellar radius of the initial modelR∗(t =0) = R0 follows from L0 and T0 by means of the Stefan-Boltzman law.
The calculations start from an initially dust free hydrostaticmodel. Then, the time evolution is followed until a cyclic or‘regular’ pattern develops.
2.2. Molecular line calculations
The synthetic infrared CO line profiles for the fundamental (v0-1) and first overtone (v 0-2) lines are calculated using the
J.M. Winters et al.: Circumstellar dust shells around long-period variables. VIII 653
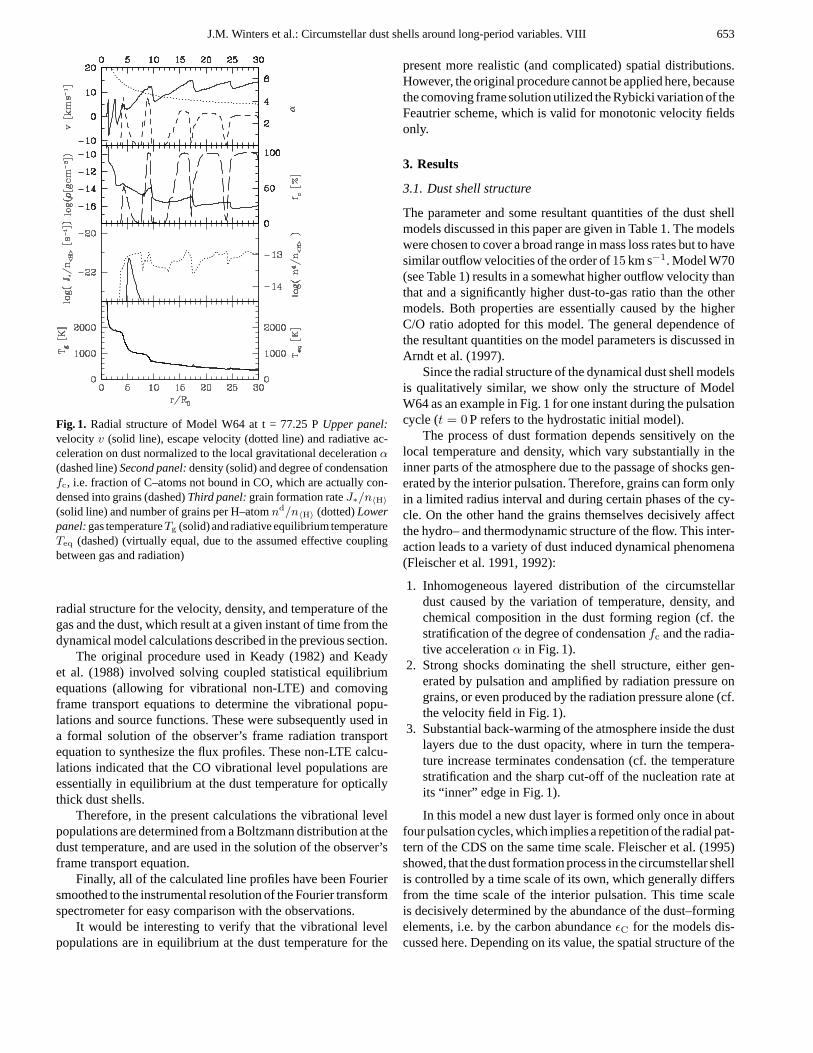
Fig. 1. Radial structure of Model W64 at t = 77.25 PUpper panel:velocity v (solid line), escape velocity (dotted line) and radiative ac-celeration on dust normalized to the local gravitational decelerationα(dashed line)Second panel:density (solid) and degree of condensationfc, i.e. fraction of C–atoms not bound in CO, which are actually con-densed into grains (dashed)Third panel:grain formation rateJ∗/n〈H〉(solid line) and number of grains per H–atomnd/n〈H〉 (dotted)Lowerpanel:gas temperatureTg (solid) and radiative equilibrium temperatureTeq (dashed) (virtually equal, due to the assumed effective couplingbetween gas and radiation)
radial structure for the velocity, density, and temperature of thegas and the dust, which result at a given instant of time from thedynamical model calculations described in the previous section.
The original procedure used in Keady (1982) and Keadyet al. (1988) involved solving coupled statistical equilibriumequations (allowing for vibrational non-LTE) and comovingframe transport equations to determine the vibrational popu-lations and source functions. These were subsequently used ina formal solution of the observer’s frame radiation transportequation to synthesize the flux profiles. These non-LTE calcu-lations indicated that the CO vibrational level populations areessentially in equilibrium at the dust temperature for opticallythick dust shells.
Therefore, in the present calculations the vibrational levelpopulations are determined from a Boltzmann distribution at thedust temperature, and are used in the solution of the observer’sframe transport equation.
Finally, all of the calculated line profiles have been Fouriersmoothed to the instrumental resolution of the Fourier transformspectrometer for easy comparison with the observations.
It would be interesting to verify that the vibrational levelpopulations are in equilibrium at the dust temperature for the
present more realistic (and complicated) spatial distributions.However, the original procedure cannot be applied here, becausethe comoving frame solution utilized the Rybicki variation of theFeautrier scheme, which is valid for monotonic velocity fieldsonly.
3. Results
3.1. Dust shell structure
The parameter and some resultant quantities of the dust shellmodels discussed in this paper are given in Table 1. The modelswere chosen to cover a broad range in mass loss rates but to havesimilar outflow velocities of the order of15 km s−1. Model W70(see Table 1) results in a somewhat higher outflow velocity thanthat and a significantly higher dust-to-gas ratio than the othermodels. Both properties are essentially caused by the higherC/O ratio adopted for this model. The general dependence ofthe resultant quantities on the model parameters is discussed inArndt et al. (1997).
Since the radial structure of the dynamical dust shell modelsis qualitatively similar, we show only the structure of ModelW64 as an example in Fig. 1 for one instant during the pulsationcycle (t = 0 P refers to the hydrostatic initial model).
The process of dust formation depends sensitively on thelocal temperature and density, which vary substantially in theinner parts of the atmosphere due to the passage of shocks gen-erated by the interior pulsation. Therefore, grains can form onlyin a limited radius interval and during certain phases of the cy-cle. On the other hand the grains themselves decisively affectthe hydro– and thermodynamic structure of the flow. This inter-action leads to a variety of dust induced dynamical phenomena(Fleischer et al. 1991, 1992):
1. Inhomogeneous layered distribution of the circumstellardust caused by the variation of temperature, density, andchemical composition in the dust forming region (cf. thestratification of the degree of condensationfc and the radia-tive accelerationα in Fig. 1).
2. Strong shocks dominating the shell structure, either gen-erated by pulsation and amplified by radiation pressure ongrains, or even produced by the radiation pressure alone (cf.the velocity field in Fig. 1).
3. Substantial back-warming of the atmosphere inside the dustlayers due to the dust opacity, where in turn the tempera-ture increase terminates condensation (cf. the temperaturestratification and the sharp cut-off of the nucleation rate atits “inner” edge in Fig. 1).
In this model a new dust layer is formed only once in aboutfour pulsation cycles, which implies a repetition of the radial pat-tern of the CDS on the same time scale. Fleischer et al. (1995)showed, that the dust formation process in the circumstellar shellis controlled by a time scale of its own, which generally differsfrom the time scale of the interior pulsation. This time scaleis decisively determined by the abundance of the dust–formingelements, i.e. by the carbon abundanceεC for the models dis-cussed here. Depending on its value, the spatial structure of the
654 J.M. Winters et al.: Circumstellar dust shells around long-period variables. VIII
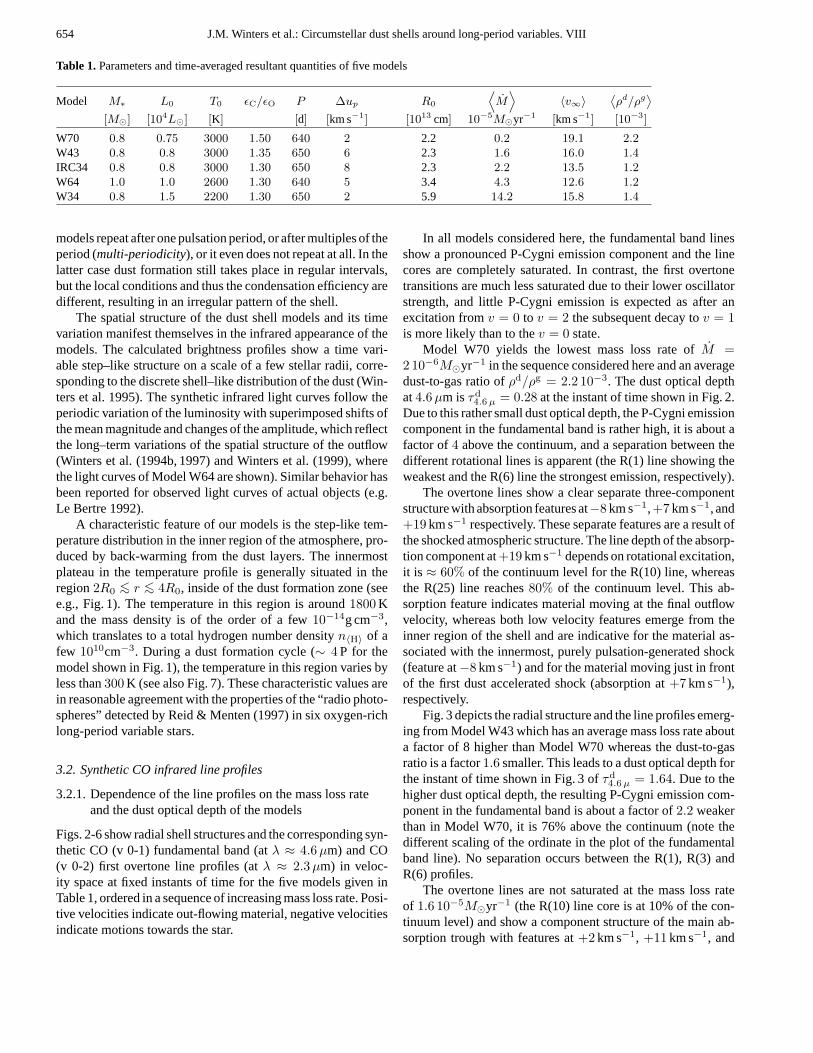
Table 1.Parameters and time-averaged resultant quantities of five models
Model M∗ L0 T0 εC/εO P ∆up R0
⟨M
⟩〈v∞〉 ⟨
ρd/ρg⟩
[M�] [104L�] [K] [d] [km s−1] [1013 cm] 10−5M�yr−1 [km s−1] [10−3]
W70 0.8 0.75 3000 1.50 640 2 2.2 0.2 19.1 2.2W43 0.8 0.8 3000 1.35 650 6 2.3 1.6 16.0 1.4IRC34 0.8 0.8 3000 1.30 650 8 2.3 2.2 13.5 1.2W64 1.0 1.0 2600 1.30 640 5 3.4 4.3 12.6 1.2W34 0.8 1.5 2200 1.30 650 2 5.9 14.2 15.8 1.4
models repeat after one pulsation period, or after multiples of theperiod (multi-periodicity), or it even does not repeat at all. In thelatter case dust formation still takes place in regular intervals,but the local conditions and thus the condensation efficiency aredifferent, resulting in an irregular pattern of the shell.
The spatial structure of the dust shell models and its timevariation manifest themselves in the infrared appearance of themodels. The calculated brightness profiles show a time vari-able step–like structure on a scale of a few stellar radii, corre-sponding to the discrete shell–like distribution of the dust (Win-ters et al. 1995). The synthetic infrared light curves follow theperiodic variation of the luminosity with superimposed shifts ofthe mean magnitude and changes of the amplitude, which reflectthe long–term variations of the spatial structure of the outflow(Winters et al. (1994b, 1997) and Winters et al. (1999), wherethe light curves of Model W64 are shown). Similar behavior hasbeen reported for observed light curves of actual objects (e.g.Le Bertre 1992).
A characteristic feature of our models is the step-like tem-perature distribution in the inner region of the atmosphere, pro-duced by back-warming from the dust layers. The innermostplateau in the temperature profile is generally situated in theregion2R0 <∼ r <∼ 4R0, inside of the dust formation zone (seee.g., Fig. 1). The temperature in this region is around1800 Kand the mass density is of the order of a few10−14g cm−3,which translates to a total hydrogen number densityn〈H〉 of afew 1010cm−3. During a dust formation cycle (∼ 4 P for themodel shown in Fig. 1), the temperature in this region varies byless than300 K (see also Fig. 7). These characteristic values arein reasonable agreement with the properties of the “radio photo-spheres” detected by Reid & Menten (1997) in six oxygen-richlong-period variable stars.
3.2. Synthetic CO infrared line profiles
3.2.1. Dependence of the line profiles on the mass loss rateand the dust optical depth of the models
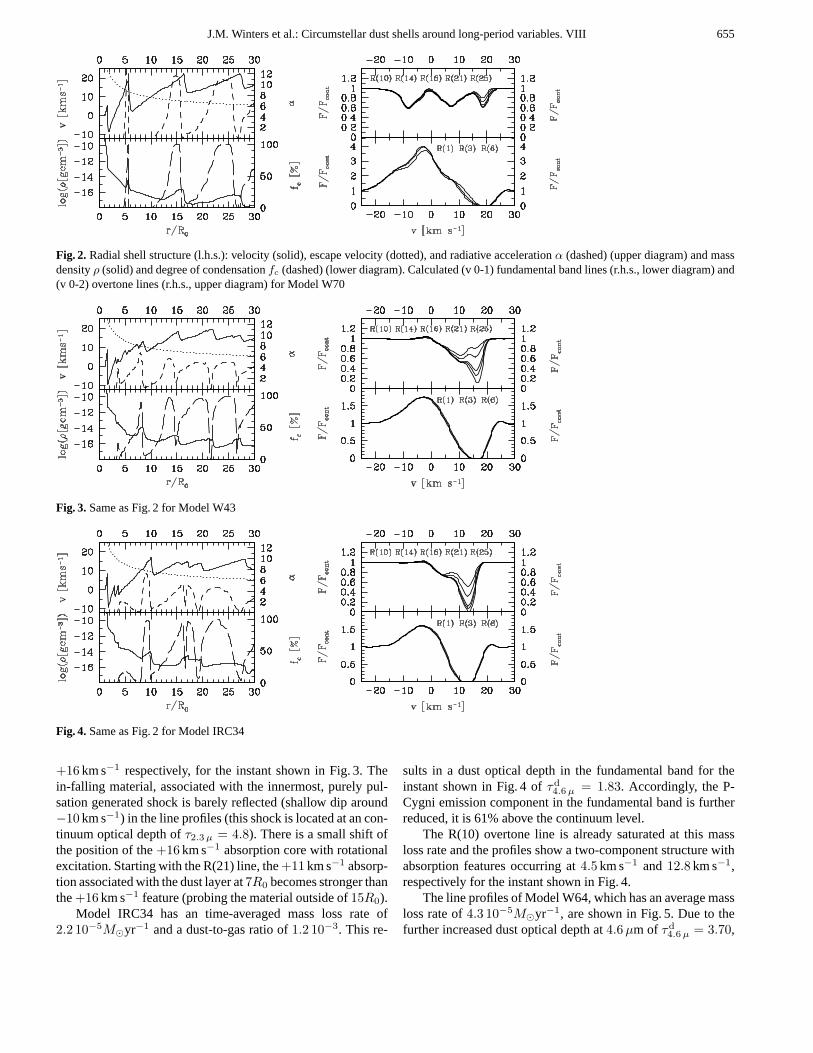
Figs. 2-6 show radial shell structures and the corresponding syn-thetic CO (v 0-1) fundamental band (atλ ≈ 4.6 µm) and CO(v 0-2) first overtone line profiles (atλ ≈ 2.3 µm) in veloc-ity space at fixed instants of time for the five models given inTable 1, ordered in a sequence of increasing mass loss rate. Posi-tive velocities indicate out-flowing material, negative velocitiesindicate motions towards the star.
In all models considered here, the fundamental band linesshow a pronounced P-Cygni emission component and the linecores are completely saturated. In contrast, the first overtonetransitions are much less saturated due to their lower oscillatorstrength, and little P-Cygni emission is expected as after anexcitation fromv = 0 to v = 2 the subsequent decay tov = 1is more likely than to thev = 0 state.
Model W70 yields the lowest mass loss rate ofM =2 10−6M�yr−1 in the sequence considered here and an averagedust-to-gas ratio ofρd/ρg = 2.2 10−3. The dust optical depthat4.6 µm isτd
4.6 µ = 0.28 at the instant of time shown in Fig. 2.Due to this rather small dust optical depth, the P-Cygni emissioncomponent in the fundamental band is rather high, it is about afactor of4 above the continuum, and a separation between thedifferent rotational lines is apparent (the R(1) line showing theweakest and the R(6) line the strongest emission, respectively).
The overtone lines show a clear separate three-componentstructure with absorption features at−8 km s−1,+7 km s−1, and+19 km s−1 respectively. These separate features are a result ofthe shocked atmospheric structure. The line depth of the absorp-tion component at+19 km s−1 depends on rotational excitation,it is ≈ 60% of the continuum level for the R(10) line, whereasthe R(25) line reaches80% of the continuum level. This ab-sorption feature indicates material moving at the final outflowvelocity, whereas both low velocity features emerge from theinner region of the shell and are indicative for the material as-sociated with the innermost, purely pulsation-generated shock(feature at−8 km s−1) and for the material moving just in frontof the first dust accelerated shock (absorption at+7 km s−1),respectively.
Fig. 3 depicts the radial structure and the line profiles emerg-ing from Model W43 which has an average mass loss rate abouta factor of 8 higher than Model W70 whereas the dust-to-gasratio is a factor1.6 smaller. This leads to a dust optical depth forthe instant of time shown in Fig. 3 ofτd
4.6 µ = 1.64. Due to thehigher dust optical depth, the resulting P-Cygni emission com-ponent in the fundamental band is about a factor of2.2 weakerthan in Model W70, it is 76% above the continuum (note thedifferent scaling of the ordinate in the plot of the fundamentalband line). No separation occurs between the R(1), R(3) andR(6) profiles.
The overtone lines are not saturated at the mass loss rateof 1.6 10−5M�yr−1 (the R(10) line core is at 10% of the con-tinuum level) and show a component structure of the main ab-sorption trough with features at+2 km s−1, +11 km s−1, and
J.M. Winters et al.: Circumstellar dust shells around long-period variables. VIII 655
Fig. 2. Radial shell structure (l.h.s.): velocity (solid), escape velocity (dotted), and radiative accelerationα (dashed) (upper diagram) and massdensityρ (solid) and degree of condensationfc (dashed) (lower diagram). Calculated (v 0-1) fundamental band lines (r.h.s., lower diagram) and(v 0-2) overtone lines (r.h.s., upper diagram) for Model W70
Fig. 3. Same as Fig. 2 for Model W43
Fig. 4. Same as Fig. 2 for Model IRC34
+16 km s−1 respectively, for the instant shown in Fig. 3. Thein-falling material, associated with the innermost, purely pul-sation generated shock is barely reflected (shallow dip around−10 km s−1) in the line profiles (this shock is located at an con-tinuum optical depth ofτ2.3 µ = 4.8). There is a small shift ofthe position of the+16 km s−1 absorption core with rotationalexcitation. Starting with the R(21) line, the+11 km s−1 absorp-tion associated with the dust layer at7R0 becomes stronger thanthe+16 km s−1 feature (probing the material outside of15R0).
Model IRC34 has an time-averaged mass loss rate of2.2 10−5M�yr−1 and a dust-to-gas ratio of1.2 10−3. This re-
sults in a dust optical depth in the fundamental band for theinstant shown in Fig. 4 ofτd
4.6 µ = 1.83. Accordingly, the P-Cygni emission component in the fundamental band is furtherreduced, it is 61% above the continuum level.
The R(10) overtone line is already saturated at this massloss rate and the profiles show a two-component structure withabsorption features occurring at4.5 km s−1 and12.8 km s−1,respectively for the instant shown in Fig. 4.
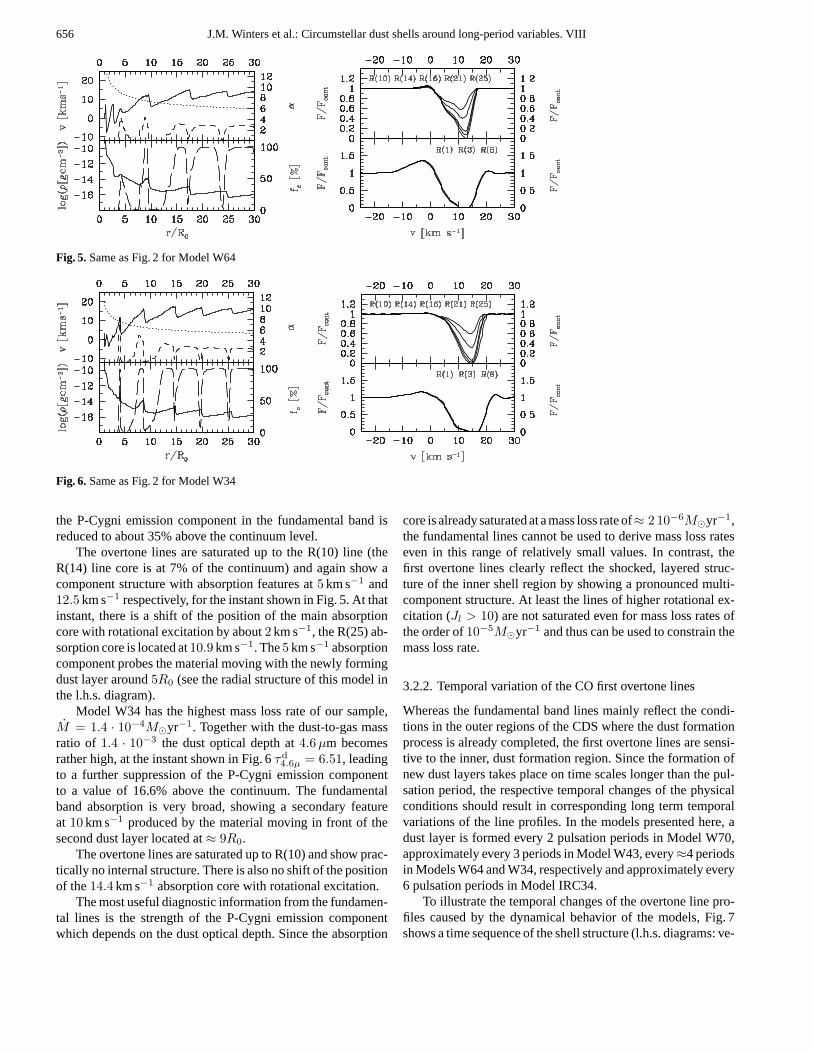
The line profiles of Model W64, which has an average massloss rate of4.3 10−5M�yr−1, are shown in Fig. 5. Due to thefurther increased dust optical depth at4.6 µm of τd
4.6 µ = 3.70,
656 J.M. Winters et al.: Circumstellar dust shells around long-period variables. VIII
Fig. 5. Same as Fig. 2 for Model W64
Fig. 6. Same as Fig. 2 for Model W34
the P-Cygni emission component in the fundamental band isreduced to about 35% above the continuum level.
The overtone lines are saturated up to the R(10) line (theR(14) line core is at 7% of the continuum) and again show acomponent structure with absorption features at5 km s−1 and12.5 km s−1 respectively, for the instant shown in Fig. 5. At thatinstant, there is a shift of the position of the main absorptioncore with rotational excitation by about2 km s−1, the R(25) ab-sorption core is located at10.9 km s−1. The5 km s−1 absorptioncomponent probes the material moving with the newly formingdust layer around5R0 (see the radial structure of this model inthe l.h.s. diagram).
Model W34 has the highest mass loss rate of our sample,M = 1.4 · 10−4M�yr−1. Together with the dust-to-gas massratio of 1.4 · 10−3 the dust optical depth at4.6 µm becomesrather high, at the instant shown in Fig. 6τd
4.6µ = 6.51, leadingto a further suppression of the P-Cygni emission componentto a value of 16.6% above the continuum. The fundamentalband absorption is very broad, showing a secondary featureat 10 km s−1 produced by the material moving in front of thesecond dust layer located at≈ 9R0.
The overtone lines are saturated up to R(10) and show prac-tically no internal structure. There is also no shift of the positionof the14.4 km s−1 absorption core with rotational excitation.
The most useful diagnostic information from the fundamen-tal lines is the strength of the P-Cygni emission componentwhich depends on the dust optical depth. Since the absorption
core is already saturated at a mass loss rate of≈ 2 10−6M�yr−1,the fundamental lines cannot be used to derive mass loss rateseven in this range of relatively small values. In contrast, thefirst overtone lines clearly reflect the shocked, layered struc-ture of the inner shell region by showing a pronounced multi-component structure. At least the lines of higher rotational ex-citation (Jl > 10) are not saturated even for mass loss rates ofthe order of10−5M�yr−1 and thus can be used to constrain themass loss rate.
3.2.2. Temporal variation of the CO first overtone lines
Whereas the fundamental band lines mainly reflect the condi-tions in the outer regions of the CDS where the dust formationprocess is already completed, the first overtone lines are sensi-tive to the inner, dust formation region. Since the formation ofnew dust layers takes place on time scales longer than the pul-sation period, the respective temporal changes of the physicalconditions should result in corresponding long term temporalvariations of the line profiles. In the models presented here, adust layer is formed every 2 pulsation periods in Model W70,approximately every 3 periods in Model W43, every≈4 periodsin Models W64 and W34, respectively and approximately every6 pulsation periods in Model IRC34.
To illustrate the temporal changes of the overtone line pro-files caused by the dynamical behavior of the models, Fig. 7shows a time sequence of the shell structure (l.h.s. diagrams: ve-

J.M. Winters et al.: Circumstellar dust shells around long-period variables. VIII 657
Fig. 7.Radial shell structure (l.h.s. and middle column) and corresponding first overtone line profiles (R(10), R(14), R(16), R(21), and R(25) inorder of decreasing strength) (r.h.s) for Model IRC34 at 7 different instants of time, separated by one pulsation period each
locity (solid line) and density (dashed line), middle diagrams:degree of condensation (solid line) and temperature (dashedline)) and of the corresponding synthetic first overtone line pro-files (r.h.s. diagrams) of Model IRC34. The instants shown inFig. 7 are separated by one pulsation cycle each. One clearlysees, that the radial structure and also the shape of the line pro-files do not repeat from cycle to cycle.
This model produces alternating single– and double-peakeddust layers as can be seen from the radial distribution of the
degree of condensation (compare the instantst = 70.25 P,t = 73.25 P, andt = 75.25 P). These dust layers are accel-erated and driven outwards by radiation pressure (see e.g. thesequencet = 70.25 P. . . t = 74.25 P). The radial structureof the shell (i.e. the position of the dust layers) approximatelyrepeats after 6 cycles in this model (comparet = 70.25 P andt = 76.25 P), but since the degree of condensation and, con-sequently the radiation force, is lower for the later instant, thecorresponding layers are moving at different velocities, being
658 J.M. Winters et al.: Circumstellar dust shells around long-period variables. VIII
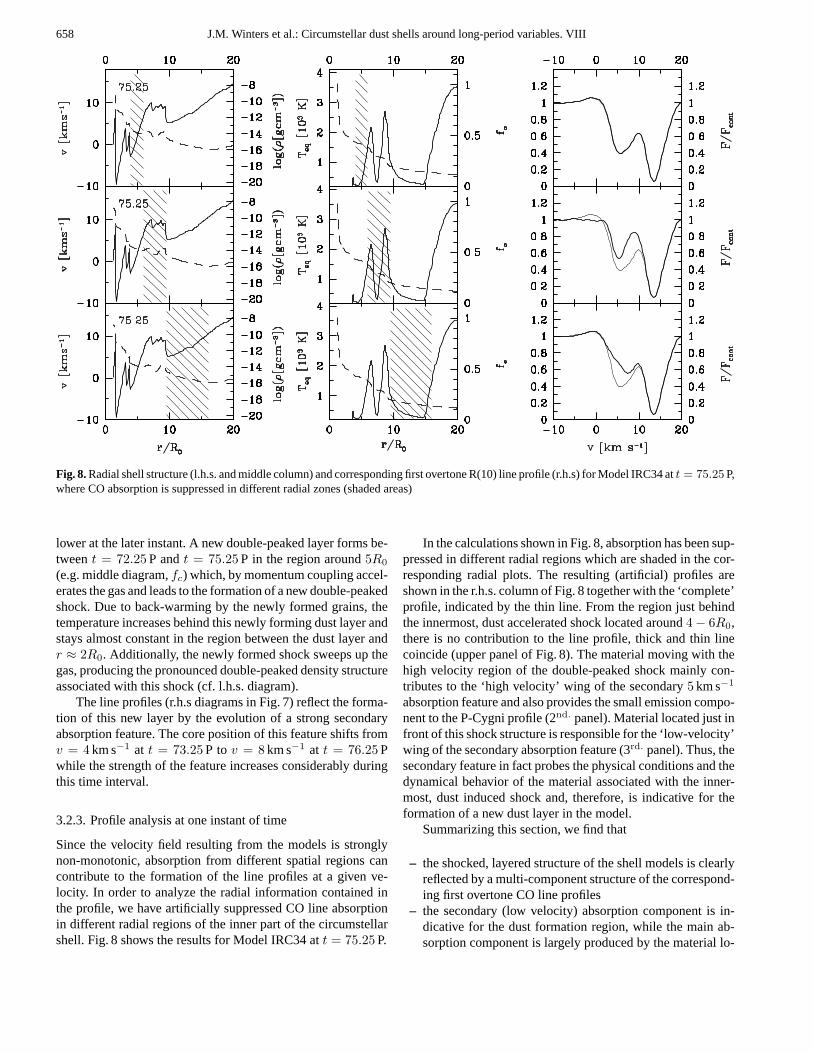
Fig. 8.Radial shell structure (l.h.s. and middle column) and corresponding first overtone R(10) line profile (r.h.s) for Model IRC34 att = 75.25 P,where CO absorption is suppressed in different radial zones (shaded areas)
lower at the later instant. A new double-peaked layer forms be-tweent = 72.25 P andt = 75.25 P in the region around5R0(e.g. middle diagram,fc) which, by momentum coupling accel-erates the gas and leads to the formation of a new double-peakedshock. Due to back-warming by the newly formed grains, thetemperature increases behind this newly forming dust layer andstays almost constant in the region between the dust layer andr ≈ 2R0. Additionally, the newly formed shock sweeps up thegas, producing the pronounced double-peaked density structureassociated with this shock (cf. l.h.s. diagram).
The line profiles (r.h.s diagrams in Fig. 7) reflect the forma-tion of this new layer by the evolution of a strong secondaryabsorption feature. The core position of this feature shifts fromv = 4 km s−1 at t = 73.25 P tov = 8 km s−1 at t = 76.25 Pwhile the strength of the feature increases considerably duringthis time interval.
3.2.3. Profile analysis at one instant of time
Since the velocity field resulting from the models is stronglynon-monotonic, absorption from different spatial regions cancontribute to the formation of the line profiles at a given ve-locity. In order to analyze the radial information contained inthe profile, we have artificially suppressed CO line absorptionin different radial regions of the inner part of the circumstellarshell. Fig. 8 shows the results for Model IRC34 att = 75.25 P.
In the calculations shown in Fig. 8, absorption has been sup-pressed in different radial regions which are shaded in the cor-responding radial plots. The resulting (artificial) profiles areshown in the r.h.s. column of Fig. 8 together with the ‘complete’profile, indicated by the thin line. From the region just behindthe innermost, dust accelerated shock located around4 − 6R0,there is no contribution to the line profile, thick and thin linecoincide (upper panel of Fig. 8). The material moving with thehigh velocity region of the double-peaked shock mainly con-tributes to the ‘high velocity’ wing of the secondary5 km s−1
absorption feature and also provides the small emission compo-nent to the P-Cygni profile (2nd. panel). Material located just infront of this shock structure is responsible for the ‘low-velocity’wing of the secondary absorption feature (3rd. panel). Thus, thesecondary feature in fact probes the physical conditions and thedynamical behavior of the material associated with the inner-most, dust induced shock and, therefore, is indicative for theformation of a new dust layer in the model.
Summarizing this section, we find that
– the shocked, layered structure of the shell models is clearlyreflected by a multi-component structure of the correspond-ing first overtone CO line profiles
– the secondary (low velocity) absorption component is in-dicative for the dust formation region, while the main ab-sorption component is largely produced by the material lo-
J.M. Winters et al.: Circumstellar dust shells around long-period variables. VIII 659
cated farther out in the shell, where the dust formation pro-cess is already completed
– the dynamics of the dust formation process is clearly re-flected in the temporal evolution of the synthetic CO firstovertone line profiles resulting from the models.
4. Application to IRC +10216
Since its discovery in the 1960’s, IRC +10216 has been an excep-tional target of numerous observational and theoretical investi-gations, which revealed a wealth of very detailed informationabout this object. However, even now its distance from earth, itsluminosity, and its mass loss rate are not known too precisely.Recent investigations favor a distance of110 pc<∼ d <∼ 150 pc(e.g., Zuckerman et al. 1986, Jura & Kleinmann 1989, Groe-newegen et al. 1998) instead ofd = 270 pc first derived by Her-big & Zappala (1970). The models discussed in the present paperhave luminosities in the range7500 L� ≤ L∗ ≤ 15000 L� (seeTable 1) which, assuming a total flux of2·10−12 W cm2 receivedfrom IRC +10216 at earth (e.g., Ridgway & Keady 1988) wouldcorrespond to a range in distance of110 ≤ d ≤ 150 pc, muchin agreement with the above values.
From previous modeling, there are indications that the massloss rate of IRC +10216 might have changed considerablywithin the last∼ 5000 years, being lower presently by up toa factor of 5 (e.g., Sahai 1987, Truong-Bach et al. 1991, Keady& Ridgway 1993, Groenewegen et al. 1998). If that is true, massloss rate determinations sensitive to the outer region (>∼ 50′′) ofthe IRC +10216 shell should result in higher values ofM thando methods which probe the inner parts of the shell. Table 2summarizes some values given for the mass loss rate and thedistance in the literature. Since many mass loss rate determina-tions can be scaled by the distance to the object (e.g.,M ∝ d2
when M is derived from CO rotational lines whileM ∝ dfor determinations from IR photometry) we also give respectivevalues forM scaled to a distance of135 pc to facilitate the com-parison. However, such scaling can not be applied to the moresophisticated models, where the mass loss rate results from aconsistent description of the circumstellar shell. In particular,a simple scaling is impossible for the models presented in thispaper. E.g., increasing the luminosity of our model (thus the dis-tance to the object), would increase the mass loss rate but at thesame time it would also increase the outflow velocity of the windand would decrease the dust-to-gas ratio and, therefore, wouldconsiderably change the synthetic line profiles (see Sect. 3.2.1).From Table 2 it seems likely, that the present day mass loss rateof IRC +10216 is close to1 · 10−5M�yr−1. However, we notethat there are two recent investigations (Crosas & Menten 1997,Skinner et al. 1999) which result in considerably (a factor of 3)higher values than this.
The most widely used mass loss rate determinations havebeen done from CO rotational lines, which probe the mate-rial outside of≈ 100 R∗ from the star. At these distances theIRC +10216 circumstellar shell exhibits a rather sphericallysymmetric appearance (e.g., Mauron & Huggins 1999). How-ever, in its inner parts where the CO infrared lines emerge,
Table 2.Gas mass loss rates and distances derived for IRC +10216 indifferent investigations. The last column gives the mass loss rate scaledto a distance of135 pc and the scaling law used. o/i indicates mass lossrates derived for the outer/inner shell region
M d ref. M@135 pc[10−5M�yr−1] [pc] [10−5M�yr−1]
5.7o 290 J83 1.8 d3/2
4.4o 260 KM85 1.2 d2
4.8o 300 S87 2.4 d3.2i 300 S87 1.6 d2.0i 200 KHR88 0.9-1.35 d-d2
4.0o 200 TMN91 2.7 d2.5i 200 TMN91 1.1-1.7 d-d2
2.0o 150 K92 1.8-2 < d3.25 150 CM97 2.9 d1.16i 135 LB97 1.16 -7.5o 135 GVM98 7.5 -1.5i 135 GVM98 1.5 -5.0 170 SJT99 3.9-3.2 d-d2
∼ 1 115 present work
References:J83 Jura (1983), KM85 Knapp & Morris (1985),S87 Sahai (1987), KHR88 Keady et al. (1988), TMN91 Truong-Bach et al. (1991), K92 Kastner (1992), CM97 Crosas & Menten(1997), LB97 Le Bertre (1997), GVM98 Groenewegen et al. (1998),SJT99 Skinner et al. (1999)
the morphology of IRC +10216 is quite different, showing apronounced clumpyness (e.g., Weigelt et al. 1998, Haniff &Buscher 1998, Osterbart et al. 2000) and even signs of a bipolarstructure (Skinner et al. 1998, Osterbart et al. 2000), suggest-ing that IRC +10216 might presently be transforming into aproto-planetary nebula. The application of spherically symmet-ric models to the inner region of IRC +10216 therefore should betaken with care. The intention of the discussion in the followingsections is to demonstrate, that our time-dependent modelingapproach, which is based on first principles, results in shapesof the CO infrared line profiles and of their temporal variation,which are in excellent agreement with high spectral resolutionobservations. However, we do not intend a rigorous quantitativemodelling of IRC +10216 here.
4.1. Observed CO infrared line profiles
CO infrared absorption lines emerge from the inner parts of thewind, where the flow starts and accelerates. Therefore high res-olution IR spectroscopy, which resolves individual vibration ro-tation lines, can reveal considerable details about the dynamicsin this region as has already been demonstrated by many authors(e.g. Hinkle 1978; Hinkle et al. 1982, 1984; Keady et al. 1988;Keady & Ridgway 1993). The observations of the CO funda-mental and overtone lines presented in this section were ob-tained on various dates at the KPNO Mayall 4 meter telescopeusing the Fourier Transform spectrometer at the coude focus.The integration times vary from 2 – 3hours for the4.6 µm fun-damental lines to 10 hours for the2.3 µm overtone lines. The
660 J.M. Winters et al.: Circumstellar dust shells around long-period variables. VIII
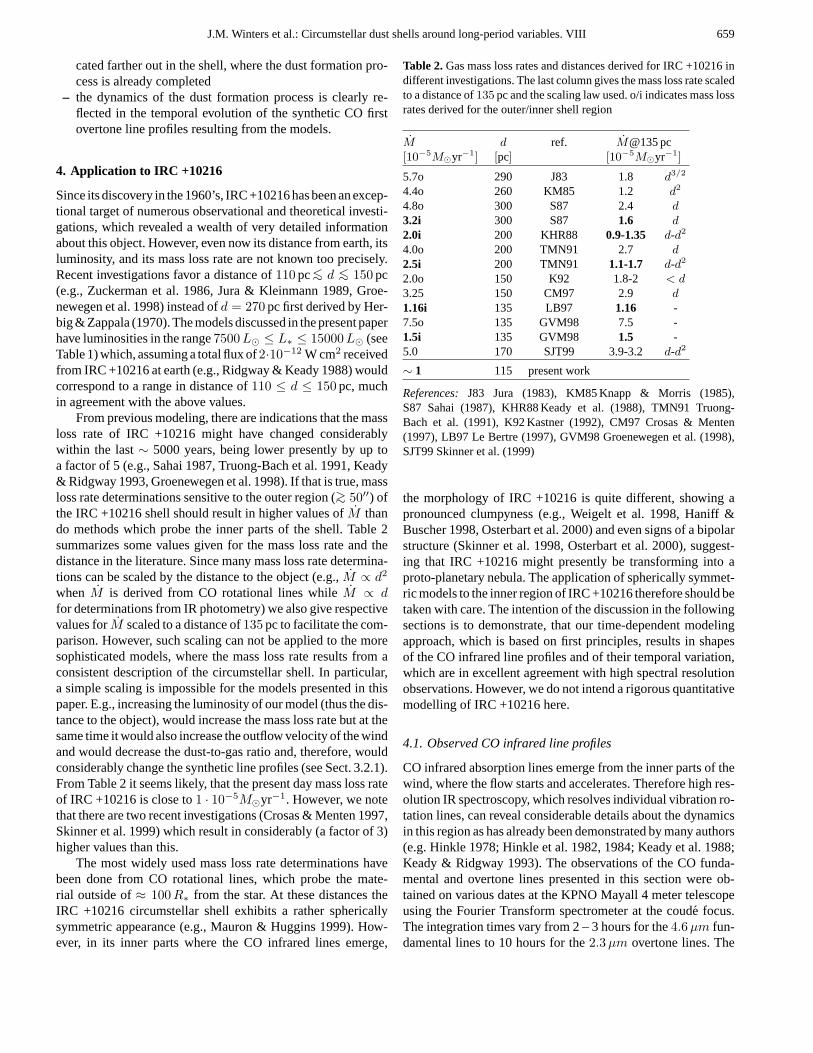
Fig. 9. Observed CO infrared line spectra of IRC +10216 obtained onNov 6, 1981: lower diagram: fundamental (v 0-1) transitions, upperdiagram: first overtone (v 0-2) transitions. Blue-shifted lines are atpositive velocities.
resolution ranges from 2 – 4 km s−1, and the ratios of peak sig-nal to rms noise are typically in excess of several hundred toone.
In Fig. 9 we show observed CO line spectra of (v 0-1) fun-damental band lines and (v 0-2) first overtone band lines fromIRC +10216. The fundamental band lines show the classic P-Cygni profiles with an emission component of≈ 30% above thecontinuum and an extremely saturated blue-shifted absorptioncore at≈ 14 km s−1. Owing to the tremendous saturation themost useful information is provided by the P-Cygni emissioncomponent, which constrains the dust optical depth in the5 µmregion to values between about2 − 4, as otherwise either toomuch (for smaller dust optical depth) or too little emission (forlarger optical depth) would result (see Sect. 3.2.1). The observedovertone lines show a multi–component absorption structure ex-tending out to14 km s−1, and the location and strength of theindividual absorption components (e.g. at10 km s−1) dependson the rotational excitation. These properties make them suit-able to probe the velocity field in the acceleration region of thewind.
4.2. Comparison of the synthetic CO lineswith the observations
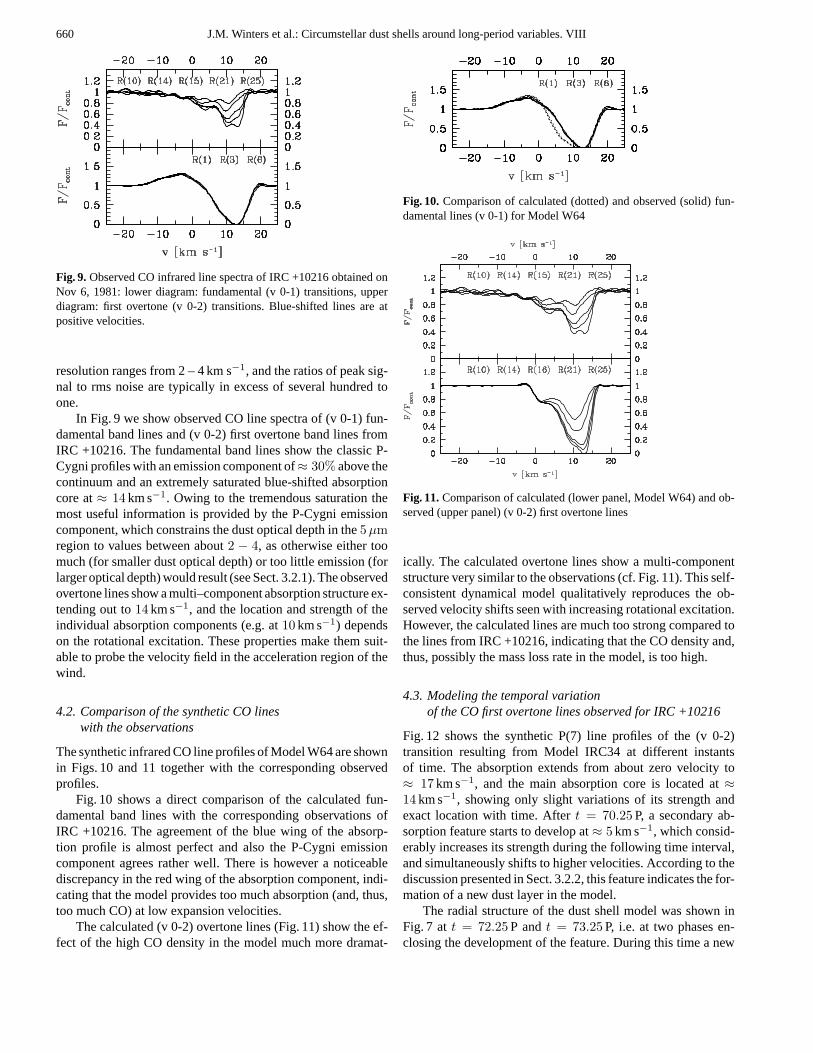
The synthetic infrared CO line profiles of Model W64 are shownin Figs. 10 and 11 together with the corresponding observedprofiles.
Fig. 10 shows a direct comparison of the calculated fun-damental band lines with the corresponding observations ofIRC +10216. The agreement of the blue wing of the absorp-tion profile is almost perfect and also the P-Cygni emissioncomponent agrees rather well. There is however a noticeablediscrepancy in the red wing of the absorption component, indi-cating that the model provides too much absorption (and, thus,too much CO) at low expansion velocities.
The calculated (v 0-2) overtone lines (Fig. 11) show the ef-fect of the high CO density in the model much more dramat-
Fig. 10. Comparison of calculated (dotted) and observed (solid) fun-damental lines (v 0-1) for Model W64
Fig. 11.Comparison of calculated (lower panel, Model W64) and ob-served (upper panel) (v 0-2) first overtone lines
ically. The calculated overtone lines show a multi-componentstructure very similar to the observations (cf. Fig. 11). This self-consistent dynamical model qualitatively reproduces the ob-served velocity shifts seen with increasing rotational excitation.However, the calculated lines are much too strong compared tothe lines from IRC +10216, indicating that the CO density and,thus, possibly the mass loss rate in the model, is too high.
4.3. Modeling the temporal variationof the CO first overtone lines observed for IRC +10216
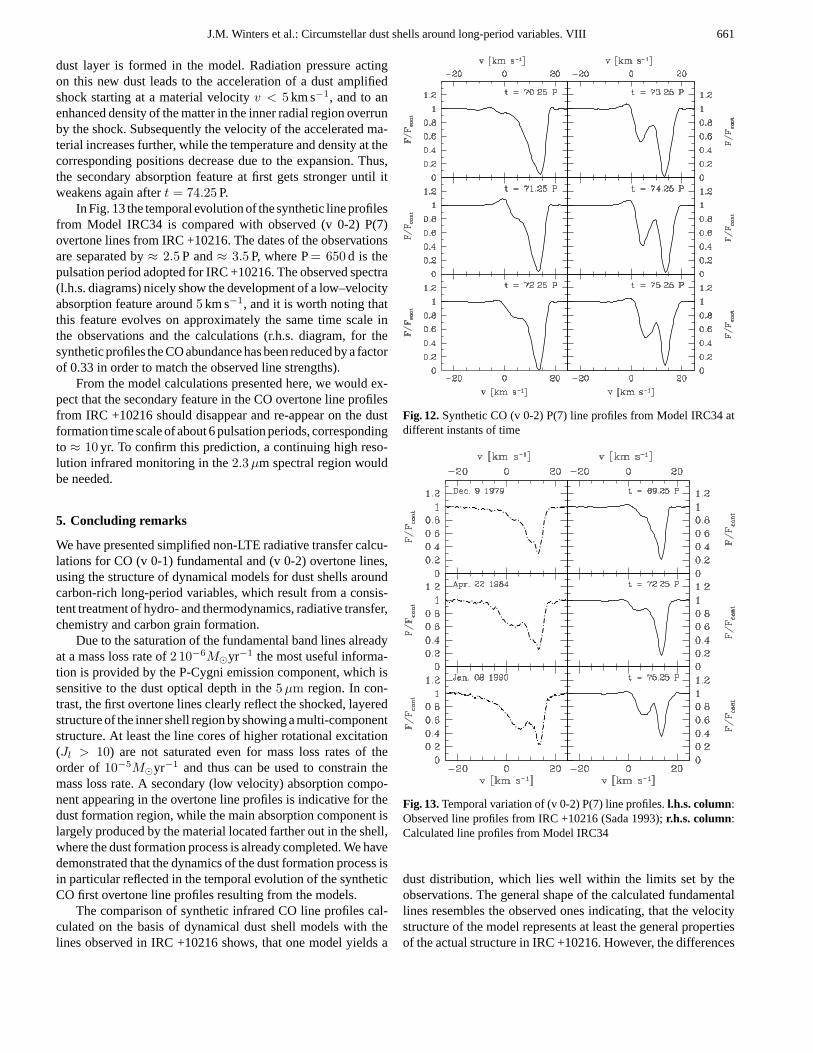
Fig. 12 shows the synthetic P(7) line profiles of the (v 0-2)transition resulting from Model IRC34 at different instantsof time. The absorption extends from about zero velocity to≈ 17 km s−1, and the main absorption core is located at≈14 km s−1, showing only slight variations of its strength andexact location with time. Aftert = 70.25 P, a secondary ab-sorption feature starts to develop at≈ 5 km s−1, which consid-erably increases its strength during the following time interval,and simultaneously shifts to higher velocities. According to thediscussion presented in Sect. 3.2.2, this feature indicates the for-mation of a new dust layer in the model.
The radial structure of the dust shell model was shown inFig. 7 att = 72.25 P andt = 73.25 P, i.e. at two phases en-closing the development of the feature. During this time a new
J.M. Winters et al.: Circumstellar dust shells around long-period variables. VIII 661
dust layer is formed in the model. Radiation pressure actingon this new dust leads to the acceleration of a dust amplifiedshock starting at a material velocityv < 5 km s−1, and to anenhanced density of the matter in the inner radial region overrunby the shock. Subsequently the velocity of the accelerated ma-terial increases further, while the temperature and density at thecorresponding positions decrease due to the expansion. Thus,the secondary absorption feature at first gets stronger until itweakens again aftert = 74.25 P.
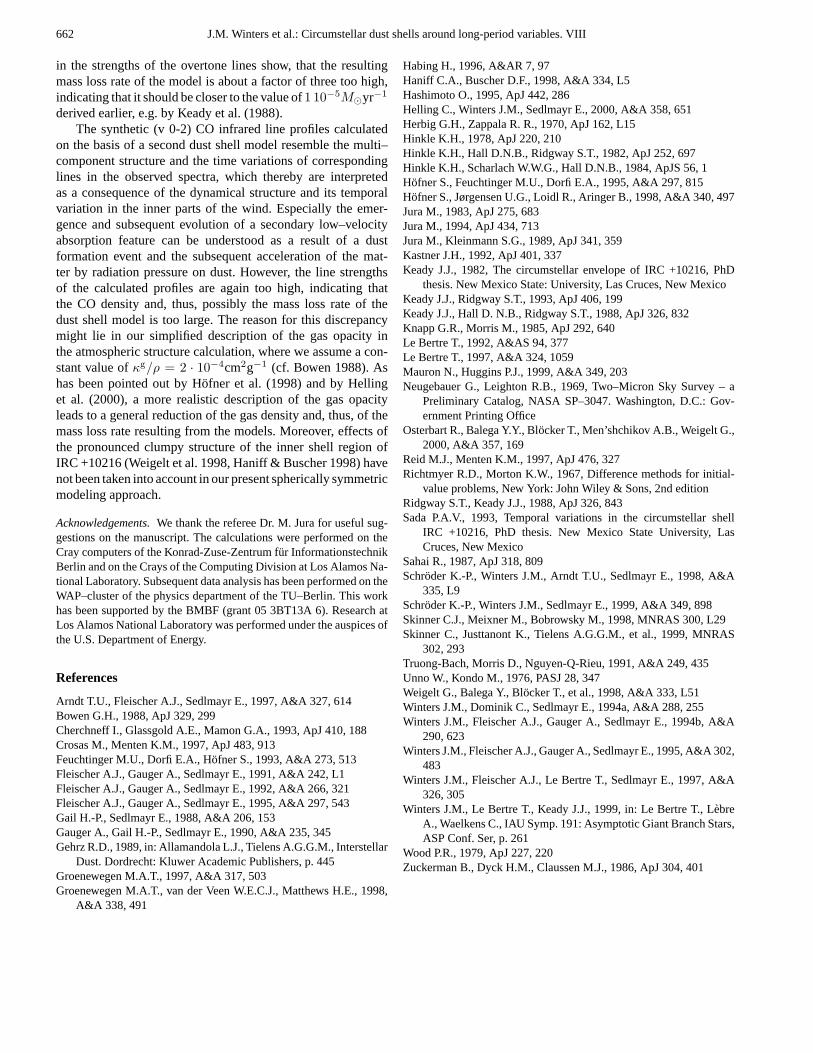
In Fig. 13 the temporal evolution of the synthetic line profilesfrom Model IRC34 is compared with observed (v 0-2) P(7)overtone lines from IRC +10216. The dates of the observationsare separated by≈ 2.5 P and≈ 3.5 P, where P= 650 d is thepulsation period adopted for IRC +10216. The observed spectra(l.h.s. diagrams) nicely show the development of a low–velocityabsorption feature around5 km s−1, and it is worth noting thatthis feature evolves on approximately the same time scale inthe observations and the calculations (r.h.s. diagram, for thesynthetic profiles the CO abundance has been reduced by a factorof 0.33 in order to match the observed line strengths).
From the model calculations presented here, we would ex-pect that the secondary feature in the CO overtone line profilesfrom IRC +10216 should disappear and re-appear on the dustformation time scale of about 6 pulsation periods, correspondingto ≈ 10 yr. To confirm this prediction, a continuing high reso-lution infrared monitoring in the2.3 µm spectral region wouldbe needed.
5. Concluding remarks
We have presented simplified non-LTE radiative transfer calcu-lations for CO (v 0-1) fundamental and (v 0-2) overtone lines,using the structure of dynamical models for dust shells aroundcarbon-rich long-period variables, which result from a consis-tent treatment of hydro- and thermodynamics, radiative transfer,chemistry and carbon grain formation.
Due to the saturation of the fundamental band lines alreadyat a mass loss rate of2 10−6M�yr−1 the most useful informa-tion is provided by the P-Cygni emission component, which issensitive to the dust optical depth in the5 µm region. In con-trast, the first overtone lines clearly reflect the shocked, layeredstructure of the inner shell region by showing a multi-componentstructure. At least the line cores of higher rotational excitation(Jl > 10) are not saturated even for mass loss rates of theorder of10−5M�yr−1 and thus can be used to constrain themass loss rate. A secondary (low velocity) absorption compo-nent appearing in the overtone line profiles is indicative for thedust formation region, while the main absorption component islargely produced by the material located farther out in the shell,where the dust formation process is already completed. We havedemonstrated that the dynamics of the dust formation process isin particular reflected in the temporal evolution of the syntheticCO first overtone line profiles resulting from the models.
The comparison of synthetic infrared CO line profiles cal-culated on the basis of dynamical dust shell models with thelines observed in IRC +10216 shows, that one model yields a
Fig. 12.Synthetic CO (v 0-2) P(7) line profiles from Model IRC34 atdifferent instants of time
Fig. 13.Temporal variation of (v 0-2) P(7) line profiles.l.h.s. column:Observed line profiles from IRC +10216 (Sada 1993);r.h.s. column:Calculated line profiles from Model IRC34
dust distribution, which lies well within the limits set by theobservations. The general shape of the calculated fundamentallines resembles the observed ones indicating, that the velocitystructure of the model represents at least the general propertiesof the actual structure in IRC +10216. However, the differences
662 J.M. Winters et al.: Circumstellar dust shells around long-period variables. VIII
in the strengths of the overtone lines show, that the resultingmass loss rate of the model is about a factor of three too high,indicating that it should be closer to the value of1 10−5M�yr−1
derived earlier, e.g. by Keady et al. (1988).The synthetic (v 0-2) CO infrared line profiles calculated
on the basis of a second dust shell model resemble the multi–component structure and the time variations of correspondinglines in the observed spectra, which thereby are interpretedas a consequence of the dynamical structure and its temporalvariation in the inner parts of the wind. Especially the emer-gence and subsequent evolution of a secondary low–velocityabsorption feature can be understood as a result of a dustformation event and the subsequent acceleration of the mat-ter by radiation pressure on dust. However, the line strengthsof the calculated profiles are again too high, indicating thatthe CO density and, thus, possibly the mass loss rate of thedust shell model is too large. The reason for this discrepancymight lie in our simplified description of the gas opacity inthe atmospheric structure calculation, where we assume a con-stant value ofκg/ρ = 2 · 10−4cm2g−1 (cf. Bowen 1988). Ashas been pointed out by Hofner et al. (1998) and by Hellinget al. (2000), a more realistic description of the gas opacityleads to a general reduction of the gas density and, thus, of themass loss rate resulting from the models. Moreover, effects ofthe pronounced clumpy structure of the inner shell region ofIRC +10216 (Weigelt et al. 1998, Haniff & Buscher 1998) havenot been taken into account in our present spherically symmetricmodeling approach.
Acknowledgements.We thank the referee Dr. M. Jura for useful sug-gestions on the manuscript. The calculations were performed on theCray computers of the Konrad-Zuse-Zentrum fur InformationstechnikBerlin and on the Crays of the Computing Division at Los Alamos Na-tional Laboratory. Subsequent data analysis has been performed on theWAP–cluster of the physics department of the TU–Berlin. This workhas been supported by the BMBF (grant 05 3BT13A 6). Research atLos Alamos National Laboratory was performed under the auspices ofthe U.S. Department of Energy.
References
Arndt T.U., Fleischer A.J., Sedlmayr E., 1997, A&A 327, 614Bowen G.H., 1988, ApJ 329, 299Cherchneff I., Glassgold A.E., Mamon G.A., 1993, ApJ 410, 188Crosas M., Menten K.M., 1997, ApJ 483, 913Feuchtinger M.U., Dorfi E.A., Hofner S., 1993, A&A 273, 513Fleischer A.J., Gauger A., Sedlmayr E., 1991, A&A 242, L1Fleischer A.J., Gauger A., Sedlmayr E., 1992, A&A 266, 321Fleischer A.J., Gauger A., Sedlmayr E., 1995, A&A 297, 543Gail H.-P., Sedlmayr E., 1988, A&A 206, 153Gauger A., Gail H.-P., Sedlmayr E., 1990, A&A 235, 345Gehrz R.D., 1989, in: Allamandola L.J., Tielens A.G.G.M., Interstellar
Dust. Dordrecht: Kluwer Academic Publishers, p. 445Groenewegen M.A.T., 1997, A&A 317, 503Groenewegen M.A.T., van der Veen W.E.C.J., Matthews H.E., 1998,
A&A 338, 491
Habing H., 1996, A&AR 7, 97Haniff C.A., Buscher D.F., 1998, A&A 334, L5Hashimoto O., 1995, ApJ 442, 286Helling C., Winters J.M., Sedlmayr E., 2000, A&A 358, 651Herbig G.H., Zappala R. R., 1970, ApJ 162, L15Hinkle K.H., 1978, ApJ 220, 210Hinkle K.H., Hall D.N.B., Ridgway S.T., 1982, ApJ 252, 697Hinkle K.H., Scharlach W.W.G., Hall D.N.B., 1984, ApJS 56, 1Hofner S., Feuchtinger M.U., Dorfi E.A., 1995, A&A 297, 815Hofner S., Jørgensen U.G., Loidl R., Aringer B., 1998, A&A 340, 497Jura M., 1983, ApJ 275, 683Jura M., 1994, ApJ 434, 713Jura M., Kleinmann S.G., 1989, ApJ 341, 359Kastner J.H., 1992, ApJ 401, 337Keady J.J., 1982, The circumstellar envelope of IRC +10216, PhD
thesis. New Mexico State: University, Las Cruces, New MexicoKeady J.J., Ridgway S.T., 1993, ApJ 406, 199Keady J.J., Hall D. N.B., Ridgway S.T., 1988, ApJ 326, 832Knapp G.R., Morris M., 1985, ApJ 292, 640Le Bertre T., 1992, A&AS 94, 377Le Bertre T., 1997, A&A 324, 1059Mauron N., Huggins P.J., 1999, A&A 349, 203Neugebauer G., Leighton R.B., 1969, Two–Micron Sky Survey – a
Preliminary Catalog, NASA SP–3047. Washington, D.C.: Gov-ernment Printing Office
Osterbart R., Balega Y.Y., Blocker T., Men’shchikov A.B., Weigelt G.,2000, A&A 357, 169
Reid M.J., Menten K.M., 1997, ApJ 476, 327Richtmyer R.D., Morton K.W., 1967, Difference methods for initial-
value problems, New York: John Wiley & Sons, 2nd editionRidgway S.T., Keady J.J., 1988, ApJ 326, 843Sada P.A.V., 1993, Temporal variations in the circumstellar shell
IRC +10216, PhD thesis. New Mexico State University, LasCruces, New Mexico
Sahai R., 1987, ApJ 318, 809Schroder K.-P., Winters J.M., Arndt T.U., Sedlmayr E., 1998, A&A
335, L9Schroder K.-P., Winters J.M., Sedlmayr E., 1999, A&A 349, 898Skinner C.J., Meixner M., Bobrowsky M., 1998, MNRAS 300, L29Skinner C., Justtanont K., Tielens A.G.G.M., et al., 1999, MNRAS
302, 293Truong-Bach, Morris D., Nguyen-Q-Rieu, 1991, A&A 249, 435Unno W., Kondo M., 1976, PASJ 28, 347Weigelt G., Balega Y., Blocker T., et al., 1998, A&A 333, L51Winters J.M., Dominik C., Sedlmayr E., 1994a, A&A 288, 255Winters J.M., Fleischer A.J., Gauger A., Sedlmayr E., 1994b, A&A
290, 623Winters J.M., Fleischer A.J., Gauger A., Sedlmayr E., 1995, A&A 302,
483Winters J.M., Fleischer A.J., Le Bertre T., Sedlmayr E., 1997, A&A
326, 305Winters J.M., Le Bertre T., Keady J.J., 1999, in: Le Bertre T., Lebre
A., Waelkens C., IAU Symp. 191: Asymptotic Giant Branch Stars,ASP Conf. Ser, p. 261
Wood P.R., 1979, ApJ 227, 220Zuckerman B., Dyck H.M., Claussen M.J., 1986, ApJ 304, 401