Embed Size (px)
Citation preview
Discovery of Reflection Nebulosity Around Five Vega-like Stars
Paul Kalas1,2, James R. Graham1,2, Steven Beckwith3,
David C. Jewitt4 and James P. Lloyd1,2
ABSTRACT
Coronagraphic optical observations of six Vega-like stars reveal reflection nebulosi-ties, five of which were previously unknown. The nebulosities illuminated by HD 4881,HD 23362, HD 23680, HD 26676, and HD 49662 resemble that of the Pleiades, indicat-ing an interstellar origin for dust grains. The reflection nebulosity around HD 123160has a double-arm morphology, but no disk-like feature is seen as close as 2.5′′ fromthe star in K-band adaptive optics data. We demonstrate that uniform density dustclouds surrounding HD 23362, HD 23680 and HD 123160 can account for the observed12−100 µm spectral energy distributions. For HD 4881, HD 26676, and HD 49662 anadditional emission source, such as from a circumstellar disk or non-equilibrium grainheating, is required to fit the 12−25 µm data. These results indicate that in somecases, particularly for Vega-like stars located beyond the Local Bubble (>100 pc), thedust responsible for excess thermal emission may originate from the interstellar mediumrather than from a planetary debris system.
Subject headings: circumstellar matter—reflection nebulae— infrared: stars and ISM—instrumentation: adaptive optics
1. Introduction
The far-infrared (FIR), all-sky survey conducted by the Infrared Astronomical Satellite (IRAS)revealed that roughly 15% of nearby main sequence stars have excess thermal emission due to thepresence of circumstellar dust (Backman & Gillett 1987; Aumann 1988; Plets 1999). The thermalexcess was first discovered around Vega (Aumann et al. 1984), and approximately 100 main sequencestars display the “Vega Phenomenon” (Backman & Paresce 1993). The spectral energy distributions(SEDs) of Vega-like stars are typically fitted assuming disk-like distributions of grains (Sylvester &Skinner 1996), though in the optically thin regime the adopted geometry plays no role. Assuming
1Astronomy Department, University of California, 601 Campbell Hall, Berkeley, CA 94720
2Center for Adaptive Optics, University of California, Santa Cruz, CA, 95064
3Space Telescope Science Institute, 3700 San Martin Drive, Baltimore, MD 21218
4University of Hawaii, 2680 Woodlawn Drive, Honolulu, HI 96822
– 2 –
the grains orbit the host stars as circumstellar disks, the dust destruction timescales are typicallyone or two orders of magnitude shorter than the stellar ages. The existence of unseen parentbodies, exosolar analogs to Kuiper Belt objects, is inferred in order to replenish the dust complexvia collisional erosion (Backman & Paresce 1993).
High resolution imaging of Vega-like stars has confirmed the existence of circumstellar debrisdisks around ∼7 main sequence stars (Kalas 1998; Lagrange et al. 2000). However, the ratio ofdebris disks inferred from the FIR SEDs, to those spatially resolved by imaging, is roughly 10:1.Here we present coronagraphic images of reflection nebulosity surrounding six main sequence starspreviously identified as Vega-like (Backman & Paresce 1993; Sylvester et al. 1996). The new datashow dust morphology that is not disk-like, but qualitatively resembles the Pleiades reflectionnebulosity in five cases. Dust scattered light detected around HD 123160 shares characteristicswith nebulosities seen in both the Pleiades and in star forming regions.
2. Observations & Data Reduction
We used an optical coronagraph at the University of Hawaii (UH) 2.2 m telescope to obtainCCD images in the R-band (Table 1). HD 123160 was also imaged in the V -band. Reimaging opticsgave 0.4′′ per pixel, sufficient to Nyquist sample the ∼1.2′′ full-width at half-maximum (FWHM)point-spread function (PSF). The field of view was a circular region with diameter 5.5′.
Follow-up observations were obtained in the near-infrared (NIR) for HD 123160 using the LickObservatory 3 m telescope (Table 1). A 256×256 pixel (0.076′′/pixel), coronagraphic, near-infraredcamera was used to artificially eclipse the central star with a 0.7′′ wide finger (Lloyd et al. 2000).Adaptive optics compensation (Max et al. 1997) using the primary star as a wavefront referencesource improved image quality from ∼1′′ intrinsic seeing to ∼0.16′′ (FWHM).
Our target sample was compiled from lists of Vega-like stars published by Sylvester et al. (1996)and Backman & Paresce (1993). We imaged all 22 Vega-like stars from Table 16 in Sylvester et al.(1996), and 38 of the 60 stars from Table VIII in Backman & Paresce (1993). The total sample of79 stars (the two tables have three stars in common) includes several with resolved debris disks (βPic, Vega, ε Eri, and Fomalhaut), two members of the Pleiades (18 Tau and 21 Tau), and threeHerbig Ae/Be stars (HD 34282, HD 35187, and HD 141569). We also observed stars nearby in thesky and with magnitudes comparable to the science targets to be used later as template stars forPSF subtraction.
Data reduction followed the standard steps of bias subtraction, flat-fielding, sky subtraction,image registration, and median-filtering of multiple frames to attain the effective integration timeslisted in Table 1. The PSF of each science target was subtracted by using either template PSFsdiscussed above, or by radially sampling the template PSF, fitting the data with a 7th orderpolynomial, and producing an artificial PSF from this fit. The PSF subtraction step is useful forextracting faint nebulosity as close to the star as possible, but the nebulosities discussed here are
– 3 –
detected in raw data. Residual noise after the PSF subtraction dominates the data ∼1′′ beyondthe edge of the occulting spot. Table 1 lists the radius centered on each target star below whichwe cannot obtain reliable information about the circumstellar environment.
3. Results
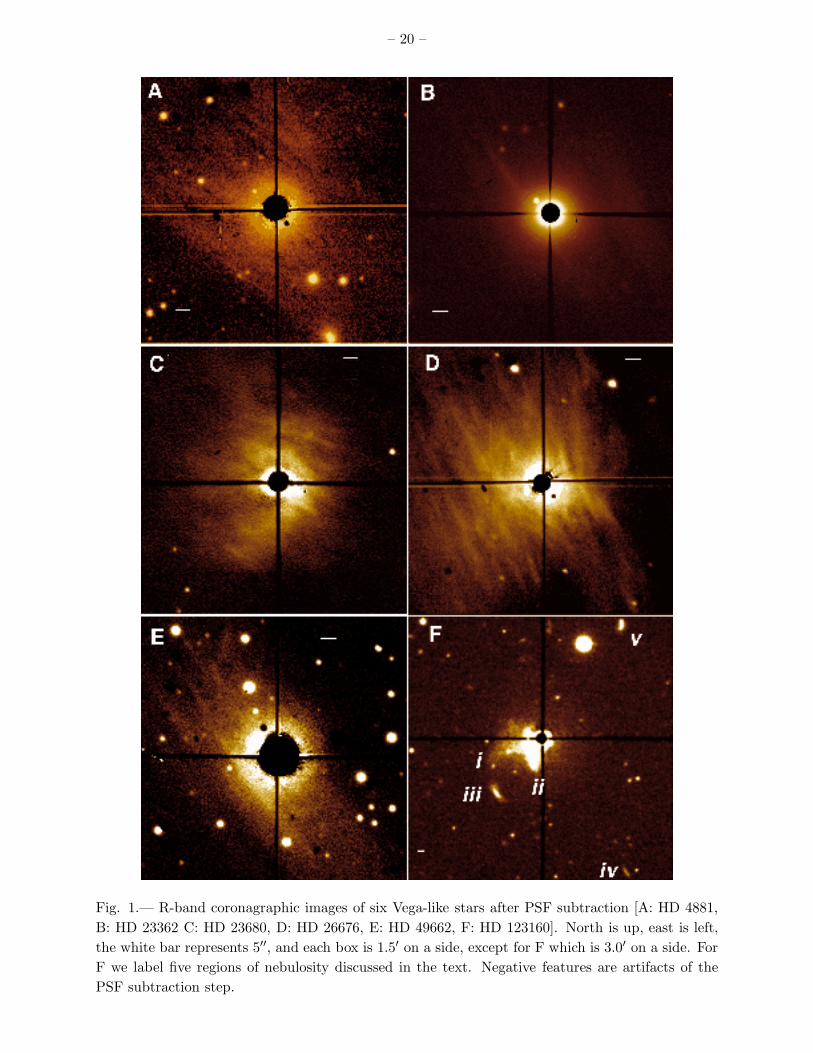
The suppression of direct stellar light with the coronagraph reveals the presence of faint re-flection nebulosity around the six Vega-like stars in Table 1 and Fig. 1. The nebulosites have thefollowing general properties: (a) spatial extent ∼1′−2′ radius; (b) surface brightness varying asradius, r−β, with β≤ 2; (c) range of surface brightness approximately 20 mag arcsec−2 to 24 magarcsec−2; and (d) linear, filamentary, striated morphological structure, similar to that observed inthe Pleiades reflection nebulosities (Arny 1977). The background noise, 3σ ∼24 mag arcsec−2, lim-its the radial extent to which each nebulosity is detected. Table 1 gives the Hipparcos parallaxes,indicating heliocentric distances >100 pc for every star. The detected nebulosities therefore spanspatial scales 103 − 105 AU from their parent stars, and the occulted regions obscure the central∼103 AU (Table 1).
The nebulosity around HD 26676 (Fig. 1D), the brightest and most extended, has been previ-ously documented by van den Bergh (1966) and identified as a member of the Tau R2 association(Racine 1968), which is part of the Pleiades. An examination of the literature indicates that theother five nebulosities were not previously known.
The nebulosity around HD 123160 is characterized by a double-arm structure southeast of thestar (Fig. 1F; Features i and ii), rather than the linear features seen around the other five stars.Arm-like morphologies appear near several pre-main sequence stars such as GM Aur and Z CMa(Nakajima & Golimowski 1995). The outside boundary of arm i traces a closed curve that intersectsfeature iii. The latter is curved in the same direction as i, indicating that iii may be a detachedsegment of i. Another diffuse, curved structure, iv, is 95′′ from the star with position angle andcurved morphology comparable to feature iii. Neither iii nor iv have a core+halo structure thatcharacterizes background field galaxies in these data. We also detect two point sources lying alonga north-south axis and separated by 3.6′′ at position v. They are surrounded by a nebulosity thathas a tail pointing towards HD 123160. Both are red, with V −K=1.7 mag and 1.1 mag for thenorth and south stars, respectively (after applying the extinction correction determined for HD123160 in Table 3). The colors of the northern component are consistent with a late-type stellarphotosphere. However, the southern component has H − K=1.1 mag, indicating an additionalsource of near-infrared emission such as from a circumstellar disk (Meyer, Calvet & Hillenbrand1997).
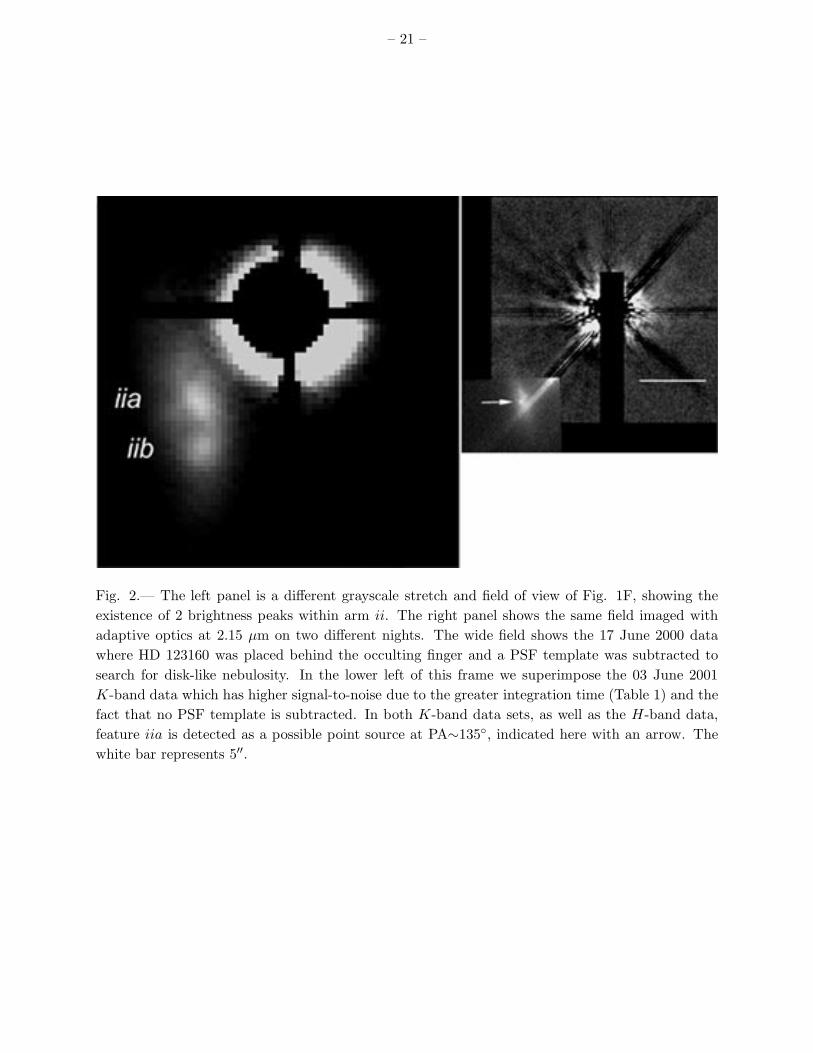
Figure 2 shows that two brightness knots exist within arm ii. In the K-band adaptive opticsdata, the north knot, iia, contains a point-like source 9.7 ±0.2′′ from the star superimposed on thebroader nebular emission. After subtracting an estimate for the background contributed by the
– 4 –
broader nebulosity, the point-like source has V =16.5±0.3 mag and K=14.2±0.3 mag (extinctioncorrected; Table 3). The V − K color is consistent with a K dwarf spectral type and distancemodulus >100 pc. Compared to the optical data, the adaptive optics K-band data probe closer tothe star for any structure that may have a disk-like morphology. No circumstellar disk is detectedas close as ∼2.5′′ from the primary.
Aperture photometry (diameter = 4.0′′) performed on the nebulosities labeled in Figs. 1F and2 gives R and V -band fluxes that decrease radially from the star with β ≤1, rather than β =2or β =3 that would characterize a homogenous medium or dust disk, respectively. For example,iii has 9% the flux of iia, but is 5 times farther from the primary. If both features are producedby grains with similar scattering properties, then iii has approximately twice as many scatteringgrains as iia. The V −R colors range from 0.0 to -0.2 mag after an extinction correction is applied.Using R=7.81 mag for HD 123160 (Sylvester et al. 1996), V − R = +0.2 mag if HD 123160 is aG5V star, or V − R = +0.3 mag if it is a G0III star. Therefore the nebulous features in Figs.1F and 2 appear bluer than HD 123160, consistent with the scattered-light colors of the Meropenebula (Herbig 1996; Herbig & Simon 2001).
The discovery of nebulosity around these Vega-like stars that is not disk-like raises the questionof whether or not the dust emitting in the FIR is contained in disks related to planet building,or merely due to dust contained in the ISM. The “Pleiades Phenomenon” is due to the chanceencounter of bright, nearby stars with a clump of ISM (Arny 1977; White & Bally 1993; Herbig &Simon 2001). Filamentary features in optical scattered light are produced by the shearing of thecloud as radiation pressure pushes dust around each star. Our data do not necessarily exclude theexistence of circumstellar disks in addition to the Pleiades-like nebulosity because the observationsare not sensitive to the central ∼4′′ radius (Table 1). However, the main reason to presume theexistence of a circumstellar disk is that the IRAS data give fluxes in excess of photospheric levels.If the Pleiades-like dust detected here is capable of producing the FIR emission, then the PleiadesPhenomenon is a more plausible explanation for the FIR excesses than the Vega Phenomenon.Below we test the validity of attributing the observed excess FIR emission to an interstellar dustcloud encountering each of our target stars.
4. Thermal Emission Model for the Pleiades Phenomenon
To test if the IRAS far-infrared data are consistent with the Pleiades Phenomenon, we ex-periment with a model comprising a star embedded in a uniform number density, optically thin,dust cloud. The geometry is spherical, except that radiation pressure from the star excavates anaxisymmetric paraboloidal cavity within the cloud, as described by Artymowicz & Clampin (1997).In spherical coordinates, (r, θ, φ), a volume element is given as dV = dr × r sinθdφ × r dθ. Theinner boundary of the cloud cavity has radius,
– 5 –
r = rin
(2
1 + cosθ
)(1)
The smallest radius that grains can approach the star, rin, depends on the relative velocityand the force of radiation pressure (which scales with stellar luminosity and grain properties, suchas size). For example, at a relative velocity of 12.2 km s−1, grains <0.2 µm in size will not approachVega closer than ∼2000 AU, whereas 1 µm sized grains will reach as close as ∼200 AU (Artymowicz& Clampin 1997). In our simulations rin is a free parameter.
Grain temperatures are calculated in each volume element assuming grains receive blackbodyradiation from the star, and emit as blackbodies. Grain absorption and emission efficiences willdepend on grain properties and wavelength regimes. We estimate the absorption and emissionefficiencies empirically by assuming that they have the same functional form as the extinctionfunction for interstellar grains given by Mathis (1990) in his Table 1. A smoothed version of thisextinction function can be described by three power laws with form ε(ν) = εoν
α, where α=0 forλ < 0.5 µm, α= 1.68 for 0.5 µm ≤ λ < 5 µm. and α=1.06 for λ ≥ 5 µm. Very hot stars will put outtheir energy at short wavelengths where the grain absorption efficiency is at a maximum, whereascool stars will not efficiently heat these interstellar grains. Most of the energy re-radiated by grainswill occur in the λ ≥ 5 µm regime, and therefore will have emission efficiency proportional to ν1.06.
The dust cloud thermal emission is fitted to the observed IRAS fluxes by adjusting the grainnumber density, ρ, the inner minimum radius of the cavity, rin, and the outer radius of the cloud,Rout. The photospheric contribution from optical wavelengths through 12 µm is fit by adjusting thestellar temperature, radius, and heliocentric distance. In the first iteration the stellar temperatureand radius are taken from Cox (1999) based on the spectral type for each star given in the literature.
Table 2 gives the observed optical, near-infrared, and far-infrared magnitudes and fluxes. In-terstellar reddening and extinction were calculated using both the B−V and V−K colors and isgiven in Table 3; we used RV =3.1 for the total-to-selective extinction values given by Mathis (1990)in his Table 1. The color correction for the FIR data was obtained from Table VI.C.6 in the IRASExplanatory Supplement Version 2. In Table 4 we list the extinction-corrected optical and NIRphotometry, and the IRAS fluxes color-corrected based on the temperatures listed in Table 1. Inseveral cases an alternate spectral type is proposed and the extinction and photometry are recal-culated. We considered both the IRAS PSC and the FSC data for fitting the model to the 12−100µm fluxes. The uncertainties for these data are given in the respective IRAS catalogs, with typicalvalues ∼10%. The heliocentric distances used in the first iteration are taken from the Hipparcos
parallaxes for each star (Table 1), but beyond 100 pc the Hipparcos distances have significantuncertainties.
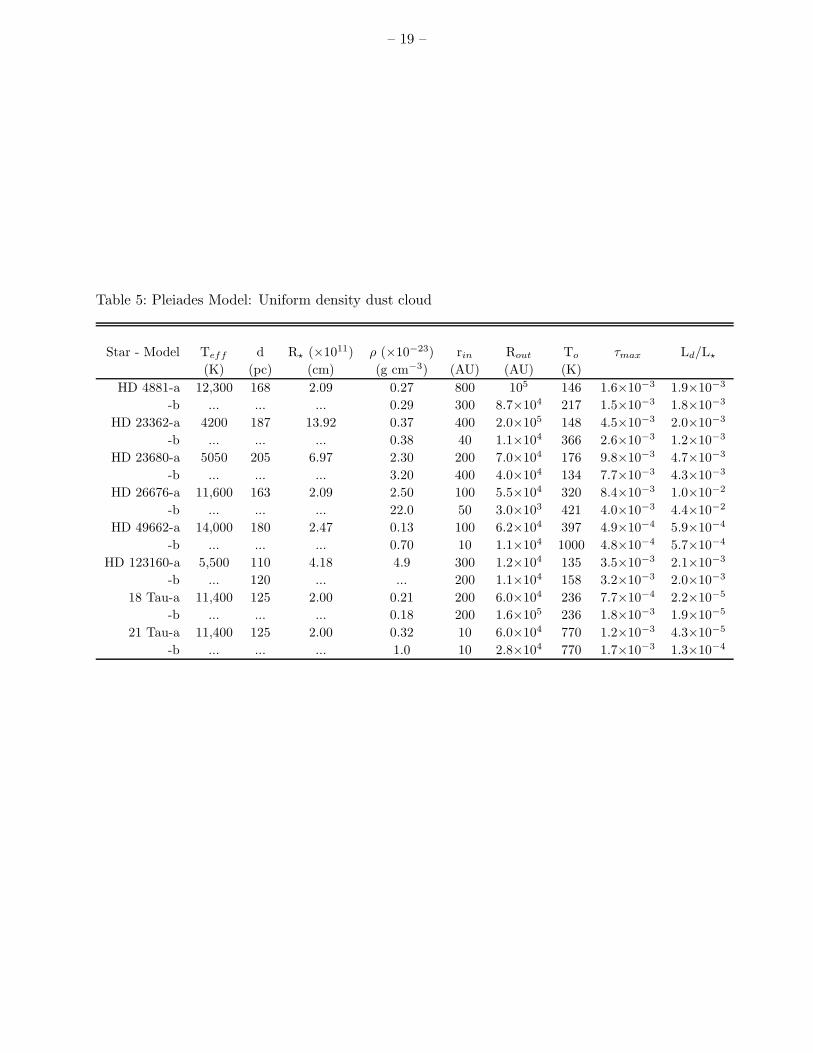
Table 5 gives two examples of model fits to the SED of each star, and Figs. 3 - 10 displaythe model fits as discussed below. Table 5 also lists the maximum grain temperature, To, thefractional infrared luminosity of the cloud, Ld/L? and the maximum optical depth, τmax. For HD
– 6 –
4881, HD 26676 and HD 49662, the model fits to the 60−100 µm emission gives a deficit of 12−25µm emission. Our simple model assumptions do not account for at least four factors that couldenhance the 12−25 µm emission.
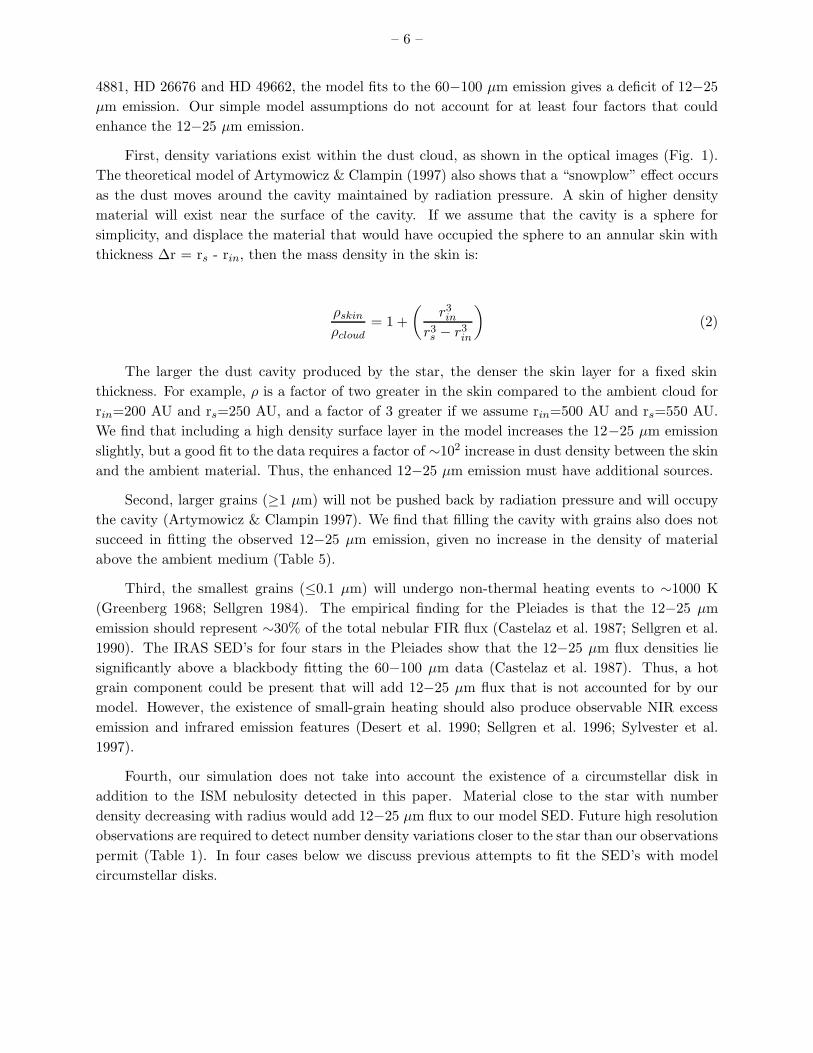
First, density variations exist within the dust cloud, as shown in the optical images (Fig. 1).The theoretical model of Artymowicz & Clampin (1997) also shows that a “snowplow” effect occursas the dust moves around the cavity maintained by radiation pressure. A skin of higher densitymaterial will exist near the surface of the cavity. If we assume that the cavity is a sphere forsimplicity, and displace the material that would have occupied the sphere to an annular skin withthickness ∆r = rs - rin, then the mass density in the skin is:
ρskin
ρcloud= 1 +
(r3in
r3s − r3
in
)(2)
The larger the dust cavity produced by the star, the denser the skin layer for a fixed skinthickness. For example, ρ is a factor of two greater in the skin compared to the ambient cloud forrin=200 AU and rs=250 AU, and a factor of 3 greater if we assume rin=500 AU and rs=550 AU.We find that including a high density surface layer in the model increases the 12−25 µm emissionslightly, but a good fit to the data requires a factor of ∼102 increase in dust density between the skinand the ambient material. Thus, the enhanced 12−25 µm emission must have additional sources.
Second, larger grains (≥1 µm) will not be pushed back by radiation pressure and will occupythe cavity (Artymowicz & Clampin 1997). We find that filling the cavity with grains also does notsucceed in fitting the observed 12−25 µm emission, given no increase in the density of materialabove the ambient medium (Table 5).
Third, the smallest grains (≤0.1 µm) will undergo non-thermal heating events to ∼1000 K(Greenberg 1968; Sellgren 1984). The empirical finding for the Pleiades is that the 12−25 µmemission should represent ∼30% of the total nebular FIR flux (Castelaz et al. 1987; Sellgren et al.1990). The IRAS SED’s for four stars in the Pleiades show that the 12−25 µm flux densities liesignificantly above a blackbody fitting the 60−100 µm data (Castelaz et al. 1987). Thus, a hotgrain component could be present that will add 12−25 µm flux that is not accounted for by ourmodel. However, the existence of small-grain heating should also produce observable NIR excessemission and infrared emission features (Desert et al. 1990; Sellgren et al. 1996; Sylvester et al.1997).
Fourth, our simulation does not take into account the existence of a circumstellar disk inaddition to the ISM nebulosity detected in this paper. Material close to the star with numberdensity decreasing with radius would add 12−25 µm flux to our model SED. Future high resolutionobservations are required to detect number density variations closer to the star than our observationspermit (Table 1). In four cases below we discuss previous attempts to fit the SED’s with modelcircumstellar disks.
– 7 –
4.1. 18 Tau and 21 Tau
Before applying our model to the stars shown in Fig. 1, we test it on two Pleiads that arein the IRAS PSC and FSC, and have been identified as candidate Vega-like stars (Backman &Paresce 1993). 18 Tau (HD 23324) and 21 Tau (HD 23432) are both B8V stars with Hipparcos
distances between 110 pc and 120 pc. Two model fits to the SED of each star are given in Figs.3 and 4, and Table 5. The parameters for models 18 Tau-a are chosen to produce a SED thatfits the PSC 100 µm data. Model 18 Tau-b demonstrates that a fit to the FSC 100 µm pointrequires decreasing the mass density, ρ, and increasing the outer radius, Rout, relative to model 18Tau-a. However, no combination of parameters can fit the 12−25 µm and the 60−100 µm regionssimultaneously, in agreement with the findings of Castelaz et al. (1987). These authors suggest thatthe non-equilibrium heating of small grains may account for the observed excess flux in the IRAS12 and 25 µm passbands. The angular radii of models 18 Tau-a and 18 Tau-b would be 8′ and 21′,respectively. Gaustad & Van Buren (1993) measure 8′ radius for 18 Tau in the IRAS Infrared SkySurvey Atlas (ISSA). Thus, model 18 Tau-a is preferred over 18 Tau-b.
For a straightforward comparison, the model fits to the 21 Tau data use the same stellarparameters as the 18 Tau models. Model 21 Tau-a fits the IRAS 60−100 µm PSC data and againdemonstrates that a second source of 12−25 µm emission is necessary. Relative to the 18 Taumodels, we decrease the inner radius to 10 AU to show that the hotter grains do not add enough12−25 µm flux to match the observations. However, the 60 µm flux density for 21 Tau in the IRASFSC is significantly higher than in the PSC. Model 21 Tau-b gives a fit to the FSC data that agreeswith the entire observed 12-100 µm SED. Thus, the errors in any single FIR data point may changethe physical interpretation significantly. The angular radii of models 21 Tau-a and 21 Tau-b wouldbe 8′ and 3.7′, respectively. Gaustad & Van Buren (1993) measure 5′ radius for 21 Tau in ISSAmaps. Thus, model 21 Tau-b is preferred over 18 Tau-a.
4.2. HD 4881
Given the B9.5V spectral type for HD 4881, our model gives optical-NIR flux densities thatlie well below the observed values if we assume the Hipparcos distance of 350 pc (Table 1) andTeff=11,400 K. Rather, the fit to the optical and NIR data shown in Fig. 5 assumes d=168 pcand Teff=12,300 K. The higher temperature is consistent with the Miroshnichenko et al. (1999)reclassification of this star as B8. The 25−100 µm fluxes are fitted with the dust cloud parametersgiven in Table 5. Figure 5 maps the spectral energy distributions of two model fits. Fitting the100 µm photometry requires that Rout is not smaller than ∼8.7×10⁴ AU. At the assumed distance,the model dust cloud subtends ∼8.6′ radius, which is approximately equal to the average angularextent measured by Dring et al. (1996) in IRAS Skyflux plates. This is larger than the ∼5′ radialextent measured by Gaustad & Van Buren (1993) and Miroshnichenko et al. (1999), but a factorof two uncertainty in the measured angular extent has been demonstrated by Jura (1999). We find
– 8 –
that rin may be varied between 1 AU and 800 AU with the resulting 25 µm flux density containedwithin the IRAS PSC and FSC data points, and with negligible effect on the 12 µm flux density.
At 12 µm our model photosphere+cloud gives F12=0.13 Jy, whereas the observed IRAS valuesare 0.19 ± 0.02 Jy in the PSC, and 0.25 ± 0.02 Jy in the FSC. A poor fit to the 12 µm flux waspreviously found in circumstellar disk models for HD 4881 (Coulson et al. 1998), as well as modelsthat assume spherical dust clouds (Miroshnichenko et al. 1999). Here the 0.06 Jy difference betweenthe flux density in our model and the PSC flux density is equal to the disagreement between thePSC and FSC flux densities. The statistical significance of the poor model fit is therefore bestevaluated after follow-up 10−20 µm observations can better constrain the photometry. If the IRASfluxes are confirmed, then a warm-grain component needs to be added to the model, such as froma circumstellar disk or nonequilibrium small-grain heating.
4.3. HD 23362
Assuming a K2V spectral type, Sylvester et al. (1996) determine that the photometric dis-tance to HD 23362 is 6.5 pc. This contrasts sharply against the subsequent Hippparcos parallaxmeasurement that places HD 23362 at 352 pc. The derived visual extinction of ∼2 mag (Table 3) isalso inconsistent with the Sylvester et al. (1996) distance. In view of the high reddening, Sylvesteret al. (1996) comment that the distance to HD 23362 should be determined independently and thatthe star may be misclassified.
In order to produce a closer match to the Hipparcos distance, we re-calculate the extinctionvalues assuming the spectral type is K2III, with Teff=4200 and R=20R� (Tables 3 and 4). Withthis assumption we are then able to fit the optical and NIR photometric data with a stellar black-body at 187 pc (Table 5, Fig. 6). The model dust cloud parameters are similar to those of HD4881, except that there is no disagreement between the model SED and the 12 µm IRAS flux (Fig.6).
Sylvester & Skinner (1996) attempted to fit the SED with a model circumstellar disk, butfailed to fit the 100 µm flux by an order of magnitude. They concluded that the 100 µm is due toinfrared cirrus. Our model suggests that the 12 µm − 25 µm emission is photospheric, and that allof the 60 µm − 100 µm emission is attributable to interstellar dust. Model 23362-b (Table 5, Fig.6) indicates that Rout may be as small as 1.1×10⁴ AU and still fit the IRAS PSC 100 µm data. Inthis case the cloud subtends ∼1′ radius and would be unresolved in the IRAS 60−100 µm data.
4.4. HD 23680
As with HD 23362, the photometric distance for HD 23680 given the G5V spectral type is ∼20pc (Sylvester & Skinner 1996), but both the Hipparcos parallax and the reddening are consistent
– 9 –
with d∼200 pc. We recalculate the reddening values assuming HD 23680 has spectral type G5III,and using Teff=5050 and R=10R�, we fit the stellar SED using distance d=205 pc (Table 5, Fig.7). The cloud model (23680-a) gives satisfactory fits with Rout = 7×10⁴ AU, which subtends ∼6′
radius. However, the second model (23680-b), with Rout = 4×10⁴ AU, also gives an SED passingwithin the error bars of the 100 µm data point. In this case, the cloud’s ∼3′ radius may be resolvedin the 100 µm IRAS data. In our optical data, resolved patches of nebulosity are detected as far as1.7′ from the star, particularly to the north-northeast, with surface brightness R = 24 mag arcsec−2.Inspection of the IRAS Sky Survey Atlas at 100 µm shows an asymmetric morphology extended∼3′ north of the stellar position. Thus, the smaller outer radius for model 23680-b is preferred overmodel 23680-a. As with HD 23362, Sylvester & Skinner (1996) could not fit the IRAS data with acircumstellar disk model. In particular, the circumstellar disk model could not reproduce the 100µm flux. Rather, the simple cloud model demonstrated here is consistent with the FIR data.
4.5. HD 26676 & HD 49662
For both of these B stars the dust cloud model cannot fit the 12−25 µm and 60−100 µm regionssimultaneously, as was found for the Pleiads 18 Tau and 21 Tau. In Table 5 and Figs. 8 and 9 weshow two different models for fitting the 12−25 µm data separately from the 60−100 µm data. Themodels fitting the 12−25 µm emission require inner boundaries extending closer to the stars, andwith greater dust number densities, than the dust cloud models that fit the 60−100 µm data. Anumber density distribution increasing toward the star, such as with a circumstellar disk, could alsoenhance the 12 µm and 25 µm fluxes. Thus it is possible that these stars have circumstellar disks andhappen to be interacting with ISM. Alternately, the excess 12−25 µm emission could originate fromnon-equilibrium small-grain heating. As discussed in Section 3, HD 26676 is physically associatedwith the Pleiades. Castelaz et al. (1987) demonstrated that nonequlibrium grain heating in thePleiades nebulosity produces ∼30% of the total 12−100 µm emission at 12 µm and 25 µm. Models26676-a and 49662-a in Figs. 8 and 9 generate only ∼10% of the total observed emission at 12−25µm. Thus, an added small-grain component could alter the resulting SED to fit the data. If thisis true, then evidence should also exist for NIR excess or infrared emission features (Sellgren et al.1996). We have no NIR data for HD 26676, but the NIR data for HD 49662 is consistent with apurely photospheric origin. The scale of emission for models HD 26676-a and HD 49662-a, given thedistances listed in Table 5, is ∼5.5′, which is consistent with the ∼10′ radii measured by Gaustad& Van Buren (1993) in IRAS Skyflux plates.
4.6. HD 123160
The photometric distance of 16 pc assuming that HD 123160 is a G5V star (Sylvester et al.1996) is inconsistent with the lack of parallax information from the Hipparcos and Gliese catalogs,and with the high extinction (Table 3). Though we confirm that the optical and NIR data may be
– 10 –
fit with a G5V star at 16 pc, a nearly equal model SED is obtained by assuming a G0III star at∼110 pc. For either spectral type the visual extinction exceeds 2 magnitudes (Table 3). In Fig.10 and Table 5 we present dust cloud models assuming HD 123160 is a distant giant. However,further study of this system is necessary to determine its evolutionary status. Lithium abundancemeasurements suggest that HD 123160 is relatively young, with age ∼70 Myr (Dunkin, Barlow,& Ryan 1997). This age is comparable to that of many Vega-like stars as well as members of thePleiades. The nebulosities iia and iib (Fig. 2) may originate from the same physical mechanismsthat produce the IC 349 nebulosity near 23 Tau in the Pleiades (Herbig 1996; Herbig & Simon 2001).The semi-stellar appearance of iia is similar to the main knot in IC 349 (Herbig 1996; Herbig &Simon 2001), except that it is very red (Section 3). On the other hand, the entire complex ofnebulous features shown in Fig. 1F resembles a star-forming region where a young star illuminatesits natal dust cloud. Feature iia could be a K star associated with HD 123160. The SED’s producedby our Pleiades cloud model fit the observed 12−100 µm data points (Fig. 10), and the scale ofemission for the models is ∼1.5′ radius. This corresponds to the projected separation between HD123160 and feature iv (Fig. 4F). A circumstellar disk model used by Sylvester & Skinner (1996),assuming HD 123160 is a G5V star at 16 pc, also gives satisfactory fits to the data. However, thepresent high resolution data (Fig. 2) show no evidence for a circumstellar disk, and we thereforefavor the Pleiades cloud model.
5. Discussion
Backman & Paresce (1993) cautioned that thermal emission from reflection nebulosities such asin the Pleiades may appear similar to thermal emission from Vega-like stars. Our simulations of in-terstellar grain emission demonstrate that the nebulae shown in Fig. 1 are capable of producing theexcess thermal emission observed by IRAS. In three cases, a circumstellar disk or non-equilibriumsmall-grain heating may account for the 12−25 µm emission. The latter mechanism is consistentwith our current understanding of grain emission from the Pleiades.
A general problem in interpreting SEDs is that the models typically have as many adjustableparameters as there are data points. Good fits are not persuasive by themselves to determine thedistribution of the dust, especially when the dust is optically thin to absorption and emission.Unlike the SEDs of young stellar objects, the Vega-like stars have strongly peaked far-infraredflux densities consistent with dust with a small range of temperatures. To interpret the dustdistributions as lying in a single plane (disks) requires additional information, such as images ofthe scattered light.
Other authors have fitted the IRAS data for HD 4881, HD 23362, HD 23680, and HD 123160with circumstellar disk models, and in some cases interpreted excess emission at 100 µm as dueto infrared cirrus (Low et al. 1984) in the background. Given the optical data and the results ofour modeling, we argue that the infrared cirrus is local to each star, appearing as the PleiadesPhenomenon in scattered light. From the infrared standpoint, the term “cirrus hotspot” is used
– 11 –
to describe the local heating of ISM by a star. To qualify as cirrus hotspots, FIR emission mustbe extended on arcminute scales with color temperatures between 25 K and 70 K (Gaustad & VanBuren 1993). The early-type stars in the Pleiades, for example, appear as cirrus hotspots in theIRAS data. The three B stars in our list, HD 4881, HD 26676, and HD 49662, are also identifiedas infrared cirrus hotspots (Gaustad & Van Buren 1993; Dring et al. 1996).
Our three B stars, as well as 18 Tau and 21 Tau from the original sample, are given as Vegaexcess stars by Backman & Paresce (1993) in their Table VIII. We find that all but three of theremaining 29 B stars in the Backman & Paresce (1993) table are also identified as cirrus hotspotsby Gaustad & Van Buren (1993). The two different interpretations for the same FIR data illustratethe difficulty in uniquely identifying the origin of dust that produces excess thermal emission. Forinstance, Backman & Paresce (1993) identified Vega-like stars if the color temperature satisfied30 K < T < 500 K, which overlaps the color temperature criterion adopted by Gaustad & VanBuren (1993). However, the Vega-like stars with resolved debris disks and rings (e.g. β Pic, ε
Eri, Fomalhaut, HR 4796A) have heliocentric distances d<100 pc, whereas the stars discussed hereare located at d>100 pc. Thus the unique identification of thermal excess is problematic for themore distant objects. From our initial sample of 79 Vega-like stars, 72 have Hipparcos-detecteddistances, and of these 43 (60%) have d > 100 pc. In part, the source confusion is a questionof spatial resolution. Resolved observations from the optical to the far-infrared are essential fordetermining the nature of circumstellar dust. However, the Sun also lies within a relatively ISM-freebubble 65−250 pc in radius (Sfeir et al. 1999). Thus, the Pleiades phenomenon naturally occurswith greater frequency among the more distant stars.
Though distance is a first order measure for the reliability of identifying the Vega Phenomenon,the Local Bubble has a non-spherical geometry, giving specific directions with respect to the Sunthat are most likely to contain denser ISM that would produce the Pleiades Phenomenon. Sfeiret al. (1999) use the NaI D-line doublet to measure absorption toward stars within 300 pc of theSun, and produce maps of neutral gas in three galactic projections. In Figs. 11, 12, and 13, weplot the locations of Vega-like stars using the same same galactic projections as Sfeir et al. (1999).We take the 60 Vega-like stars from Backman & Paresce (1993) Table VIII (“Bright star catalogmain-sequence stars with Vega-like far-infrared excesses”), and 73 Vega-like stars from Mannings &Barlow (1998) Table 2 (“Newly identified candidate main-sequence stars with debris disks”). Twostars (HD 73390 and HD 181296) in Mannings & Barlow (1998) are in the Backman & Paresce(1993) table, leaving a total sample of 131 stars. From this sample we select the 111 stars thathave Hipparcos-detected distances. Finally, a total of 85 Vega-like stars lie within the three planesof reference defined by Sfeir et al. (1999), and those within 300 pc of the Sun are plotted in Figs.11−13. We overlay two contours that trace the lowest and highest NaI D2 absorption mapped bySfeir et al. (1999). The figure captions give more details.
Figures 11−13 show that the walls of the Local Bubble approach the Sun <50 pc in certaindirections, but are >100 pc distant in other directions, particularly toward the North GalacticPole (Fig. 13; named the “Local Chimney” by Welsh et al. 1999). In the galactic plane view
– 12 –
(Fig. 11) the Local Bubble has maximum extend toward l=225◦, which is also the direction towardHD 49662. However, HD 49662 is located right on the wall of the high density gas. Three moreVega-like stars in Fig. 11 (HD 52140, HD 28149 and HD 108257) appear spatially associated withlocal overdensities of gas.
Figure 12 shows that HD 23680 is in the same general direction of HD 26676 and both arewithin the region of high-density gas. Also evident is a group of five stars that trace the high-density wall at l=180◦, b ∼ −30◦, d∼125 pc. These Vega-like stars (HD 23324 = 18 Tau, HD 23432= 21 Tau, HD 28149, HD 28375, HD 28978) are associated with Taurus and the Pleiades. Twomore groups of five stars each appear in Fig. 12. At l=0◦, b ∼ −30◦, d∼50 pc we find HD 181296,HD 191089, HD 176638, HD 181864, and HD 181327. These are not associated with gas, butHD 181296 and HD 181327 are members of the Tucanae Association (Zuckerman & Webb 2000).Their youth and the lack of interstellar gas favors the Vega Phenomenon interpretation of theirFIR excesses. A third group of Vega-like stars is evident at l=0◦, b ∼ 25◦, 100 pc < d < 150 pc(HD 142096, HD 142165, HD 143018, HD 145263, and HD 145482). These are at the distance anddirection of the Upper Scorpius subgroup of the Sco OB2 association (de Zeeuw et al. 1999) whichis encompassed by a giant reflection nebula (Gordon et al. 1994). The association of these starswith large-scale dust and gas favors the Pleiades Phenomenon interpretation for the FIR excesses.
Figure 13 shows that Vega-like stars may be detected at the greatest distances with the leastconfusion from the ISM in the direction of the North Galactic Pole. The figure also shows a group offour stars at l=90◦, b ∼ −30◦, d∼20 pc (HD 39060 = β Pic, HD 41742, HD 53143, and HD 67199).Their location in the Local Bubble and their association with β Pic favors the Vega Phenomenonexplanation for their FIR excesses.
Overall, the fraction of Vega-like stars that lie at or beyond the Local Bubble wall (thincontour) is >50%. In Fig. 11 we plot 40 Vega-like stars, but only five are in the Local Bubble.The remainder are located at or beyond the wall of low density gas, and 16 of these are in highdensity gas regions. Another 11 stars from the Backman & Paresce (1993) and Mannings & Barlow(1998) tables would appear in Fig. 11 if we plotted distances between 300 and 600 pc. From the 30Vega-like stars plotted in Fig. 12, 16 are in the high-density gas and 6 more lie between the highdensity and low density walls. In Fig. 13, 6 Vega-like stars are in the Local Bubble, 4 lie betweenthe low and high density walls, and 4 more are found in the high density regions.
The post-Hipparcos distance determinations are not only useful for judging the position ofVega-like stars relative to the Local Bubble, they also help evaluate the physical scale of thermalemission. We found that the Hipparcos parallaxes for HD 23362, HD 23680, and HD 123160, aswell as the large reddening values, probably place these stars beyond 100 pc, rather than 6−16 pc,as determined in pre-Hipparcos investigations. The greater distances therefore explain how thethermal emission may originate from ISM material extending 103−105 AU from each star and stillmeet the criteria for inclusion in the IRAS PSC. The possibility that these stars are distant giantsproducing the Pleiades Phenomenon may help explain the infrared excesses observed around ∼100
– 13 –
luminosity class III stars (Zuckerman et al. 1995; Jura 1999; Kim et al. 2001).
6. Summary
We detect optical reflection nebulosity around six main-sequence stars that are candidates forhaving debris disks. Five nebulae share the morphological characteristics of dust surrounding brightstars in the Pleiades. The environment of HD 123160 has features that resemble both the Pleiadesand star forming regions. No disk-like structures are detected, though our optical coronagraphictechnique does not probe the circumstellar environment closer than ∼4′′ radius. The sensitivity-limited radii of the nebulosities are between 1′ and 2′ and the radial measurements of surfacebrightness are consistent with uniform density dust clouds illuminated by the central star.
We show that thermal emission from an optically thin, uniform density dust cloud surroundingHD 23362, HD 23680, and HD 123160 can entirely explain the 12−100 µm emission detected byIRAS. The Pleiades Phenomenon, a random encounter between a clump of ISM and a star, is themost likely explanation for the excess FIR emission. For HD 4881, HD 26676, and HD 49662, theblackbody cloud model cannot simultaneously fit the 12−25 µm and 60−100 µm regions of theIRAS-detected SED. These stars may have circumstellar disks in addition to the interstellar dustdetected in the optical. However, the excess 12−25 µm emission may also arise from non-equilibriumheating of small grains. We show that 18 Tau and 21 Tau in the Pleiades have comparable SED’swith signatures of hot grains in the 12−25 µm fluxes. Future observations sensitive to disk-likestructure within 500 AU of each star, and that search for NIR excesses and emission features,are necessary to determine if these stars are manifesting the Vega Phenomenon and the PleiadesPhenomenon simultaneously.
We find that most Vega-like B stars have also been associated with FIR cirrus hotspots. Wedemonstrate that >50% of Vega Phenomenon stars are located beyond the gas-poor Local Bubble,and many are spatially associated with regions of high density neutral gas. Thus, a significantfraction of Vega Phenomenon stars beyond 100 pc may be confused with Pleiades Phenomenonstars.
Acknowledgements: We are grateful to J. Gradie, B. Zuckerman, and E. Becklin for accessto their coronagraph. This work was supported in part by NASA grants to DCJ and PK, and bythe NSF Center for Adaptive Optics, managed by UC Santa Cruz under cooperative agreementAST-9876783. This research has made use of the NASA/IPAC Infrared Science Archive, operatedby JPL, California Institute of Technology.
– 14 –
REFERENCES
Arny, T. 1977, ApJ, 217, 83
Artymowicz, P. & Clampin, M. 1997, ApJ, 490, 863
Aumann, H.H. 1988, AJ, 96, 1415
Aumann, H.H. 1985, PASP, 97, 885
Aumann, H.H., Gillett, F.C., Beichman, C.A., et al. 1984, ApJ, 278, L23
Backman, D. E. & Paresce, F. 1993, in Protostars and Planets III, eds. E. H. Levy & J. I. Lunine,(Univ. Arizona Press, Tucson), p. 1253
Backman, D. E. & Gillett, F. C. 1987, in Cool Stars, Stellar Systems, and the Sun, ed. J. L. Linsky& R. E. Stencel, (Springer: Berlin), p. 340
Castelaz, M.W., Sellgren, K. & Werner, M.W. 1987, ApJ, 313, 853
Cox, A. 1999, Allen’s Astrophysical Quantities, (AIP Press: New York).
Coulson, I.M., Dent, D.M. & Dent, W.R.F. 1998, MNRAS, 296, 934
Desert, F.-X., Boulanger, F. & Puget, J.L. 1990, A&A, 237, 215
Dring, A.R., Murthy, J., Henry, R.C. & Walker, H.J. 1996, ApJ, 457, 764
Dunkin, S.K., Barlow, M.J., & Ryan, S.G. 1997, MNRAS, 290, 165
Gaustad, J.E. & Van Buren, D. 1993, PASP, 105, 1127
Gordon, K.D., Witt, A.N., Carruthers, G.R., Christensen, S.A. & Dohne, B.C. 1994, ApJ, 432, 641
Greenberg, J.M. 1968, in Nebulae & Interstellar Matter, eds. B.M. Middlehurst and L.H. Aller,(Univ. Chicago Press: Chicago), p. 221
Herbig, G.H. 1996, AJ, 111, 1241
Herbig, G.H. & Simon, T. 2001, AJ, 121, 3138.
Jura, M. 1999, ApJ, 515, 706
Kalas, P. 1998, Earth, Moon and Planets, 81, 27
Kalas, P. & Jewitt, D. 1996, AJ, 111, 1347
Kim, S.S., Zuckerman, B. & Silverstone, M. 2001, ApJ, 550, 1000
– 15 –
Lagrange, A.-M., Backman, D.E. & Artymowicz, P. 2000, in Protostars and Planets IV, eds. V.Mannings, A.P. Boss & S.S. Russell, (Univ. Arizona Press: Tucson), p. 1253
Lloyd, J.P., Liu, M.C., Macintosh, B.A., et al. 2000, SPIE Proceedings, 4008, pg. 814.
Low, F.J. et al. 1984, ApJ, 278, L19
Mannings, V. & Barlow, M.J. 1998, ApJ, 497, 330
Mathis, J.S. 1990, ARA&A, 28, 37
Max, C.E., Olivier, S.S., Friedman, H.W., et al. 1997, Science, 277, 1649
Meyer, M.R., Calvet, N. & Hillenbrand, L.A. 1997, AJ, 114, 288
Miroshnichenko, A.S., Mulliss, C.L., Bjorkman, K.S., et al. 1999, MNRAS, 302, 612
Nakajima, T. & Golimowski, D.A. 1995, AJ, 109, 1181
Plets, P. 1999, A&A, 343, 496
Racine, R. 1968, AJ, 73, 233
Sellgren, K., Werner, M.W., & Allamandola, L.J. 1996, ApJS, 102, 369
Sellgren, K., Luan, L. & Werner, M.W. 1990, ApJ, 359, 384
Sellgren, K. 1984, ApJ, 277, 623
Sfeir, D.M., Lallement, R., Crifo, F. & Welsh, B.Y. 1999, A&A, 346, 785
Sylvester, R.J., Skinner, C.J., Barlow, M.J. & Mannings, V. 1996, MNRAS, 279, 915
Sylvester, R.J. & Skinner, C.J. 1996, MNRAS, 283, 457
Sylvester, R.J., Skinner, C.J. & Barlow, M.J. 1997, MNRAS, 289, 831
van den Bergh, S. 1966, AJ, 71, 990
Welsh, B.Y., Sfeir, D.M., Sirk, M.M. & Lallement, R. 1999, A&A, 352, 308
White, R.E. & Bally, J. 1993, ApJ, 409, 234
de Zeeuw, P.T., Hoogerwerf, R., de Bruijne, J.H.J., Brown, A.G.A. & Blaauw, A. 1999, AJ, 117,354
Zuckerman, B. & Webb, R.A. 2000, ApJ, 535, 959
Zuckerman, B., Kim, S.S. & Liu, T. 1995, ApJ, 446, L79
AAS LATEX macros v5.0.
– 16 –
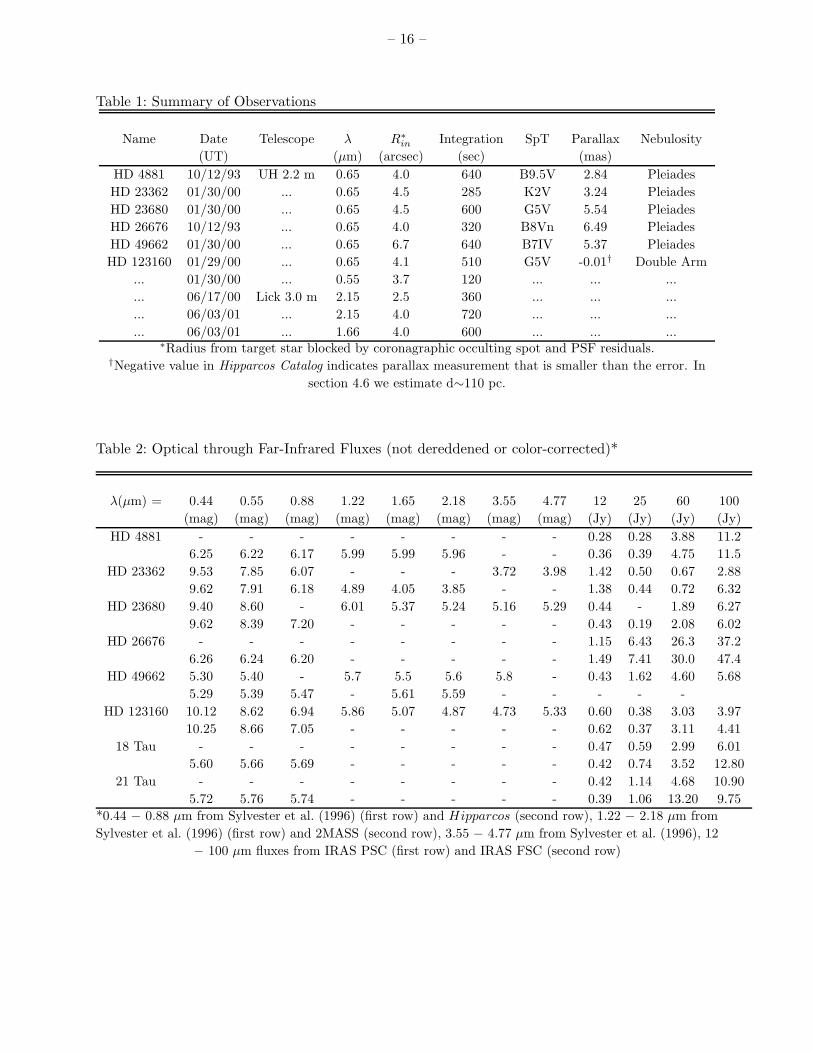
Table 1: Summary of Observations
Name Date Telescope λ R∗in Integration SpT Parallax Nebulosity
(UT) (µm) (arcsec) (sec) (mas)HD 4881 10/12/93 UH 2.2 m 0.65 4.0 640 B9.5V 2.84 PleiadesHD 23362 01/30/00 ... 0.65 4.5 285 K2V 3.24 PleiadesHD 23680 01/30/00 ... 0.65 4.5 600 G5V 5.54 PleiadesHD 26676 10/12/93 ... 0.65 4.0 320 B8Vn 6.49 PleiadesHD 49662 01/30/00 ... 0.65 6.7 640 B7IV 5.37 PleiadesHD 123160 01/29/00 ... 0.65 4.1 510 G5V -0.01† Double Arm
... 01/30/00 ... 0.55 3.7 120 ... ... ...
... 06/17/00 Lick 3.0 m 2.15 2.5 360 ... ... ...
... 06/03/01 ... 2.15 4.0 720 ... ... ...
... 06/03/01 ... 1.66 4.0 600 ... ... ...∗Radius from target star blocked by coronagraphic occulting spot and PSF residuals.
†Negative value in Hipparcos Catalog indicates parallax measurement that is smaller than the error. Insection 4.6 we estimate d∼110 pc.
Table 2: Optical through Far-Infrared Fluxes (not dereddened or color-corrected)*
λ(µm) = 0.44 0.55 0.88 1.22 1.65 2.18 3.55 4.77 12 25 60 100(mag) (mag) (mag) (mag) (mag) (mag) (mag) (mag) (Jy) (Jy) (Jy) (Jy)
HD 4881 - - - - - - - - 0.28 0.28 3.88 11.26.25 6.22 6.17 5.99 5.99 5.96 - - 0.36 0.39 4.75 11.5
HD 23362 9.53 7.85 6.07 - - - 3.72 3.98 1.42 0.50 0.67 2.889.62 7.91 6.18 4.89 4.05 3.85 - - 1.38 0.44 0.72 6.32
HD 23680 9.40 8.60 - 6.01 5.37 5.24 5.16 5.29 0.44 - 1.89 6.279.62 8.39 7.20 - - - - - 0.43 0.19 2.08 6.02
HD 26676 - - - - - - - - 1.15 6.43 26.3 37.26.26 6.24 6.20 - - - - - 1.49 7.41 30.0 47.4
HD 49662 5.30 5.40 - 5.7 5.5 5.6 5.8 - 0.43 1.62 4.60 5.685.29 5.39 5.47 - 5.61 5.59 - - - - -
HD 123160 10.12 8.62 6.94 5.86 5.07 4.87 4.73 5.33 0.60 0.38 3.03 3.9710.25 8.66 7.05 - - - - - 0.62 0.37 3.11 4.41
18 Tau - - - - - - - - 0.47 0.59 2.99 6.015.60 5.66 5.69 - - - - - 0.42 0.74 3.52 12.80
21 Tau - - - - - - - - 0.42 1.14 4.68 10.905.72 5.76 5.74 - - - - - 0.39 1.06 13.20 9.75
*0.44 − 0.88 µm from Sylvester et al. (1996) (first row) and Hipparcos (second row), 1.22 − 2.18 µm fromSylvester et al. (1996) (first row) and 2MASS (second row), 3.55 − 4.77 µm from Sylvester et al. (1996), 12
− 100 µm fluxes from IRAS PSC (first row) and IRAS FSC (second row)
– 17 –
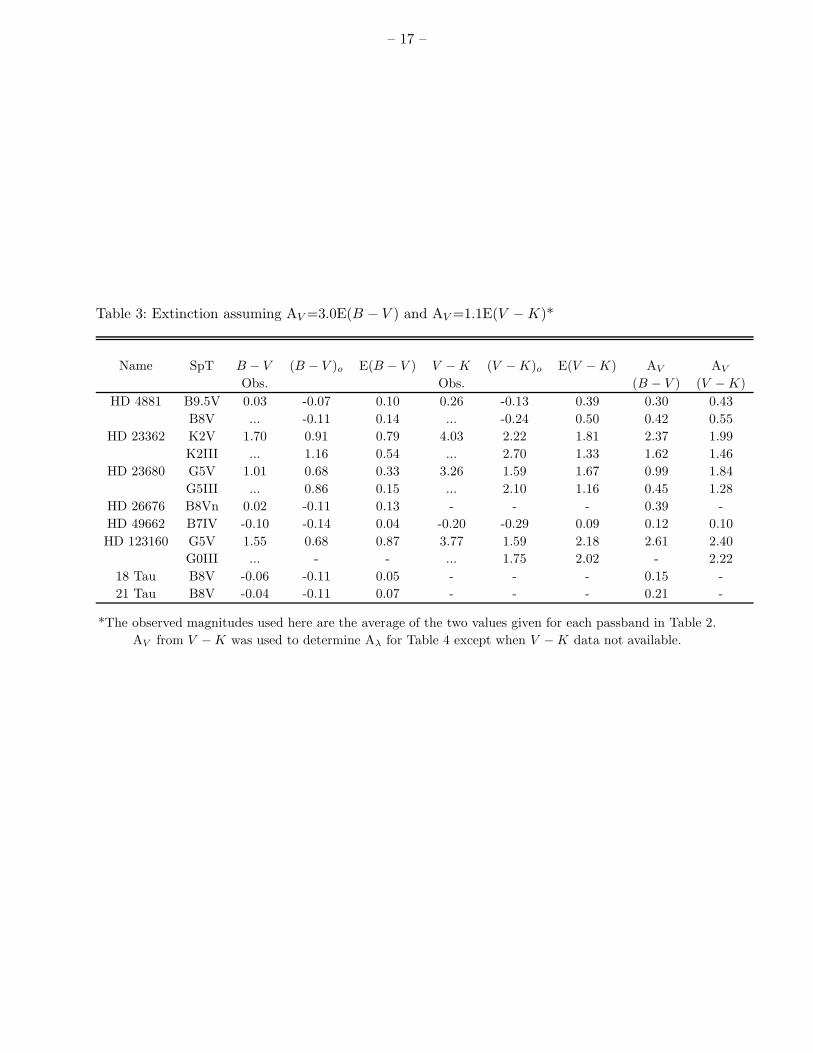
Table 3: Extinction assuming AV =3.0E(B − V ) and AV =1.1E(V −K)*
Name SpT B − V (B − V )o E(B − V ) V −K (V −K)o E(V −K) AV AV
Obs. Obs. (B − V ) (V −K)HD 4881 B9.5V 0.03 -0.07 0.10 0.26 -0.13 0.39 0.30 0.43
B8V ... -0.11 0.14 ... -0.24 0.50 0.42 0.55HD 23362 K2V 1.70 0.91 0.79 4.03 2.22 1.81 2.37 1.99
K2III ... 1.16 0.54 ... 2.70 1.33 1.62 1.46HD 23680 G5V 1.01 0.68 0.33 3.26 1.59 1.67 0.99 1.84
G5III ... 0.86 0.15 ... 2.10 1.16 0.45 1.28HD 26676 B8Vn 0.02 -0.11 0.13 - - - 0.39 -HD 49662 B7IV -0.10 -0.14 0.04 -0.20 -0.29 0.09 0.12 0.10HD 123160 G5V 1.55 0.68 0.87 3.77 1.59 2.18 2.61 2.40
G0III ... - - ... 1.75 2.02 - 2.2218 Tau B8V -0.06 -0.11 0.05 - - - 0.15 -21 Tau B8V -0.04 -0.11 0.07 - - - 0.21 -
*The observed magnitudes used here are the average of the two values given for each passband in Table 2.AV from V −K was used to determine Aλ for Table 4 except when V −K data not available.
– 18 –
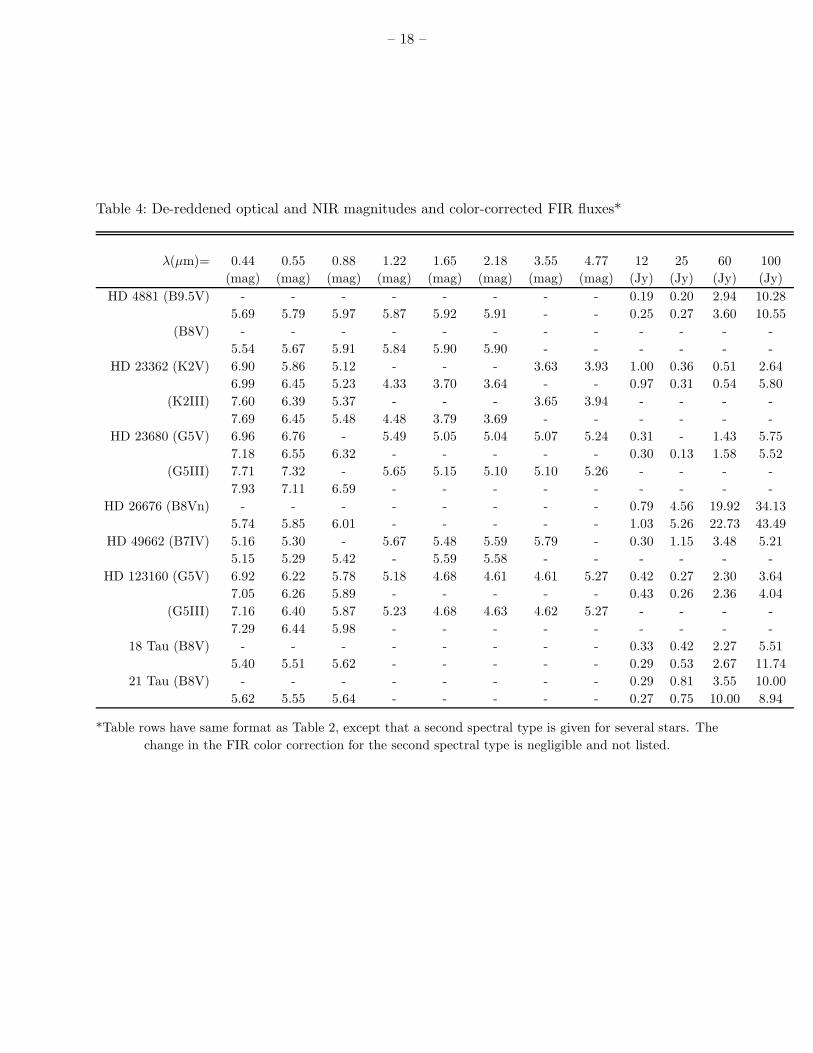
Table 4: De-reddened optical and NIR magnitudes and color-corrected FIR fluxes*
λ(µm)= 0.44 0.55 0.88 1.22 1.65 2.18 3.55 4.77 12 25 60 100(mag) (mag) (mag) (mag) (mag) (mag) (mag) (mag) (Jy) (Jy) (Jy) (Jy)
HD 4881 (B9.5V) - - - - - - - - 0.19 0.20 2.94 10.285.69 5.79 5.97 5.87 5.92 5.91 - - 0.25 0.27 3.60 10.55
(B8V) - - - - - - - - - - - -5.54 5.67 5.91 5.84 5.90 5.90 - - - - - -
HD 23362 (K2V) 6.90 5.86 5.12 - - - 3.63 3.93 1.00 0.36 0.51 2.646.99 6.45 5.23 4.33 3.70 3.64 - - 0.97 0.31 0.54 5.80
(K2III) 7.60 6.39 5.37 - - - 3.65 3.94 - - - -7.69 6.45 5.48 4.48 3.79 3.69 - - - - - -
HD 23680 (G5V) 6.96 6.76 - 5.49 5.05 5.04 5.07 5.24 0.31 - 1.43 5.757.18 6.55 6.32 - - - - - 0.30 0.13 1.58 5.52
(G5III) 7.71 7.32 - 5.65 5.15 5.10 5.10 5.26 - - - -7.93 7.11 6.59 - - - - - - - - -
HD 26676 (B8Vn) - - - - - - - - 0.79 4.56 19.92 34.135.74 5.85 6.01 - - - - - 1.03 5.26 22.73 43.49
HD 49662 (B7IV) 5.16 5.30 - 5.67 5.48 5.59 5.79 - 0.30 1.15 3.48 5.215.15 5.29 5.42 - 5.59 5.58 - - - - - -
HD 123160 (G5V) 6.92 6.22 5.78 5.18 4.68 4.61 4.61 5.27 0.42 0.27 2.30 3.647.05 6.26 5.89 - - - - - 0.43 0.26 2.36 4.04
(G5III) 7.16 6.40 5.87 5.23 4.68 4.63 4.62 5.27 - - - -7.29 6.44 5.98 - - - - - - - - -
18 Tau (B8V) - - - - - - - - 0.33 0.42 2.27 5.515.40 5.51 5.62 - - - - - 0.29 0.53 2.67 11.74
21 Tau (B8V) - - - - - - - - 0.29 0.81 3.55 10.005.62 5.55 5.64 - - - - - 0.27 0.75 10.00 8.94
*Table rows have same format as Table 2, except that a second spectral type is given for several stars. Thechange in the FIR color correction for the second spectral type is negligible and not listed.
– 19 –
Table 5: Pleiades Model: Uniform density dust cloud
Star - Model Teff d R? (×1011) ρ (×10−23) rin Rout To τmax Ld/L?
(K) (pc) (cm) (g cm−3) (AU) (AU) (K)HD 4881-a 12,300 168 2.09 0.27 800 105 146 1.6×10⁻³ 1.9×10⁻³
-b ... ... ... 0.29 300 8.7×10⁴ 217 1.5×10⁻³ 1.8×10⁻³
HD 23362-a 4200 187 13.92 0.37 400 2.0×10⁵ 148 4.5×10⁻³ 2.0×10⁻³
-b ... ... ... 0.38 40 1.1×10⁴ 366 2.6×10⁻³ 1.2×10⁻³
HD 23680-a 5050 205 6.97 2.30 200 7.0×10⁴ 176 9.8×10⁻³ 4.7×10⁻³
-b ... ... ... 3.20 400 4.0×10⁴ 134 7.7×10⁻³ 4.3×10⁻³
HD 26676-a 11,600 163 2.09 2.50 100 5.5×10⁴ 320 8.4×10⁻³ 1.0×10⁻²
-b ... ... ... 22.0 50 3.0×10³ 421 4.0×10⁻³ 4.4×10⁻²
HD 49662-a 14,000 180 2.47 0.13 100 6.2×10⁴ 397 4.9×10⁻⁴ 5.9×10⁻⁴
-b ... ... ... 0.70 10 1.1×10⁴ 1000 4.8×10⁻⁴ 5.7×10⁻⁴
HD 123160-a 5,500 110 4.18 4.9 300 1.2×10⁴ 135 3.5×10⁻³ 2.1×10⁻³
-b ... 120 ... ... 200 1.1×10⁴ 158 3.2×10⁻³ 2.0×10⁻³
18 Tau-a 11,400 125 2.00 0.21 200 6.0×10⁴ 236 7.7×10⁻⁴ 2.2×10⁻⁵
-b ... ... ... 0.18 200 1.6×10⁵ 236 1.8×10⁻³ 1.9×10⁻⁵
21 Tau-a 11,400 125 2.00 0.32 10 6.0×10⁴ 770 1.2×10⁻³ 4.3×10⁻⁵
-b ... ... ... 1.0 10 2.8×10⁴ 770 1.7×10⁻³ 1.3×10⁻⁴
– 20 –
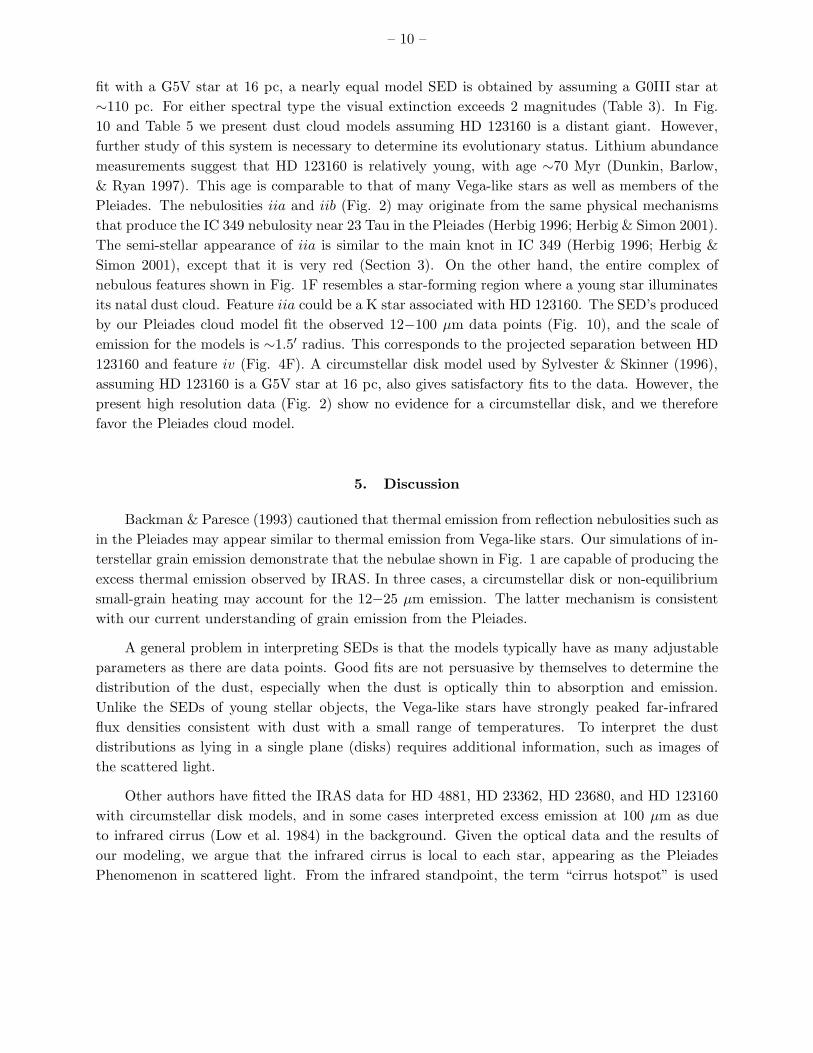
Fig. 1.— R-band coronagraphic images of six Vega-like stars after PSF subtraction [A: HD 4881,B: HD 23362 C: HD 23680, D: HD 26676, E: HD 49662, F: HD 123160]. North is up, east is left,the white bar represents 5′′, and each box is 1.5′ on a side, except for F which is 3.0′ on a side. ForF we label five regions of nebulosity discussed in the text. Negative features are artifacts of thePSF subtraction step.
– 21 –
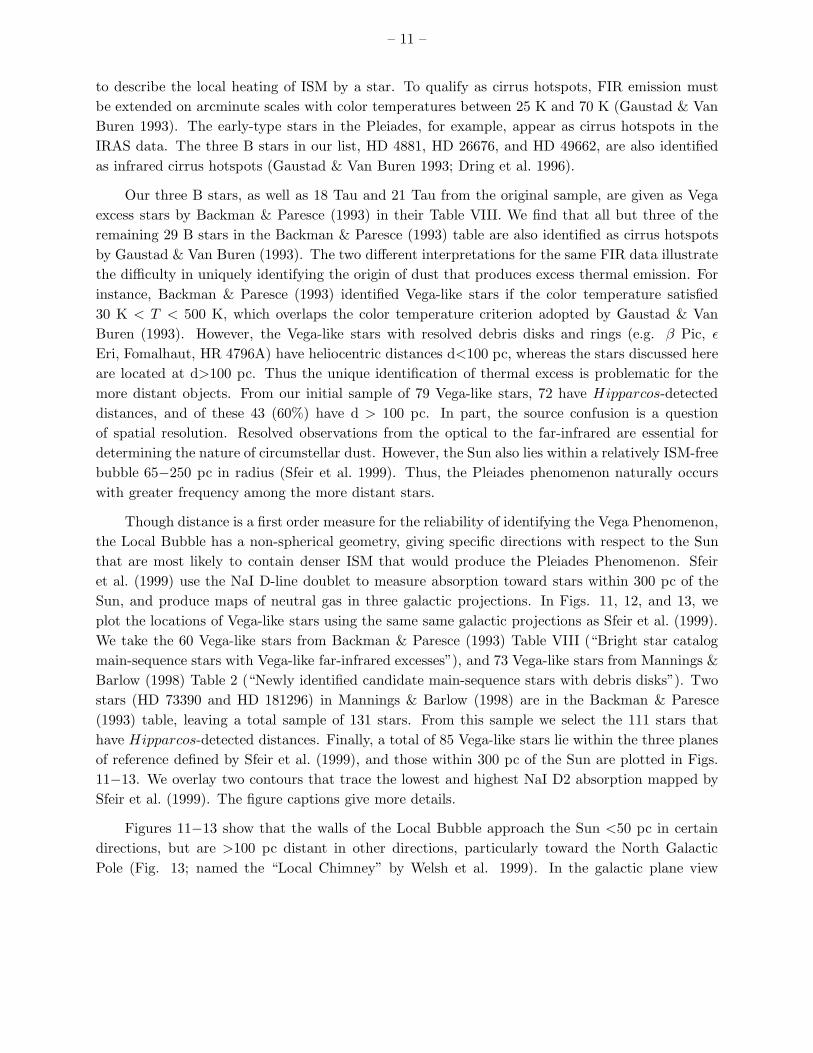
Fig. 2.— The left panel is a different grayscale stretch and field of view of Fig. 1F, showing theexistence of 2 brightness peaks within arm ii. The right panel shows the same field imaged withadaptive optics at 2.15 µm on two different nights. The wide field shows the 17 June 2000 datawhere HD 123160 was placed behind the occulting finger and a PSF template was subtracted tosearch for disk-like nebulosity. In the lower left of this frame we superimpose the 03 June 2001K-band data which has higher signal-to-noise due to the greater integration time (Table 1) and thefact that no PSF template is subtracted. In both K-band data sets, as well as the H-band data,feature iia is detected as a possible point source at PA∼135◦, indicated here with an arrow. Thewhite bar represents 5′′.