Embed Size (px)
Citation preview

– HCO+ very abundant in molecular clouds – It’s detection in circumstellar envelopes has been
elusive– Models of oxygen-rich circumstellar envelopes
predicting the presence of HCO+ are sparse – Only recently detected around one oxygen-rich
star, VY CMa
Continuing the search for HCO+ around o-rich evolved stars
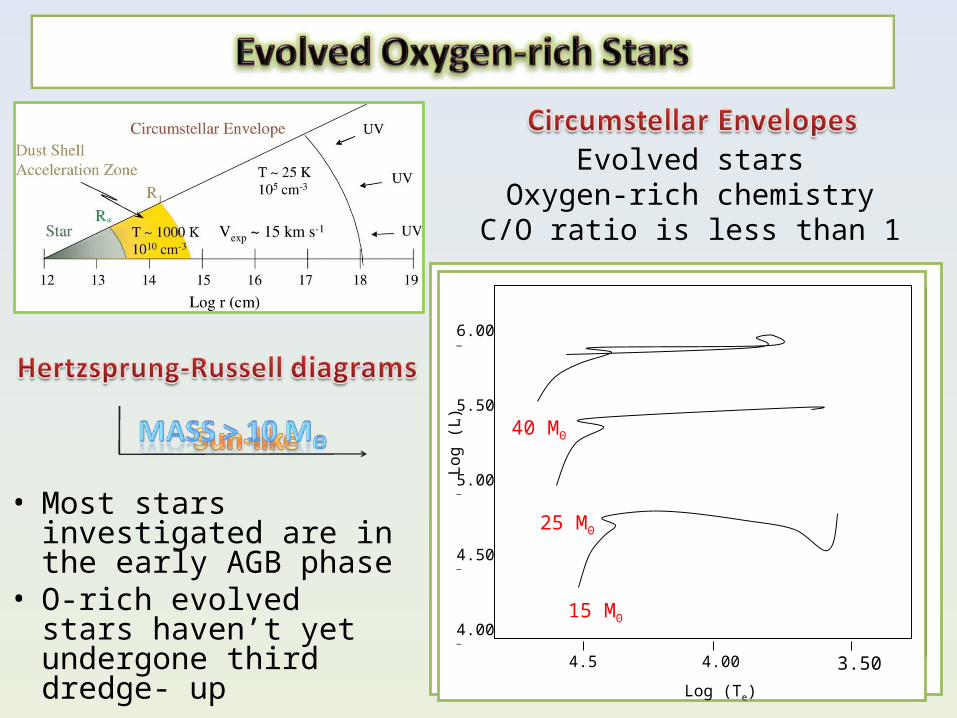
• Most stars investigated are in the early AGB phase
• O-rich evolved stars haven’t yet undergone third dredge- up
2.80 —
3.40 —
2.95 —
3.10 —
3.25 —
3.603.854.004.154.30
PLANETARY NEBULAStellar envelope completely detached
To White Dwarf
PROTO-PLANETARY NEBULA (PPN)
Nucleosynthesis stopsCRL2688AGB
He & H Shell Burning Envelope
Triple -Process
RED GIANT BRANCH
H Shell Narrows
H Shell Burning
First Dredge-up: Surface Abundances Change
MAIN SEQUENCEHydrogen Core BurningSun
Log
(L
)
Log (Te)
He Core Burning
Evolved starsOxygen-rich chemistryC/O ratio is less than 1
4.00 —
6.00 —
4.50 —
5.00 —
5.50 —
3.504.004.5
Log
(L
)
Log (Te)
25 MΘ
15 MΘ
40 MΘ

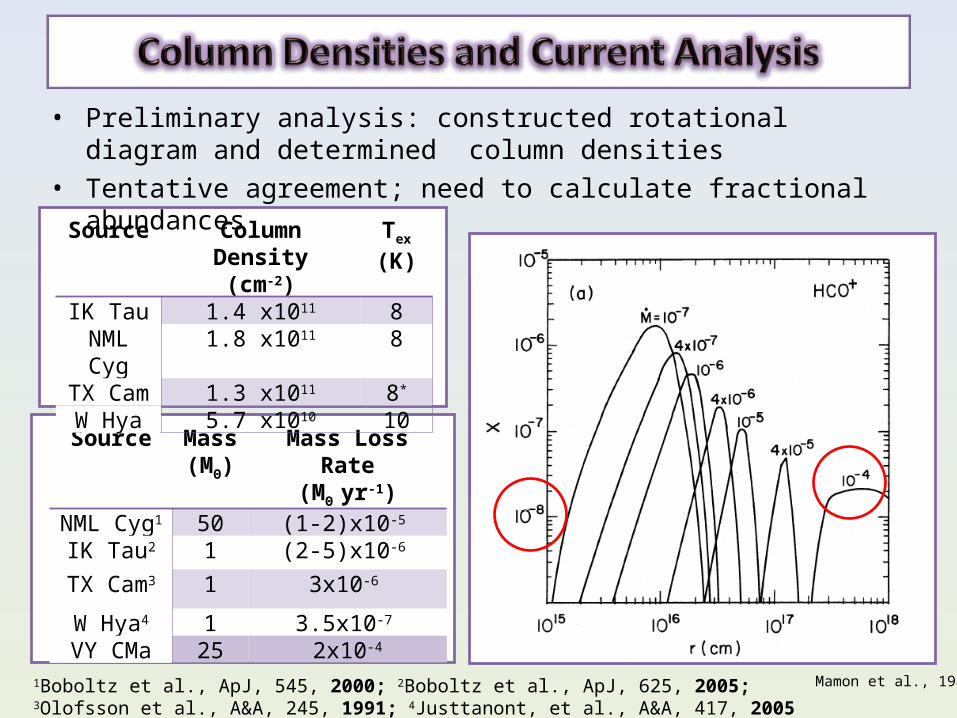
• Modeling of o-rich circumstellar envelopes of AGB stars by Mamon et al. in 1987
• HCO+ abundance decreases as mass loss rate increases
Mamon et al., ApJ, 323, 1987
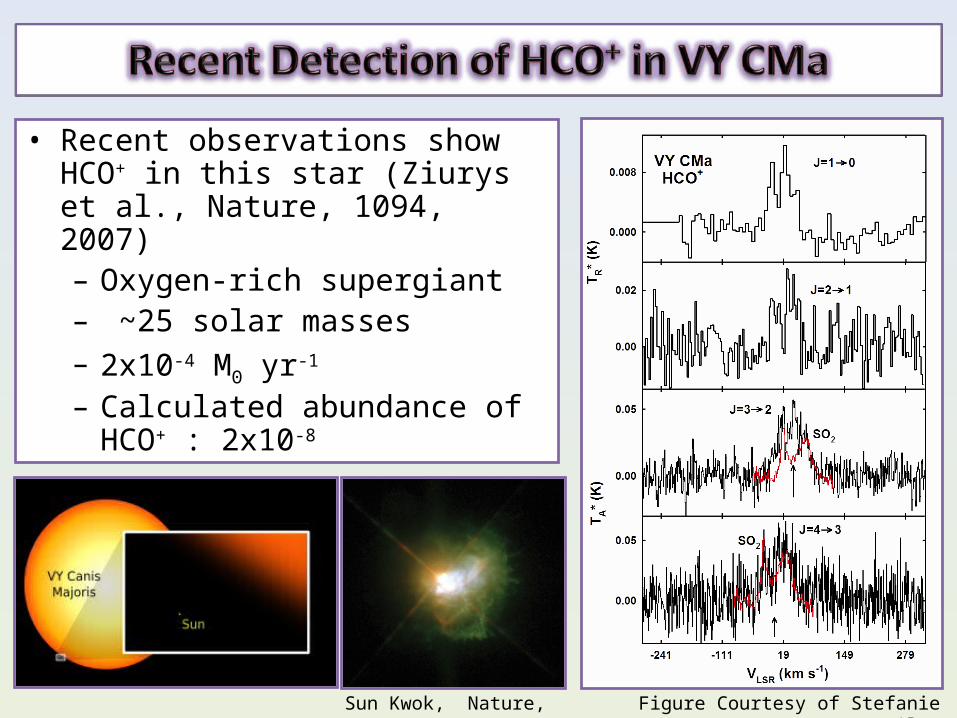
• Recent observations show HCO+ in this star (Ziurys et al., Nature, 1094, 2007)– Oxygen-rich supergiant– ~25 solar masses– 2x10⁻⁴ Mʘ yr-1
– Calculated abundance of HCO+ : 2x10⁻⁸
Figure Courtesy of Stefanie MilamSun Kwok, Nature, 447, 2007
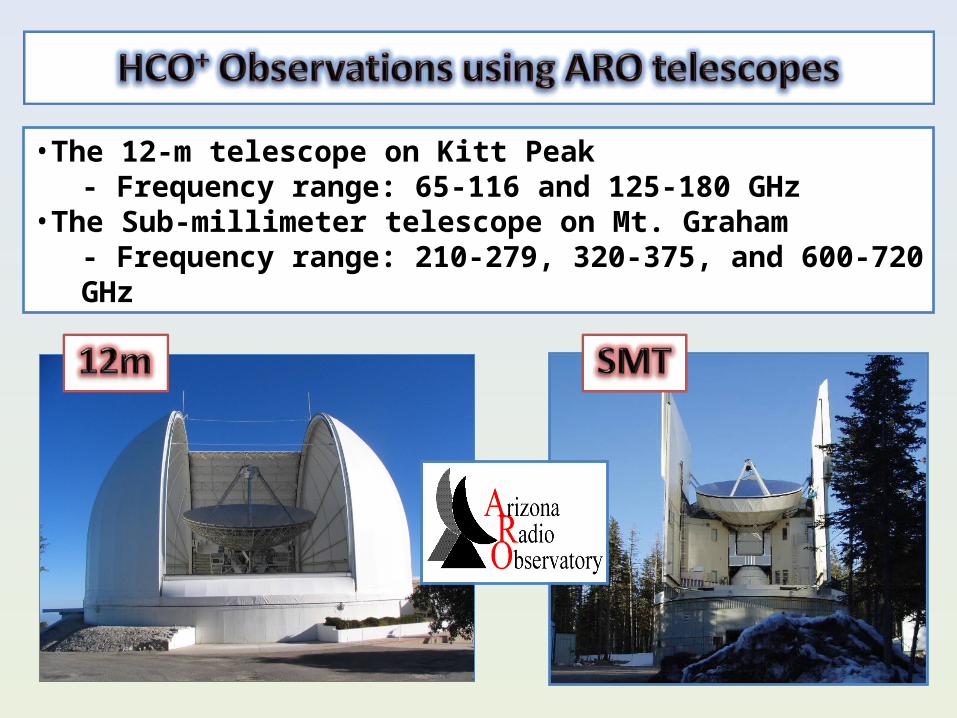
•The 12-m telescope on Kitt Peak- Frequency range: 65-116 and 125-180 GHz
•The Sub-millimeter telescope on Mt. Graham- Frequency range: 210-279, 320-375, and 600-720 GHz

1Boboltz et al., ApJ, 545, 20002Boboltz et al., ApJ, 625, 20053Olofsson et al., A&A, 245, 19914Justtanont, et al., A&A, 417, 2005
Source Star Type Mass(Mʘ)
Mass Loss Rate(Mʘ yr-1)
Distance(pc)
VLSR
(km s-1)Coordinates
(B1950.0)
NML Cyg1 Supergiant 50 (1-2)x10-5 1800 -5.0 03:50:43.6 11:15:32.2
IK Tau2 AGB 1 (2-5)x10-6 250 34.5 20:44:33.8 39:55:57.0
TX Cam3 AGB 1 3x10⁻⁶ 450 9.2 04:56:40.6 56:06:28.0
W Hya4 AGB 1 3.5x10⁻⁷ 115 41.0 13:46:12.2 -25:40:12.0
TransitionJ+1J
Frequency(MHz)
Wavelength(mm)
Beam Size(arcsecs)
Telescope
1 0 89188.523 3.4 70 ARO 12m 2 1 178375.010 1.7 35 ARO 12m 3 2 267557.526 1.1 28 ARO SMT4 3 356734.134 0.8 21 ARO SMT

Current Observational Results:• IK Tau
• Detected the J=1-0 and J=3-2• J=3-2 blended with SO2
• TX Cam• Proving more difficult• The J=1-0 emerging from
the noise• The J=3-2 needs more
integration time• Contaminated with SO2
• W Hya • Detected J=1-0 and
J=3-2• Narrow line profiles • J=3-2 is not blended
with SO2
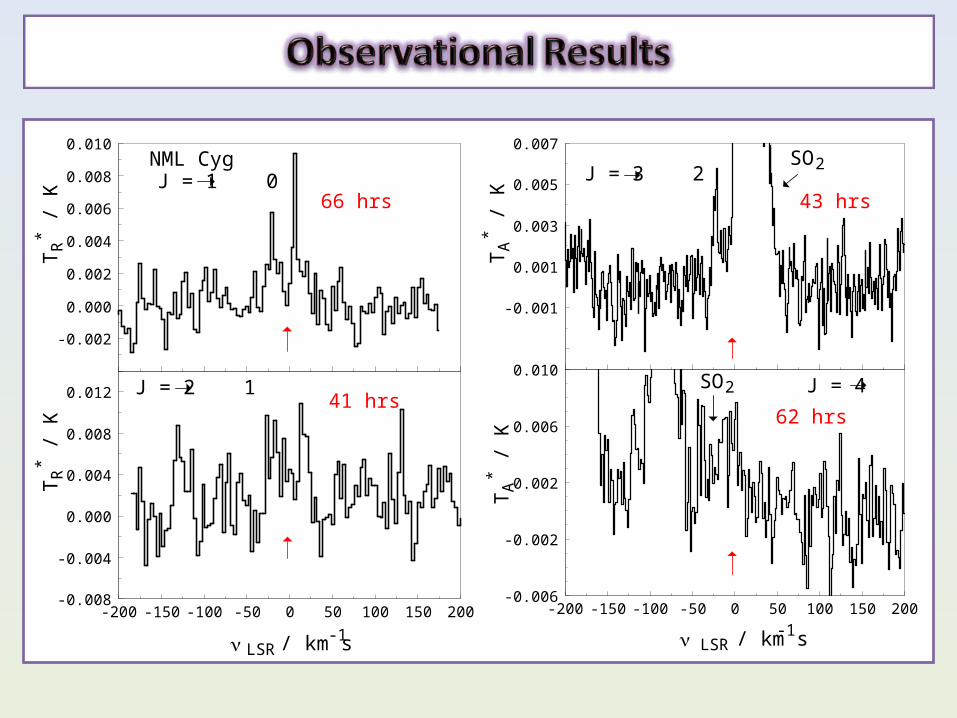
• NML Cyg • All four transitions
observed• Both J=3-2 and J=4-3
blended with SO2
•IK Tau•Detected the J=1-0 and J=3-2•J=3-2 blended with SO2
• W Hya • DetectedJ=1-0 and J=3-2• Narrow line profiles
• J=3-2 is not blended with SO2
• TX Cam• Proving more difficult• The J=1-0 emerging from the noise• The J=3-2 needs more integration time • Contaminated with SO2
TR
*
-0.003
0.000
0.003
0.006
0.009
0.012
J = 1 0IK Tau
LSR / km s-1-150 -100 -50 0 50 100 150 200
TA
*
-0.002
0.000
0.002
0.004
0.006 J = 3 2 SO2
LSR / km s-1
TR
*
-0.002
0.000
0.002
0.004
0.006
-150 -100 -50 0 50 100 150 200
TA
*
-0.002
0.000
0.002
0.004
0.006
W HyaJ = 1 0
J = 3 2SO2
TR
*
-0.002
0.000
0.002
0.004
0.006
LSR / km s-1
-150 -100 -50 0 50 100 150
TA
*
-0.002
-0.001
0.000
0.001
0.002
0.003
SO2
TX Cam
J = 3 2
J = 1 036 hrs
30 hrs
69 hrs
64 hrs
42 hrs
100 hrs
LSR / km s-1-200 -150 -100 -50 0 50 100 150 200
TR
* / K
-0.008
-0.004
0.000
0.004
0.008
0.012 J = 2 1
TR
* / K
-0.002
0.000
0.002
0.004
0.006
0.008
0.010
J = 1 0NML Cyg
LSR / km s-1
TA
* / K
-0.001
0.001
0.003
0.005
0.007
-200 -150 -100 -50 0 50 100 150 200-0.006
-0.002
0.002
0.006
0.010
TA
* / K
J = 3 2
J = 4 3SO2
SO2
66 hrs
62 hrs
43 hrs
41 hrs
Source Mass(Mʘ)
Mass Loss Rate(Mʘ yr-1)
NML Cyg1 50 (1-2)x10-5
IK Tau2 1 (2-5)x10-6
TX Cam3 1 3x10⁻⁶
W Hya4 1 3.5x10⁻⁷
VY CMa 25 2x10⁻⁴
Source Column Density(cm-2)
Tex
(K)IK Tau 1.4 x10¹¹ 8
NML Cyg 1.8 x10¹¹ 8TX Cam 1.3 x10¹¹ 8*
W Hya 5.7 x10¹⁰ 10
• Preliminary analysis: constructed rotational diagram and determined column densities
• Tentative agreement; need to calculate fractional abundances
Source Mass(Mʘ)
Mass Loss Rate(Mʘ yr-1)
NML Cyg1 50 (1-2)x10-5
IK Tau2 1 (2-5)x10-6
TX Cam3 1 3x10⁻⁶
W Hya4 1 3.5x10⁻⁸
Mamon et al., 19871Boboltz et al., ApJ, 545, 2000; 2Boboltz et al., ApJ, 625, 2005; 3Olofsson et al., A&A, 245, 1991; 4Justtanont, et al., A&A, 417, 2005
• Four new detections of HCO+ in evolved oxygen-rich stars
• HCO+ common constituent in these stars• Finish observations this up coming Fall:
J=2 1 in IK Tau, TX Cam, and W HyaJ=3 2 in TX CamJ=4 3 in IK Tau, TX Cam, and W Hya
• Tentative agreement with model by Mamon et al.• Model line profiles, determine abundances of
HCO+ to help further understand ion-molecule chemistry in circumstellar envelopes

Acknowledgements
• Prof. Lucy Ziurys• Dr. DeWayne Halfen• Emmy Tenenbaum• Ming Sun• Lindsay Zack• Jessica Dodd• Gilles Adande• ARO telescope operators and staff• NSF and NASA for funding