Embed Size (px)
Citation preview
Western Bug basin: physico-geographical
conditions, water formation, economic
development (on the example of the transboundary
part of the basin)
Dr. Aleh TAKARCHUK
Associate professor of the Department of Geography
and Nature Management
of A.S. Pushkin Brest State University
International Public Association «EKAPRAEKT»,
Brest office, Chairman
ADDRESSING COMMON CHALLENGES OF THE BALTIC
SEA BASIN BY WORKING ON INTEGRATED RIVER BASIN
MANAGEMENT, MICROPLASTIC & LITTER INPUTS,
Joint Projects’ Conference
Druskininkai, Lithuania, 18-19 December 2017
THE SITUATION OF THE WESTERN BUG RIVER BASIN IN EUROPE
AND WITHIN THE VISTULA RIVER BASIN 1
TRANSBOUNDARY ASPECT. OBJECT AND SUBJECT OF RESEARCH
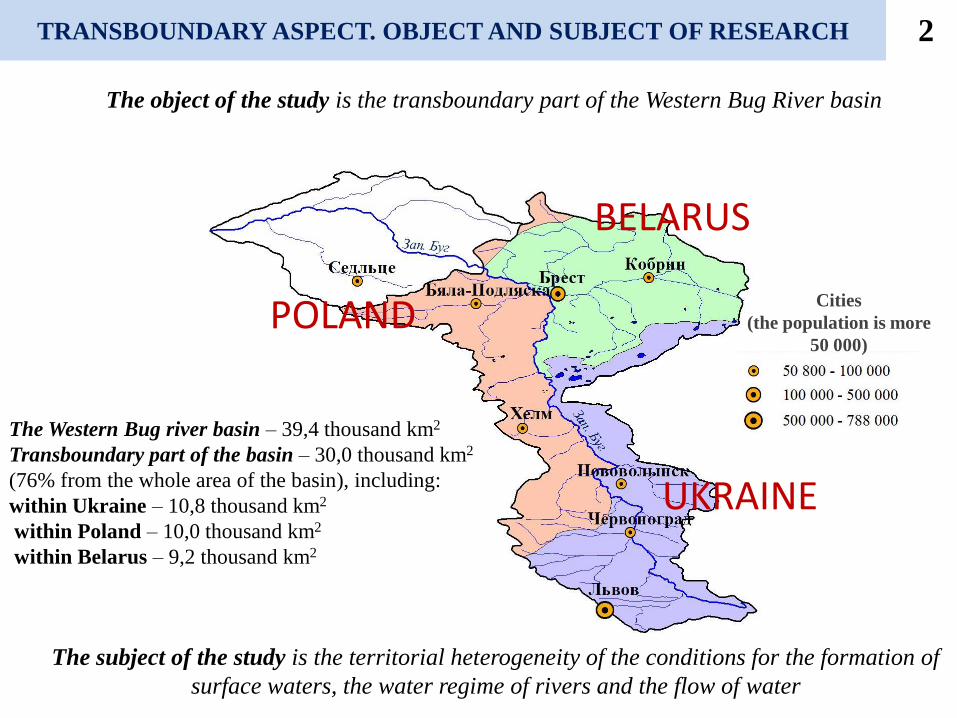
The object of the study is the transboundary part of the Western Bug River basin
The subject of the study is the territorial heterogeneity of the conditions for the formation of
surface waters, the water regime of rivers and the flow of water
2
The Western Bug river basin – 39,4 thousand km2
Transboundary part of the basin – 30,0 thousand km2
(76% from the whole area of the basin), including:
within Ukraine – 10,8 thousand km2
within Poland – 10,0 thousand km2
within Belarus – 9,2 thousand km2
Cities
(the population is more
50 000)
BELARUS
UKRAINE
POLAND
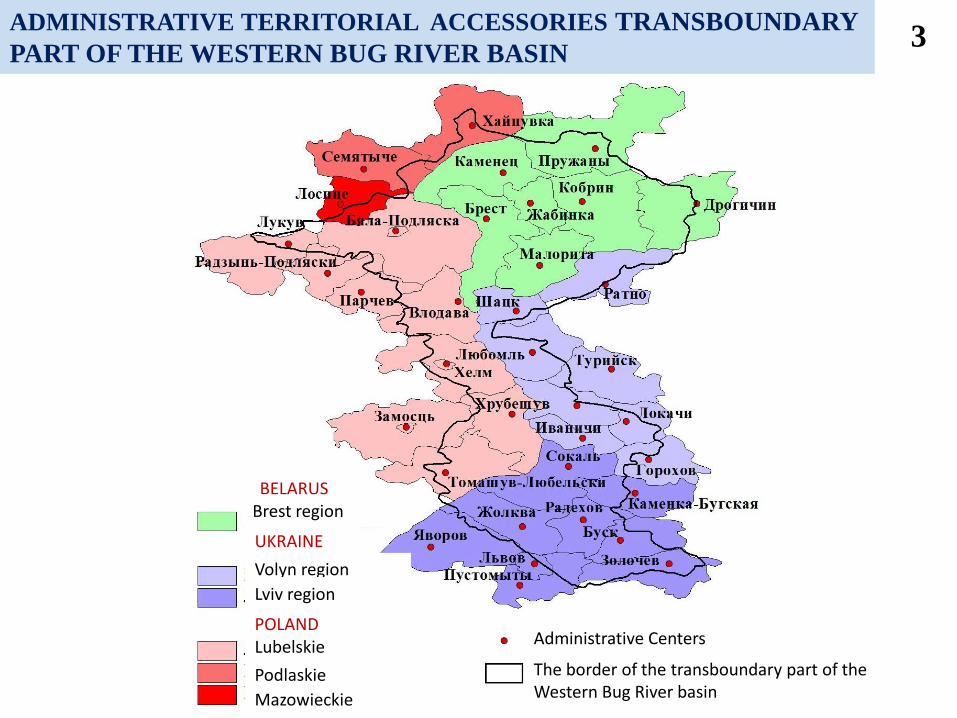
ADMINISTRATIVE TERRITORIAL ACCESSORIES TRANSBOUNDARY
PART OF THE WESTERN BUG RIVER BASIN 3
BELARUS Brest region
Volyn region
UKRAINE
Lviv region
Lubelskie
Podlaskie
POLAND
Mazowieckie
Administrative Centers
The border of the transboundary part of the Western Bug River basin
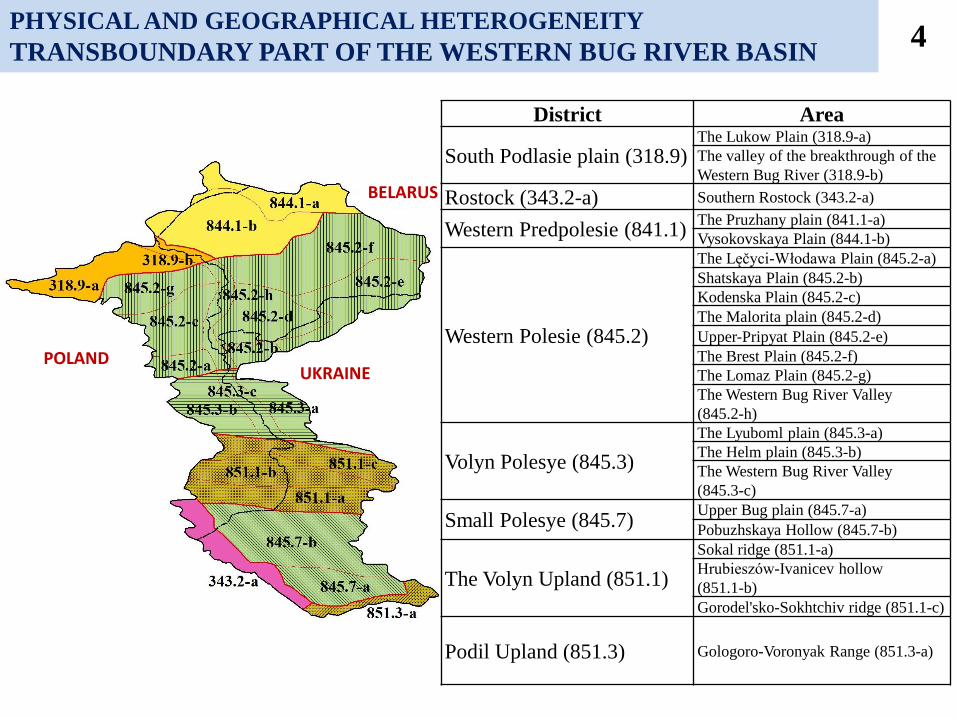
PHYSICAL AND GEOGRAPHICAL HETEROGENEITY
TRANSBOUNDARY PART OF THE WESTERN BUG RIVER BASIN 4
BELARUS
UKRAINE POLAND
District Area
South Podlasie plain (318.9) The Lukow Plain (318.9-a)
The valley of the breakthrough of the
Western Bug River (318.9-b)
Rostock (343.2-a) Southern Rostock (343.2-a)
Western Predpolesie (841.1) The Pruzhany plain (841.1-a)
Vysokovskaya Plain (844.1-b)
Western Polesie (845.2)
The Lęčyci-Włodawa Plain (845.2-a)
Shatskaya Plain (845.2-b)
Kodenska Plain (845.2-c)
The Malorita plain (845.2-d)
Upper-Pripyat Plain (845.2-e)
The Brest Plain (845.2-f)
The Lomaz Plain (845.2-g)
The Western Bug River Valley
(845.2-h)
Volyn Polesye (845.3)
The Lyuboml plain (845.3-a)
The Helm plain (845.3-b)
The Western Bug River Valley
(845.3-c)
Small Polesye (845.7) Upper Bug plain (845.7-a)
Pobuzhskaya Hollow (845.7-b)
The Volyn Upland (851.1)
Sokal ridge (851.1-a)
Hrubieszów-Ivanicev hollow
(851.1-b)
Gorodel'sko-Sokhtchiv ridge (851.1-c)
Podil Upland (851.3) Gologoro-Voronyak Range (851.3-a)
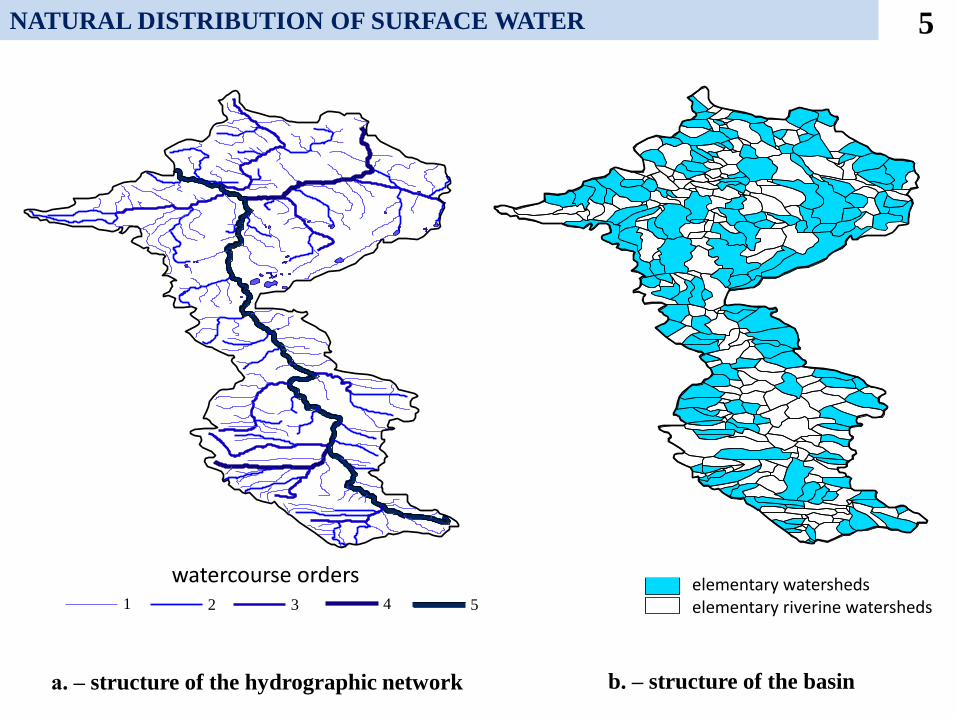
а. – structure of the hydrographic network b. – structure of the basin
водоемы
Порядки водотоков
1 2 3 4 5
Cтруктуры бассейнового строения
элементарные водосборы
элементарные приречья
NATURAL DISTRIBUTION OF SURFACE WATER 5
watercourse orders
elementary riverine watersheds elementary watersheds
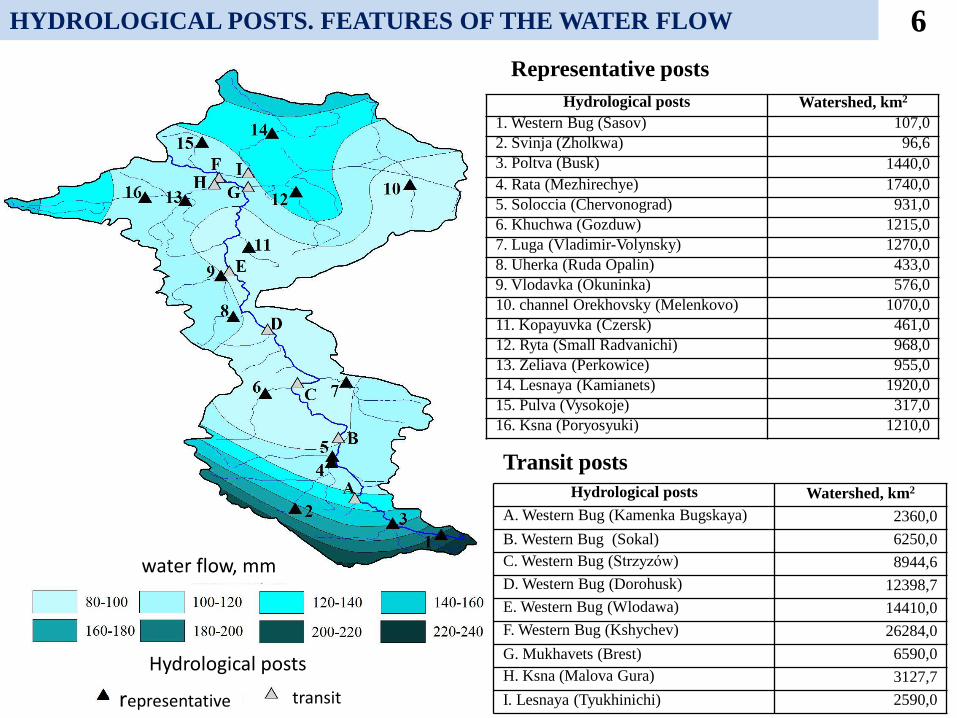
HYDROLOGICAL POSTS. FEATURES OF THE WATER FLOW 6
Hydrological posts Watershed, km2
1. Western Bug (Sasov) 107,0
2. Svinja (Zholkwa) 96,6
3. Poltva (Busk) 1440,0
4. Rata (Mezhirechye) 1740,0
5. Soloccia (Chervonograd) 931,0
6. Khuchwa (Gozduw) 1215,0
7. Luga (Vladimir-Volynsky) 1270,0
8. Uherka (Ruda Opalin) 433,0
9. Vlodavka (Okuninka) 576,0
10. channel Orekhovsky (Melenkovo) 1070,0
11. Kopayuvka (Czersk) 461,0
12. Ryta (Small Radvanichi) 968,0
13. Zeliava (Perkowice) 955,0
14. Lesnaya (Kamianets) 1920,0
15. Pulva (Vysokoje) 317,0
16. Ksna (Poryosyuki) 1210,0
Hydrological posts Watershed, km2
A. Western Bug (Kamenka Bugskaya) 2360,0
B. Western Bug (Sokal) 6250,0
C. Western Bug (Strzyzów) 8944,6
D. Western Bug (Dorohusk) 12398,7
E. Western Bug (Wlodawa) 14410,0
F. Western Bug (Kshychev) 26284,0
G. Mukhavets (Brest) 6590,0
H. Ksna (Malova Gura) 3127,7
I. Lesnaya (Tyukhinichi) 2590,0
Representative posts
Transit posts
Hydrological posts
representative transit
water flow, mm
Подольская возвышенность
Small Polesye 0,00
25,00
01.11.82 01.12.82 01.01.83 01.02.83 01.03.83 01.04.83 01.05.83 01.06.83 01.07.83 01.08.83 01.09.83 01.10.83
Q,
ку
б.
м/с
0,00
25,00
01.11.82 01.12.82 01.01.83 01.02.83 01.03.83 01.04.83 01.05.83 01.06.83 01.07.83 01.08.83 01.09.83 01.10.83
Q,
ку
б.
м/c
Volyn Upland
0,00
16,00
01.11.1982
01.12.1982
01.01.1983
01.02.1983
01.03.1983
01.04.1983
01.05.1983
01.06.1983
01.07.1983
01.08.1983
01.09.1983
01.10.1983
Q,
ку
б.
м/c
Western Polesie
0,00
4,00
01.11.1982 01.12.1982 01.01.1983 01.02.198301.03.1983 01.04.1983 01.05.1983 01.06.1983 01.07.1983 01.08.1983 01.09.1983 01.10.1983
Q,
ку
б.
м/c
Western
Predpolesie
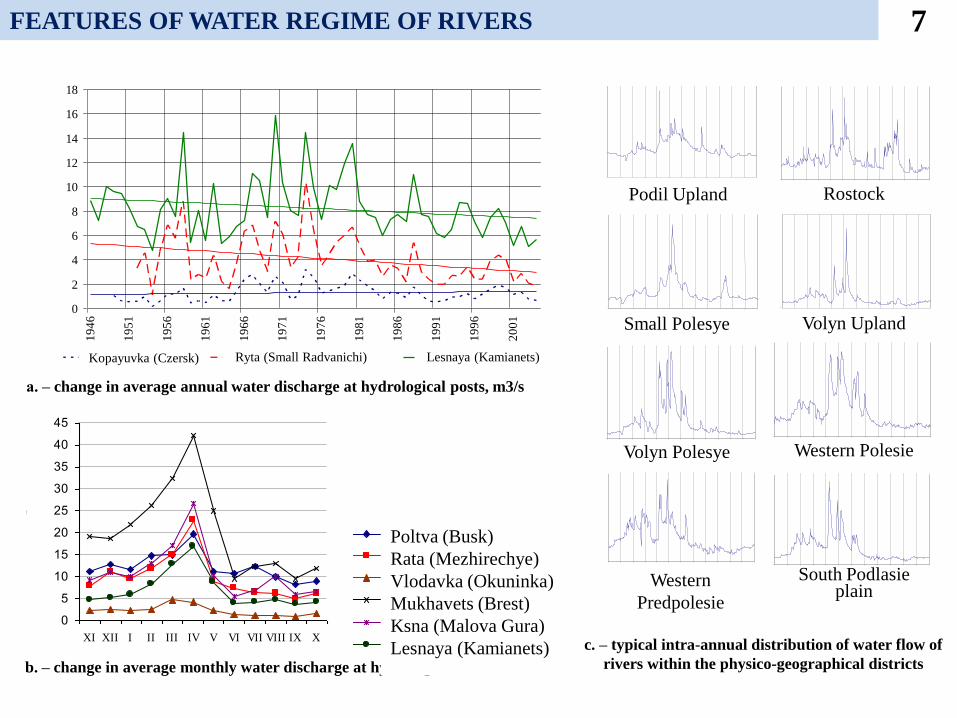
b. – change in average monthly water discharge at hydrological stations, m3/s
а. – change in average annual water discharge at hydrological posts, m3/s
0,00
25,00
01.11.1982
01.12.1982
01.01.1983
01.02.1983
01.03.1983
01.04.1983
01.05.1983
01.06.1983
01.07.1983
01.08.1983
01.09.1983
01.10.1983
Q,
ку
б.
м/c
South Podlasie plain
0,00
9,00
01.11.1982 01.12.1982 01.01.1983 01.02.198301.03.1983 01.04.1983 01.05.1983 01.06.1983 01.07.1983 01.08.1983 01.09.1983 01.10.1983
Q, куб
. м
/с
Volyn Polesye
0,00
3,50
01.11.82 01.12.82 01.01.83 01.02.83 01.03.83 01.04.83 01.05.83 01.06.83 01.07.83 01.08.83 01.09.83 01.10.83
Q, куб
. м
/c
0,00
1,60
01.11.82 01.12.82 01.01.83 01.02.83 01.03.83 01.04.83 01.05.83 01.06.83 01.07.83 01.08.83 01.09.83 01.10.83
Q,
ку
б.
м/с
Rostock
c. – typical intra-annual distribution of water flow of
rivers within the physico-geographical districts
0
5
10
15
20
25
30
35
40
45
XI XII I II III IV V VI VII VIII IX X
Q,
м3/с
Полтва (г. Буск)
Рата (с. Межеречье)
Влодавка (с. Окунинка)
Мухавец (г. Брест)
Кшна (с. Малова Гура)
Лесная (г. Каменец)
7
0
2
4
6
8
10
12
14
16
181
94
6
19
51
19
56
19
61
19
66
19
71
19
76
19
81
19
86
19
91
19
96
20
01
Q, м
3/с
р.Копаювка (с.Черск) р.Рыта (с. Малые Радваничи) р.Лесная (г. Каменец)
FEATURES OF WATER REGIME OF RIVERS
Kopayuvka (Czersk) Ryta (Small Radvanichi) Lesnaya (Kamianets)
Poltva (Busk)
Rata (Mezhirechye)
Vlodavka (Okuninka)
Mukhavets (Brest)
Ksna (Malova Gura)
Lesnaya (Kamianets)
Podil Upland
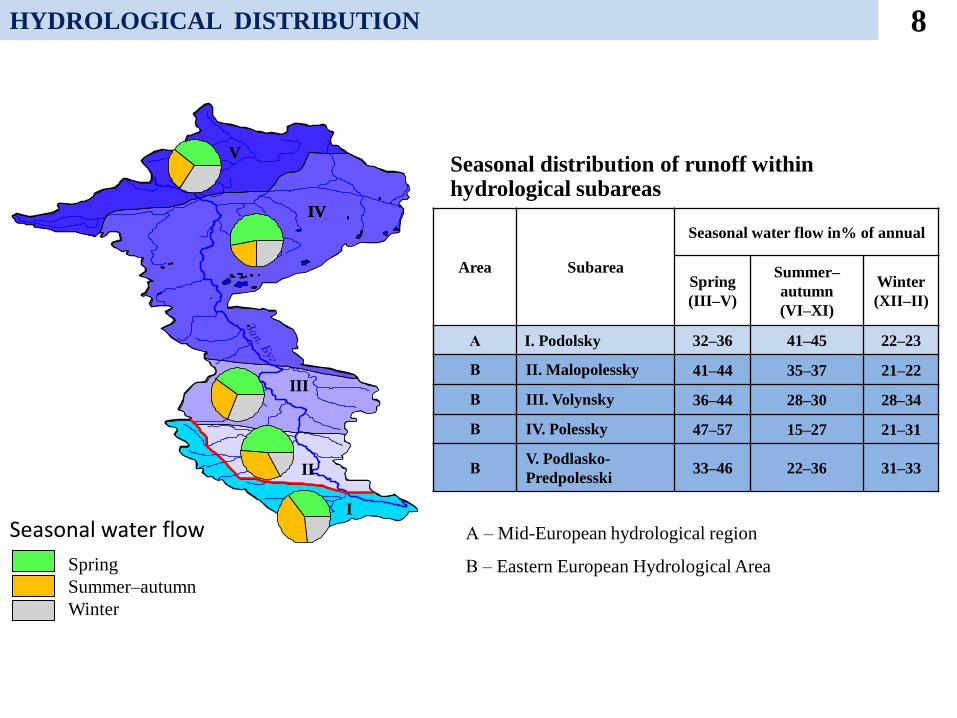
Area Subarea
Seasonal water flow in% of annual
Spring
(III–V)
Summer–
autumn
(VI–XI)
Winter
(XII–II)
А I. Podolsky 32–36 41–45 22–23
В II. Malopolessky 41–44 35–37 21–22
В III. Volynsky 36–44 28–30 28–34
В IV. Polessky 47–57 15–27 21–31
В V. Podlasko-
Predpolesski 33–46 22–36 31–33
Seasonal distribution of runoff within hydrological subareas
А – Mid-European hydrological region
В – Eastern European Hydrological Area
8
Сезонный сток
весна
лето - осень
зима
IVIV
I
V
II
III
Сезонный сток
весна
лето - осень
зима
IVIV
I
V
II
III
Зап. Буг
HYDROLOGICAL DISTRIBUTION
Seasonal water flow
Spring
Summer–autumn
Winter
9
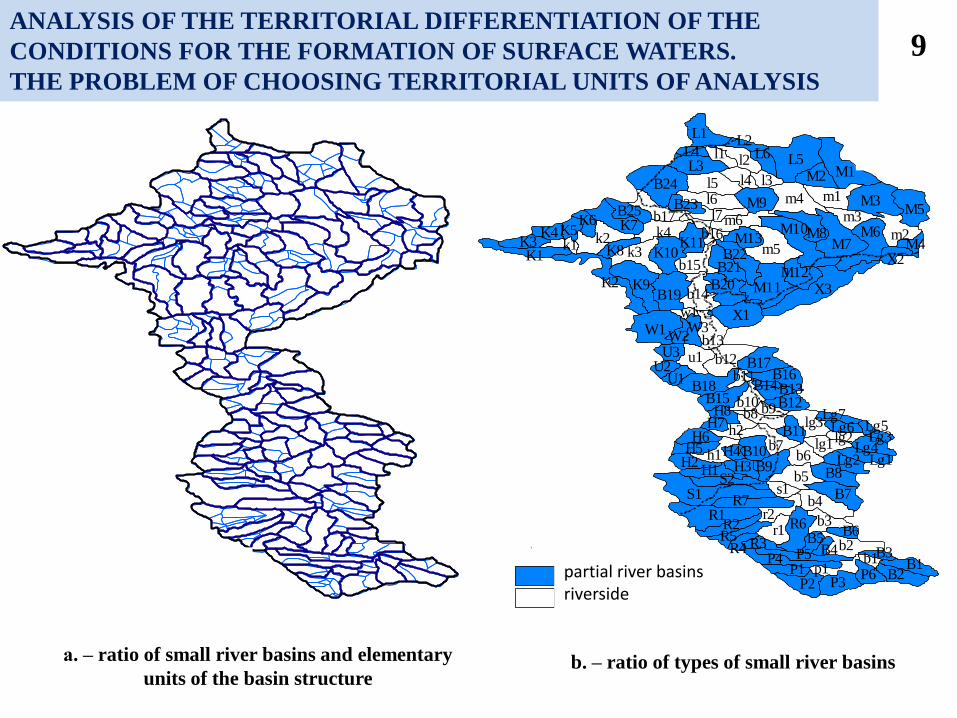
а. – ratio of small river basins and elementary
units of the basin structure b. – ratio of types of small river basins
границы элементарных структур
бассейнового строения
границы малых водосборов Типы малых водосборов
частичные водосборы
частичные приречья
границы государств
Украина
Беларусь
Польша
S1
L5
X3
l5
R1
M1
K9
l6
M7
M3
M6
B24
m5k2
X1
K2
W1
m4
k3
b4
M10
M11
b2
L3
L1
l2
b7
k4
b5
R6
M5K7
B7
r1
l7
B19
u1
l4
R7
b12
m1
P4
M9
K1
P3
m2
B8B9
P2
b14
r2
B18
K10
B20
B2
b3
S2
m6
b6
M8
lg3
P5
b13
M2
B17
b15
l3
b8
h1
B1
B22
l1
lg1
b17
R2
H1
B16
h2
B21
m3
B15
p1
H6
P6
H2
K3
L6
H3B10
s1
Lg2
K11K4
U3
Lg4
b10
X2
M13K5
B12
U1
L2
R3
W3
B23
H7
L4
Lg6
W2
B4 B3
b11
Lg5
M12
H5
R5
P1
B25
K8
Lg1
K6
k1b16
b9
B5
B11
H8
U2
B6
M4
lg2
B13
R4
Lg7
H4
b1
w1
Lg3
B14
границы элементарных структур
бассейнового строения
границы малых водосборовТипы малых водосборов
частичные водосборы
частичные приречья
границы государств
Украина
Беларусь
Польша
S1
L5
X3
l5
R1
M1
K9
l6
M7
M3
M6
B24
m5k2
X1
K2
W1
m4
k3
b4
M10
M11
b2
L3
L1
l2
b7
k4
b5
R6
M5K7
B7
r1
l7
B19
u1
l4
R7
b12
m1
P4
M9
K1
P3
m2
B8B9
P2
b14
r2
B18
K10
B20
B2
b3
S2
m6
b6
M8
lg3
P5
b13
M2
B17
b15
l3
b8
h1
B1
B22
l1
lg1
b17
R2
H1
B16
h2
B21
m3
B15
p1
H6
P6
H2
K3
L6
H3B10
s1
Lg2
K11K4
U3
Lg4
b10
X2
M13K5
B12
U1
L2
R3
W3
B23
H7
L4
Lg6
W2
B4 B3
b11
Lg5
M12
H5
R5
P1
B25
K8
Lg1
K6
k1b16
b9
B5
B11
H8
U2
B6
M4
lg2
B13
R4
Lg7
H4
b1
w1
Lg3
B14
partial river basins riverside
ANALYSIS OF THE TERRITORIAL DIFFERENTIATION OF THE
CONDITIONS FOR THE FORMATION OF SURFACE WATERS.
THE PROBLEM OF CHOOSING TERRITORIAL UNITS OF ANALYSIS
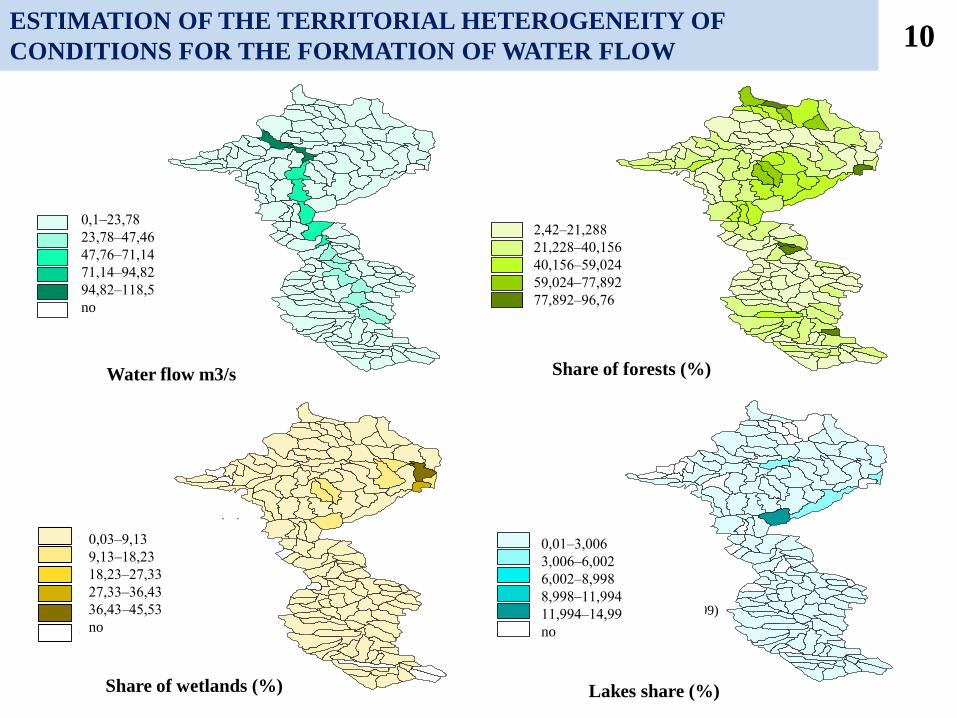
Lakes share (%) Share of wetlands (%)
Share of forests (%) Water flow m3/s Показатель нормы стока (куб. м/сек)
очень низкий (0.1 - 23.78)
низкий (23.78 - 47.46)
средний (47.46 - 71.14)
высокий (71.14 - 94.82)
очень высокий (94.82 - 118.5)
сток отсутствует
Показатель нормы стока (куб. м/сек)
очень низкий (0.1 - 23.78)
низкий (23.78 - 47.46)
средний (47.46 - 71.14)
высокий (71.14 - 94.82)
очень высокий (94.82 - 118.5)
сток отсутствует
Показатель лесистости (%)
очень низкий (2.42 - 21.288)
низкий (21.288 - 40.156)
средний (40.156 - 59.024)
высокий (59.024 - 77.892)
очень высокий (77.892 - 96.76)
Показатель лесистости (%)
очень низкий (2.42 - 21.288)
низкий (21.288 - 40.156)
средний (40.156 - 59.024)
высокий (59.024 - 77.892)
очень высокий (77.892 - 96.76)
Показатель болотистости (%)
очень низкий (0.03 - 9.13)
низкий (9.13 - 18.23)
средний (18.23 - 27.33)
высокий (27.33 - 36.43)
очень высокий (36.43 - 45.53)
болота отсутствуют
Показатель болотистости (%)
очень низкий (0.03 - 9.13)
низкий (9.13 - 18.23)
средний (18.23 - 27.33)
высокий (27.33 - 36.43)
очень высокий (36.43 - 45.53)
болота отсутствуют
Показатель озерности (%)
очень низкий (0.01 - 3.006)
низкий(3.006 - 6.002)
средний (6.002 - 8.998)
высокий (8.998 - 11.994)
очень высокий (11.994 - 14.99)
водоемы отсутствуют
Показатель озерности (%)
очень низкий (0.01 - 3.006)
низкий(3.006 - 6.002)
средний (6.002 - 8.998)
высокий (8.998 - 11.994)
очень высокий (11.994 - 14.99)
водоемы отсутствуют
ESTIMATION OF THE TERRITORIAL HETEROGENEITY OF
CONDITIONS FOR THE FORMATION OF WATER FLOW 10
0,1‒23,78
23,78‒47,46
47,76‒71,14
71,14‒94,82
94,82‒118,5
no
0,03‒9,13
9,13‒18,23
18,23‒27,33
27,33‒36,43
36,43‒45,53
no
2,42‒21,288
21,228‒40,156
40,156‒59,024
59,024‒77,892
77,892‒96,76
0,01‒3,006
3,006‒6,002
6,002‒8,998
8,998‒11,994
11,994‒14,99
no
Показатель густоты русловой сети (км/кв. км)
очень низкий (0.05 - 0.41)
низкий (0.41 - 0.77)
средний (0.77 - 1.13)
высокий (1.13 - 1.49)
очень высокий (1.49 - 1.85)
Показатель густоты русловой сети (км/кв. км)
очень низкий (0.05 - 0.41)
низкий (0.41 - 0.77)
средний (0.77 - 1.13)
высокий (1.13 - 1.49)
очень высокий (1.49 - 1.85)
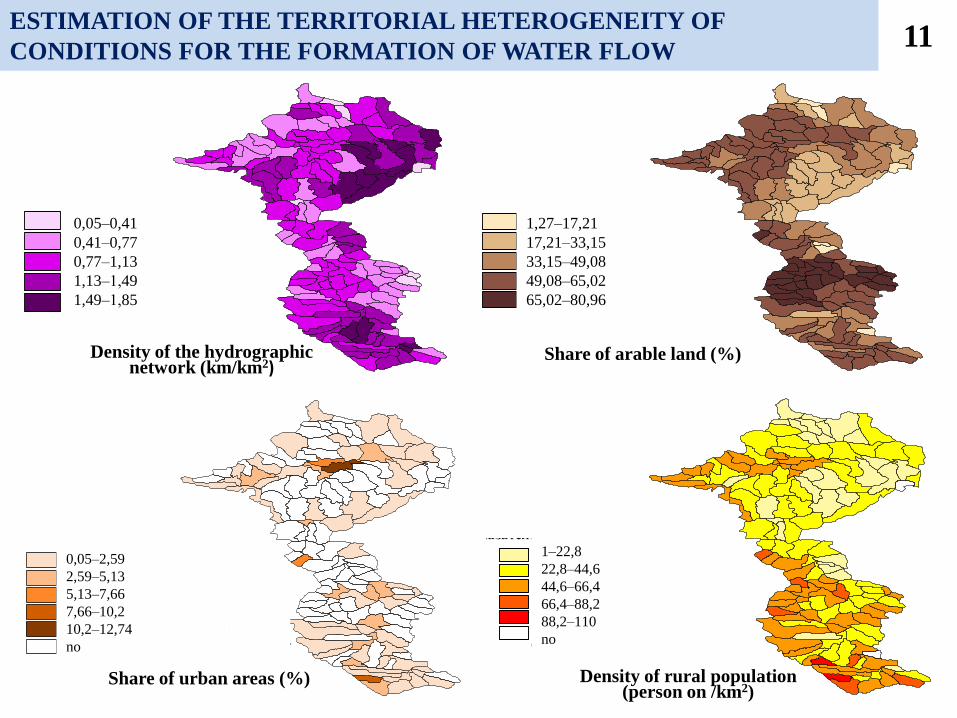
Density of the hydrographic network (km/km2)
Показатель распаханности (%)
очень низкий (1.27 - 17.21)
низкий (17.21 - 33.15(
средний (33.15 - 49.08)
высокий (49.08 - 65.02)
очень высокий (65.02 - 80.96)
Показатель распаханности (%)
очень низкий (1.27 - 17.21)
низкий (17.21 - 33.15(
средний (33.15 - 49.08)
высокий (49.08 - 65.02)
очень высокий (65.02 - 80.96)
Share of arable land (%)
Показатель доли городских территорий (%)
очень низкий (0.05 - 2.59)низкий (2.59 - 5.13)средний (5.13 - 7.66)высокий (7.66 - 10.2)очень высокий (10.2 - 12.74)городские территории отсутствуют
Показатель доли городских территорий (%)
очень низкий (0.05 - 2.59)низкий (2.59 - 5.13)средний (5.13 - 7.66)высокий (7.66 - 10.2)очень высокий (10.2 - 12.74)городские территории отсутствуют
Share of urban areas (%)
Показатель плотности сельского населения (чел/кв. км)
очень низкий (1 - 22.8)низкий (22.8 - 44.6)средний (44.6 - 66.4)высокий (66.4 - 88.2)очень высокий (88.2 - 110)сельские населенные пункты отсутствуют
Показатель плотности сельского населения (чел/кв. км)
очень низкий (1 - 22.8)низкий (22.8 - 44.6)средний (44.6 - 66.4)высокий (66.4 - 88.2)очень высокий (88.2 - 110)сельские населенные пункты отсутствуют
Density of rural population (person on /km2)
Показатель плотности сельского населения (чел/кв. км)
очень низкий (1 - 22.8)низкий (22.8 - 44.6)средний (44.6 - 66.4)высокий (66.4 - 88.2)очень высокий (88.2 - 110)сельские населенные пункты отсутствуют
очень низкий (1.27 - 17.21)
низкий (17.21 - 33.15)
средний (33.15 - 49.08)
высокий (49.08 - 65.02)
очень высокий (65.02 - 80.96)
ESTIMATION OF THE TERRITORIAL HETEROGENEITY OF
CONDITIONS FOR THE FORMATION OF WATER FLOW 11
0,05‒0,41
0,41‒0,77
0,77‒1,13
1,13‒1,49
1,49‒1,85
1,27‒17,21
17,21‒33,15
33,15‒49,08
49,08‒65,02
65,02‒80,96
0,05‒2,59
2,59‒5,13
5,13‒7,66
7,66‒10,2
10,2‒12,74
no
1‒22,8
22,8‒44,6
44,6‒66,4
66,4‒88,2
88,2‒110
no
12
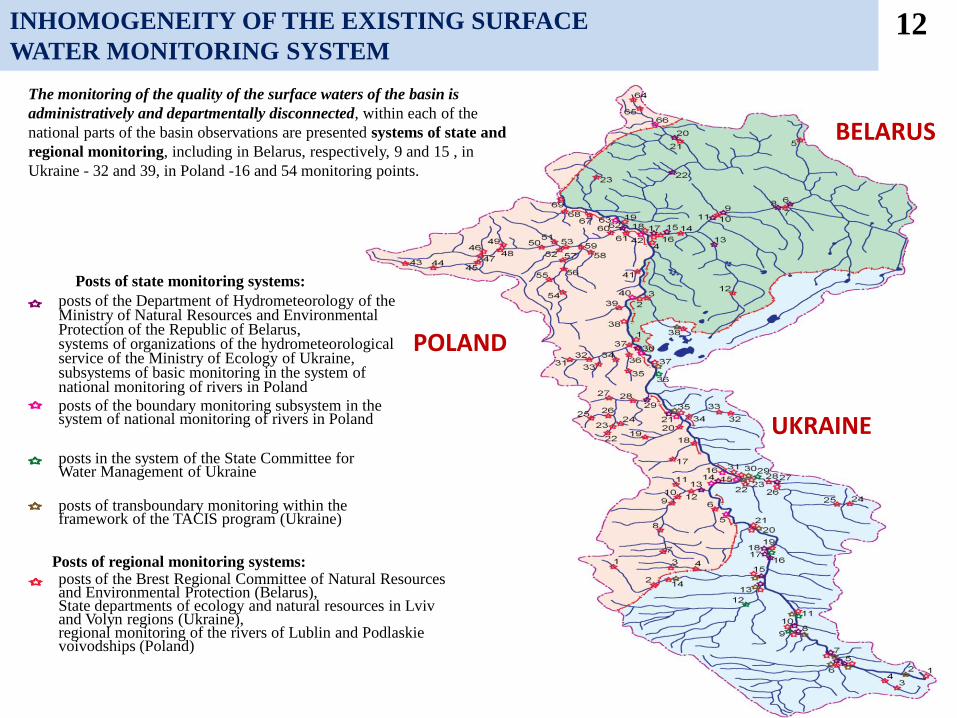
Posts of regional monitoring systems:
The monitoring of the quality of the surface waters of the basin is
administratively and departmentally disconnected, within each of the
national parts of the basin observations are presented systems of state and
regional monitoring, including in Belarus, respectively, 9 and 15 , in
Ukraine - 32 and 39, in Poland -16 and 54 monitoring points.
posts of the boundary monitoring subsystem in the system of national monitoring of rivers in Poland
posts of the Department of Hydrometeorology of the Ministry of Natural Resources and Environmental Protection of the Republic of Belarus, systems of organizations of the hydrometeorological service of the Ministry of Ecology of Ukraine, subsystems of basic monitoring in the system of national monitoring of rivers in Poland
posts of transboundary monitoring within the framework of the TACIS program (Ukraine)
posts of the Brest Regional Committee of Natural Resources and Environmental Protection (Belarus), State departments of ecology and natural resources in Lviv and Volyn regions (Ukraine), regional monitoring of the rivers of Lublin and Podlaskie voivodships (Poland)
Posts of state monitoring systems:
posts in the system of the State Committee for Water Management of Ukraine
INHOMOGENEITY OF THE EXISTING SURFACE
WATER MONITORING SYSTEM
BELARUS
UKRAINE
POLAND
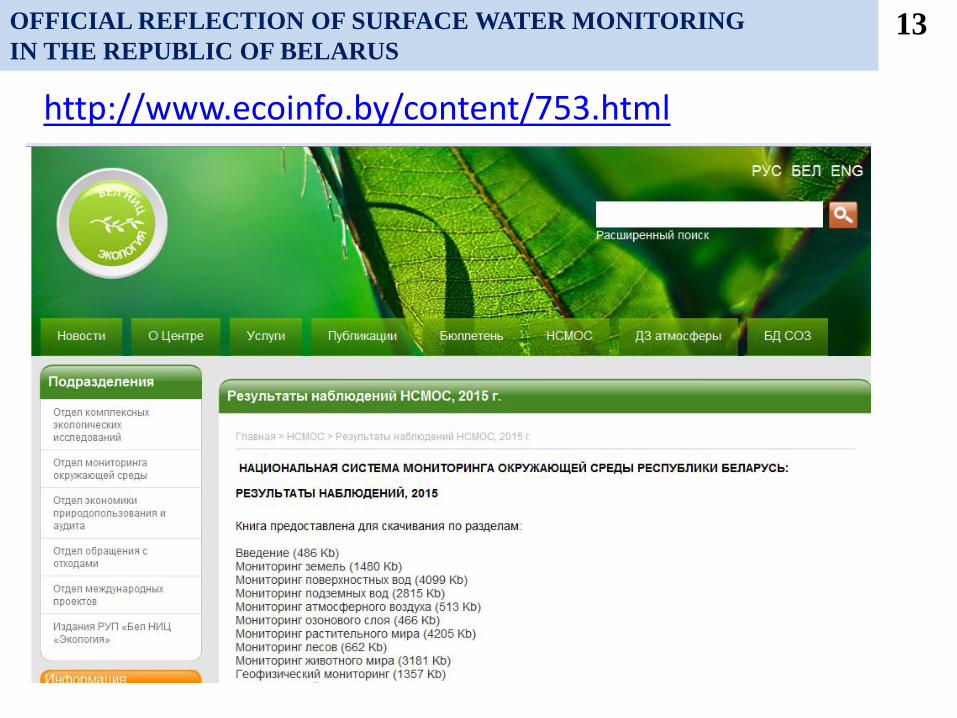
OFFICIAL REFLECTION OF SURFACE WATER MONITORING
IN THE REPUBLIC OF BELARUS 13
http://www.ecoinfo.by/content/753.html
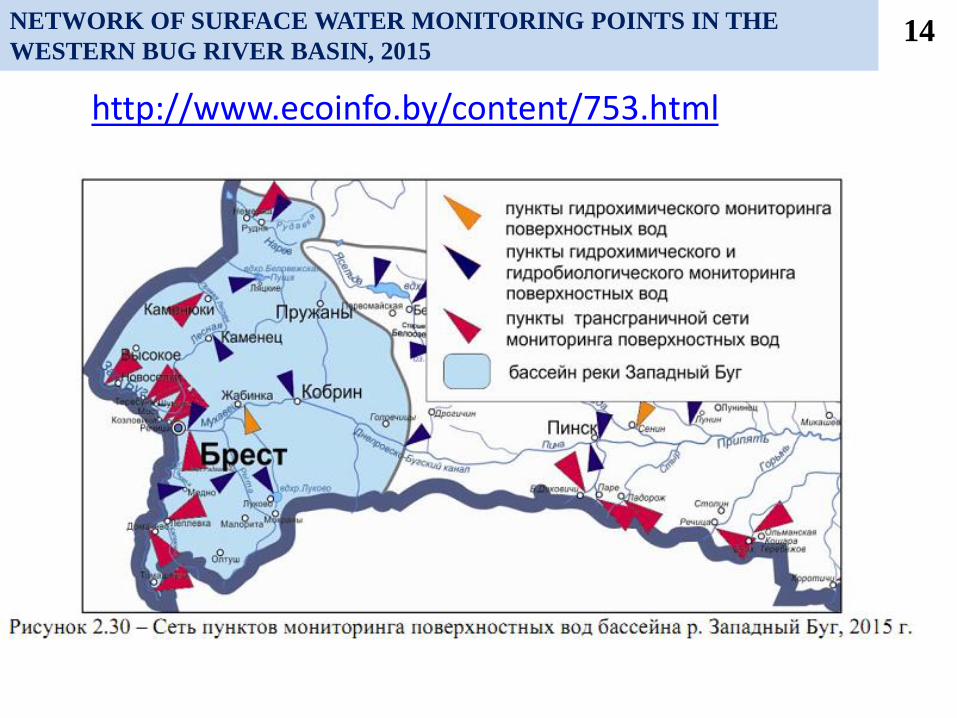
NETWORK OF SURFACE WATER MONITORING POINTS IN THE
WESTERN BUG RIVER BASIN, 2015 14
http://www.ecoinfo.by/content/753.html
NETWORK OF SURFACE WATER MONITORING POINTS IN THE
WESTERN BUG RIVER BASIN, 2015 15
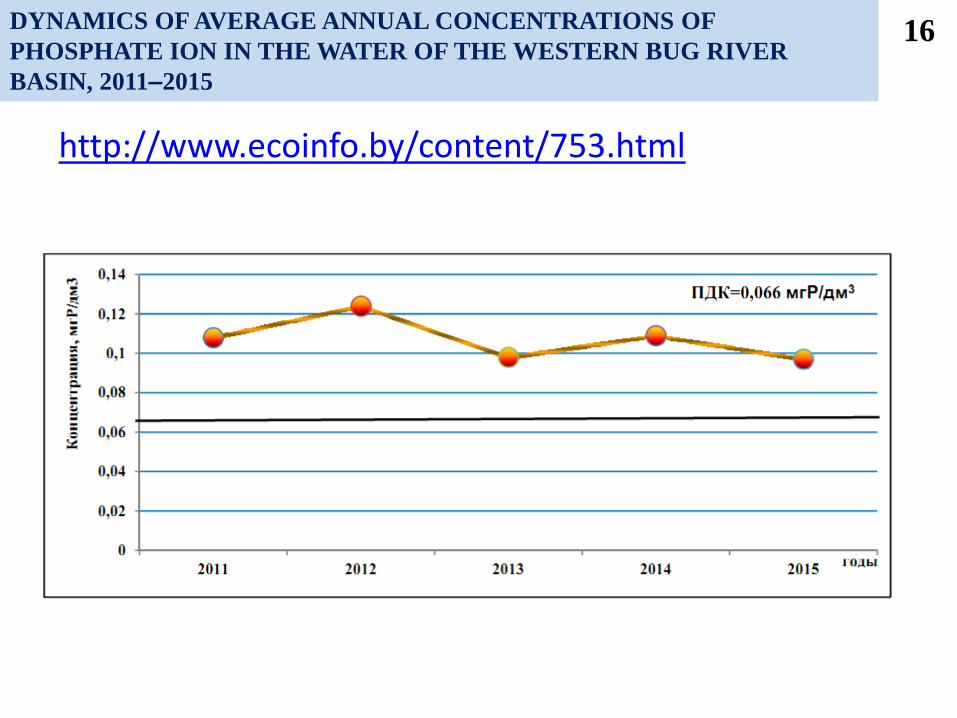
DYNAMICS OF AVERAGE ANNUAL CONCENTRATIONS OF
PHOSPHATE ION IN THE WATER OF THE WESTERN BUG RIVER
BASIN, 2011‒2015
16
http://www.ecoinfo.by/content/753.html
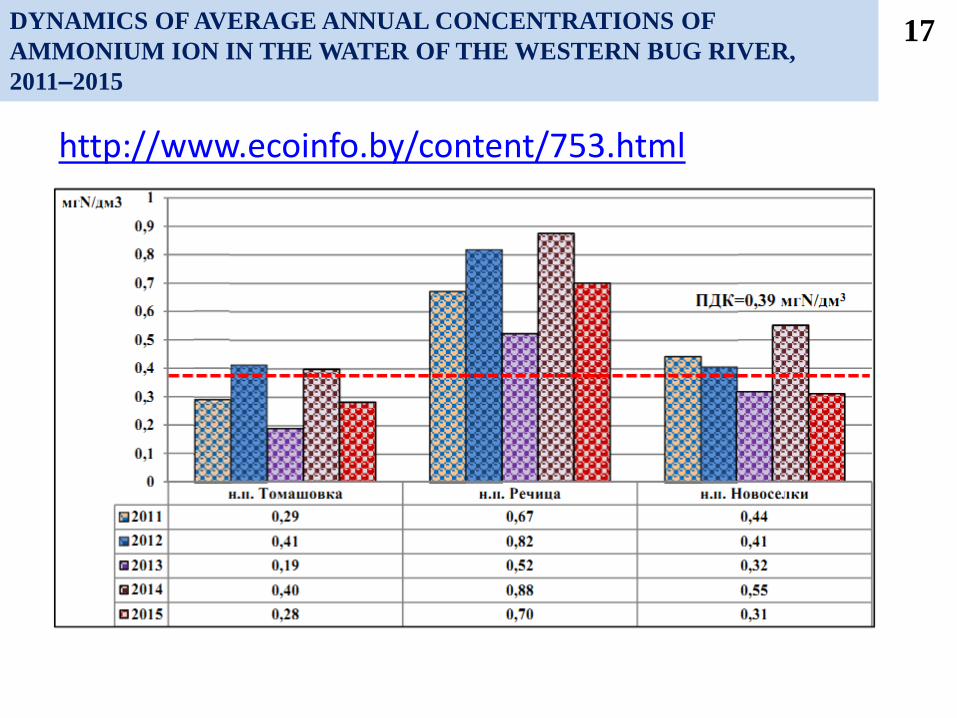
DYNAMICS OF AVERAGE ANNUAL CONCENTRATIONS OF
AMMONIUM ION IN THE WATER OF THE WESTERN BUG RIVER,
2011‒2015
17
http://www.ecoinfo.by/content/753.html
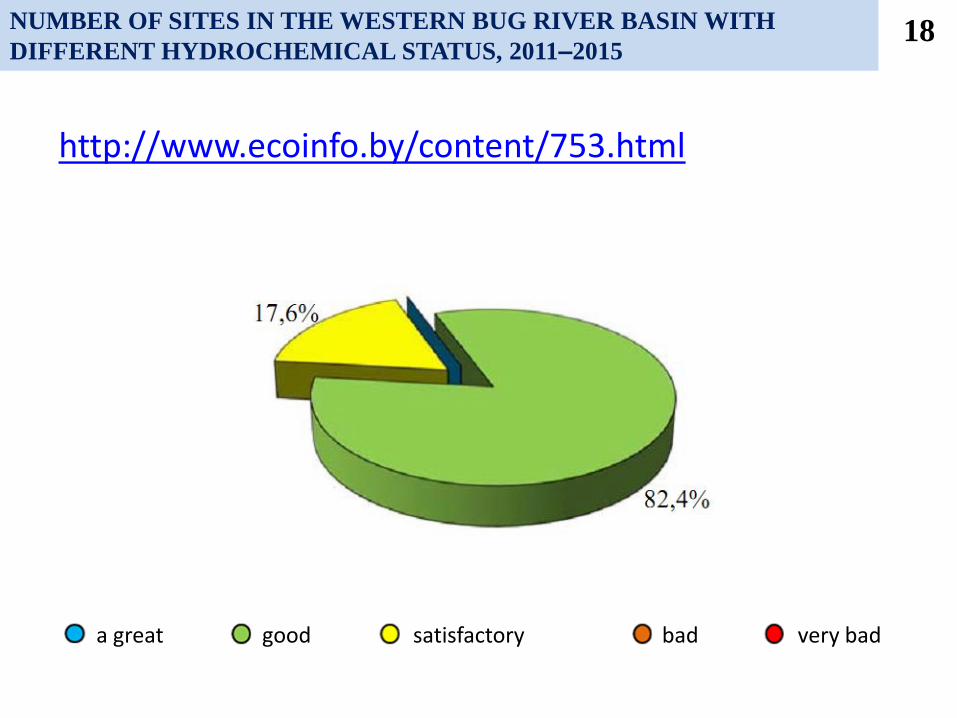
NUMBER OF SITES IN THE WESTERN BUG RIVER BASIN WITH
DIFFERENT HYDROCHEMICAL STATUS, 2011‒2015
a great good satisfactory bad very bad
http://www.ecoinfo.by/content/753.html
18
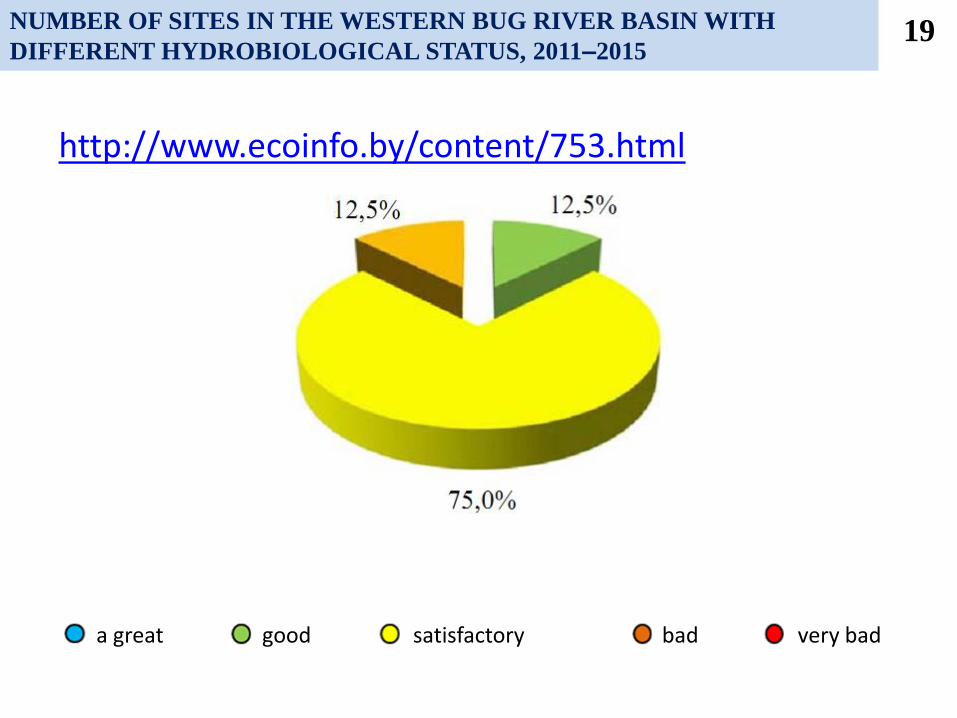
NUMBER OF SITES IN THE WESTERN BUG RIVER BASIN WITH
DIFFERENT HYDROBIOLOGICAL STATUS, 2011‒2015
a great good satisfactory bad very bad
http://www.ecoinfo.by/content/753.html
19
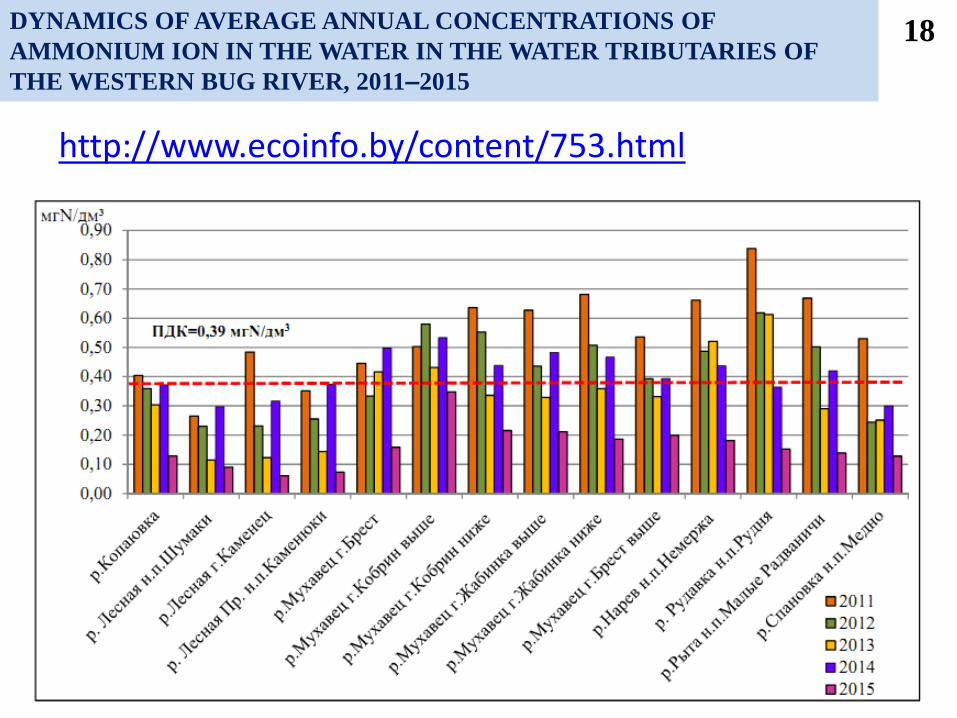
DYNAMICS OF AVERAGE ANNUAL CONCENTRATIONS OF
AMMONIUM ION IN THE WATER IN THE WATER TRIBUTARIES OF
THE WESTERN BUG RIVER, 2011‒2015
http://www.ecoinfo.by/content/753.html
18