Embed Size (px)
Citation preview
Lab Practices-2 Fourth Year Computer Engineering Engineering
Assignment No. 2
Title:
Consider a suitable dataset. For clustering of data instances in different groups, apply different clustering techniques (minimum 2). Visualize the clusters using suitable tool.
Objective:
1. Understand the various clustering types and how to implement the same using suitable tool (R Studio)
2. Use R functions to create K-means Clustering models and hierarchical clustering models
Problem Statement:
Develop any two types clustering algorithm and visualize the same using R Studio.
Outcomes:
1. Students will be able to demonstrate Installation of R Studio
2. Students will be able to demonstrate different Clustering Algorithm
3. Students will be able to demonstrate & Visualize the effectiveness of the K-means Clustering algorithm and hierarchical clustering using graphic capabilities in R
Hardware Requirement: Any CPU with Pentium Processor or similar, 256 MB RAM or more,1 GB Hard Disk or more
Software Requirements: 32/64 bit Linux/Windows Operating System, latest R Studio
Theory: What is K-means clustering?
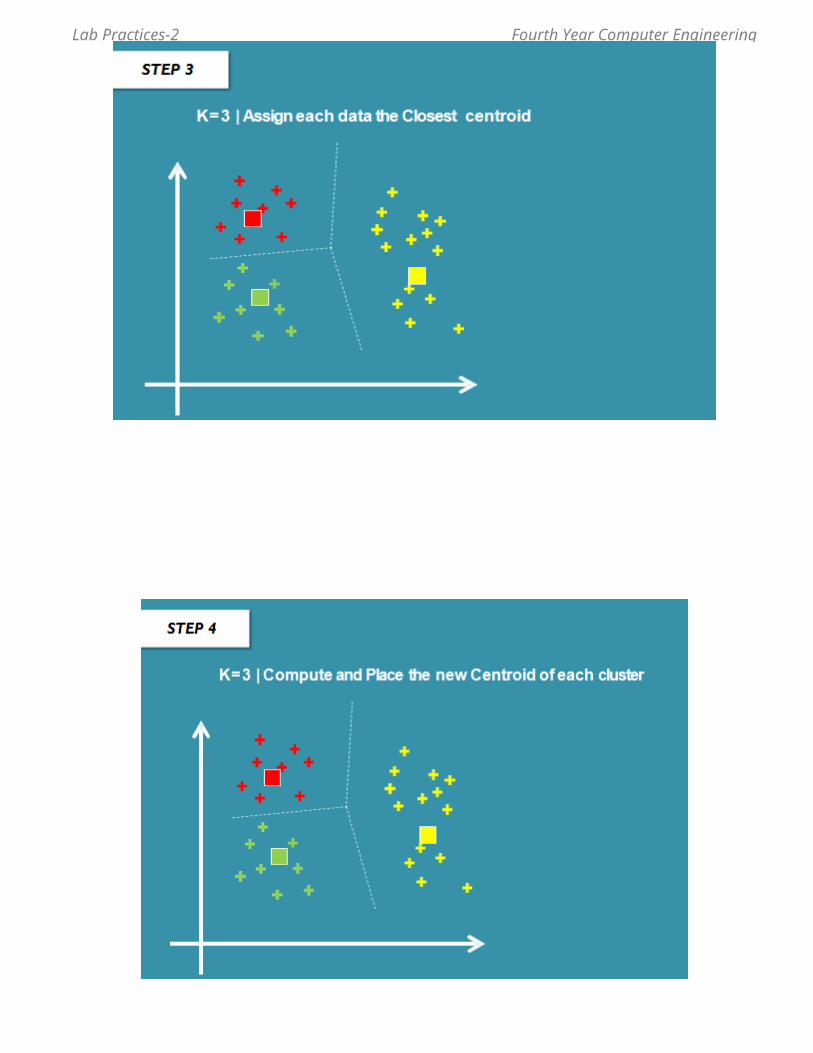
K-means clustering is a type of unsupervised learning, which is used when you have unlabeled data (i.e., data without defined categories or groups). The goal of this algorithm is to find groups in the data, with the number of groups represented by the variable K. The algorithm works iteratively to assign each data point to one of K groups based on the features that are provided. Data points are clustered based on feature similarity. The results of the K-means clustering algorithm are:
1. The centroids of the K clusters, which can be used to label new data2. Labels for the training data (each data point is assigned to a single cluster)
Rather than defining groups before looking at the data, clustering allows you to find and analyze the groups that have formed organically. The "Choosing K" section below describes how the number of groups can be determined. Each centroid of a cluster is a collection of feature values which define the resulting groups. Examining the centroid feature weights can be used to qualitatively interpret what kind of group each cluster represents.
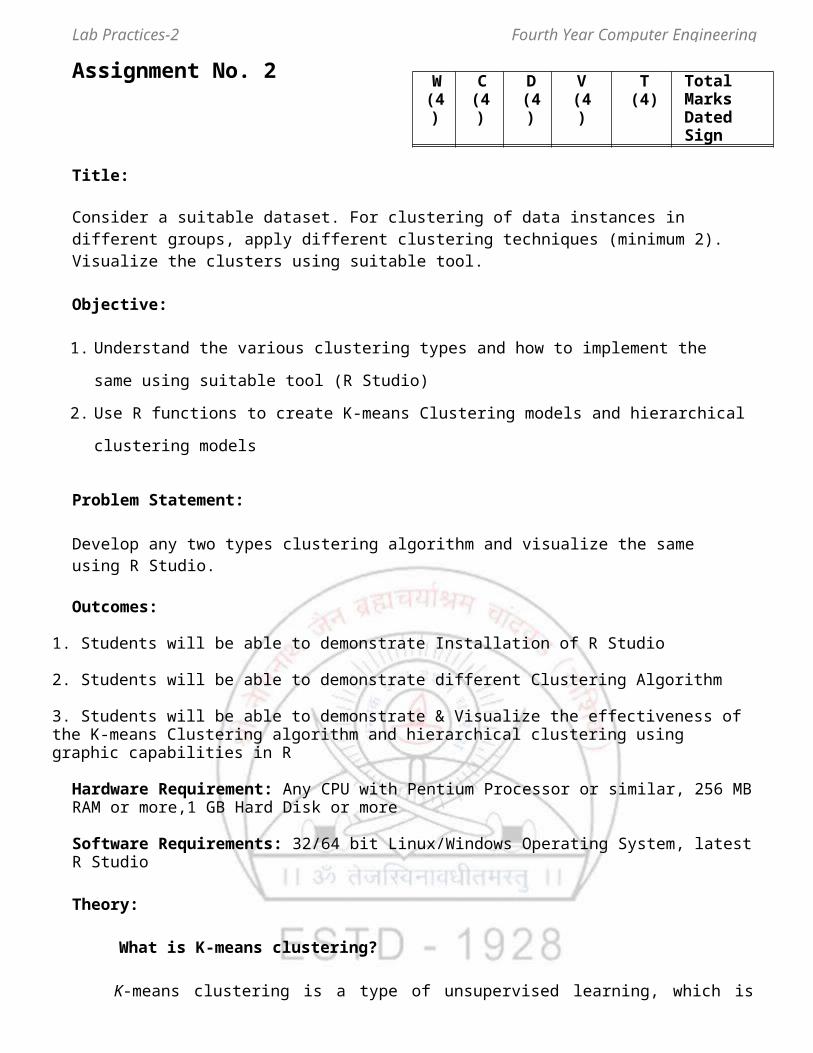
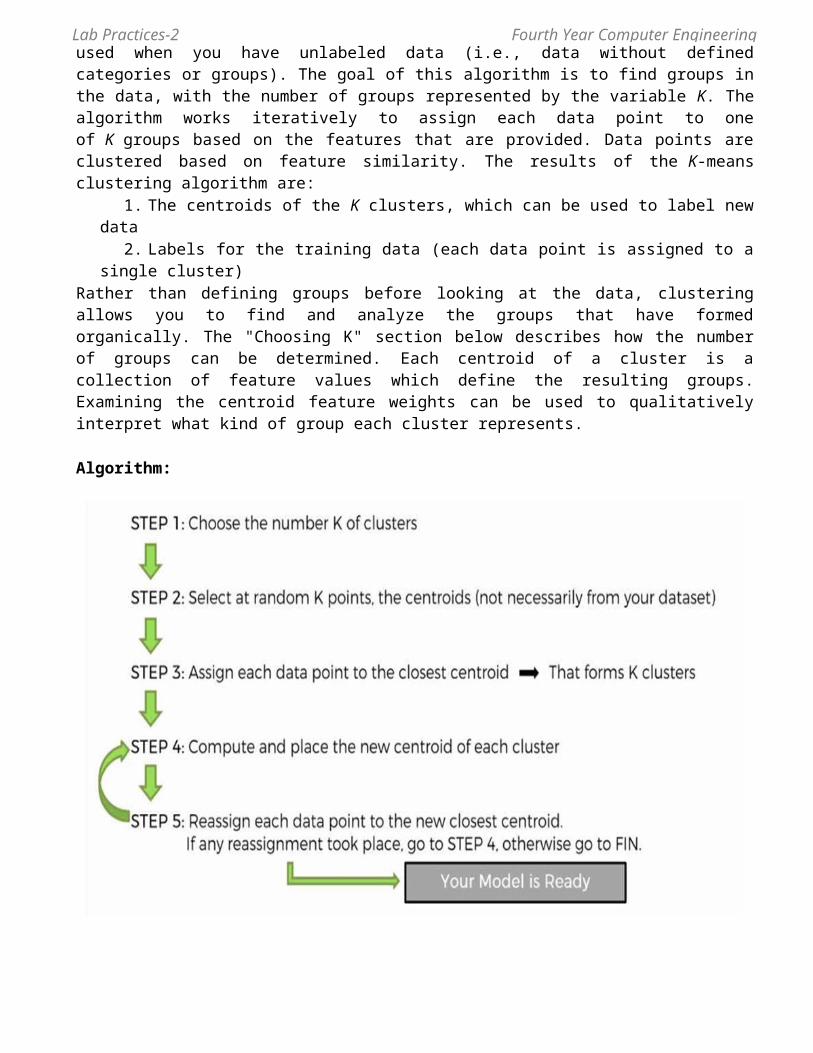
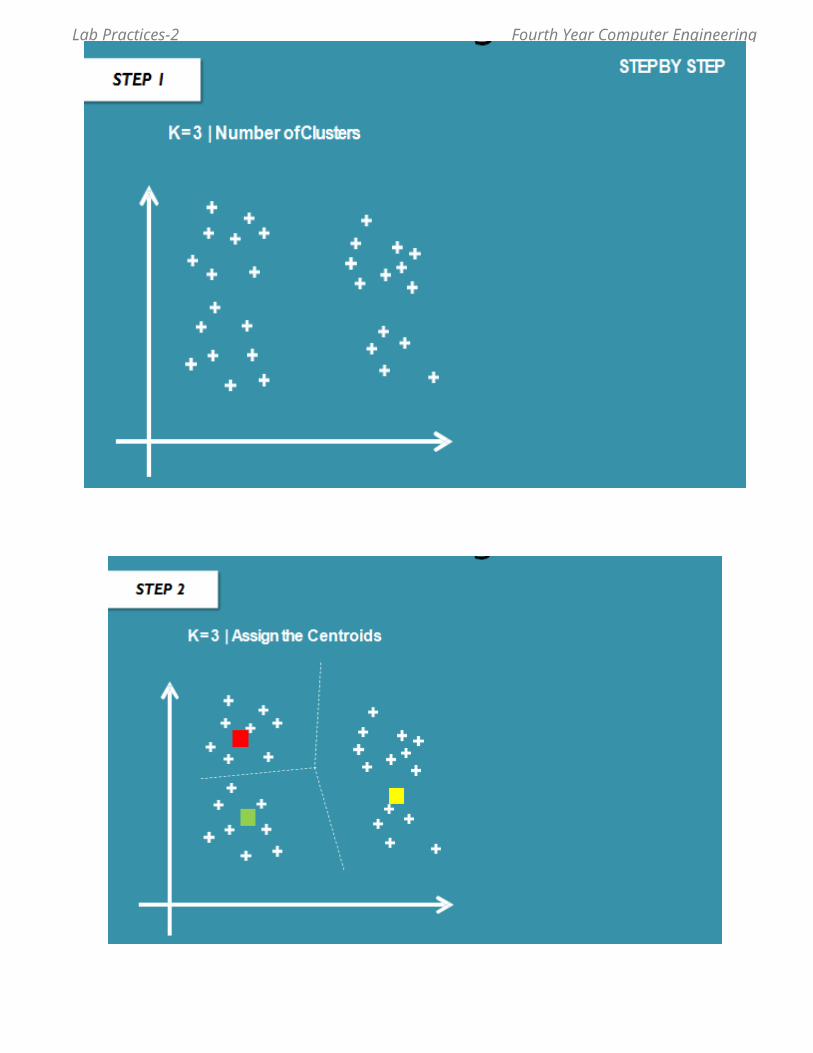
Algorithm:
W(4)
C (4)
D(4)
V (4)
T(4)
Total MarksDated Sign
Lab Practices-2 Fourth Year Computer Engineering Engineering
Lab Practices-2 Fourth Year Computer Engineering Engineering
Lab Practices-2 Fourth Year Computer Engineering Engineering
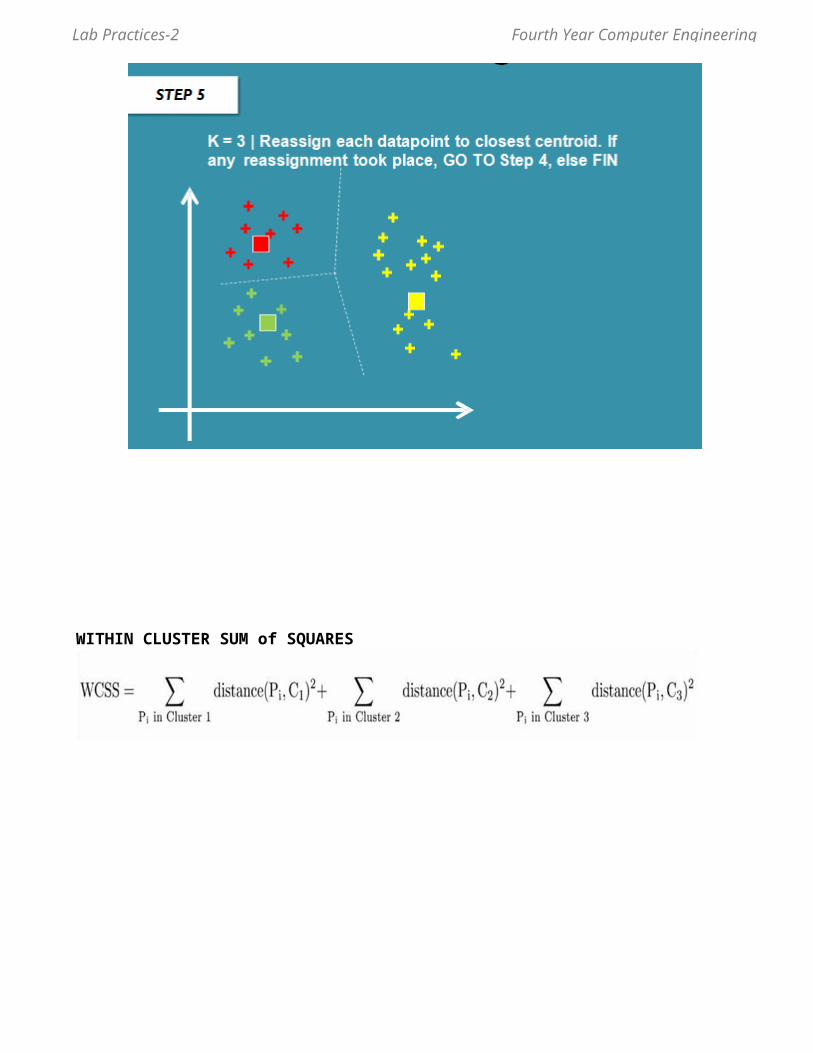
Lab Practices-2 Fourth Year Computer Engineering EngineeringWITHIN CLUSTER SUM of SQUARES
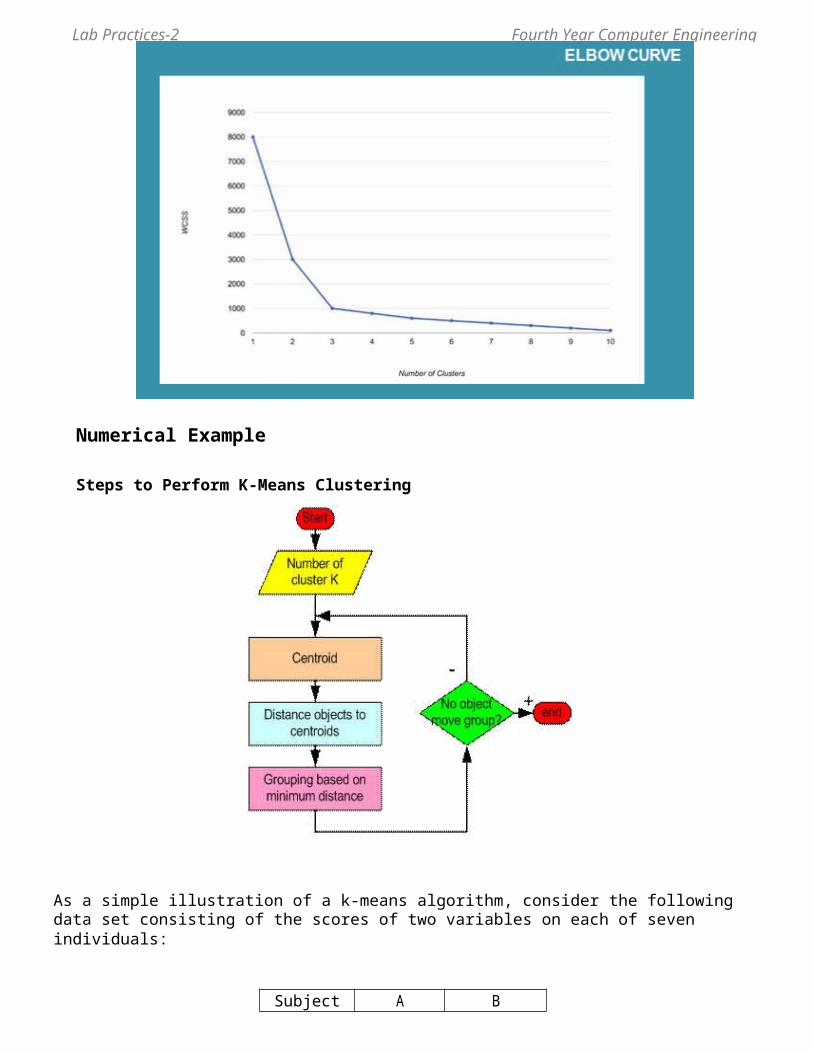
Numerical Example
Steps to Perform K-Means Clustering
As a simple illustration of a k-means algorithm, consider the following data set consisting of the scores of two variables on each of seven individuals:
Lab Practices-2 Fourth Year Computer Engineering Engineering
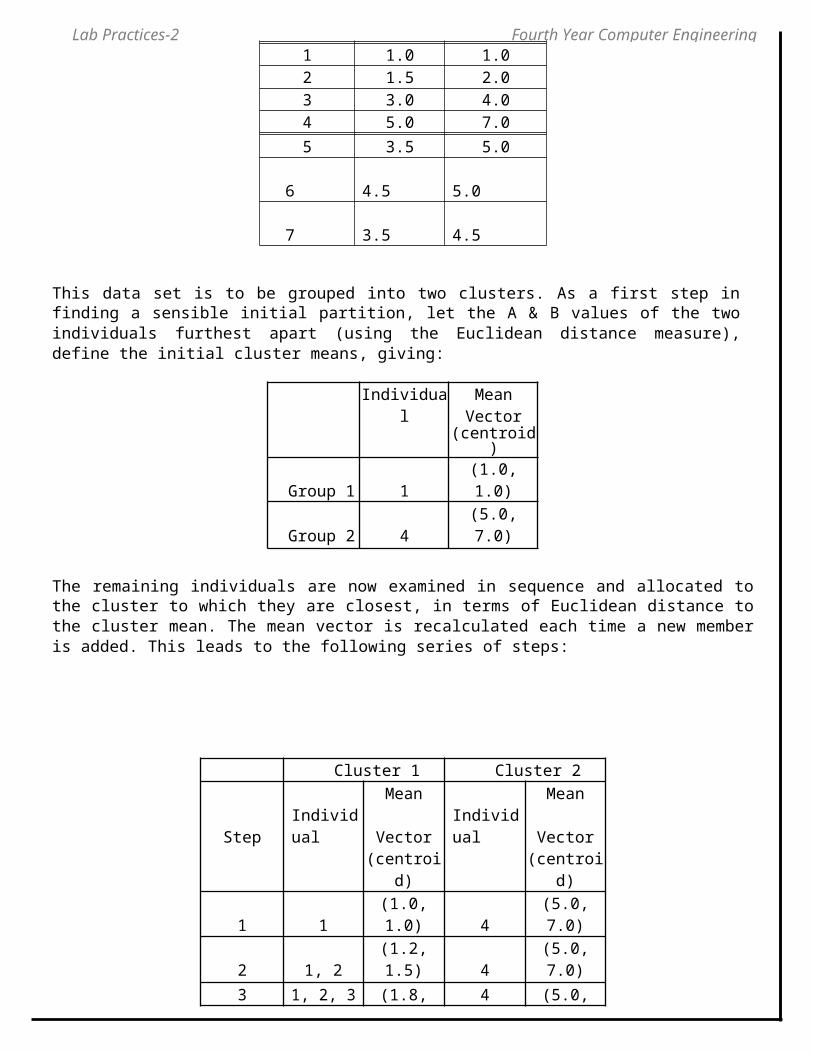
Subject A B1 1.0 1.02 1.5 2.03 3.0 4.04 5.0 7.05 3.5 5.0
6 4.5 5.0 7 3.5 4.5
This data set is to be grouped into two clusters. As a first step in finding a sensible initial partition, let the A & B values of the two individuals furthest apart (using the Euclidean distance measure), define the initial cluster means, giving:
Individual Mean Vector(centroid)
Group 1 1 (1.0, 1.0)Group 2 4 (5.0, 7.0)
The remaining individuals are now examined in sequence and allocated to the cluster to which they are closest, in terms of Euclidean distance to the cluster mean. The mean vector is recalculated each time a new member is added. This leads to the following series of steps:
Cluster 1 Cluster 2Mean Mean
Step Individual Vector Individual Vector(centroid) (centroid)
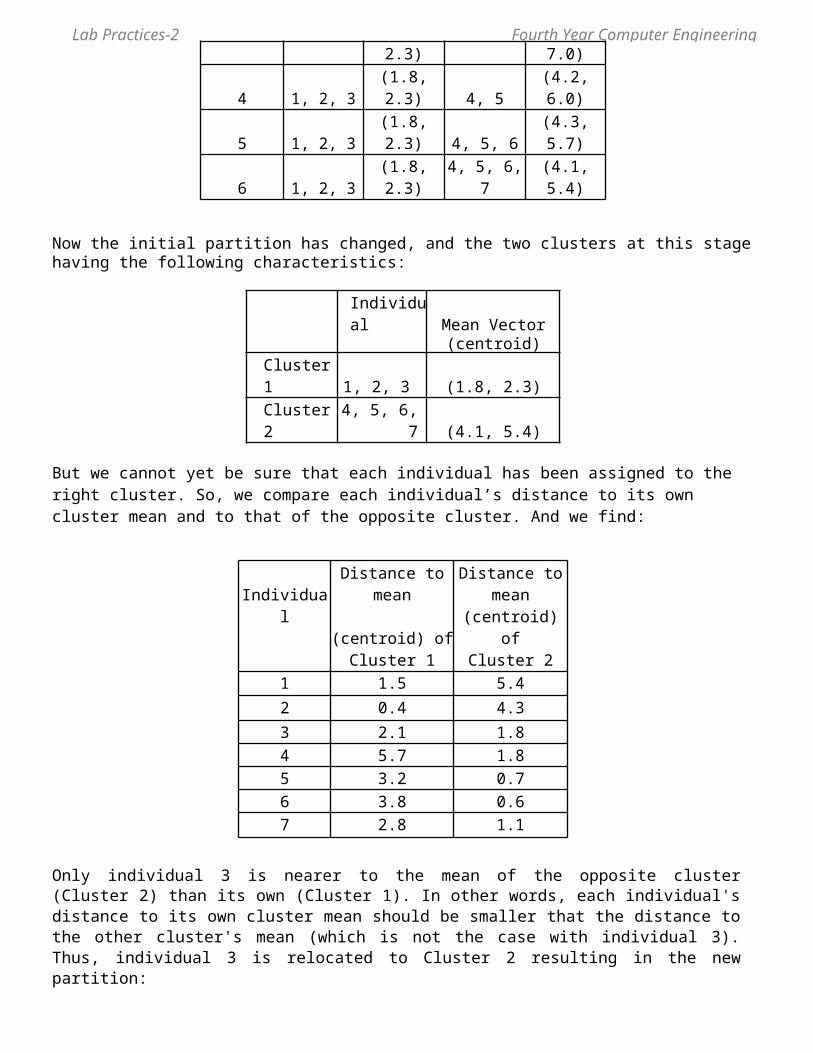
1 1 (1.0, 1.0) 4 (5.0, 7.0)2 1, 2 (1.2, 1.5) 4 (5.0, 7.0)3 1, 2, 3 (1.8, 2.3) 4 (5.0, 7.0)4 1, 2, 3 (1.8, 2.3) 4, 5 (4.2, 6.0)5 1, 2, 3 (1.8, 2.3) 4, 5, 6 (4.3, 5.7)6 1, 2, 3 (1.8, 2.3) 4, 5, 6, 7 (4.1, 5.4)
Now the initial partition has changed, and the two clusters at this stage having the following characteristics:
Individual Mean Vector(centroid)
Cluster 1 1, 2, 3 (1.8, 2.3)Cluster 2 4, 5, 6, 7 (4.1, 5.4)
But we cannot yet be sure that each individual has been assigned to the right cluster. So, we compare each individual’s distance to its own cluster mean and to that of the opposite cluster. And we find:
Lab Practices-2 Fourth Year Computer Engineering Engineering
Distance to Distance to
Individual mean mean(centroid) of (centroid) of
Cluster 1 Cluster 21 1.5 5.42 0.4 4.33 2.1 1.84 5.7 1.85 3.2 0.76 3.8 0.67 2.8 1.1
Only individual 3 is nearer to the mean of the opposite cluster (Cluster 2) than its own (Cluster 1). In other words, each individual's distance to its own cluster mean should be smaller that the distance to the other cluster's mean (which is not the case with individual 3). Thus, individual 3 is relocated to Cluster 2 resulting in the new partition:
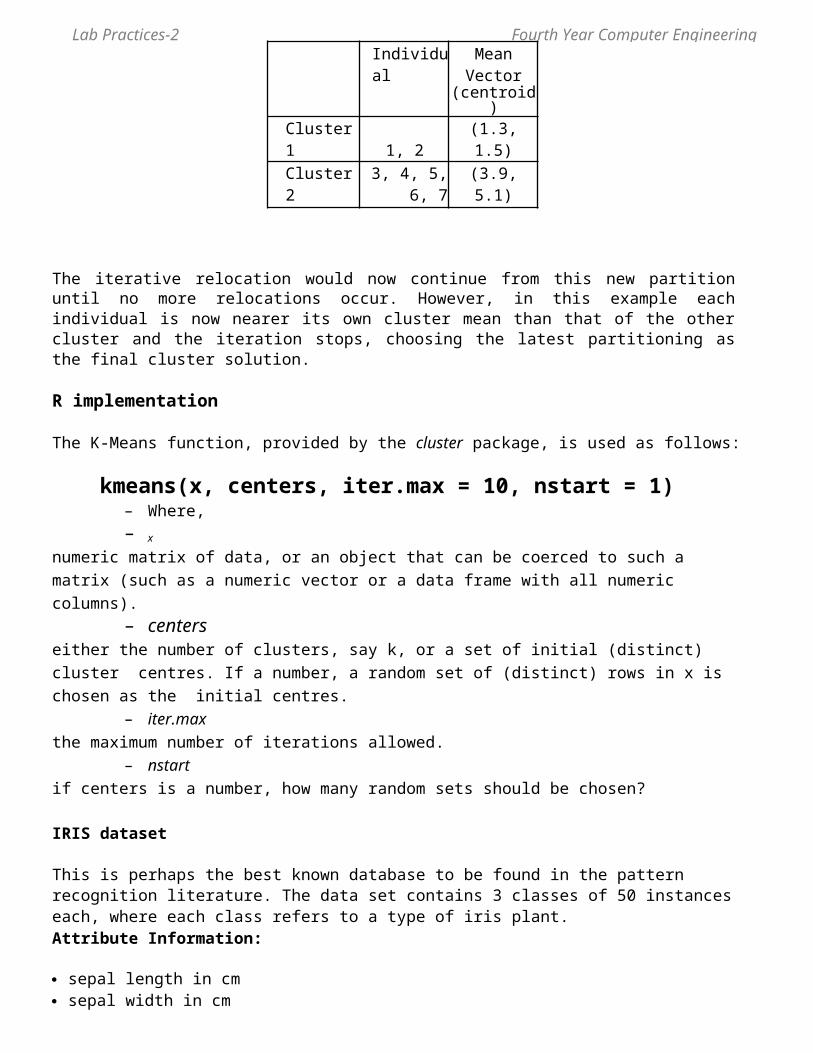
Individual Mean Vector(centroid)
Cluster 1 1, 2 (1.3, 1.5)Cluster 2 3, 4, 5, 6, 7 (3.9, 5.1)
The iterative relocation would now continue from this new partition until no more relocations occur. However, in this example each individual is now nearer its own cluster mean than that of the other cluster and the iteration stops, choosing the latest partitioning as the final cluster solution.
R implementation
The K-Means function, provided by the cluster package, is used as follows:
kmeans(x, centers, iter.max = 10, nstart = 1) – Where,– x
numeric matrix of data, or an object that can be coerced to such a matrix (such as a numeric vector or a data frame with all numeric columns).
– centers either the number of clusters, say k, or a set of initial (distinct) cluster centres. If a number, a random set of (distinct) rows in x is chosen as the initial centres.
– iter.max the maximum number of iterations allowed.
– nstart if centers is a number, how many random sets should be chosen?
Lab Practices-2 Fourth Year Computer Engineering EngineeringIRIS dataset
This is perhaps the best known database to be found in the pattern recognition literature. The data set contains 3 classes of 50 instances each, where each class refers to a type of iris plant.Attribute Information:
sepal length in cm sepal width in cm petal length in cm petal width in cm class:
1 Iris Setosa2 Iris Versicolour3 Iris Virginica
Steps
1. Set working directory2. Get data from datasets3. Execute the model4. View the output5. Plot the results
CODE:
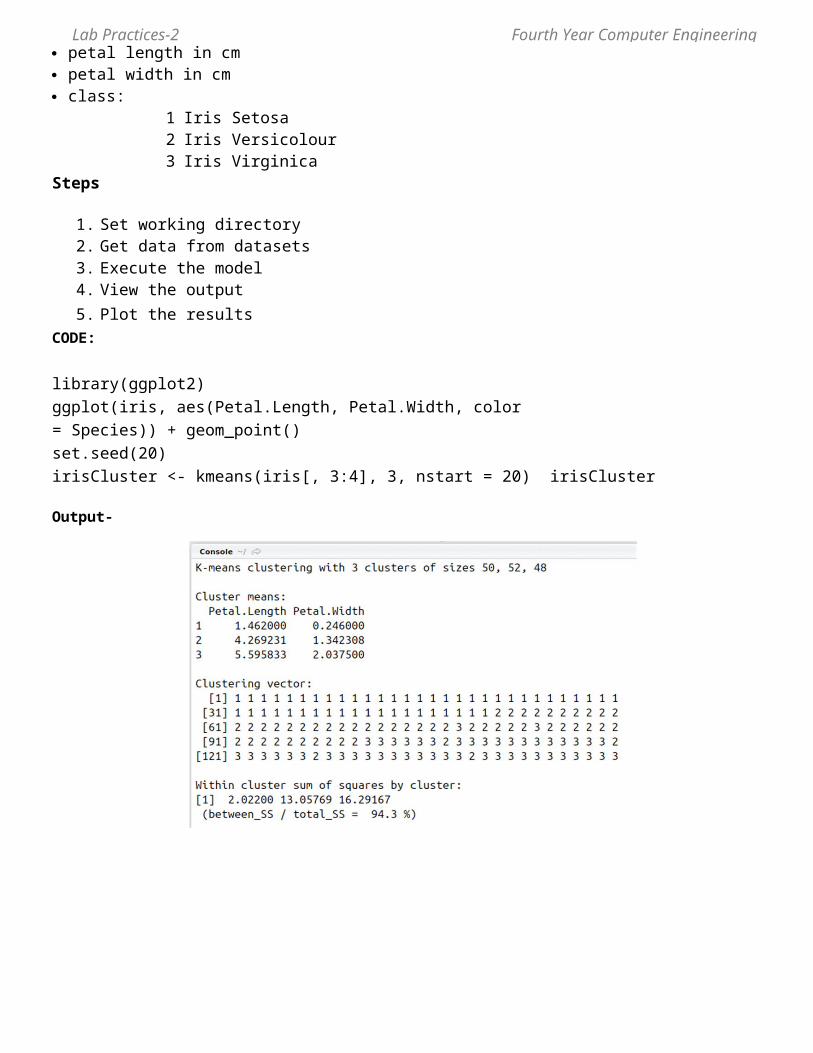
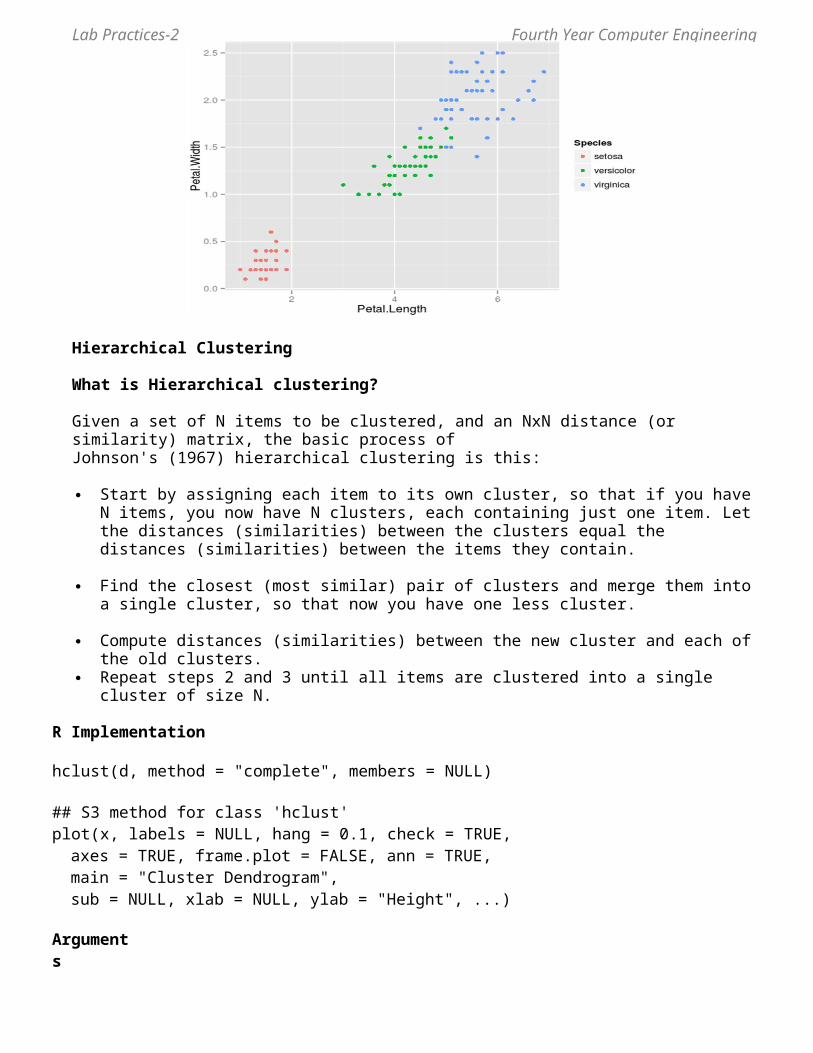
library(ggplot2)ggplot(iris, aes(Petal.Length, Petal.Width, color= Species)) + geom_point()set.seed(20)irisCluster <- kmeans(iris[, 3:4], 3, nstart = 20) irisCluster
Output-
Lab Practices-2 Fourth Year Computer Engineering Engineering
Hierarchical Clustering
What is Hierarchical clustering?
Given a set of N items to be clustered, and an NxN distance (or similarity) matrix, the basic process ofJohnson's (1967) hierarchical clustering is this:
Start by assigning each item to its own cluster, so that if you have N items, you now have N clusters, each containing just one item. Let the distances (similarities) between the clusters equal the distances (similarities) between the items they contain.
Find the closest (most similar) pair of clusters and merge them into a single cluster, so that now you have one less cluster.
Compute distances (similarities) between the new cluster and each of the old clusters. Repeat steps 2 and 3 until all items are clustered into a single cluster of size N.
R Implementation
hclust(d, method = "complete", members = NULL)
## S3 method for class 'hclust'plot(x, labels = NULL, hang = 0.1, check = TRUE,
axes = TRUE, frame.plot = FALSE, ann = TRUE,main = "Cluster Dendrogram",sub = NULL, xlab = NULL, ylab = "Height", ...)
Arguments
d a dissimilarity structure as produced by dist.method the agglomeration method to be used. This should be (an unambiguous abbreviation of)
one of "ward.D", "ward.D2", "single", "complete", "average" (= UPGMA), "mcquitty" (=WPGMA), "median" (= WPGMC) or "centroid" (= UPGMC).
members NULL or a vector with length size of d. See the ‘Details’ section.x an object of the type produced by hclust.
Lab Practices-2 Fourth Year Computer Engineering Engineeringhang The fraction of the plot height by which labels should hang below the rest of the plot. A
negative value will cause the labels to hang down from 0.check logical indicating if the x object should be checked for validity. This check is not
necessary when x is known to be valid such as when it is the direct result of hclust(). Thedefault is check=TRUE, as invalid inputs may crash R due to memory violation in theinternal C plotting code.
labels A character vector of labels for the leaves of the tree. By default the row names or rownumbers of the original data are used. If labels = FALSE no labels at all are plotted.
axes, logical flags as in plot.default . frame.plot,annmain, sub, character strings for title . sub and xlab have a non-NULL default when there's axlab, ylab tree$call.... Further graphical arguments. E.g., cex controls the size of the labels (if plotted) in the
same way as text .
Step 3 can be done in different ways, which is what distinguishes single-link from complete-link and average-link clustering
Mtcars dataset
The data was extracted from the 1974 Motor Trend US magazine, and comprises fuel consumption and 10 aspects of automobile design and performance for 32 automobiles (1973–74 models)
A data frame with 32 observations on 11 variables.
[, 1] mpg Miles/(US) gallon[, 2] cyl Number of cylinders[, 3] disp Displacement (cu.in.)[, 4] hp Gross horsepower[, 5] drat Rear axle ratio[, 6] wt Weight (lb/1000)[, 7] qsec 1/4 mile time[, 8] vs V/S[, 9] am Transmission (0 = automatic, 1 = manual)[,10] gear Number of forward gears
Number of carburetors
[,11] carb
In general, there are many choices of cluster analysis methodology. The hclust function in R uses the complete linkage method for hierarchical clustering by default. This particular clustering method defines the cluster distance between two clusters to be the maximum distance between their individual components. At every stage of the clustering process, the two nearest clusters are merged into a new cluster.
With the distance matrix found in previous tutorial, we can use various techniques of cluster analysis for
Lab Practices-2 Fourth Year Computer Engineering Engineeringrelationship discovery. For example, in the data set mtcars , we can run the distance matrix with hclust, and
plot a dendrogram that displays a hierarchical relationship among the vehicles.
> d <- dist(as.matrix(mtcars)) # find distance matrix
> hc <- hclust(d) # apply hirarchical clustering > plot(hc) # plot the dendrogram
Conclusion: Hence we are able to demonstrate various clustering method using R Tool.
Assignment Question
1. What is difference between Supervised and Unsupervised Learning?2. What are different similarities between Kmean and KNN Algorithm?3. What is Euclidean distance? Explain with Suitable example?4. What is hamming distance? Explain with Suitable example?5. What is Chi Squre Distance? Explain with Suitable example?6. What are different types of Clustering?
References
1 www.r-tutor.com/gpu-computing/clustering/hierarchical-cluster-analysis2 http://www.statmethods.net/advstats/cluster.html3 http://people.revoledu.com/kardi/tutorial/Clustering/Numerical%20Example.htm4 http://www.stat.berkeley.edu/~s133/Cluster2a.html5 http://www.rdatamining.com/examples/kmeans-clustering6 http://www.r-statistics.com/2013/08/k-means-clustering-from-r-in-action/