Embed Size (px)
Citation preview
SAKARYA ÜNİVERSİTESİ FEN BİLİMLERİ ENSTİTÜSÜ DERGİSİ SAKARYA UNIVERSITY JOURNAL OF SCIENCE
e-ISSN: 2147-835X Dergi sayfası: http://dergipark.gov.tr/saufenbilder
Geliş/Received
03.05.2017
Kabul/Accepted
14.08.2017
Doi
10.16984/saufenbilder.310267
© 2017 Sakarya Üniversitesi Fen Bilimleri Enstitüsü
http://dergipark.gov.tr/saufenbilder
Performance comparison of different clustering methods for manufacturing cell
formation
Sinem Büyüksaatçı Kiriş*1 , Fatih Tüysüz2
ABSTRACT
This study refers to cell formation, which is the fundamental and important stage of cellular manufacturing
system design. Three widely used methods that are K-means clustering algorithm, average-linkage
clustering algorithm and fuzzy clustering using expectation maximization algorithm for cell formation
problem are studied. A real life application of these methods for the design of cylinder department of a
construction equipment manufacturer is performed. The performance of each applied algorithm is evaluated
according to intracellular voids, intracellular processing intensity and intercellular transportation measures.
The application results indicate that K-means clustering algorithm, which is the most widely applied and
most known one of classical clustering algorithms, is still an effective method for cell formation.
Keywords: Cellular Manufacturing, Cell Formation, K-Means Algorithm, Average Linkage Clustering
Algorithm, Expectation Maximization Algorithm
İmalat hücresi oluşturulması için farklı kümeleme yöntemlerinin performans
karşılaştırması
ÖZ
Bu çalışma, hücresel imalat sistemi tasarımının temel ve önemli aşaması olan hücre oluşturmaya
değinmektedir. Çalışmada hücre oluşturma uygulamalarında yaygın olarak kullanılan üç yöntem; k-
ortalamalar kümeleme algoritması, ortalama bağlantılı kümeleme algoritması ve beklenti maksimizasyonu
algoritmasını kullanan bulanık kümeleme algoritması incelenmektedir. Bir inşaat ekipmanı üreticisinin
silindir bölümünün tasarımı için bu yöntemlerin gerçek hayat uygulaması gerçekleştirilmiştir. Uygulanan
her algoritmanın performansı hücre içi boşluklar, hücre içi işlem yoğunluğu ve hücreler arası taşıma miktarı
ölçütlerine göre değerlendirilmektedir. Uygulama sonuçları, klasik kümeleme algoritmalarından en çok
bilinen ve en yaygın olarak uygulanan k-ortalamalar kümeleme algoritmasının hücre oluşturma için hala
etkili bir yöntem olduğunu göstermektedir.
Anahtar Kelimeler: Hücresel imalat, Hücre oluşturma, K-ortalamalar algoritması, Ortalama bağlantılı
kümeleme algoritması, Beklenti maksimizasyonu algoritması
1 Istanbul University, Industrial Engineering Department, Avcılar/TURKEY, [email protected] 2 Istanbul University, Industrial Engineering Department, Avcılar/TURKEY, [email protected]
1031
Sakarya Üniversitesi Fen Bilimleri Enstitüsü Dergisi, 21 (5), 1031~1044, 2017
1. INTRODUCTION
Global competition, changing market conditions
and variability in customer demands, which are
causing shorter product life cycles, force
manufacturing firms to more focus on flexibility
and productivity to be able sustain in such an
environment. Group Technology (GT) that was
introduced by Mitrofanov [1] is a theory of
management based on the principle that similar
things should be done similarly [2]. Cellular
manufacturing (CM), which is the implementation
of group technology, is an important modern
manufacturing alternative to achieve mid-volume
and high-variety production [3]. CM is a hybrid
system, which takes the advantage of flexibility of
job shops and efficiency of flow shops [3][4].
Design of CM systems is a three-step process that
consists of cell formation, intracellular layout and
cell layout [5]. Cell formation (CF), which can also
be called as part-machine grouping problem, is the
fundamental and crucial step of CM system
design. CF requires forming part families
according to their processing similarities, grouping
machines into manufacturing cells and assigning
part families to cells [6]. The objective of CF is
forming manufacturing cells, which are
independent of other cells. In other words, the
transfer between the cells are tried to be minimized
so that each part family is finished within the cell
it is assigned, which is quite difficult to be
achieved in real life applications.
This study handles CF problem and presents three
methods that are K-means clustering algorithm,
average-linkage clustering algorithm and fuzzy
clustering using expectation maximization
algorithm. These three efficient and easy to use
algorithms are applied for the same problem and
their performances are compared according to
three performance measures, which are
intracellular voids, intracellular processing
intensity and intercellular transportation criteria.
The organization of the paper can be summarized
as follows. CF problems and performance
measures for CF with a brief literature review will
be introduced. Then, the methods used in the study
will be explained and the applications of these
methods together with performance measures will
be given. Finally, results and conclusions will be
presented.
2. CELLULAR MANUFACTURING
SYSTEMS (CMS)
Cellular manufacturing, an application of the
philosophy of "group technology", seeks to
achieve efficiency in production by taking
advantage of similarities between parts. In other
words, the goal of this system is to get more output
with less costs and better quality in shorter time. In
a cellular manufacturing system, the cell is
composed of part families and similar machine
groups [7]. The purpose of cell formation is to
create separated machine groups in which parts are
processed with maximum interactions than the
other cells.
The well-known benefits of the cellular
manufacturing systems are given below [8][9]:
Material handling is reduced: In the CMS,
the part is processed in a cell. Thus, material
handling is reduced due to the simplified
workflow.
Production time is shortened: By using the
advantage of flow type production in the
CMS, the production period of parts can be
reduced.
The setup time is reduced: Since similar parts
are grouped in CMS, similar configurations
are required for these parts, which help to
reduce the setup time. With the development
of flexible manufacturing systems, automatic
tool changers reduce the setting, reduce the
machining time and produce high quality
products at low cost.
Batch size can be minimized: Since the
adjustment period in the CMS is greatly
reduced, making small parties is economical.
The number of parts in the system is reduced:
The number of parts in the system and the
amount of in-process stock will be lower
because the production time is reduced in the
CMS.
The delivery time is determined correctly:
The competence of the cell to produce
predefined quantity of a part ensures that
delivery time is determined more accurately
and reliably.
Machine usage is reduced: The effective
capacity of the machine is increased due to
the reduction of the setup times, which leads
to a lower use.
The return on investment is fast: The costs of
lost production and resettlement of the
machines can be easily recovered from
1032
S.B. Kiriş, F. Tüysüz /Performance comparison of different clustering methods for manufacturing cell formation
Sakarya Üniversitesi Fen Bilimleri Enstitüsü Dergisi, 21 (5), 1031~1044, 2017
inventory, efficient usage of machines, labor
and materials.
It saves labor: Due to the utilization level of
the cell is low; it is possible to assign a
worker to more than one machine to lead
better utilization of the workforce.
Quality procedure works easily: Parts move
from one station to another as single units or
small parts in CMS. Hence parts are fully
processed in a small area, the return of
production is fast and the process can be
stopped to find out what the error is.
Field acquisition: Due to the reduction in the
number of parts in the system, significant
amounts of usable space for adding new
machines and expanding can be gained.
In addition to its many benefits, CMS has also
some weaknesses and objectionable aspects:
Difficulties in identifying family members:
The creation of family members and the
assignment of machines to cells may not
always be easy. Part families determined by
considering their designs may not be suitable
from the point of view of production
operations.
Challenges of balancing workload among
cells: Balancing workflow within a cell is
more difficult than balancing an assembly
line. The parts can follow different orders in
the cell, which requires different machines
and processing times. Wrongly balanced
cells can be very inefficient. It is very
important to balance workload among the
cells in CMS.
Employees need to be trained: The training
of employees for different tasks is costly,
time consuming, and requires collaboration
among employees.
Additional costs incurred by reorganization:
In CMS, multiple small machines are
preferred to single large machines. It may be
necessary to purchase additional cells for the
same type of machines. In addition, the cost
of the idle plant due to the relocation of the
machines can also be high.
2.1. Cell Formation (CF)
The most important problem encountered in the
design of CMS is cell formation. This problem,
also referred as part-machine group analysis,
influences the basic structure of the CMS and the
whole layout.
Cell formation is concerned with determining the
part families and the machine groups on which
these parts are to be produced [10]. The basic
assumption in CF is that the part families can only
be produced in certain machines or machine
groups. For this, the existence of relations between
parts and machines is investigated. This
relationship is called as routing [11]. When the
relationships are determined, the parts are
separated into the part families in which all the
parts in the part family are produced in the same
machine groups. What is required here is that as
much processing as possible is carried out on the
machines in which the parts within the desired
families are assigned and the interaction between
the cells is minimized. Once the part families are
determined, the machines that the part families
will be processed, are also grouped.
The success of the CF problem depends on
considering the constraints that exist in the actual
production environment. The most important
constraints to consider in CF are as follows
[12][13]:
Available capacity of machines must not be
exceeded.
Safety and technological requirements must
be met. The machines that can create
dangerous interaction with each other must
be physically farther away.
Number of machines in a cell and number of
cells must not exceed an upper bound.
Inter-cell and intra-cell cost of handling
material between machines must be
minimized.
Machine utilization rate must be as high as
possible.
Machine purchase and operating costs must
be minimized. In CMS, the machines and
equipment on the hands are placed to the
cells in the most appropriate way. When
necessary, new machinery and equipment are
purchased.
Work-in-process inventory costs must be
minimized.
2.2. Cell Formation Methods
During the decades, many research papers have
been done in literature about CF methods. Some of
them have been introduced the classification of
these methods. King and Nakornchai [14]
examined the methods for grouping parts and
associated machines in four subdivisions:
1033
S.B. Kiriş, F. Tüysüz /Performance comparison of different clustering methods for manufacturing cell formation
Sakarya Üniversitesi Fen Bilimleri Enstitüsü Dergisi, 21 (5), 1031~1044, 2017
similarity coefficient methods, set theoretic
methods, evaluative methods and other analytical
methods.
Wemmerlöv and Hyer [11] divided the CF
methods into two major groups based on the main
data as either part attributes or machine routings.
The latter branch for machine routings is further
classified into three divisions, i.e. approaches that
identify firstly the machine groups, approaches
that identify firstly the part families, and the
approaches that identify part families and machine
groups simultaneously.
Selim et al. [10] categorized these approaches into
five subsections that are descriptive procedures,
cluster analysis, graph partitioning, artificial
intelligence and mathematical programming.
Adenso-Dıaz et al. [15] classified the approaches
as hierarchical, simultaneous and iterative. They
also considered the use of information about the
sequence of operations or not in their
classification. Another issue they marked for their
classification is use of a machine-process plans
binary incidence matrix or a machine-operation
processing time matrix.
Papaioannou and Wilson [6] presented a detailed
review about the evaluation of cell formation
problem methodologies. They firstly categorized
the approaches under three main headings:
informal methods, part coding analysis methods
and production-based methods. Then the
production-based methods are classified as cluster
analysis, graph-partitioning approaches,
mathematical programming methods, heuristic
and metaheuristic algorithms and artificial
intelligence methodologies.
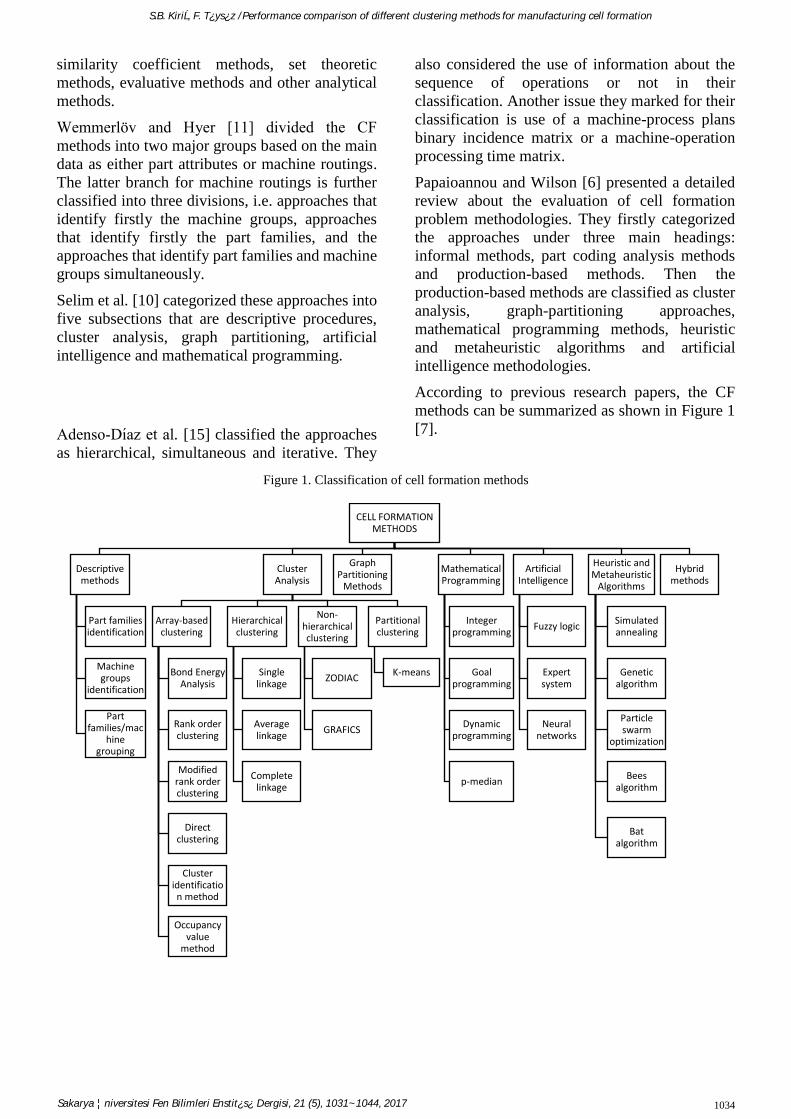
According to previous research papers, the CF
methods can be summarized as shown in Figure 1
[7].
Figure 1. Classification of cell formation methods
CELL FORMATION METHODS
Descriptive methods
Part families identification
Machine groups
identification
Part families/mac
hine grouping
Cluster Analysis
Array-based clustering
Bond Energy Analysis
Rank order clustering
Modified rank order clustering
Direct clustering
Cluster identification method
Occupancy value
method
Hierarchical clustering
Single linkage
Average linkage
Complete linkage
Non-hierarchical clustering
ZODIAC
GRAFICS
Partitional clustering
K-means
Graph Partitioning
Methods
Mathematical Programming
Integer programming
Goal programming
Dynamic programming
p-median
Artificial Intelligence
Fuzzy logic
Expert system
Neural networks
Heuristic and Metaheuristic
Algorithms
Simulated annealing
Genetic algorithm
Particle swarm
optimization
Bees algorithm
Bat algorithm
Hybrid methods
1034
S.B. Kiriş, F. Tüysüz /Performance comparison of different clustering methods for manufacturing cell formation
Sakarya Üniversitesi Fen Bilimleri Enstitüsü Dergisi, 21 (5), 1031~1044, 2017
2.3. Performance Measures
In literature, there have been a variety approaches
that used the performance measures for
appropriate machine/part clustering. Mosier [16]
focused on four performance measures in their
study, which are simple matching measure,
generalized matching measure, product moment
correlation coefficient measure and intercellular
transportation measure.
Shafer and Meredith [17] compared the numerous
cell formation techniques by using three
companies’ data with regard to average flow time,
maximum flow time, average distance travelled,
number of extra-cellular operations, average work-
in-process (WIP) parts, maximum WIP and
longest average queue.
Chu and Tsai [18] compared the rank order
clustering algorithm, the direct clustering
algorithm and the bond energy algorithm using the
four performance measures: 1) total bond energy,
2) percentage of exceptional elements, 3) machine
utilization and 4) grouping efficiency.
Morris and Tersine [19] presented a simulation
model for layout choice, which examines the
impact of changes in setup time, transfer time,
material handling speed and flow within cell. They
used mean throughput time and mean level of
work-in-process (WIP) inventory as performance
measures for their observations.
Miltenburg and Zhang [20] presented a
comprehensive comparison of nine clustering
methods. The final solutions were evaluated by
using three independent measures that are
grouping measure, clustering measure and bond
energy measure.
Burgess et al. [21] compared the traditional job
shop environment with the cellular manufacturing
unit by different simulation combinations. They
computed the ratio of actual flow time to optimum
flow time and the ratio of machine delay time to
optimum flow time for performance evaluation.
Rogers and Shafer [22] gave a detailed review and
critique for the performance measures that were
used in literature for comparing cell formation
procedures. They categorized the performance
measures into four subgroups: part volumes and
sequencing not considered, part volumes
considered, part sequencing considered and both
part volumes and sequencing considered.
Sarker [23] provided information for different
measures such as grouping efficiency, grouping
efficacy, weighted grouping efficacy, grouping
index, grouping capability index, and grouping
measure. Sarker (2001) also introduced a new
performance measure that is called doubly
weighted grouping efficiency measure. This new
measure showed better performance than some of
the existing measures in order to capture both
inter-cell and intra-cell movements in cellular
manufacturing system.
Keeling et al. [24] examined optimal machine and
part grouping for several problems from the
literature using grouping genetic algorithm.
Through their application, they investigated the
impact of four efficiency measure that are
grouping efficacy, grouping index, grouping
capability index, doubly weighted grouping
efficiency on various factory measures, such as
flow time, wait time, throughput, machine
utilization etc.
3. MATERIALS AND METHODS
In this study, the design of the cylinder department
is dealt with in a new facility of a company that
manufactures construction equipment that is taken
from [25]. It is desired to see which of the different
cell formation methods will be more suitable for
the cylinder department. For this purpose, k-means
clustering algorithm, average linkage clustering
method and fuzzy clustering method with
expectation maximization algorithm are applied to
machine-part matrix of this department to obtain
first clusters. Subsequently, clusters were tried to
reach more understandable and stable machine-
parts clusters by applying rank order clustering
method. During the execution of the algorithms,
attention has been paid to the formation of three
cells and the prioritization of machine groups. The
performance of the results was then assessed
according to the intracellular voids, intracellular
processing intensity and intercellular
transportation criteria.
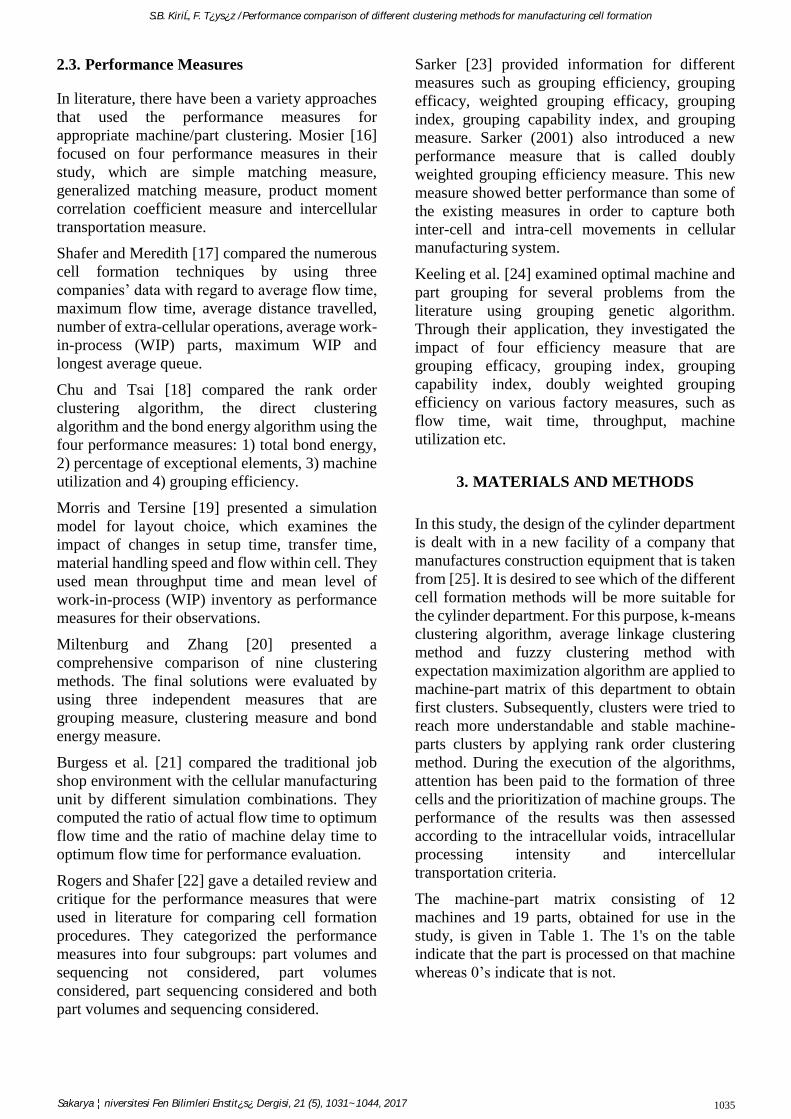
The machine-part matrix consisting of 12
machines and 19 parts, obtained for use in the
study, is given in Table 1. The 1's on the table
indicate that the part is processed on that machine
whereas 0’s indicate that is not.
1035
S.B. Kiriş, F. Tüysüz /Performance comparison of different clustering methods for manufacturing cell formation
Sakarya Üniversitesi Fen Bilimleri Enstitüsü Dergisi, 21 (5), 1031~1044, 2017
Table 1. Machine-parts matrix for cylinder department
P1 P2 P3 P4 P5 P6 P7 P8 P9 P10 P11 P12 P13 P14 P15 P16 P17 P18 P19
M1 1 0 0 0 1 0 0 1 0 0 1 0 0 1 0 0 1 0 0
M2 0 1 0 0 0 1 0 0 1 0 0 1 0 0 1 0 0 1 0
M3 0 1 0 0 0 1 0 0 1 0 0 1 0 0 1 0 0 1 0
M4 1 1 0 0 0 1 0 1 0 0 0 1 0 1 0 0 0 0 0
M5 0 0 0 0 1 0 0 0 1 0 1 0 0 0 1 0 1 1 0
M6 1 0 0 0 1 0 0 1 0 0 1 0 0 1 0 0 1 0 0
M7 0 1 0 0 0 1 0 0 1 0 0 1 0 0 1 0 0 1 0
M8 0 1 0 0 0 1 0 0 1 0 0 1 0 0 1 0 0 1 0
M9 0 1 0 0 0 1 0 0 1 0 0 1 0 0 1 0 0 1 0
M10 0 1 1 1 0 1 1 0 1 1 0 1 1 0 1 1 0 1 1
M11 1 0 1 1 1 0 1 1 0 1 1 0 1 1 0 1 1 0 1
M12 0 1 0 0 0 1 0 0 1 0 0 1 0 0 1 0 0 1 0
Details of the methods used in this study are given
below.
3.1. K-Means Clustering Algorithm
K-Means clustering algorithm, which is the most
commonly used and known one of classical
clustering algorithms, was developed by J.
MacQueen [26]. The general logic of the algorithm
is to divide a data set consisting of n data objects
into K sets that is given as an input parameter. The
goal is to maximize the intra-cluster similarities of
the clusters obtained at the end of the partitioning
process while minimizing the inter-cluster
similarities. Cluster similarity is measured by the
mean value of the distances between the center of
gravity of the cluster and other objects in the
cluster. The cluster similarity is defined as Eq. 1
[27].
𝐽(𝑐𝑘) = ∑ ‖𝑥𝑖 − 𝜇𝑘‖2
𝑥𝑖∈𝑐𝑘
(1)
where 𝜇𝑘 is the center of gravity of the kth cluster,
𝑥𝑖 is the data object (𝑖 = 1,2, … 𝑛). The objective
function of the K-Means clustering algorithm is as
follows:
𝐽(𝐶) = ∑ ∑ ‖𝑥𝑖 − 𝜇𝑘‖2
𝑥𝑖∈𝑐𝑘
𝐾
𝑘=1
(2)
The higher the value of the objective function
indicates that the objects in the cluster are far from
the cluster center. Likewise the lower value is the
indicator that the objects are closer to the cluster
center.
The steps of the K-Means clustering algorithm are
given below:
Step 1: Initial cluster centers are chosen randomly
or by various methods according to the given
cluster number of K.
Step 2: Calculate the distance of each object to
cluster centers and assign it to that cluster where it
is closer.
Step 3: After all objects have been assigned,
recalculate the new cluster centers in the direction
of the objects included in that cluster.
Step 4: Repeat steps 2 and 3 until the cluster
assignments of objects have not changed.
3.2. Average-Linkage Clustering Algorithm
Average Linkage Clustering (ALC) algorithm is
one of the algorithms based on similarity
coefficient. The selected similarity coefficient and
the methodology used in the clustering process
play an important role for accuracy of the final
clusters. In this study the "Jaccard Similarity
Coefficient" is used in ALC algorithm.
Calculation of the Jaccard similarity coefficient is
given in Eq. 3 [28].
𝑆𝑖𝑗 =𝑐
(𝑎 + 𝑏 − 𝑐) 0 ≤ 𝑆𝑖𝑗 ≤ 1 (3)
where 𝑆𝑖𝑗 is the Jaccard Similarity Coefficient
between machine 𝑖 and machine 𝑗, 𝑐 is the number
of parts processed both machine 𝑖 and machine 𝑗,
𝑎 and 𝑏 are the number of parts processed machine
𝑖 and machine 𝑗, respectively.
The steps of the ALC algorithm are as follows
[9][29]:
Step 1: Calculate the similarity coefficients for all
machine pairs and then create the similarity
matrix.
Step 2: Group the two objects (two machines, a
machine and a machine group or two machine
1036
S.B. Kiriş, F. Tüysüz /Performance comparison of different clustering methods for manufacturing cell formation
Sakarya Üniversitesi Fen Bilimleri Enstitüsü Dergisi, 21 (5), 1031~1044, 2017
group) with the highest similarity coefficient.
Step 3: Update the similarity coefficient matrix
according to Eq. 4.
𝑆𝑡𝑣 =∑ ∑ 𝑆𝑖𝑗𝑗∈𝑣𝑖∈𝑡
𝑁𝑡 × 𝑁𝑣
(4)
where 𝑁𝑡 is the number of machines in group 𝑡,
and 𝑁𝑣 is the number of machines in group 𝑣.
Step 4: Go to step 5 if all the machines are grouped
into a single machine group or predetermined
number of machine groups has been obtained.
Otherwise go back to step 2.
Step 5: Assign each part to the cell.
3.3. Fuzzy Clustering Using Expectation
Maximization Algorithm
Expectation maximization (EM) algorithm, which
works with the maximization principle of
similarity, was first introduced by Dempster et al.
[30]. The algorithm shows the probability that an
object belongs to one of the existing clusters using
probabilistic criteria rather than using definite
distance criteria. At each iteration the EM
algorithm first finds an optimal lower bound and
then maximizes this bound to obtain an improved
estimate. Hence the algorithm includes two steps
that are called E-step (expectation-step) and M-
step (maximization-step) respectively [31].
In the context of fuzzy clustering, an EM algorithm
starts with an initial set of parameters and iterates
until the cluster centers converge or the change is
sufficiently small. Each iteration also consists of
two steps [32].
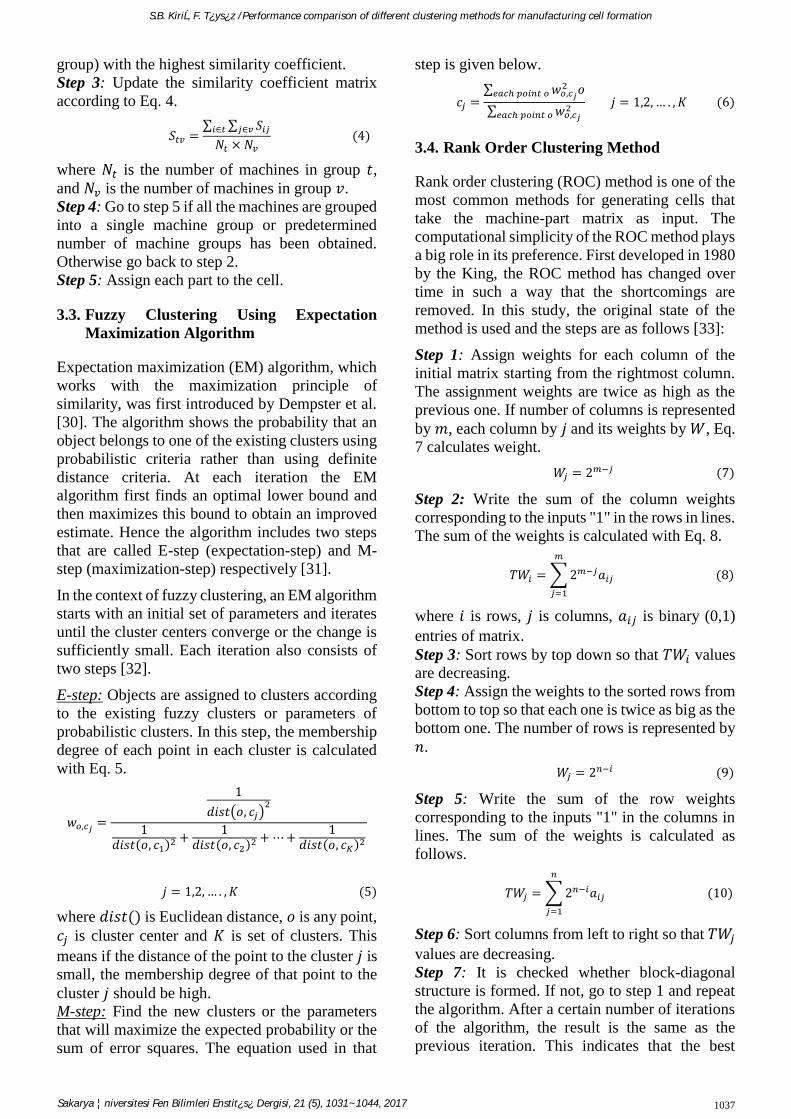
E-step: Objects are assigned to clusters according
to the existing fuzzy clusters or parameters of
probabilistic clusters. In this step, the membership
degree of each point in each cluster is calculated
with Eq. 5.
𝑤𝑜,𝑐𝑗=
1
𝑑𝑖𝑠𝑡(𝑜, 𝑐𝑗)2
1𝑑𝑖𝑠𝑡(𝑜, 𝑐1)2 +
1𝑑𝑖𝑠𝑡(𝑜, 𝑐2)2 + ⋯ +
1𝑑𝑖𝑠𝑡(𝑜, 𝑐𝐾)2
𝑗 = 1,2, … . , 𝐾 (5)
where 𝑑𝑖𝑠𝑡() is Euclidean distance, 𝑜 is any point,
𝑐𝑗 is cluster center and 𝐾 is set of clusters. This
means if the distance of the point to the cluster 𝑗 is
small, the membership degree of that point to the
cluster 𝑗 should be high.
M-step: Find the new clusters or the parameters
that will maximize the expected probability or the
sum of error squares. The equation used in that
step is given below.
𝑐𝑗 =∑ 𝑤𝑜,𝑐𝑗
2 𝑜𝑒𝑎𝑐ℎ 𝑝𝑜𝑖𝑛𝑡 𝑜
∑ 𝑤𝑜,𝑐𝑗2
𝑒𝑎𝑐ℎ 𝑝𝑜𝑖𝑛𝑡 𝑜
𝑗 = 1,2, … . , 𝐾 (6)
3.4. Rank Order Clustering Method
Rank order clustering (ROC) method is one of the
most common methods for generating cells that
take the machine-part matrix as input. The
computational simplicity of the ROC method plays
a big role in its preference. First developed in 1980
by the King, the ROC method has changed over
time in such a way that the shortcomings are
removed. In this study, the original state of the
method is used and the steps are as follows [33]:
Step 1: Assign weights for each column of the
initial matrix starting from the rightmost column.
The assignment weights are twice as high as the
previous one. If number of columns is represented
by 𝑚, each column by 𝑗 and its weights by 𝑊, Eq.
7 calculates weight.
𝑊𝑗 = 2𝑚−𝑗 (7)
Step 2: Write the sum of the column weights
corresponding to the inputs "1" in the rows in lines.
The sum of the weights is calculated with Eq. 8.
𝑇𝑊𝑖 = ∑ 2𝑚−𝑗𝑎𝑖𝑗
𝑚
𝑗=1
(8)
where 𝑖 is rows, 𝑗 is columns, 𝑎𝑖𝑗 is binary (0,1)
entries of matrix.
Step 3: Sort rows by top down so that 𝑇𝑊𝑖 values
are decreasing.
Step 4: Assign the weights to the sorted rows from
bottom to top so that each one is twice as big as the
bottom one. The number of rows is represented by
𝑛.
𝑊𝑗 = 2𝑛−𝑖 (9)
Step 5: Write the sum of the row weights
corresponding to the inputs "1" in the columns in
lines. The sum of the weights is calculated as
follows.
𝑇𝑊𝑗 = ∑ 2𝑛−𝑖𝑎𝑖𝑗
𝑛
𝑗=1
(10)
Step 6: Sort columns from left to right so that 𝑇𝑊𝑗
values are decreasing.
Step 7: It is checked whether block-diagonal
structure is formed. If not, go to step 1 and repeat
the algorithm. After a certain number of iterations
of the algorithm, the result is the same as the
previous iteration. This indicates that the best
1037
S.B. Kiriş, F. Tüysüz /Performance comparison of different clustering methods for manufacturing cell formation
Sakarya Üniversitesi Fen Bilimleri Enstitüsü Dergisi, 21 (5), 1031~1044, 2017
solution is achieved according to the ROC
algorithm and stop.
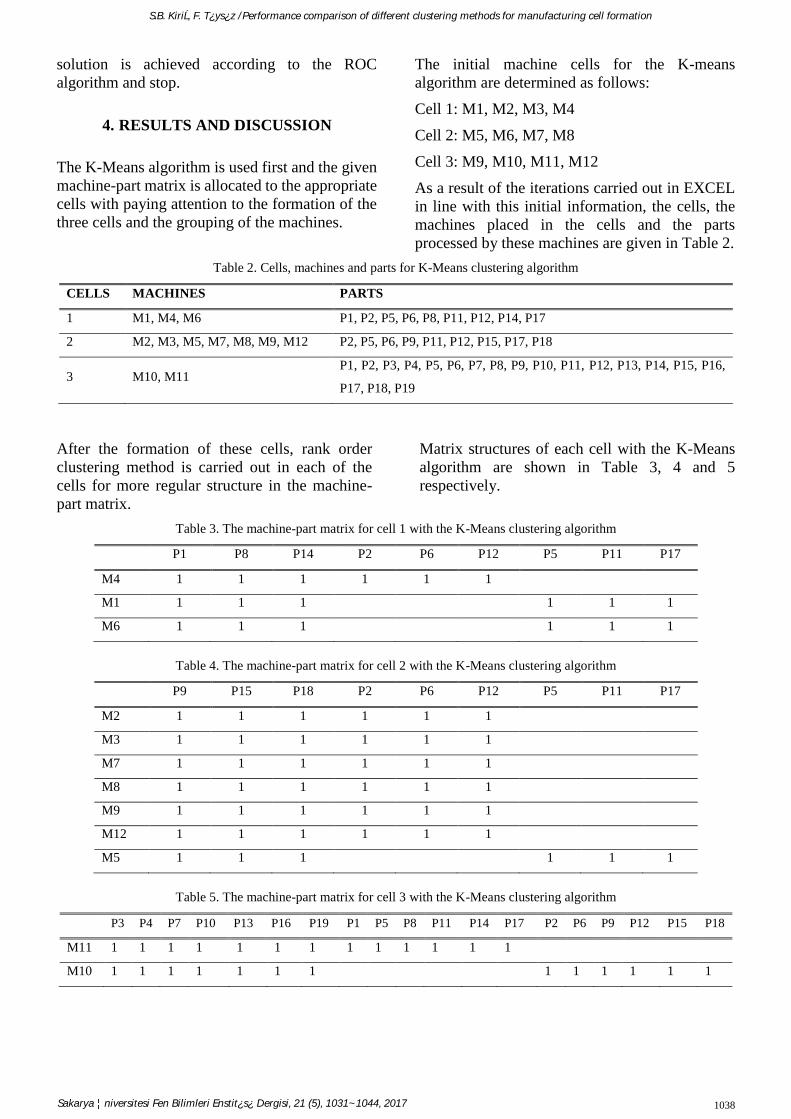
4. RESULTS AND DISCUSSION
The K-Means algorithm is used first and the given
machine-part matrix is allocated to the appropriate
cells with paying attention to the formation of the
three cells and the grouping of the machines.
The initial machine cells for the K-means
algorithm are determined as follows:
Cell 1: M1, M2, M3, M4
Cell 2: M5, M6, M7, M8
Cell 3: M9, M10, M11, M12
As a result of the iterations carried out in EXCEL
in line with this initial information, the cells, the
machines placed in the cells and the parts
processed by these machines are given in Table 2.
Table 2. Cells, machines and parts for K-Means clustering algorithm
CELLS MACHINES PARTS
1 M1, M4, M6 P1, P2, P5, P6, P8, P11, P12, P14, P17
2 M2, M3, M5, M7, M8, M9, M12 P2, P5, P6, P9, P11, P12, P15, P17, P18
3 M10, M11 P1, P2, P3, P4, P5, P6, P7, P8, P9, P10, P11, P12, P13, P14, P15, P16,
P17, P18, P19
After the formation of these cells, rank order
clustering method is carried out in each of the
cells for more regular structure in the machine-
part matrix.
Matrix structures of each cell with the K-Means
algorithm are shown in Table 3, 4 and 5
respectively.
Table 3. The machine-part matrix for cell 1 with the K-Means clustering algorithm
P1 P8 P14 P2 P6 P12 P5 P11 P17
M4 1 1 1 1 1 1
M1 1 1 1 1 1 1
M6 1 1 1 1 1 1
Table 4. The machine-part matrix for cell 2 with the K-Means clustering algorithm
P9 P15 P18 P2 P6 P12 P5 P11 P17
M2 1 1 1 1 1 1
M3 1 1 1 1 1 1
M7 1 1 1 1 1 1
M8 1 1 1 1 1 1
M9 1 1 1 1 1 1
M12 1 1 1 1 1 1
M5 1 1 1 1 1 1
Table 5. The machine-part matrix for cell 3 with the K-Means clustering algorithm
P3 P4 P7 P10 P13 P16 P19 P1 P5 P8 P11 P14 P17 P2 P6 P9 P12 P15 P18
M11 1 1 1 1 1 1 1 1 1 1 1 1 1
M10 1 1 1 1 1 1 1 1 1 1 1 1 1
1038
S.B. Kiriş, F. Tüysüz /Performance comparison of different clustering methods for manufacturing cell formation
Sakarya Üniversitesi Fen Bilimleri Enstitüsü Dergisi, 21 (5), 1031~1044, 2017
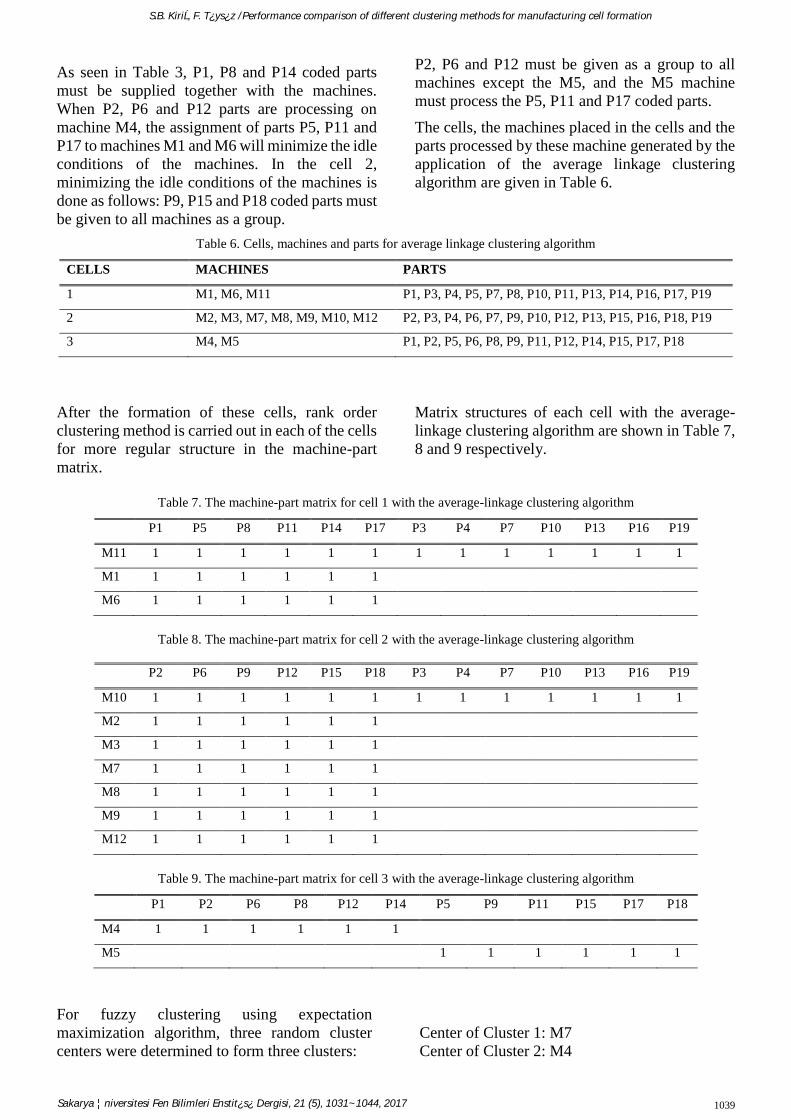
As seen in Table 3, P1, P8 and P14 coded parts
must be supplied together with the machines.
When P2, P6 and P12 parts are processing on
machine M4, the assignment of parts P5, P11 and
P17 to machines M1 and M6 will minimize the idle
conditions of the machines. In the cell 2,
minimizing the idle conditions of the machines is
done as follows: P9, P15 and P18 coded parts must
be given to all machines as a group.
P2, P6 and P12 must be given as a group to all
machines except the M5, and the M5 machine
must process the P5, P11 and P17 coded parts.
The cells, the machines placed in the cells and the
parts processed by these machine generated by the
application of the average linkage clustering
algorithm are given in Table 6.
Table 6. Cells, machines and parts for average linkage clustering algorithm
CELLS MACHINES PARTS
1 M1, M6, M11 P1, P3, P4, P5, P7, P8, P10, P11, P13, P14, P16, P17, P19
2 M2, M3, M7, M8, M9, M10, M12 P2, P3, P4, P6, P7, P9, P10, P12, P13, P15, P16, P18, P19
3 M4, M5 P1, P2, P5, P6, P8, P9, P11, P12, P14, P15, P17, P18
After the formation of these cells, rank order
clustering method is carried out in each of the cells
for more regular structure in the machine-part
matrix.
Matrix structures of each cell with the average-
linkage clustering algorithm are shown in Table 7,
8 and 9 respectively.
Table 7. The machine-part matrix for cell 1 with the average-linkage clustering algorithm
P1 P5 P8 P11 P14 P17 P3 P4 P7 P10 P13 P16 P19
M11 1 1 1 1 1 1 1 1 1 1 1 1 1
M1 1 1 1 1 1 1
M6 1 1 1 1 1 1
Table 8. The machine-part matrix for cell 2 with the average-linkage clustering algorithm
P2 P6 P9 P12 P15 P18 P3 P4 P7 P10 P13 P16 P19
M10 1 1 1 1 1 1 1 1 1 1 1 1 1
M2 1 1 1 1 1 1
M3 1 1 1 1 1 1
M7 1 1 1 1 1 1
M8 1 1 1 1 1 1
M9 1 1 1 1 1 1
M12 1 1 1 1 1 1
Table 9. The machine-part matrix for cell 3 with the average-linkage clustering algorithm
P1 P2 P6 P8 P12 P14 P5 P9 P11 P15 P17 P18
M4 1 1 1 1 1 1
M5 1 1 1 1 1 1
For fuzzy clustering using expectation
maximization algorithm, three random cluster
centers were determined to form three clusters:
Center of Cluster 1: M7
Center of Cluster 2: M4
1039
S.B. Kiriş, F. Tüysüz /Performance comparison of different clustering methods for manufacturing cell formation
Sakarya Üniversitesi Fen Bilimleri Enstitüsü Dergisi, 21 (5), 1031~1044, 2017
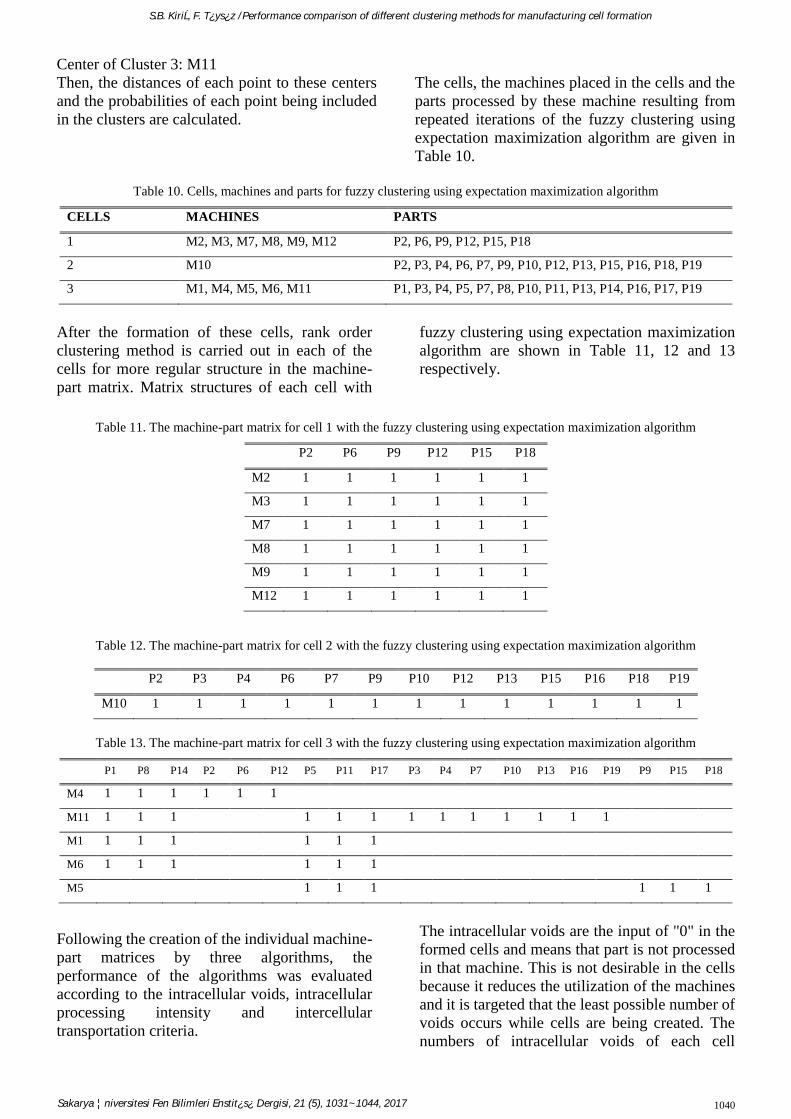
Center of Cluster 3: M11
Then, the distances of each point to these centers
and the probabilities of each point being included
in the clusters are calculated.
The cells, the machines placed in the cells and the
parts processed by these machine resulting from
repeated iterations of the fuzzy clustering using
expectation maximization algorithm are given in
Table 10.
Table 10. Cells, machines and parts for fuzzy clustering using expectation maximization algorithm
CELLS MACHINES PARTS
1 M2, M3, M7, M8, M9, M12 P2, P6, P9, P12, P15, P18
2 M10 P2, P3, P4, P6, P7, P9, P10, P12, P13, P15, P16, P18, P19
3 M1, M4, M5, M6, M11 P1, P3, P4, P5, P7, P8, P10, P11, P13, P14, P16, P17, P19
After the formation of these cells, rank order
clustering method is carried out in each of the
cells for more regular structure in the machine-
part matrix. Matrix structures of each cell with
fuzzy clustering using expectation maximization
algorithm are shown in Table 11, 12 and 13
respectively.
Table 11. The machine-part matrix for cell 1 with the fuzzy clustering using expectation maximization algorithm
P2 P6 P9 P12 P15 P18
M2 1 1 1 1 1 1
M3 1 1 1 1 1 1
M7 1 1 1 1 1 1
M8 1 1 1 1 1 1
M9 1 1 1 1 1 1
M12 1 1 1 1 1 1
Table 12. The machine-part matrix for cell 2 with the fuzzy clustering using expectation maximization algorithm
P2 P3 P4 P6 P7 P9 P10 P12 P13 P15 P16 P18 P19
M10 1 1 1 1 1 1 1 1 1 1 1 1 1
Table 13. The machine-part matrix for cell 3 with the fuzzy clustering using expectation maximization algorithm
P1 P8 P14 P2 P6 P12 P5 P11 P17 P3 P4 P7 P10 P13 P16 P19 P9 P15 P18
M4 1 1 1 1 1 1
M11 1 1 1 1 1 1 1 1 1 1 1 1 1
M1 1 1 1 1 1 1
M6 1 1 1 1 1 1
M5 1 1 1 1 1 1
Following the creation of the individual machine-
part matrices by three algorithms, the
performance of the algorithms was evaluated
according to the intracellular voids, intracellular
processing intensity and intercellular
transportation criteria.
The intracellular voids are the input of "0" in the
formed cells and means that part is not processed
in that machine. This is not desirable in the cells
because it reduces the utilization of the machines
and it is targeted that the least possible number of
voids occurs while cells are being created. The
numbers of intracellular voids of each cell
1040
S.B. Kiriş, F. Tüysüz /Performance comparison of different clustering methods for manufacturing cell formation
Sakarya Üniversitesi Fen Bilimleri Enstitüsü Dergisi, 21 (5), 1031~1044, 2017
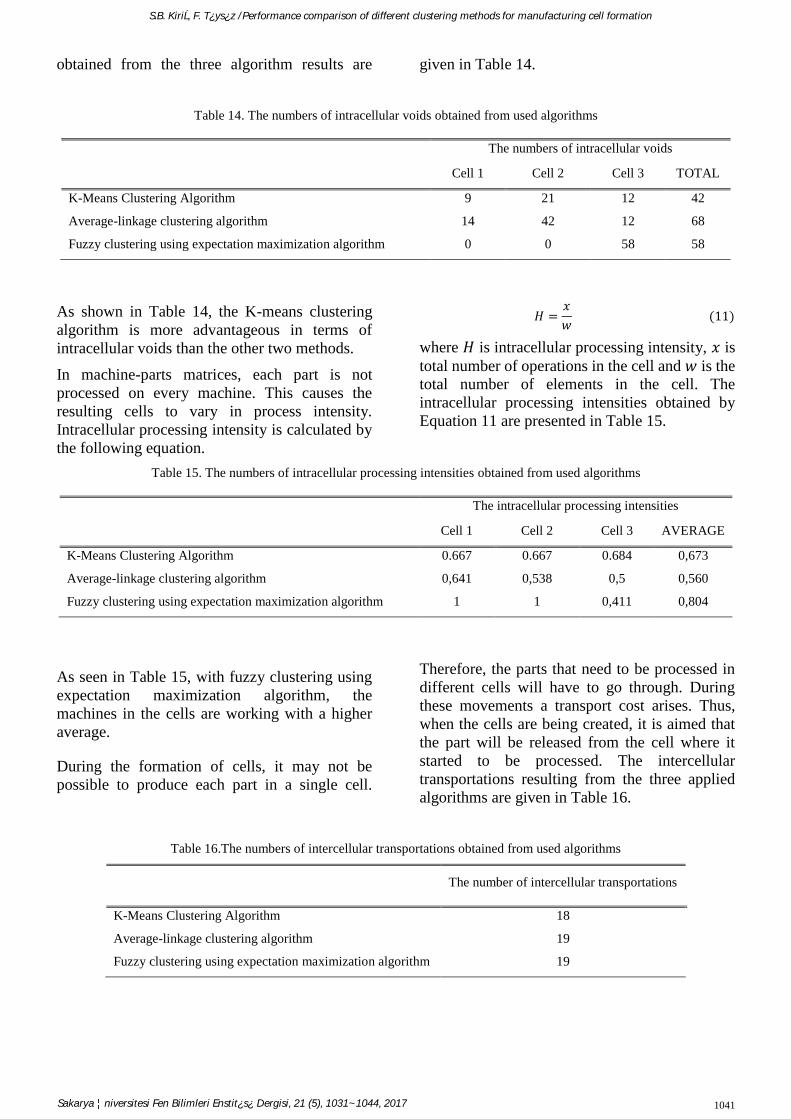
obtained from the three algorithm results are given in Table 14.
Table 14. The numbers of intracellular voids obtained from used algorithms
The numbers of intracellular voids
Cell 1 Cell 2 Cell 3 TOTAL
K-Means Clustering Algorithm
Average-linkage clustering algorithm
Fuzzy clustering using expectation maximization algorithm
9
14
0
21
42
0
12
12
58
42
68
58
As shown in Table 14, the K-means clustering
algorithm is more advantageous in terms of
intracellular voids than the other two methods.
In machine-parts matrices, each part is not
processed on every machine. This causes the
resulting cells to vary in process intensity.
Intracellular processing intensity is calculated by
the following equation.
𝐻 =𝑥
𝑤 (11)
where 𝐻 is intracellular processing intensity, 𝑥 is
total number of operations in the cell and 𝑤 is the
total number of elements in the cell. The
intracellular processing intensities obtained by
Equation 11 are presented in Table 15.
Table 15. The numbers of intracellular processing intensities obtained from used algorithms
The intracellular processing intensities
Cell 1 Cell 2 Cell 3 AVERAGE
K-Means Clustering Algorithm
Average-linkage clustering algorithm
Fuzzy clustering using expectation maximization algorithm
0.667
0,641
1
0.667
0,538
1
0.684
0,5
0,411
0,673
0,560
0,804
As seen in Table 15, with fuzzy clustering using
expectation maximization algorithm, the
machines in the cells are working with a higher
average.
During the formation of cells, it may not be
possible to produce each part in a single cell.
Therefore, the parts that need to be processed in
different cells will have to go through. During
these movements a transport cost arises. Thus,
when the cells are being created, it is aimed that
the part will be released from the cell where it
started to be processed. The intercellular
transportations resulting from the three applied
algorithms are given in Table 16.
Table 16.The numbers of intercellular transportations obtained from used algorithms
The number of intercellular transportations
K-Means Clustering Algorithm
Average-linkage clustering algorithm
Fuzzy clustering using expectation maximization algorithm
18
19
19
1041
S.B. Kiriş, F. Tüysüz /Performance comparison of different clustering methods for manufacturing cell formation
Sakarya Üniversitesi Fen Bilimleri Enstitüsü Dergisi, 21 (5), 1031~1044, 2017
5. CONCLUSION
In this study, CF that is the fundamental and
important step in the design of CM system is
investigated. Three methods, which are K-means
clustering algorithm, average-linkage clustering
algorithm and fuzzy clustering using expectation
maximization algorithm for CF problem are
studied. A real life application of these methods for
the design of cylinder department of a construction
equipment manufacturer is performed. The
performance of each applied algorithm is
evaluated according to 3 performance measures
that are intracellular voids, intracellular processing
intensity and intercellular transportation criteria.
According to the results, average-linkage
clustering algorithm gives the least performance
with respect to the three performance measures. K-
means clustering algorithm performs best with
respect to intracellular voids and intercellular
transportation criteria in terms of average. Fuzzy
clustering using expectation maximization
algorithm is the best with respect to intracellular
processing intensity measure in terms of average.
Although K-means algorithm is behind fuzzy
clustering using expectation maximization
algorithm according to intracellular processing
intensity measure, as it can be seen in Table 15, it
gives a more balanced cell formation. It can be
concluded that K-means clustering algorithm
which is the most widely applied and known one
of classical clustering algorithms is still an
effective method for CF. Since there have been
developed many methods and techniques in
literature for CF problem, for further research, the
comparison of these methods with respect to
developed performance measures can be a
promising area for both better understanding the
strengths and weaknesses of these methods and for
developing a common approach to CF problem.
REFERENCES
[1] S. P. Mitrofanov, The scientific principles of
group technology. Boston Spa, Yorks, UK:
National Lending Library Translation, 1966.
[2] R. G. Askin and C. R. Standridge, C. R.,
Modeling and analysis of manufacturing
systems. John Wiley & Sons Inc, 1993.
[3] B. Bootaki, I. Mahdavi and M. M. Paydar,
“New criteria for configuration of cellular
manufacturing considering product mix
variation,” Computers & Industrial
Engineering, vol. 98, pp. 413-426, August
2016.
[4] M. Mohammadi and K. Forghani, “A hybrid
method based on genetic algorithm and
dynamic programming for solving a bi-
objective cell formation problem
considering alternative process routings and
machine duplication,” Applied Soft
Computing, vol. 53, pp. 97-110, April 2017.
[5] I. Mahdavi, E. Teymourian, N. T. Baher and
V. Kayvanfar, “An integrated model for
solving cell formation and cell layout
problem simultaneously considering new
situations,” Journal of Manufacturing
Systems, vol. 32, no. 4, pp. 655-663, October
2013.
[6] G. Papaioannou, J. M. Wilson, “The
evolution of cell formation problem
methodologies based on recent studies
(1997–2008): Review and directions for
future research,” European journal of
operational research, vol. 206, no. 3, pp.
509-521, November 2010.
[7] V. Modrák, P. Semančo, “Developments in
Modern Operations Management and
Cellular Manufacturing,” in Operations
Management Research and Cellular
Manufacturing Systems: Innovative
Methods and Approaches: Innovative
Methods and Approaches, V. Modrák, Ed.,
IGI Global, 2011.
[8] A. I. Shahrukh, Handbook of cellular
manufacturing systems. New York, John
Wiley & Sons, 1999.
[9] N. Singh and D. Rajamani, D., Cellular
manufacturing systems: design, planning
and control. Springer Science & Business
Media, 2012.
[10] H. M. Selim, R. G. Askin and A. J. Vakharia,
“Cell formation in group technology:
review, evaluation and directions for future
research,” Computers & Industrial
Engineering, vol. 34, no. 1, pp. 3-20,
January 1998.
[11] U. Wemmerlöv and N. L. Hyer, “Procedures
for the part family/machine group
identification problem in cellular
manufacturing,” Journal of Operations
1042
S.B. Kiriş, F. Tüysüz /Performance comparison of different clustering methods for manufacturing cell formation
Sakarya Üniversitesi Fen Bilimleri Enstitüsü Dergisi, 21 (5), 1031~1044, 2017
Management, vol. 6, no. 2, pp. 125-147,
February 1986.
[12] S. S. Heragu, “Group technology and
cellular manufacturing,” IEEE Transactions
on Systems, Man, and Cybernetics, vol. 24,
no. 2, pp. 203-215, February 1994.
[13] S. S. Heragu and Y. P. Gupta, “A heuristic
for designing cellular manufacturing
facilities,” The International Journal of
Production Research, vol. 32, no. 1, pp. 125-
140, 1994.
[14] J. R. King and V. Nakornchai, “Machine-
component group formation in group
technology: review and extension,” The
International Journal of Production
Research, vol. 20, no. 2, pp. 117-133, 1982.
[15] B. Adenso-Dıaz, S. Lozano, J. Racero and F.
Guerrero, “Machine cell formation in
generalized group technology,” Computers
& Industrial Engineering, vol. 41, no. 2, pp.
227-240, November 2001.
[16] C. T. Mosier, “An experiment investigating
the application of clustering procedures and
similarity coefficients to the GT machine
cell formation problem,” The International
Journal Of Production Research, vol. 27,
no. 10, pp.1811-1835, 1989.
[17] S. M. Shafer and J. R. Meredith, “A
comparison of selected manufacturing cell
formation techniques,” The International
Journal of Production Research, vol. 28, no.
4, pp.661-673, 1990.
[18] C. H. Chu and M. Tsai, “A comparison of
three array-based clustering techniques for
manufacturing cell formation,” The
International Journal of Production
Research, vol. 28, no. 8, pp.1417-1433,
1990.
[19] J. S. Morris and R. J. Tersine, “A simulation
analysis of factors influencing the
attractiveness of group technology cellular
layouts,” Management Science, vol. 36, no.
12, pp. 1567-1578, 1990.
[20] J. Miltenburg and W. Zhang, “A
comparative evaluation of nine well-known
algorithms for solving the cell formation
problem in group technology,” Journal of
operations management, vol. 10, no. 1, pp.
44-72, 1991.
[21] A. G. Burgess, I. Morgan and T. E.
Vollmann, “Cellular manufacturing: its
impact on the total factory,” The
International Journal of Production
Research, vol. 31, no. 9, pp. 2059-2077,
1993.
[22] D. F. Rogers and S. M. Shafer, “Measuring
cellular manufacturing performance,” in
Planning, Design and Analysis of Cellular
Manufacturing Systems, A.K. Kamrani,
H.R. Parsaei and D.H. Liles Ed., Elsevier
Science, B.V., pp.147-165, 1995.
[23] B. R. Sarker, “Measures of grouping
efficiency in cellular manufacturing
systems,” European Journal of Operational
Research, vol. 130, no. 3, pp. 588-611, May
2001.
[24] K. B. Keeling, E. C. Brown and T. L. James,
“Grouping efficiency measures and their
impact on factory measures for the machine-
part cell formation problem: A simulation
study,” Engineering Applications of
Artificial Intelligence, vol. 20, no. 1, pp. 63-
78, February 2007.
[25] H. C. Babacan, “Çok Amaçlı Hücresel
Imalat Tasarımı ve Hidromek Silindir
Üretim Tesisinde Bir Uygulama,” Graduate
Thesis, Gazi University, Ankara, Turkey,
2008.
[26] J. MacQueen, “Some methods for
classification and analysis of multivariate
observations,” In Proceedings of the fifth
Berkeley symposium on mathematical
statistics and probability, vol. 1, no. 14, pp.
281-297, 1967.
[27] A. K. Jain, “Data clustering: 50 years
beyond K-means,” Pattern recognition
letters, vol. 31, no. 8, pp. 651-666, 2010.
[28] R. Real and J. M. Vargas, “The probabilistic
basis of Jaccard's index of similarity,”
Systematic biology, vol. 45, no. 3, pp. 380-
385, 1996.
[29] Y. Yin and K. Yasuda, “Similarity
coefficient methods applied to the cell
formation problem: a comparative
investigation,” Computers & industrial
engineering, vol. 48, no. 3, pp. 471-489,
May 2005.
[30] A. P. Dempster, N. M. Laird and D. B.
Rubin, “Maximum likelihood from
1043
S.B. Kiriş, F. Tüysüz /Performance comparison of different clustering methods for manufacturing cell formation
Sakarya Üniversitesi Fen Bilimleri Enstitüsü Dergisi, 21 (5), 1031~1044, 2017
incomplete data via the EM algorithm,”
Journal of the Royal Statistical Society.
Series B (methodological), vol. 39, no. 1, pp.
1-38, 1977.
[31] F. Dellaert, The expectation maximization
algorithm. Georgia Institute of Technology,
2002.
[32] J. Han, M. Kamber and J. Pei, Data mining:
concepts and techniques. 3rd Edition,
Elsevier, 2012.
[33] J. R. King, “Machine-component grouping
in production flow analysis: an approach
using a rank order clustering algorithm,”
International Journal of Production
Research, vol. 18, no. 2, pp. 213-232, 1980.
1044
S.B. Kiriş, F. Tüysüz /Performance comparison of different clustering methods for manufacturing cell formation
Sakarya Üniversitesi Fen Bilimleri Enstitüsü Dergisi, 21 (5), 1031~1044, 2017