Embed Size (px)
Citation preview
UNIVERSITY BUSINESS SCHOOL
ASSIGNMENT NUMBER- 1
SUBJECT- MANAGERIAL COST ACCOUNTING
TOPIC- COST ANALYSIS FOR DECISION MAKING
-For Marketing and production decision. -For pricing decision, resources utilization.
CONTENT- Introduction Body Conclusion With case studies
SUBMITTED BY-
1) Dr. Shruti Sharma2) Pratibha Rohal3) Artim Gupta4) Anuj Gupta5) Madhav ChopraMBA- GEN-A
UNIVERSITY BUSINESS SCHOOL
INTRODUCTION-
Cost analysis for decisions
Managers must know how costs behave to make strategic decisions and operating decisions, such as: Which of the alternative product design choices is most profitable? Should a component part be made or bought? What effect will a 20% increase in units sold will have on operating income? At what price should the sales be conducted etc?
Knowledge of cost behavior is needed to answer these questions. Hence, the importance of Cost analysis. -Ref- Horngren 11th ed
Decision making
Decisions have to be made in order to meet the targets.
Decision is the choice of the optimal alternative mode of action.
Decision making is a process required for the execution of any business related function.
MANAGER DECISIONS ON FINANCIAL MATTERS
PLANNING DECISIONS CONTROL DECISIONS
REGULATORY SPECIFIC FOR EG- measures to -Preparing budget e.g. - decisions on launching reduce costs.-Prospective planning a new product, its pricing - Decision on capital investment
PRICING DECISIONS- Pricing decisions are management decisions about what to charge for products and services. These are strategic decisions affecting the quantity produced and sold, and therefore revenue and costs. To maximize operating income. Companies should produce and sell units so long as the revenue from an additional unit exceeds the cost of producing it.
Here comes the role of Management Accounting,
Management accounting is a system of recording and analysis of operationalInformation with the purpose of decision making, calculation of the prime costEstimates, planning and control to ensure the execution of enterprise managementFunctions• The main components of management accounting are as follows: cost accountingAnd the prime cost calculations, decision making, planning and control.
UNIVERSITY BUSINESS SCHOOL
Some concepts used here will include, firstly the concept of cost,
Costs are the consumption of resources for the purpose of carrying out business activities, manufacturing and sale of products or provision of services expressed in cash.In business activities it is important to distinguish between:_ Business costs of a certain calendar period (month, quarter, and year) in order to assess what costs have been incurred, including by their type and the point of Cost incurrence;
• And the prime cost of a product or service in order to determine to what they relate.•
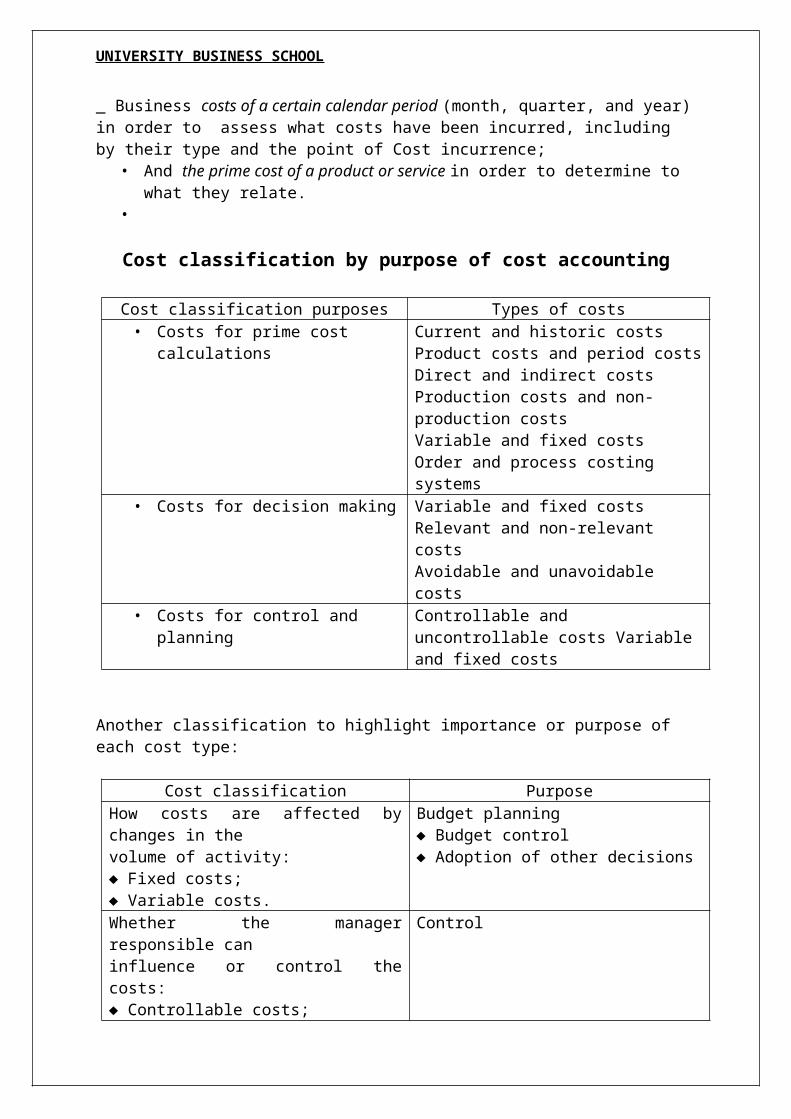
Cost classification by purpose of cost accounting
Cost classification purposes Types of costs• Costs for prime cost calculations Current and historic costs
Product costs and period costsDirect and indirect costsProduction costs and non-production costsVariable and fixed costsOrder and process costing systems
• Costs for decision making Variable and fixed costsRelevant and non-relevant costsAvoidable and unavoidable costs
• Costs for control and planning Controllable and uncontrollable costs Variable and fixed costs
Another classification to highlight importance or purpose of each cost type:
Cost classification PurposeHow costs are affected by changes in thevolume of activity:♦ Fixed costs;♦ Variable costs.
Budget planning♦ Budget control♦ Adoption of other decisions
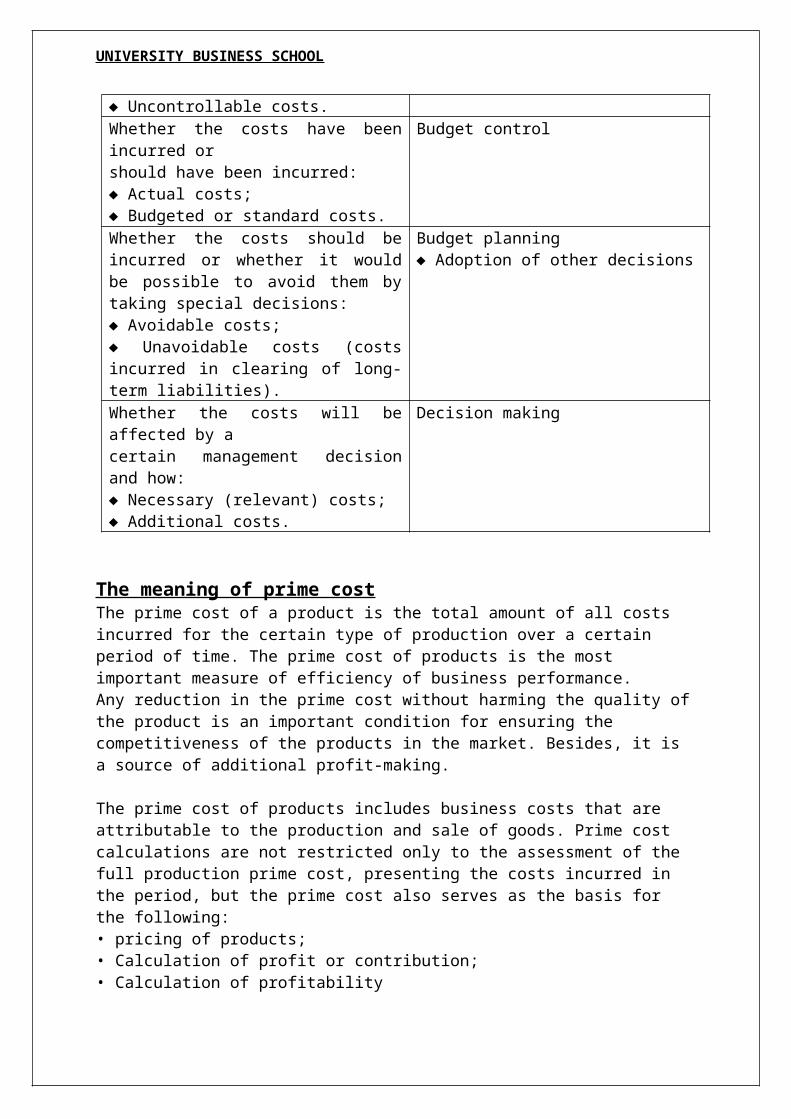
Whether the manager responsible caninfluence or control the costs:♦ Controllable costs;♦ Uncontrollable costs.
Control
Whether the costs have been incurred orshould have been incurred:♦ Actual costs;♦ Budgeted or standard costs.
Budget control
Whether the costs should be incurred or whether it would be possible to avoid them by taking special decisions:♦ Avoidable costs;♦ Unavoidable costs (costs incurred in clearing of long-term liabilities).
Budget planning♦ Adoption of other decisions
Whether the costs will be affected by acertain management decision and how:
Decision making
UNIVERSITY BUSINESS SCHOOL
♦ Necessary (relevant) costs;♦ Additional costs.
The meaning of prime costThe prime cost of a product is the total amount of all costs incurred for the certain type of production over a certain period of time. The prime cost of products is the most important measure of efficiency of business performance.Any reduction in the prime cost without harming the quality of the product is an important condition for ensuring the competitiveness of the products in the market. Besides, it is a source of additional profit-making.
The prime cost of products includes business costs that are attributable to the production and sale of goods. Prime cost calculations are not restricted only to the assessment of the full production prime cost, presenting the costs incurred in the period, but the prime cost also serves as the basis for the following:• pricing of products;• Calculation of profit or contribution;• Calculation of profitability
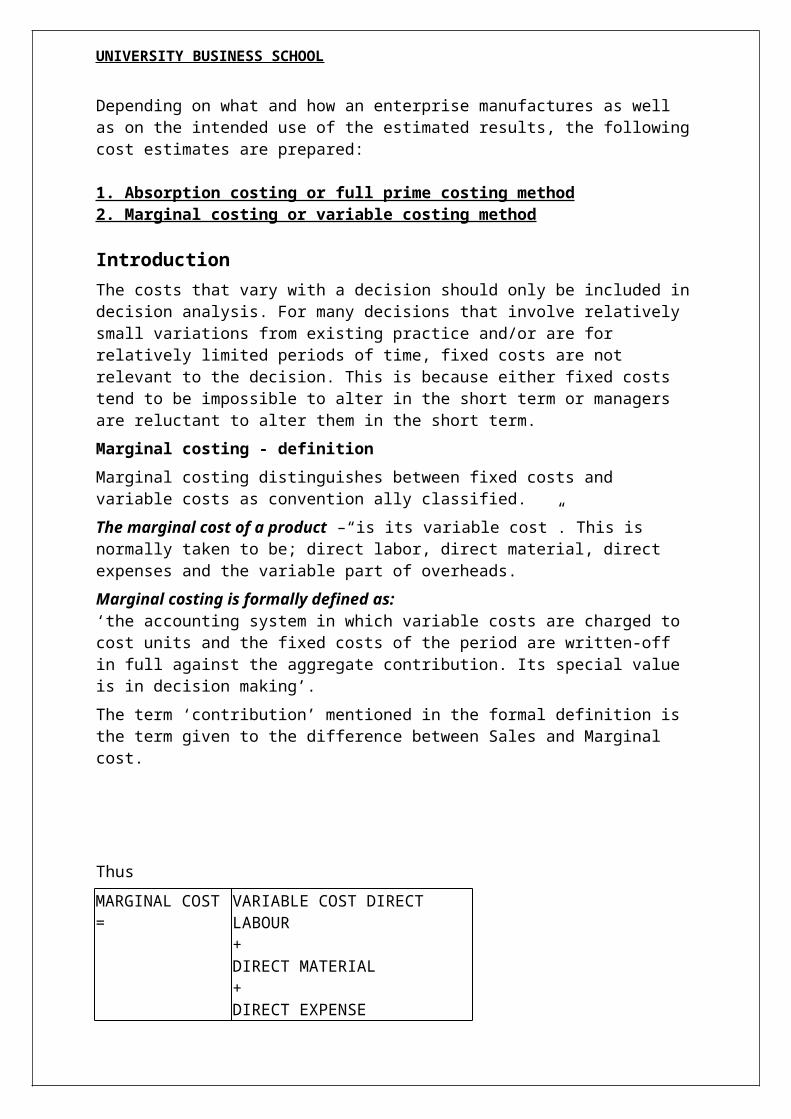
Depending on what and how an enterprise manufactures as well as on the intended use of the estimated results, the following cost estimates are prepared:
1. Absorption costing or full prime costing method2. Marginal costing or variable costing method
IntroductionThe costs that vary with a decision should only be included in decision analysis. For many decisions that involve relatively small variations from existing practice and/or are for relatively limited periods of time, fixed costs are not relevant to the decision. This is because either fixed costs tend to be impossible to alter in the short term or managers are reluctant to alter them in the short term.
Marginal costing - definition
Marginal costing distinguishes between fixed costs and variable costs as convention ally classified.
The marginal cost of a product –“is its variable cost”. This is normally taken to be; direct labor, direct material, direct expenses and the variable part of overheads.
Marginal costing is formally defined as: ‘the accounting system in which variable costs are charged to cost units and the fixed costs of the period are written-off in full against the aggregate contribution. Its special value is in decision making’.
The term ‘contribution’ mentioned in the formal definition is the term given to the difference between Sales and Marginal cost.
UNIVERSITY BUSINESS SCHOOL
Thus
MARGINAL COST =
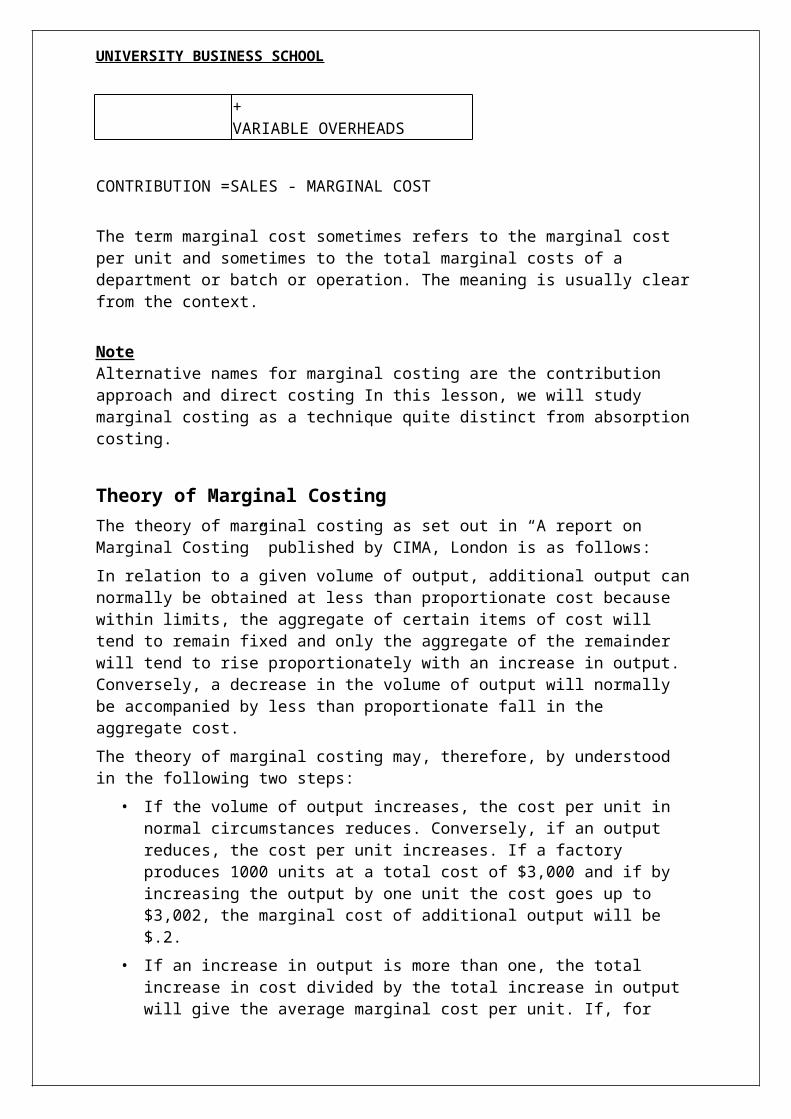
VARIABLE COST DIRECT LABOUR+DIRECT MATERIAL+DIRECT EXPENSE+VARIABLE OVERHEADS
CONTRIBUTION =SALES - MARGINAL COST
The term marginal cost sometimes refers to the marginal cost per unit and sometimes to the total marginal costs of a department or batch or operation. The meaning is usually clear from the context.
Note Alternative names for marginal costing are the contribution approach and direct costing In this lesson, we will study marginal costing as a technique quite distinct from absorption costing.
Theory of Marginal Costing The theory of marginal costing as set out in “A report on Marginal Costing” published by CIMA, London is as follows:
In relation to a given volume of output, additional output can normally be obtained at less than proportionate cost because within limits, the aggregate of certain items of cost will tend to remain fixed and only the aggregate of the remainder will tend to rise proportionately with an increase in output. Conversely, a decrease in the volume of output will normally be accompanied by less than proportionate fall in the aggregate cost.
The theory of marginal costing may, therefore, by understood in the following two steps:
• If the volume of output increases, the cost per unit in normal circumstances reduces. Conversely, if an output reduces, the cost per unit increases. If a factory produces 1000 units at a total cost of $3,000 and if by increasing the output by one unit the cost goes up to $3,002, the marginal cost of additional output will be $.2.
• If an increase in output is more than one, the total increase in cost divided by the total increase in output will give the average marginal cost per unit. If, for example, the output is increased to 1020 units from 1000 units and the total cost to produce these units is $1,045, the average marginal cost per unit is $2.25. It can be described as follows:
Additional cost =Additional units
$ 45 = $2.25 20
UNIVERSITY BUSINESS SCHOOL
The ascertainment of marginal cost is based on the classification and segregation of cost into fixed and variable cost. In order to understand the marginal costing technique, it is essential to understand the meaning of marginal cost.
Marginal cost means the cost of the marginal or last unit produced. It is also defined as the cost of one more or one less unit produced besides existing level of production. In this connection, a unit may mean a single commodity, a dozen, a gross or any other measure of goods.
For example, if a manufacturing firm produces X unit at a cost of $ 300 and X+1 units at a cost of $ 320, the cost of an additional unit will be $ 20 which is marginal cost. Similarly if the production of X-1 units comes down to $ 280, the cost of marginal unit will be $ 20 (300–280).
The marginal cost varies directly with the volume of production and marginal cost per unit remains the same. It consists of prime cost, i.e. cost of direct materials, direct labor and all variable overheads. It does not contain any element of fixed cost which is kept separate under marginal cost technique.
Marginal costing may be defined as the technique of presenting cost data wherein variable costs and fixed costs are shown separately for managerial decision-making. It should be clearly understood that marginal costing is not a method of costing like process costing or job costing. Rather it is simply a method or technique of the analysis of cost information for the guidance of management which tries to find out an effect on profit due to changes in the volume of output.
There are different phrases being used for this technique of costing. In UK, marginal costing is a popular phrase whereas in US, it is known as direct costing and is used in place of marginal costing. Variable costing is another name of marginal costing.
Marginal costing technique has given birth to a very useful concept of contribution where contribution is given by: Sales revenue less variable cost (marginal cost)
Contribution may be defined as the profit before the recovery of fixed costs. Thus, contribution goes toward the recovery of fixed cost and profit, and is equal to fixed cost plus profit (C = F + P).
In case a firm neither makes profit nor suffers loss, contribution will be just equal to fixed cost (C = F). this is known as break-even point.
The concept of contribution is very useful in marginal costing. It has a fixed relation with sales. The proportion of contribution to sales is known as P/V ratio which remains the same under given conditions of production and sales.
The principles of marginal costing The principles of marginal costing are as follows.
• For any given period of time, fixed costs will be the same, for any volume of sales and production (provided that the level of activity is within the ‘relevant range’). Therefore, by selling an extra item of product or service the following will happen.
• Revenue will increase by the sales value of the item sold.
• Costs will increase by the variable cost per unit.
UNIVERSITY BUSINESS SCHOOL
• Profit will increase by the amount of contribution earned from the extra item.
• Similarly, if the volume of sales falls by one item, the profit will fall by the amount of contribution earned from the item.
• Profit measurement should therefore be based on an analysis of total contribution. Since fixed costs relate to a period of time, and do not change with increases or decreases in sales volume, it is misleading to charge units of sale with a share of fixed costs.
• When a unit of product is made, the extra costs incurred in its manufacture are the variable production costs. Fixed costs are unaffected, and no extra fixed costs are incurred when output is increased.
Features of Marginal Costing: The main features of marginal costing are as follows:
• Cost ClassificationThe marginal costing technique makes a sharp distinction between variable costs and fixed costs. It is the variable cost on the basis of which production and sales policies are designed by a firm following the marginal costing technique.
• Stock/Inventory ValuationUnder marginal costing, inventory/stock for profit measurement is valued at marginal cost. It is in sharp contrast to the total unit cost under absorption costing method.
• Marginal ContributionMarginal costing technique makes use of marginal contribution for marking various decisions. Marginal contribution is the difference between sales and marginal cost. It forms the basis for judging the profitability of different products or departments.
Advantages and Relevance-• Marginal costing is simple to understand.
• By not charging fixed overhead to cost of production, the effect of varying charges per unit is avoided.
• It prevents the illogical carry forward in stock valuation of some proportion of current years fixed overhead.
• The effects of alternative sales or production policies can be more readily available and assessed, and decisions taken would yield the maximum return to business.
• It eliminates large balances left in overhead control accounts which indicate the difficulty of ascertaining an accurate overhead recovery rate.
• Practical cost control is greatly facilitated. By avoiding arbitrary allocation of fixed overhead, efforts can be concentrated on maintaining a uniform and consistent marginal cost. It is useful to various levels of management.
• It helps in short-term profit planning by breakeven and profitability analysis, both in terms of quantity and graphs. Comparative profitability and performance between two or more products and divisions can easily be assessed and brought to the notice of management for decision making.
UNIVERSITY BUSINESS SCHOOL
Absorption Costing- definition
Absorption costing, also known as full costing, is a costing technique in which all manufacturing costs, variable and fixed, are considered as costs of production and are used in determining the cost of goods manufactured and inventories. All manufacturing costs are fully absorbed into finished goods.
Marginal Costing versus Absorption Costing
After knowing the two techniques of marginal costing and absorption costing, we have seen that the net profits are not the same because of the following reasons:
1. Over and Under Absorbed Overheads
In absorption costing, fixed overheads can never be absorbed exactly because of difficulty in forecasting costs and volume of output. If these balances of under or over absorbed/recovery are not written off to costing profit and loss account, the actual amount incurred is not shown in it. In marginal costing, however, the actual fixed overhead incurred is wholly charged against contribution and hence, there will be some difference in net profits.
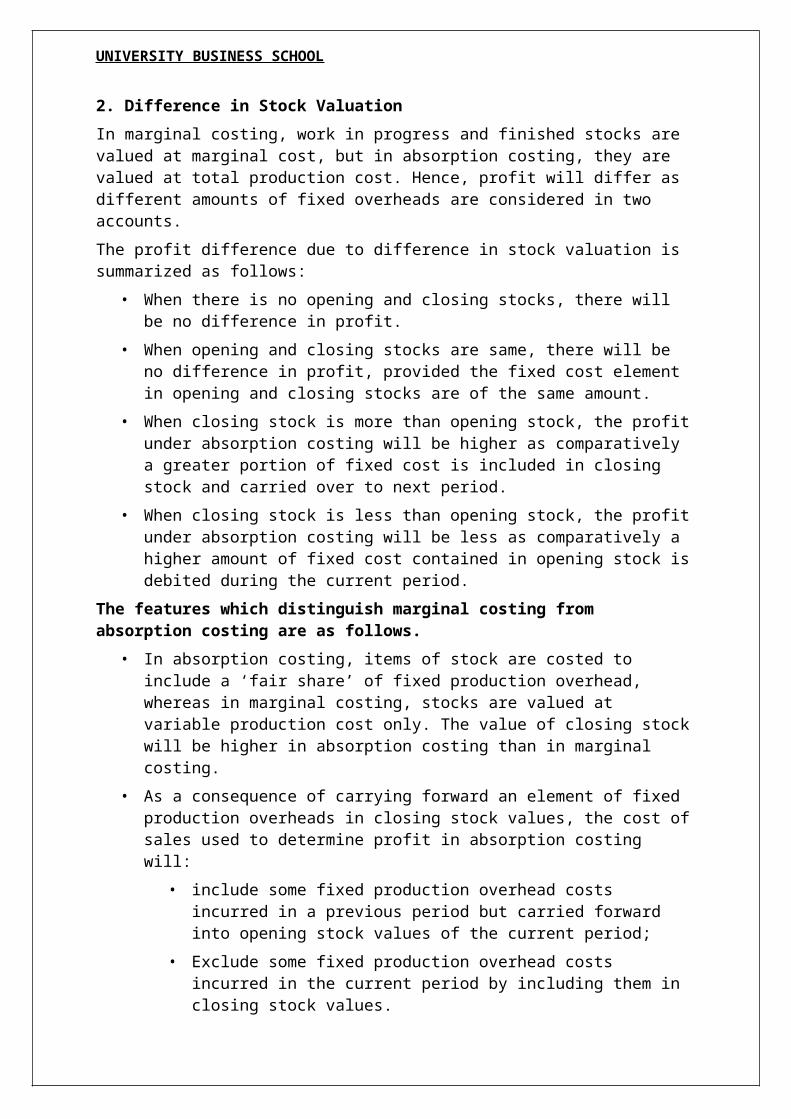
2. Difference in Stock Valuation
In marginal costing, work in progress and finished stocks are valued at marginal cost, but in absorption costing, they are valued at total production cost. Hence, profit will differ as different amounts of fixed overheads are considered in two accounts.
The profit difference due to difference in stock valuation is summarized as follows:
• When there is no opening and closing stocks, there will be no difference in profit.
• When opening and closing stocks are same, there will be no difference in profit, provided the fixed cost element in opening and closing stocks are of the same amount.
• When closing stock is more than opening stock, the profit under absorption costing will be higher as comparatively a greater portion of fixed cost is included in closing stock and carried over to next period.
• When closing stock is less than opening stock, the profit under absorption costing will be less as comparatively a higher amount of fixed cost contained in opening stock is debited during the current period.
The features which distinguish marginal costing from absorption costing are as follows.
• In absorption costing, items of stock are costed to include a ‘fair share’ of fixed production overhead, whereas in marginal costing, stocks are valued at variable production cost only. The value of closing stock will be higher in absorption costing than in marginal costing.
• As a consequence of carrying forward an element of fixed production overheads in closing stock values, the cost of sales used to determine profit in absorption costing will:
• include some fixed production overhead costs incurred in a previous period but carried forward into opening stock values of the current period;
• Exclude some fixed production overhead costs incurred in the current period by including them in closing stock values.
UNIVERSITY BUSINESS SCHOOL
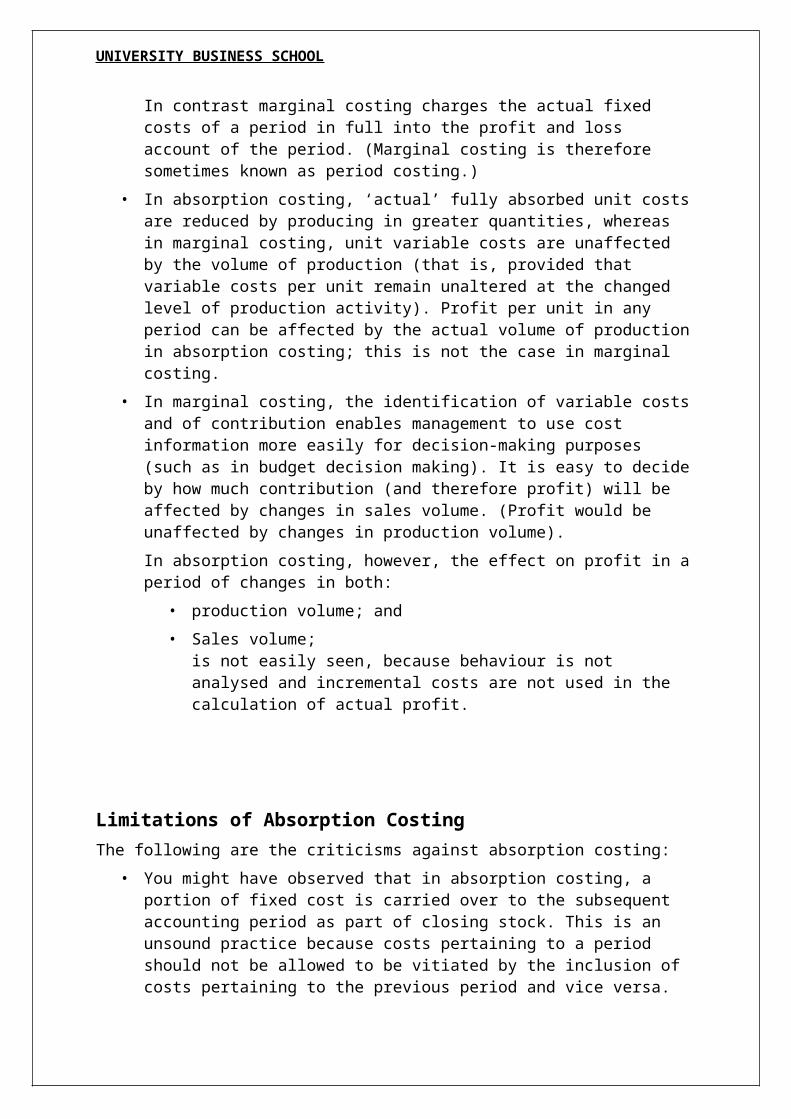
In contrast marginal costing charges the actual fixed costs of a period in full into the profit and loss account of the period. (Marginal costing is therefore sometimes known as period costing.)
• In absorption costing, ‘actual’ fully absorbed unit costs are reduced by producing in greater quantities, whereas in marginal costing, unit variable costs are unaffected by the volume of production (that is, provided that variable costs per unit remain unaltered at the changed level of production activity). Profit per unit in any period can be affected by the actual volume of production in absorption costing; this is not the case in marginal costing.
• In marginal costing, the identification of variable costs and of contribution enables management to use cost information more easily for decision-making purposes (such as in budget decision making). It is easy to decide by how much contribution (and therefore profit) will be affected by changes in sales volume. (Profit would be unaffected by changes in production volume).
In absorption costing, however, the effect on profit in a period of changes in both:
• production volume; and
• Sales volume;is not easily seen, because behaviour is not analysed and incremental costs are not used in the calculation of actual profit.
Limitations of Absorption Costing The following are the criticisms against absorption costing:
• You might have observed that in absorption costing, a portion of fixed cost is carried over to the subsequent accounting period as part of closing stock. This is an unsound practice because costs pertaining to a period should not be allowed to be vitiated by the inclusion of costs pertaining to the previous period and vice versa.
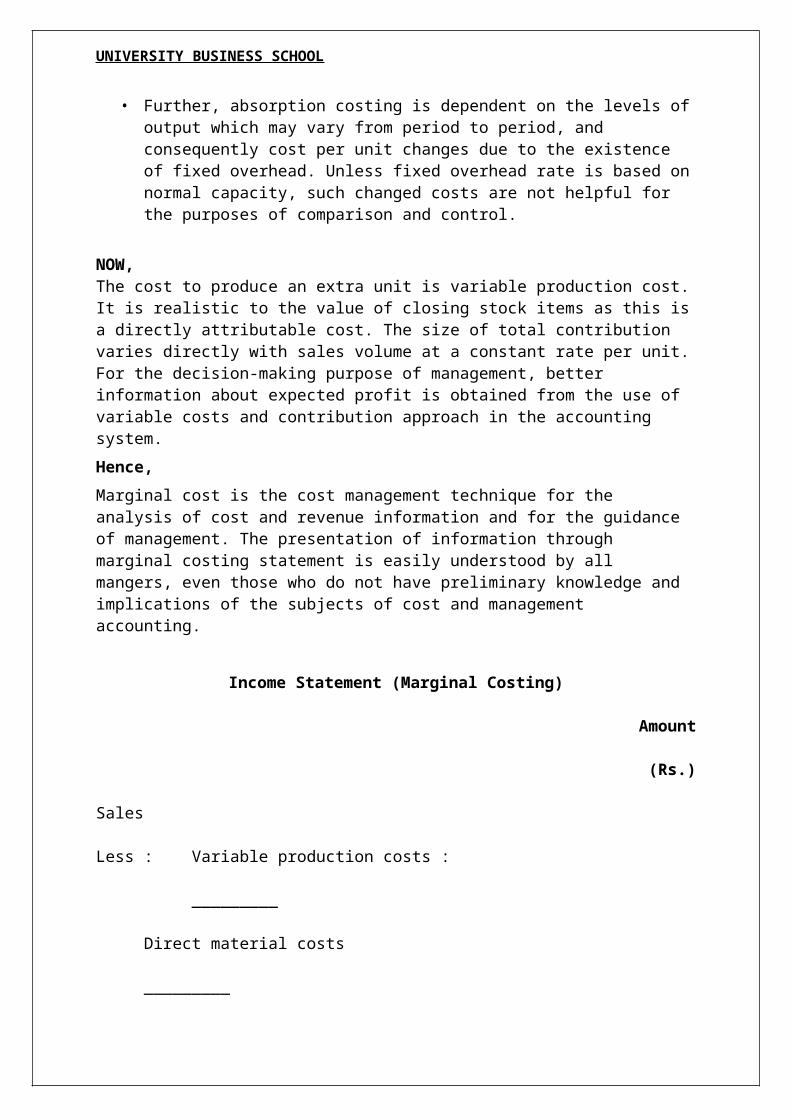
• Further, absorption costing is dependent on the levels of output which may vary from period to period, and consequently cost per unit changes due to the existence of fixed overhead. Unless fixed overhead rate is based on normal capacity, such changed costs are not helpful for the purposes of comparison and control.
NOW,The cost to produce an extra unit is variable production cost. It is realistic to the value of closing stock items as this is a directly attributable cost. The size of total contribution varies directly with sales volume at a constant rate per unit. For the decision-making purpose of management, better information about expected profit is obtained from the use of variable costs and contribution approach in the accounting system.
Hence,
Marginal cost is the cost management technique for the analysis of cost and revenue information and for the guidance of management. The presentation of information through marginal costing statement is easily understood by all mangers, even those who do not have preliminary knowledge and implications of the subjects of cost and management accounting.
UNIVERSITY BUSINESS SCHOOL
Income Statement (Marginal Costing)
Amount
(Rs.)
Sales
Less : Variable production costs : _________
Direct material costs _________
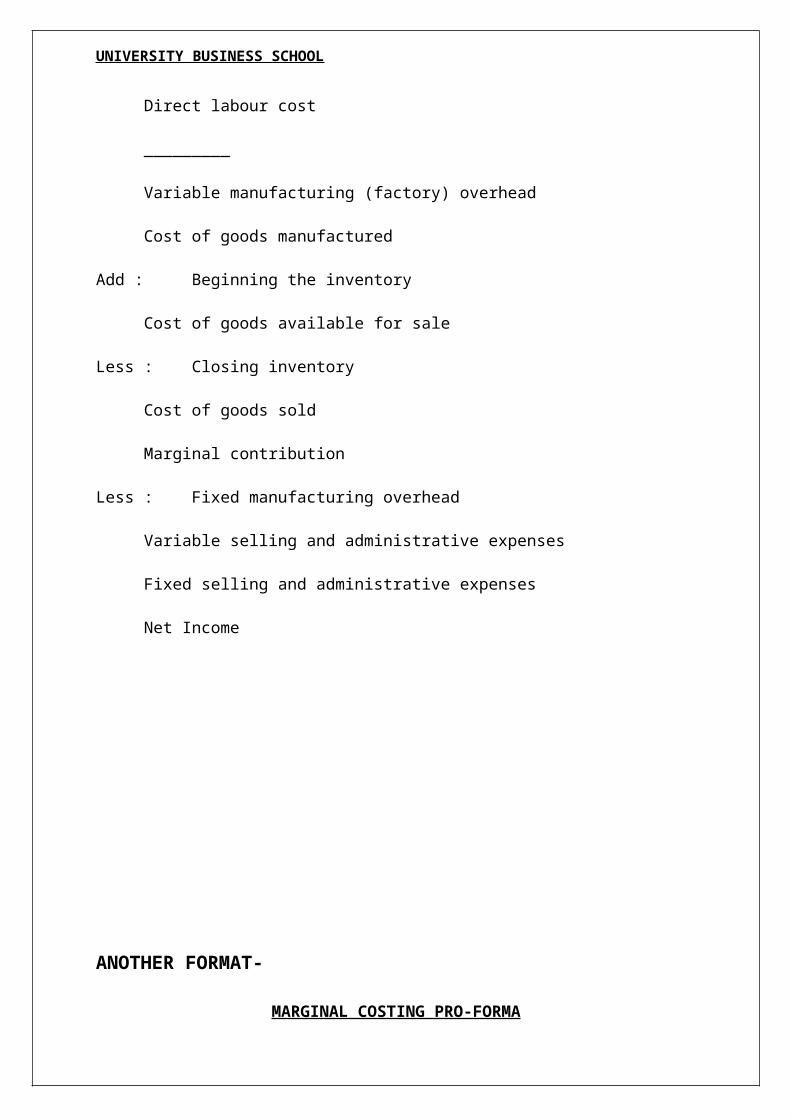
Direct labour cost _________
Variable manufacturing (factory) overhead
Cost of goods manufactured
Add : Beginning the inventory
Cost of goods available for sale
Less : Closing inventory
Cost of goods sold
Marginal contribution
Less : Fixed manufacturing overhead
Variable selling and administrative expenses
Fixed selling and administrative expenses
Net Income
UNIVERSITY BUSINESS SCHOOL
ANOTHER FORMAT-
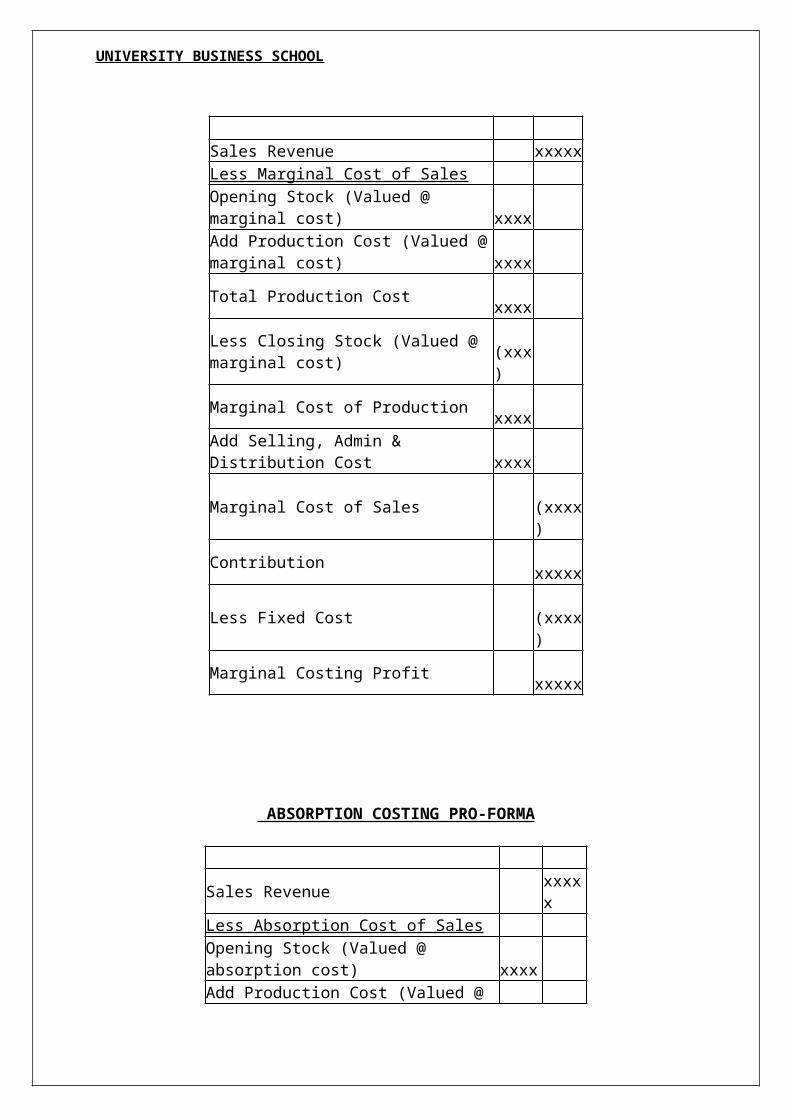
MARGINAL COSTING PRO-FORMA
Sales Revenue xxxxxLess Marginal Cost of Sales
Opening Stock (Valued @ marginal cost) xxxx
Add Production Cost (Valued @ marginal cost)
xxxx
Total Production Cost xxxx
Less Closing Stock (Valued @ marginal cost)
(xxx)
Marginal Cost of Production xxxx
Add Selling, Admin & Distribution Cost xxxx
Marginal Cost of Sales (xxxx)Contribution xxxxxLess Fixed Cost (xxxx)Marginal Costing Profit xxxxx
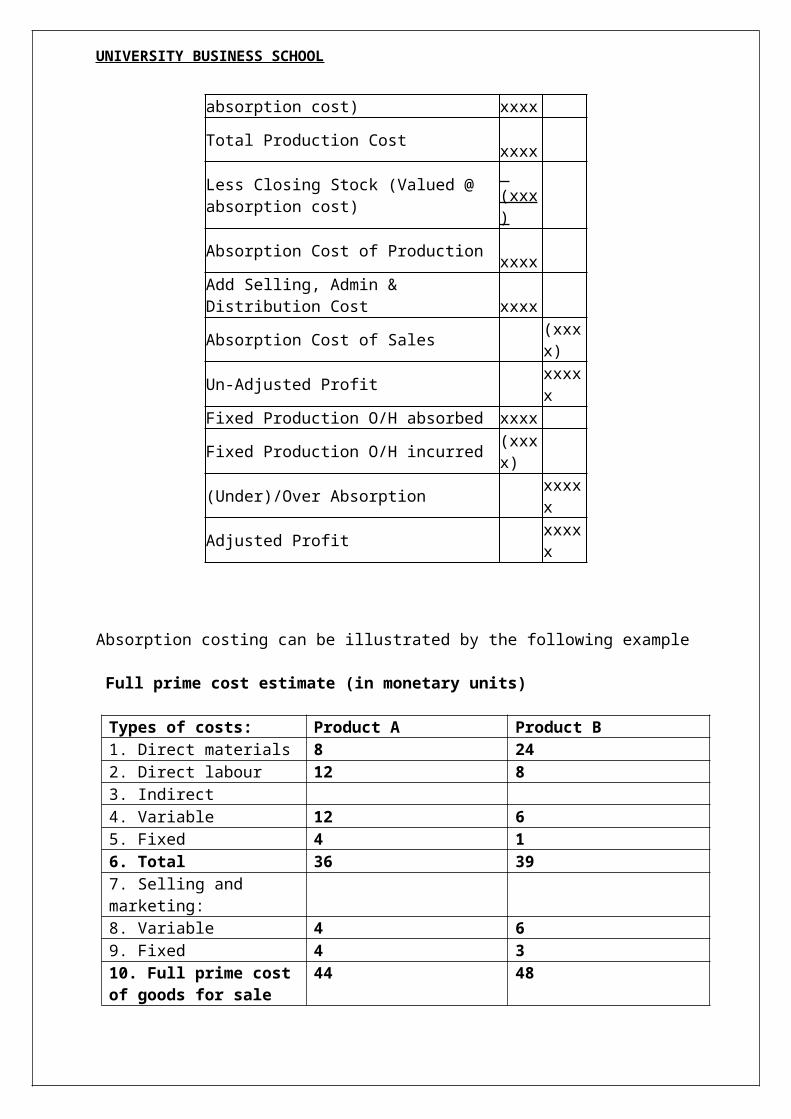
ABSORPTION COSTING PRO-FORMA
Sales Revenue xxxxxLess Absorption Cost of Sales Opening Stock (Valued @ absorption cost) xxxx Add Production Cost (Valued @ absorption cost)
xxxx
Total Production Cost xxxx Less Closing Stock (Valued @ absorption cost)
(xxx)
Absorption Cost of Production xxxx Add Selling, Admin & Distribution Cost xxxx Absorption Cost of Sales (xxxx)Un-Adjusted Profit xxxxxFixed Production O/H absorbed xxxx Fixed Production O/H incurred (xxxx) (Under)/Over Absorption xxxxxAdjusted Profit xxxxx
UNIVERSITY BUSINESS SCHOOL
Absorption costing can be illustrated by the following example
Full prime cost estimate (in monetary units)
Types of costs: Product A Product B1. Direct materials 8 242. Direct labour 12 83. Indirect4. Variable 12 65. Fixed 4 16. Total 36 397. Selling and marketing:8. Variable 4 69. Fixed 4 310. Full prime cost of goods for sale
44 48
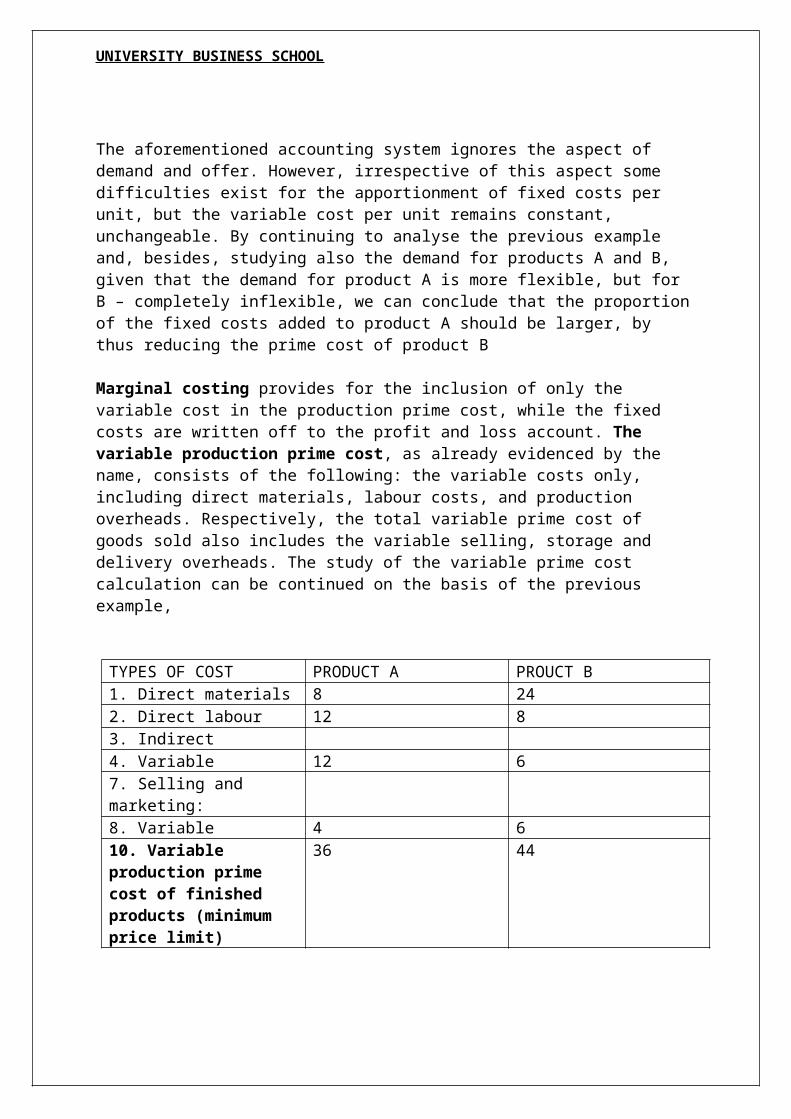
The aforementioned accounting system ignores the aspect of demand and offer. However, irrespective of this aspect some difficulties exist for the apportionment of fixed costs per unit, but the variable cost per unit remains constant, unchangeable. By continuing to analyse the previous example and, besides, studying also the demand for products A and B, given that the demand for product A is more flexible, but for B – completely inflexible, we can conclude that the proportion of the fixed costs added to product A should be larger, by thus reducing the prime cost of product B
Marginal costing provides for the inclusion of only the variable cost in the production prime cost, while the fixed costs are written off to the profit and loss account. The variable production prime cost, as already evidenced by the name, consists of the following: the variable costs only, including direct materials, labour costs, and production overheads. Respectively, the total variable prime cost of goods sold also includes the variable selling, storage and delivery overheads. The study of the variable prime cost calculation can be continued on the basis of the previous example,
TYPES OF COST PRODUCT A PROUCT B1. Direct materials 8 242. Direct labour 12 83. Indirect4. Variable 12 67. Selling and marketing:8. Variable 4 610. Variable production prime cost of finished products (minimum price limit)
36 44
UNIVERSITY BUSINESS SCHOOL
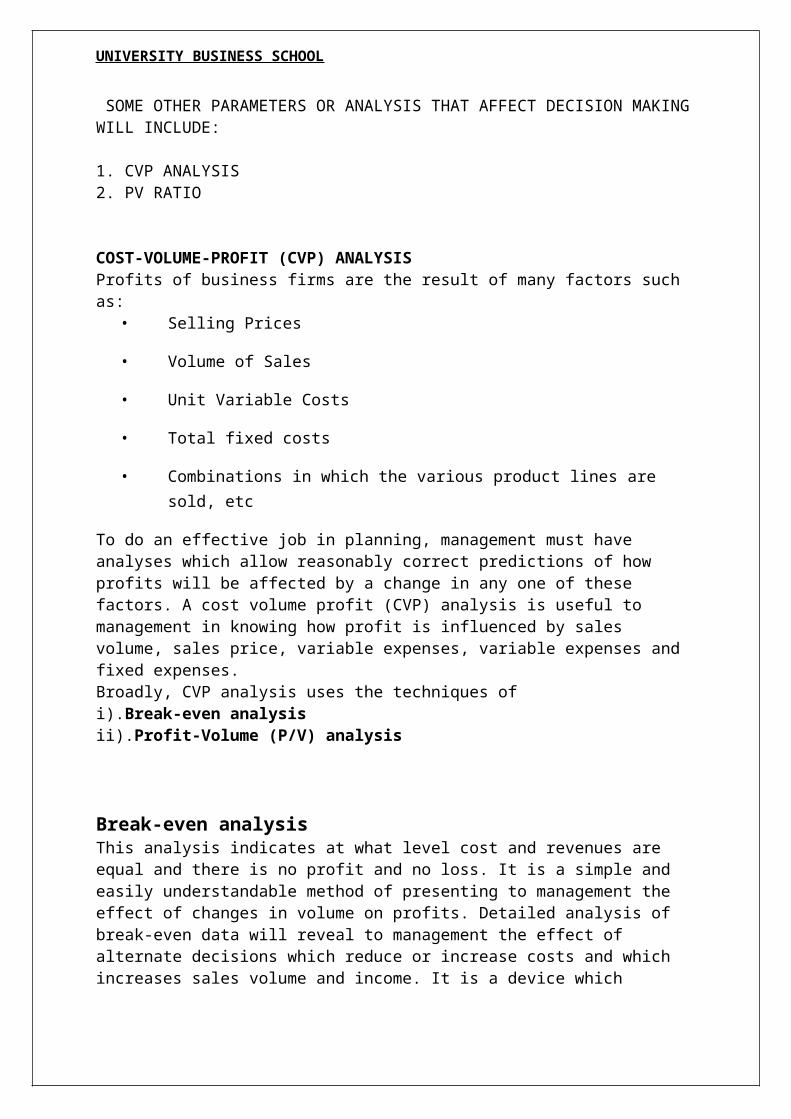
SOME OTHER PARAMETERS OR ANALYSIS THAT AFFECT DECISION MAKING WILL INCLUDE:
1. CVP ANALYSIS2. PV RATIO
COST-VOLUME-PROFIT (CVP) ANALYSISProfits of business firms are the result of many factors such as:
• Selling Prices
• Volume of Sales
• Unit Variable Costs
• Total fixed costs
• Combinations in which the various product lines are sold, etc
To do an effective job in planning, management must have analyses which allow reasonably correct predictions of how profits will be affected by a change in any one of these factors. A cost volume profit (CVP) analysis is useful to management in knowing how profit is influenced by sales volume, sales price, variable expenses, variable expenses and fixed expenses.Broadly, CVP analysis uses the techniques of i).Break-even analysis ii).Profit-Volume (P/V) analysis
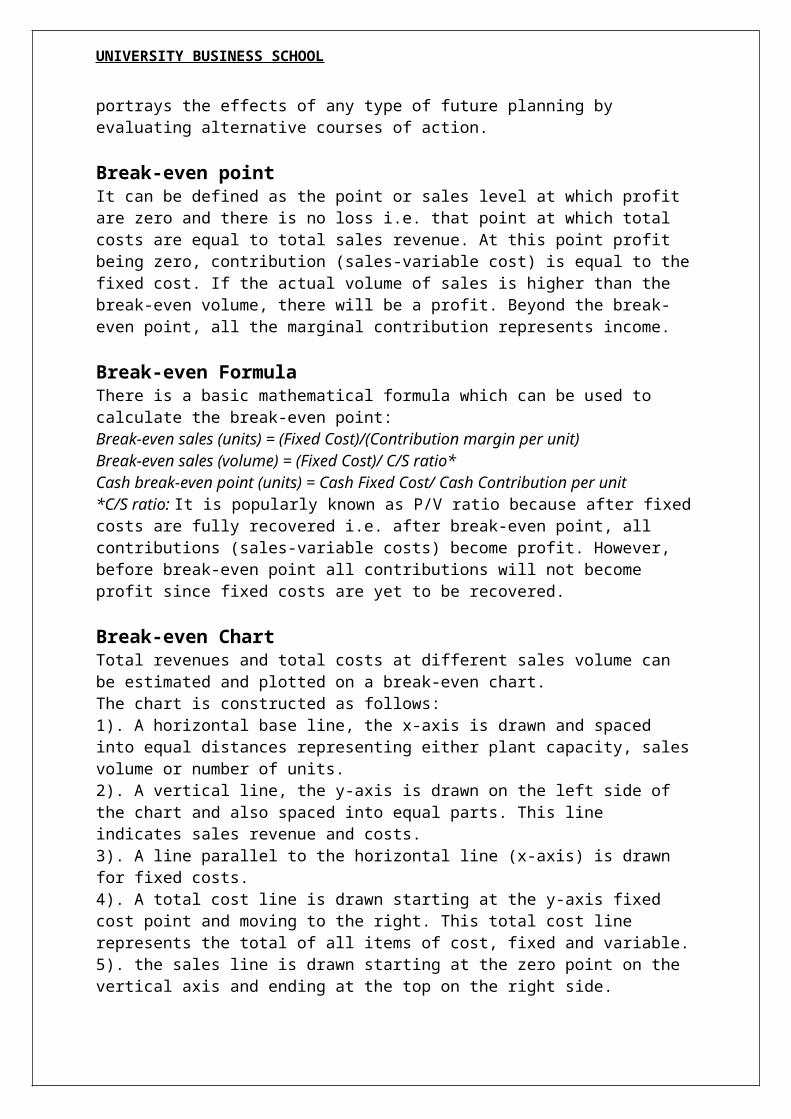
Break-even analysisThis analysis indicates at what level cost and revenues are equal and there is no profit and no loss. It is a simple and easily understandable method of presenting to management the effect of changes in volume on profits. Detailed analysis of break-even data will reveal to management the effect of alternate decisions which reduce or increase costs and which increases sales volume and income. It is a device which portrays the effects of any type of future planning by evaluating alternative courses of action.
Break-even pointIt can be defined as the point or sales level at which profit are zero and there is no loss i.e. that point at which total costs are equal to total sales revenue. At this point profit being zero, contribution (sales-variable cost) is equal to the fixed cost. If the actual volume of sales is higher than the break-even volume, there will be a profit. Beyond the break-even point, all the marginal contribution represents income.
Break-even FormulaThere is a basic mathematical formula which can be used to calculate the break-even point:Break-even sales (units) = (Fixed Cost)/(Contribution margin per unit)Break-even sales (volume) = (Fixed Cost)/ C/S ratio*
UNIVERSITY BUSINESS SCHOOL
Cash break-even point (units) = Cash Fixed Cost/ Cash Contribution per unit*C/S ratio: It is popularly known as P/V ratio because after fixed costs are fully recovered i.e. after break-even point, all contributions (sales-variable costs) become profit. However, before break-even point all contributions will not become profit since fixed costs are yet to be recovered.
Break-even ChartTotal revenues and total costs at different sales volume can be estimated and plotted on a break-even chart.The chart is constructed as follows:1). A horizontal base line, the x-axis is drawn and spaced into equal distances representing either plant capacity, sales volume or number of units.2). A vertical line, the y-axis is drawn on the left side of the chart and also spaced into equal parts. This line indicates sales revenue and costs.3). A line parallel to the horizontal line (x-axis) is drawn for fixed costs.4). A total cost line is drawn starting at the y-axis fixed cost point and moving to the right. This total cost line represents the total of all items of cost, fixed and variable.5). the sales line is drawn starting at the zero point on the vertical axis and ending at the top on the right side.6). the total cost line intersects the sales line at a point which is known as the break-even point.7). The area to the left of the break-even point between the total cost line and the sales line is the loss area; the profit area lies to the right of the break-even point above the total cost line.
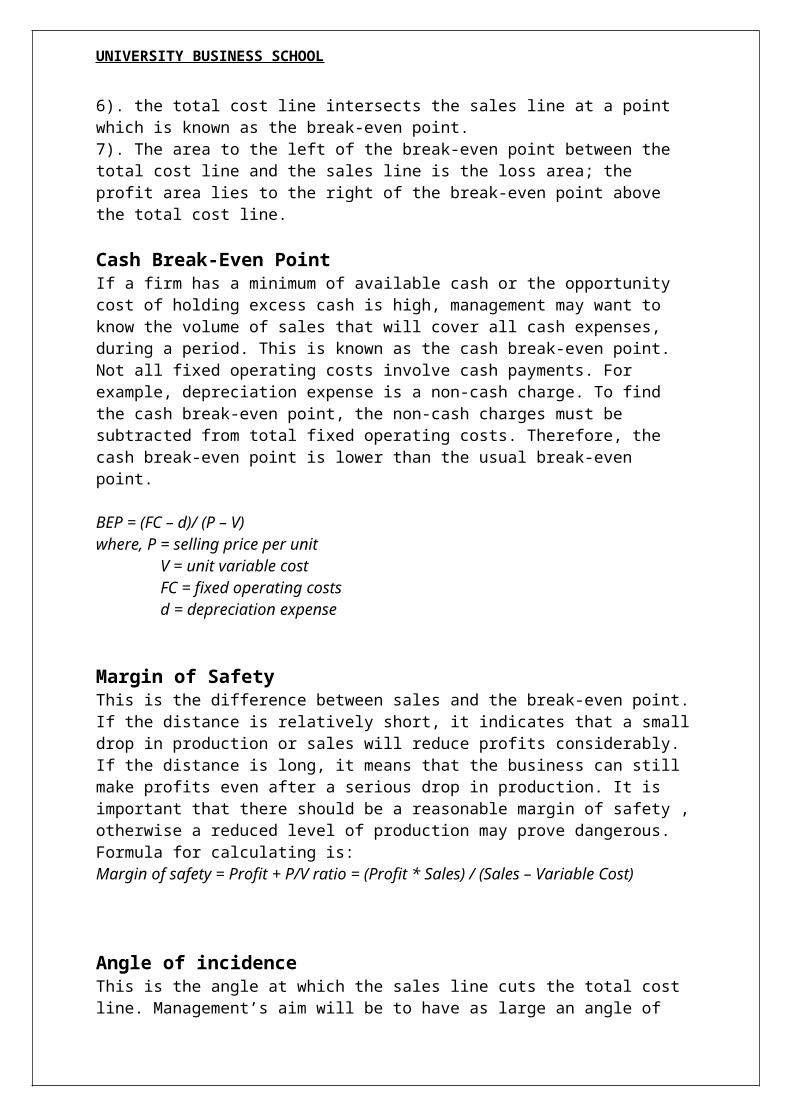
Cash Break-Even PointIf a firm has a minimum of available cash or the opportunity cost of holding excess cash is high, management may want to know the volume of sales that will cover all cash expenses, during a period. This is known as the cash break-even point.Not all fixed operating costs involve cash payments. For example, depreciation expense is a non-cash charge. To find the cash break-even point, the non-cash charges must be subtracted from total fixed operating costs. Therefore, the cash break-even point is lower than the usual break-even point.
BEP = (FC – d)/ (P – V)where, P = selling price per unit
V = unit variable cost FC = fixed operating costs d = depreciation expense
Margin of SafetyThis is the difference between sales and the break-even point. If the distance is relatively short, it indicates that a small drop in production or sales will reduce profits considerably. If the distance is long, it means that the business can still make profits even after a serious drop in production. It is important that there should be a reasonable margin of safety , otherwise a reduced level of production may prove dangerous.Formula for calculating is:Margin of safety = Profit + P/V ratio = (Profit * Sales) / (Sales – Variable Cost)
UNIVERSITY BUSINESS SCHOOL
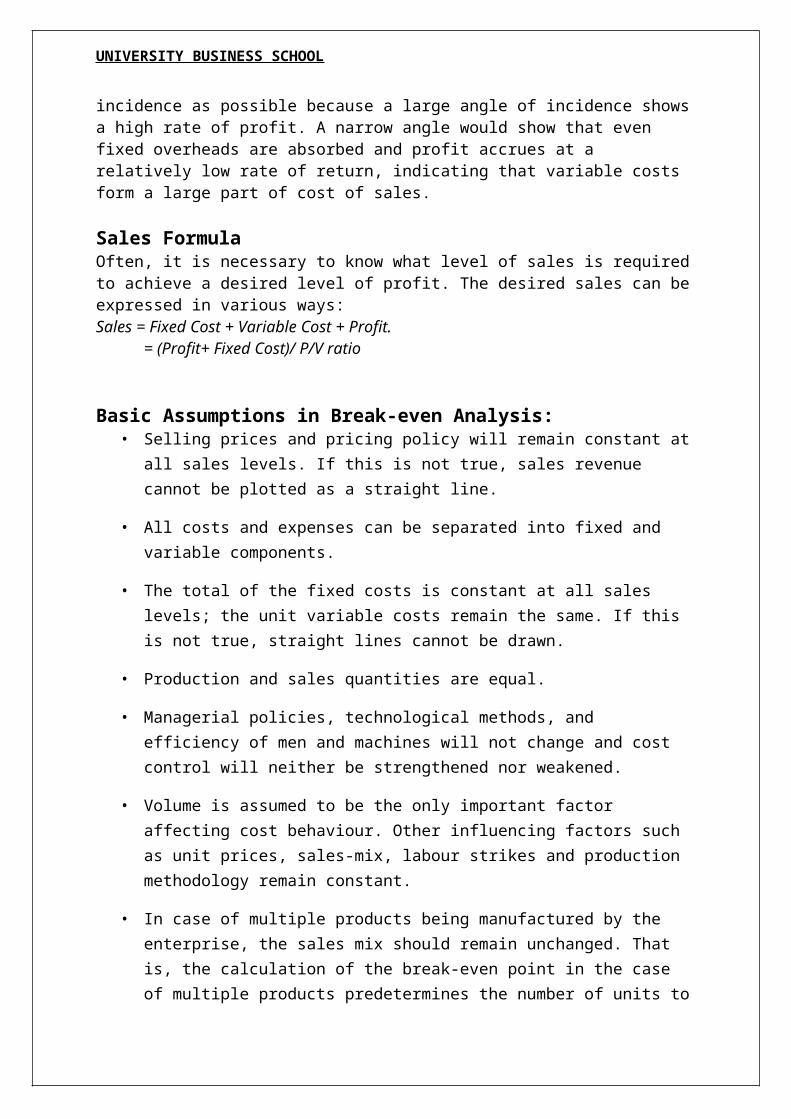
Angle of incidenceThis is the angle at which the sales line cuts the total cost line. Management’s aim will be to have as large an angle of incidence as possible because a large angle of incidence shows a high rate of profit. A narrow angle would show that even fixed overheads are absorbed and profit accrues at a relatively low rate of return, indicating that variable costs form a large part of cost of sales.
Sales FormulaOften, it is necessary to know what level of sales is required to achieve a desired level of profit. The desired sales can be expressed in various ways:Sales = Fixed Cost + Variable Cost + Profit.
= (Profit+ Fixed Cost)/ P/V ratio
Basic Assumptions in Break-even Analysis:• Selling prices and pricing policy will remain constant at all sales levels. If this is not
true, sales revenue cannot be plotted as a straight line.
• All costs and expenses can be separated into fixed and variable components.
• The total of the fixed costs is constant at all sales levels; the unit variable costs remain the same. If this is not true, straight lines cannot be drawn.
• Production and sales quantities are equal.
• Managerial policies, technological methods, and efficiency of men and machines will not change and cost control will neither be strengthened nor weakened.
• Volume is assumed to be the only important factor affecting cost behaviour. Other influencing factors such as unit prices, sales-mix, labour strikes and production methodology remain constant.
• In case of multiple products being manufactured by the enterprise, the sales mix should remain unchanged. That is, the calculation of the break-even point in the case of multiple products predetermines the number of units to be sold in respect of each product. This multiproduct sales mix should remain unchanged.
Profit / Volume ( P/V) Analysis A P/V graph is sometimes used in place of or along with a break-even chart. Profit and losses are given on a vertical scale; and units of products, sales revenue or percentage of activity are given on a horizontal line. The horizontal line is drawn on the graph to separate profits from losses. The profits and losses at various sales levels are plotted and connected by a profit line. The break-even point is measured at the point where the profit line intersects the horizontal line. The P/V graph may be preferred to the break-even chart because profit and losses at any point can be read directly from the vertical scale; but the P/V graph does not clearly show how costs vary with activity.Data used earlier to prepare the break-even chart are also used in preparing the P/V graph.
UNIVERSITY BUSINESS SCHOOL
A cost – volume profit analysis can be used to measure the effect of factor changes and management decision alternatives on profits. These factors include possible changes in selling prices, changes in variable or fixed costs, expansion or contraction of sales volume, or other changes in operating methods or policies. Cost-volume profit analysis is also useful for problems of product pricing, sales-mix, adding or deleting product lines, and accepting special orders.
Changes in selling Prices
The CVP graph is frequently used to illustrate the potential profit effects of contemplated price changes. Effects on the profit pattern are as follows –
1. Increase in selling price – If the selling price is increased, it increases the P/V ratio, and the rate of fixed costs recovery is increased. The break-even point (break-volume) declines, profit beyond the break-even point increases, losses below the break-even point decreases.
2. Decrease in selling price – If the selling price decreases, it decreases the P/V ratio and the rate of fixed cost recovery deadlines. The break-even point increases.Assume, for example, that a company produces a product with a selling point of Rs.10 per unit and a variable cost of Rs. 4 per unit. Fixed costs are Rs.36000 per year.
Changes in Variable costs
The CVP graph is used to evaluate the impact of increases and decreases in variable cost per unit.
1. Increase in variable costs – An increase in variable costs has the same effect as a decrease in the selling price. It decreases the P/V ratio and the rate of fixed cost recovery is slower. The break-even point moves to higher level; profits after the break-even point decreases; losses before the break-even point increases.
2. Decrease in variable costs – A decrease in variable costs has the same effect as an increase in the selling price. A higher P/V ratio is achieved and the rate of fixed costs recovery is increased. The break-even point declines, profits beyond the break-even point are higher; losses before the breakeven point are lower.
Changes in Fixed costs
Increases and decreases in the fixed cost do not have any impact on the P/V ratio but they change the break-even point. With the same P/V ratio, the rate of the fixed costs recovery remains the same.
1. Increase in fixed costs – If the fixed costs are increased, the breakeven point (break-even-volume) is higher. Profits above the break-even point are lower by the amount of the increase in fixed costs; below the break-even point losses increase by the amount of increase.
UNIVERSITY BUSINESS SCHOOL
2. Decrease in fixed costs – If the fixed costs are decreased, it lowers the break-even point. The profits are greater by the amount of the decrease, and losses are smaller by the amount of the decrease, and losses are smaller by the amount of the decrease in fixed costs.
Desired or Target profit
Sometimes, the management faces two decisions – 1.To increase sales volume through reduction in selling prices 2. To increase selling prices in case the P/V is low, with the expectation that a higher profit will be earned. These decisions should be taken carefully after studying the profit pattern and other factors; otherwise the results can be harmful particularly for those companies whose P/V is already low. Also, if reduction in selling prices does not increase the sales volume, the price reduction will result only in lower profits.The increase in sales volume required to overcome the effect of a price reduction is relatively greater when the rate of the contribution margin per unit is relatively low. If a product makes only a small contribution , then a reduction in selling price makes it all the more difficult to recover the fixed costs and to earn profits.Similarly, a business firm may think of increasing the selling price if the P/V ratio is low. However, increase in selling price may reduce the sales volume.
Suppose a company has the following present and proposed costs and selling price structure – Present Proposed
Selling price per unit Rs.100 Rs.120Variable cost per unit Rs.70 Rs.70Contribution per unit Rs.30 Rs.50P/V Ratio 30% 41.67%Increase in contribution - 20
Decrease in the present sales volume without effecting the present = 20/50 =40%.If there is a 20% increase in selling price, the sales volume should not decline by more than 40%. If decline in sales volume is less than 40% the profit position would be improved. Thus, any company with a P/V ratio of 30% can raise its selling price by 20% and absorbed a 40% reduction in sales volume without reduction in net income regardless of the amount of fixed costs.
Multi – Product Situations When there are multiple products with different contribution margins, the mix of products has a direct effect on the fixed costs recovery and total profits of the firm. Different products have different P/V ratios because of different selling prices and variable costs. Some products make larger contributions to fixed cost recovery and profit than others. The total profits depend to some extent upon the proportions in which the products are sold.
Prouduct A Product BUnit selling price Rs.10 Rs.20Variable costs Rs.4 Rs.16Marginal contribution Rs.6 Rs.4P/V ratio 60% 20%
UNIVERSITY BUSINESS SCHOOL
With comparatively low variable costs, product A has a relatively high P/V ratio; each unit of product A sold contributes Rs.6 to fixed costs recovery and profit. Product B, with comparatively high variable costs, has a low P/V ratio; each unit sold contributes only Rs.4 to fixed costs recovery and profit. Other things being equal, the sale of product A is more profitable than that of product B, despite the fact that the selling price of B is more than that of A. It is correct to say that profits will decline as the sales mix shifts from product A to B. This also implies, however, that new analysis of profit volume relationship must be made as the product-mix changes.Different combinations of sales mix (based on the above figure) will result in different net income. For example, if the total sales volume is Rs.100000 equally divided between the 2 products, the net income would be Rs.15000.
Sales mix and Break-even Point
Sales mix is the relatively proportion of each product line to the total sales of various products sold by an enterprise. As stated earlier, if there are no constraints or limitations, management should try to maximize the sales of the products with higher P/V ratio. However, a sales mix results because there are limitations on how much products can be sold.When different products have their own different production facilities, selling prices, variable costs and field costs separately, cost – volume profit analysis can be done for each product separately. But, in many situations, this is not found and different products share common facilities and have common fixed costs .In such a situation CVP analysis is performed by averaging the data using the sales mix of weights. The break-even point is computed for a specified sales mix and break even chart or P/V graph will show a constant sales mix for the total sales of different products, covering the costs and revenue lines as well. The sales necessary to achieve desired or target level of operating profit can be computed on the basis of specified sales mix. If the sales mix changes, CVP changes, break-even point, desired sales for target profit, costs and revenue lines will also change accordingly.
Formulas –BEP (Break-even point in Units) = Fixed cost / Weight contribution margin Break-even sales (Rs.) = Fixed cost / Total P/V ratio
UNIVERSITY BUSINESS SCHOOL
Desired Profit and Tax
The amount of desired profit before income taxes is treated as if it were additional fixed costs in finding out the sales units or sales revenue required to give the amount of desired profit. The usual formula – Desired sales unit = Fixed cost + Profit before Tax / Contribution margin per unitDesired sales revenue = Fixed cost + Profit before Tax / P/V ratioThe amount of desired profit can be mentioned as a profit after income taxes. In such a case, the profit before tax is calculated by the following formula: Profit before tax = Profit after Tax / (1- tax rate)
Improve Profit – Volume Ratio
P/V ratio can be improved by the following possible courses of action – • Increase the unit selling price of product.
• Reduction the product unit variable / marginal cost.
• Increase the share of high contribution margin products in a multiproduct company.
• Reducing the share of low contribution margin products in the total sales.
Cost indifference Point
A cost indifference point is that point at which total costs (fixed cost and variable cost) associated with the two alternatives is equal. There may be 2 methods or 2 alternatives of doing a thing, say 2 methods of production. It is also possible at a particular level of activity, one production method or method of doing a thing is superior to another, and vice versa.
According there is a need to know at which level of production, it will be preferable to shift from one production method to another production method. This level or point is known as cost indifference point and at this point total cost of 2 production methods are the same. Cost indifference point is useful in many decision situations, such as quality improvement schemes, different marketing plans, production plans or methods etc.Cost indifference point should be distinguished from break-even point. Break-even point compares total sales and total cost of a product. Also, at break-even point total cost line intersects total sales line. As stated above, cost indifference signifies equality of total costs of 2 alternatives or 2 methods of doing the same thing. At cost indifference point, total cost lines of 2 alternatives intersect each other.
Limitations of CVP Analysis
CVP analysis is a useful planning and control device, usually in the form of a chart , showing how revenue , costs and profits fluctuate with volume . The CVP technique is useful to management in areas of budgeting, cost control and decision making.
UNIVERSITY BUSINESS SCHOOL
In spite of CVP being a useful technique, it suffers from some limitations –
• It is difficult to classify exactly all the expenses into fixed and variable category. In fact, most of the expenses are neither totally variable nor wholly fixed in a realistic situation.
• Contribution itself is not a guide if there is some key or limiting factor. Therefore, contribution needs to be linked with key or limiting factor.
• Sales staff and marketing personnel may give undue importance to marginal cost as compared to total cost and decide to sell at a price based on marginal cost, which will result in low profits or losses.
• Fixed overheads cannot altogether be excluded particularly in large contracts while valuing work-in-progress. In other situations or business decisions as well, considered of fixed overheads becomes necessary to judge the performance and profitability.
• In a multiproduct situation, different products typically yield different contribution margins and are produced in various volumes with differing costs. As a result, neither the revenue curve nor the cost curve is necessarily straight and the break-even point is difficult to find.
Conclusion
Because of the many assumptions, CVP is only an approximation at best. If prices, unit costs, sales mix, operating efficiency, or other relevant factors change, then overall CVP analysis and relationships also must be modified. It is because of these assumptions; cost data are of limited significance.Therefore, while preparing or interpreting cost-volume profit analysis, all assumptions and limitations should be carefully considered. A series of CVP analysis based on different sets of assumptions and circumstances may be prepared to reflect situations prevailing in different business enterprises. When circumstances change, CVP analysis should also be revised to reflect the changing situations. It is also necessary to have up-to-date analysis so that it can act as a useful device in profit forecast, budgeting, cost control and managerial decision-making.
UNIVERSITY BUSINESS SCHOOL
FEW CASE STUDIES IN SUPPORT-
1.
UNIVERSITY BUSINESS SCHOOL
REFERENCES-
1. Cost Accounting, Jawaharlal, 5th edition, Mc-Graw Hill publication
2. Cost Accounting, Charles T. Horngren, 14th edition, Pearson publication
3. Asia Pacific Journal of Marketing & Management Review__ ISSN 2319-2836 Vol.2 (4), April (2013) Online available at indianresearchjournals.com
4. Internet, World Wide Web
5. Svetlana Saksonova University of Latvia, Managerial Accounting for Decision-making Leonardo da Vinci programme project of Entrepreneurs and Specialists in Latvia, Lithuania and Bulgaria” 2010
6. University of Calicut School of distance education, Cost accounting IV semesterCore course - b.com.Prepared by: 1. Sri. Vinesh Ottuparammal, Assistant professor
Smt. T. Shameera kunhu. T, Assistant professor,Govt. College, Malappuram