Embed Size (px)
Citation preview

Asset Management Plan
Author: James Johnstone, Project Engineer – Asset Management

Executive Summary
Introduction
The Town of Innisfil is located on the western side of Lake Simcoe in South-CentralOntario. It has a population of 32,727 (2011 census) and is expected to growsubstantially in the next 20 years. The Town is committed to making Innisfil “The Placeto be by 2020” and in so doing, has developed its Community Strategic Plan, InspiringInnisfil 2020. This plan is an important component of the overall success of thecommunity plan and the long term sustainability of the community.
This report is the second Asset Management Plan (AMP) completed by the Town ofInnisfil and addresses parks and buildings assets. The Town also has a long rangefinancial plan and model that will assist in identifying gaps and any corrective actionrequired to achieve asset management and service delivery objectives.
State of the Infrastructure
The state of the infrastructure for the Town of Innisfil’s parks and buildings providescurrently available information on several variables relating to the technical and financialaspects of parks and buildings assets. The variables that are summarized include:Inventory; Historical Cost, Amortization and Net Book Value; Replacement Cost;Service Life, Current Age and Proportion Utilization; and Condition.
Table E.1.1 - Asset Quantities, Replacement Cost ($000) and ConditionTypes Quantity Replacement Cost Condition
Building 41 $55,671 42%Splashpad 1 $132 95%Playground 30 $906 52%
Baseball 11 $686 25%Soccer 19 $616 60%
Basketball 8 $277 52%Tennis 2 $327 56%
Volleyball 1 $31 97%Skate Park 2 $203 0%Dog Park 1 $14 95%
Beach 6 $0 100%Total 121 $58,863 61%
Level of Service
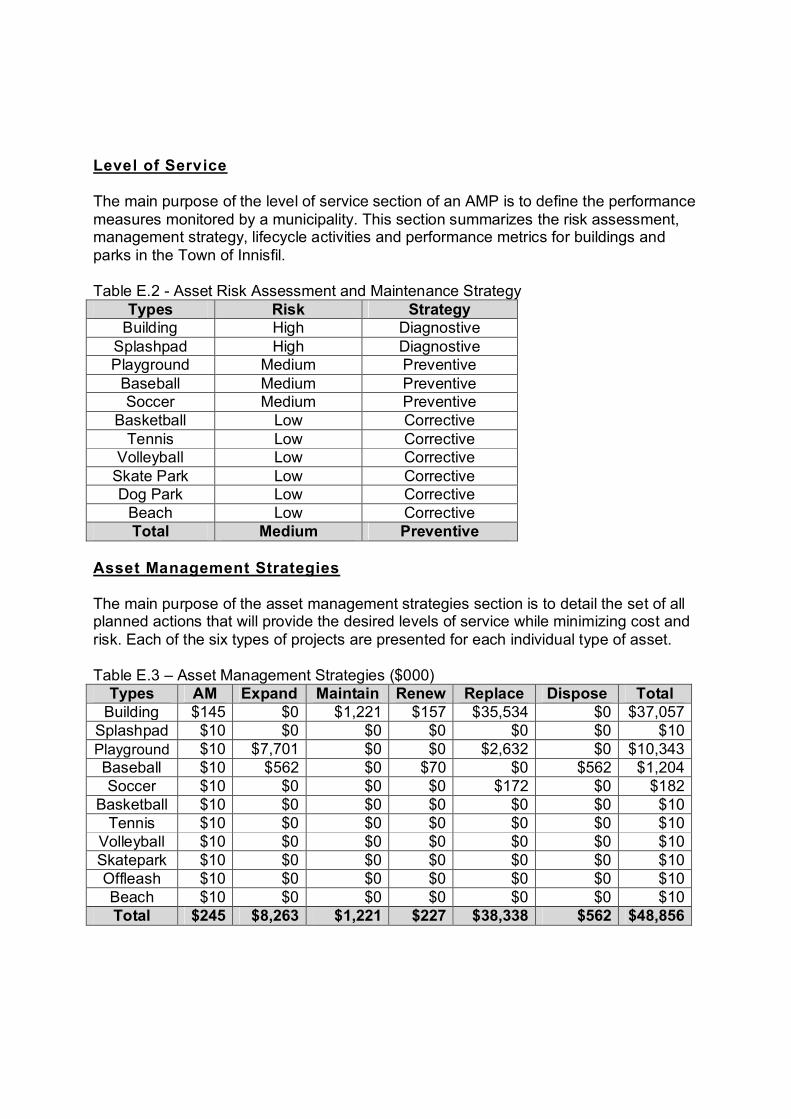
The main purpose of the level of service section of an AMP is to define the performancemeasures monitored by a municipality. This section summarizes the risk assessment,management strategy, lifecycle activities and performance metrics for buildings andparks in the Town of Innisfil.
Table E.2 - Asset Risk Assessment and Maintenance StrategyTypes Risk Strategy
Building High DiagnostiveSplashpad High DiagnostivePlayground Medium Preventive
Baseball Medium PreventiveSoccer Medium Preventive
Basketball Low CorrectiveTennis Low Corrective
Volleyball Low CorrectiveSkate Park Low CorrectiveDog Park Low Corrective
Beach Low CorrectiveTotal Medium Preventive
Asset Management Strategies
The main purpose of the asset management strategies section is to detail the set of allplanned actions that will provide the desired levels of service while minimizing cost andrisk. Each of the six types of projects are presented for each individual type of asset.
Table E.3 – Asset Management Strategies ($000)Types AM Expand Maintain Renew Replace Dispose Total
Building $145 $0 $1,221 $157 $35,534 $0 $37,057Splashpad $10 $0 $0 $0 $0 $0 $10Playground $10 $7,701 $0 $0 $2,632 $0 $10,343Baseball $10 $562 $0 $70 $0 $562 $1,204Soccer $10 $0 $0 $0 $172 $0 $182
Basketball $10 $0 $0 $0 $0 $0 $10Tennis $10 $0 $0 $0 $0 $0 $10
Volleyball $10 $0 $0 $0 $0 $0 $10Skatepark $10 $0 $0 $0 $0 $0 $10Offleash $10 $0 $0 $0 $0 $0 $10Beach $10 $0 $0 $0 $0 $0 $10Total $245 $8,263 $1,221 $227 $38,338 $562 $48,856

Financing Strategy
The final section of this AMP contains the financial plan needed to put the assetmanagement strategies identified into action. This section summarizes yearlyexpenditures, funding sources and provides a tabular summary of all expenditures.Total proposed and projected expenditures by asset and by year are summarizedbelow:
Table E.4 – Financing Strategy ($000)Year 2017 2018 2019-2026 Total
Building $602 $851 $35,674 $37,127Splashpad $10 $0 $0 $10Playground $1,335 $248 $8,760 $10,343Baseball $10 $0 $1,124 $1,134Soccer $10 $0 $172 $182
Basketball $10 $0 $0 $10Tennis $10 $0 $0 $10
Volleyball $10 $0 $0 $10Skatepark $10 $0 $0 $10Offleash $10 $0 $0 $10Beach $10 $0 $0 $10Total $2,027 $1,099 $45,730 $48,856
Conclusion
Infrastructure supports services vital to meeting daily resident needs and achievinglonger term community goals: the town hall provides a venue for council and publicmeetings, arenas provide a sanctuary for our national pastime in the depths of winter;and Innisfil Beach Park provides a respite in the summer amongst many other positiveyear round benefits. To facilitate the provision of these services, the Town possessesan extensive number of infrastructure assets that need to be properly maintained overthe course of their useful lives. To adequately plan for this extensive maintenanceprogram, this AMP has been completed using available information to provide anevolving guide for managing these important assets.

1. Introduction
1.1. Introduction
The Town of Innisfil is located on the western side of Lake Simcoe in South-CentralOntario. It has a population of 32,727 (2011 census) and is expected to growsubstantially in the next 20 years. The Town is committed to making Innisfil “The Placeto be by 2020” and in so doing, has developed its Community Strategic Plan, InspiringInnisfil 2020. This plan is an important component of the overall success of thecommunity plan and the long term sustainability of the community.
Infrastructure supports services vital to meeting daily resident needs and achievinglonger term community goals: the town hall provides a venue for council and publicmeetings, arenas provide a sanctuary for our national pastime in the depths of winter;and Innisfil Beach Park provides a respite in the summer amongst many other yearround positive benefits. To facilitate the provision of these services, the Townpossesses an extensive number of infrastructure assets that need to be properlymaintained over the course of their useful lives. In order to adequately plan for thisextensive maintenance program, this AMP has been completed using availableinformation to provide an evolving guide for managing these important assets.
1.2. Purposes and Goals
In 2012, Ontario’s Ministry of Infrastructure released “Building Together: Guide forMunicipal Asset Management Plans”. This guide provides a roadmap for municipalitiesto follow in order to sustainably manage their infrastructure. The goals of theseguidelines are to ensure that there is consistency in the approaches used bymunicipalities in the completion of their AMP. The Town of Innisfil has created this AMPincorporating all aspects of the guidelines to enable the Town to make the best possibledecisions regarding the design, performance, maintenance and costs of owning assetsacross their entire life-cycle.
The following is a list of goals that an AMP aims to achieve:
o To properly relate town-owned land parcels, the assets that are on them andthe work done to them to achieve performance targets;
o To properly value and assess the condition of infrastructure across majorasset classes;
o To properly track and evaluate metrics concerning the sustainability,effectiveness and efficiency of the services provided to customers;
o To adequately schedule life cycle activities of all assets includingacquisition/construction, operation, maintenance, rehabilitation anddisposal/replacement taking into account the results of the performancemetrics being tracked and;

o To properly plan for quantum and timing of revenue needed to fund theexpenditures identified for all life cycle activities of an asset.
1.3. Report Outline
Staff have developed this Asset Management Plan (AMP) in accordance with theProvince of Ontario’s Municipal Infrastructure Initiative (MIII) to create a sustainableplan for parks and facilities assets. To accomplish this, the asset management plan isbroken down into a number of components:
∂ Asset Management Frameworko Parcelso Facilitieso Serviceso Assetso Activitieso Outputso Metrics
∂ State of the Local Infrastructureo Inventoryo Historical Cost, Amortization and Net Book Valueo Replacement Costo Service Life, Current Age and Proportion Utilizationo Condition
∂ Desired Levels of Serviceo Risk Assessmento Maintenance Strategieso Performance Targets
∂ Asset Management Strategieso Non-Infrastructure (System) Activitieso Maintenance Activitieso Renewal/Rehabilitation Activitieso Replacement Activitieso Disposal Activitieso Expansion Activities
∂ Financing Strategyo 10-Year Expenditure Forecasto 10-Year Funding Forecast
1.4. Conclusion
The scope of this report is for the 10 years commencing 2017 and covers parks andfacilities assets. It should be noted that the Town of Innisfil does not own or operate anysocial housing related assets. It should also be noted that several gaps exist in thisreport which are summarized in the conclusion section. Last, this AMP is part of aniterative process where it will be continuously updated to reflect inventory, legislativeand budgetary changes when required.

2. Framework
2.1. Introduction
To implement effective asset management it is necessary to conceptualize the mainelements of the process in a readily understandable framework. This section outlinesthese main elements as defined by the Town of Innisfil which include: parcels; facilities;services; assets; activities; outputs; and metrics. The purpose of the framework is to tieall the elements of all the services across all of the land that the Town of Innisfil ownsinto one comprehensive system. Each element of the framework will be explained inseparate sub-sections before the results are presented for the four main components ofthe asset management plan.
2.2. Parcels
The importance of land parcels to ensure proper asset management occurs needs to beemphasized. By starting from individual land parcels (as provided by the MunicipalProperty Assessment Corporation) all land parcels owned by the Town of Innisfil areable to be identified and inventoried. All infrastructure is then assigned to one of theseparcels so that each asset has a location that is updated and verified on a continuouscycle. Table 2.1 – Parcels Inventory Summary shows that 50 municipal properties haveeither a park(s) or building(s) located on them which forms the starting point for thisAMP. Additionally, The Town of Innisfil has been divided into 13 settlement zones whichare also summarized in Table 2.1. Please refer to Table A.1 – Parcels Inventory locatedin Appendix A which lists each individual land parcel and its associated settlement zonelocated across the town.
Table 2.1 – Parcels Inventory Summary# Settlement Zones Quantity1 Innisfil Heights 12 Bethesda 03 Cookstown 54 Stroud 65 Barclay 66 Churchill 37 Fennell’s Corners 18 Big Bay Point 29 Sandy Cove 4
10 Alcona North 711 Alcona South 912 Lefroy – Belle Ewart 413 Gilford 2
Total NA 50

2.3. Facilities
Each of the 50 parcels owned by the Town contains either one park and/or one or morebuildings. Each park and building is considered a separate facility as defined in thisAMP. Appendix A Table A.2 – Parks Facilities Inventory and Table A.3 – BuildingsFacilities Inventory detail which parks or buildings are located on which parcels of land.The land ID from Table A.1 as well as unique identifiers for each park and building isincluded in Tables A.2 and A.3 such that parks and buildings can be linked back to theland inventory.
Table 2.2 – Facilities Inventory Summary presented below tabulates the number ofparks and buildings located in the town.
Table 2.2 - Facilities Inventory SummaryType FacilitiesParks 38
Buildings 41Total 79
2.4. Services
As previously discussed, there are multiple parks and buildings facilities located acrossthe Town. Each of these facilities provides one or more services to internal and externalstakeholders. Appendix B Table B.1 – Parks Services Inventory summarizes the tenservices that are covered under this plan for the 38 parks facilities and Table B.2 –Buildings Services Inventory summarizes the ten services that are delivered by theTown of Innisfil for the 41 building facilities. The classification of these buildings servicesare derived from the uniform classification scheme that was also used during therecently completed building condition assessments. Table 2.3 – Parks and BuildingsServices located below lists the ten services for parks and buildings facilities.
Table 2.3 - Parks and Buildings ServicesParks Buildings
Splash Pads FoundationPlaygrounds Frame
Baseball RoofSoccer Enclosure
Basketball InteriorTennis Conveyance
Volleyball PlumbingSkateboard HVAC
Dogs FireBeach Electrical

Tables 2.4 and 2.5 identify the presence/absence of the service at the facility not thequantity of assets located in a particular facility.2.5. Assets
Each of the 10 parks services and 10 buildings services potentially contain multipleassets. For example, the enclosure of a building is made up of multiple windows anddoors. Table 2.6 – Parks Asset Types provides examples of the different types of assetsthat each park service is made up of while Table 2.7 – Building Asset Types providesexamples of the different types of assets that each building service is made up of. Dueto the current lack of information for many of the parks and buildings assets not all assettypes outlined in the two tables have been included in this AMP. The specific assets thatare included in this AMP are outlined in the state of the infrastructure section of thisreport.
Table 2.4 – Parks Asset TypesServices Assets
Splash Pads ∂ Splash PadsPlaygrounds ∂ Playground Structures
Baseball ∂ Baseball DiamondsSoccer ∂ Soccer Fields
Basketball ∂ Basketball CourtsTennis ∂ Tennis Courts
Volleyball ∂ Volleyball CourtsSkateboarding ∂ Skate Parks
Dog Parks ∂ Offleash Dog ParksBeaches ∂ Beaches
Table 2.5 – Building Asset TypesServices Assets
Substructure ∂ FoundationsSuperstructure ∂ Frame
Roofing ∂ Roof Coverings
Enclosure ∂ Exterior Windows∂ Exterior Doors
Interiors ∂ Wall Finishes∂ Floor Finishes
Conveyance ∂ Elevators∂ Hoists
Plumbing ∂ Hot Water Heaters
HVAC ∂ Furnaces∂ Air Conditioners
Fire Protection ∂ Sprinklers∂ Extinguishers
Electrical ∂ Generators

∂ Light Fixtures
2.6. Activities
Similar to personal assets (automobile, home, driveway etc.), municipal infrastructureassets have an early-life, middle-life and later-life stages. The life cycle maintenanceactivities required are different for each asset for each of these stages. There aremultiple ways of organizing these activities and the Town has created eight types.
These eight activities summarized in Table 2.6 – Life Cycle Activities represent thedifferent engineering projects and public works operations that are conducted on theassets throughout their life cycle. How each of these activities relates to the six activitiesdefined in the building together guidelines are also presented. Staff have modified theguideline activities in order to better align how different activities are oriented withrespect to time. Progressing down the table generally moves from early-life to later-lifestages. Examples of each of the activities are provided to illustrate the types.
Table 2.6 - Life Cycle ActivitiesGuideline Activity Examples
Expansion/Replacement Acquiring ∂ Expansion∂ Reconstruction
Renewal/Rehabilitation Upgrading ∂ Addition∂ Betterment
Maintenance Operating ∂ Utilization∂ Production
Maintenance Diagnostive ∂ Inspection∂ Assessment
Maintenance Preventive ∂ Testing∂ Monitoring
Maintenance Corrective ∂ Repairing∂ Replacing
Renewal/Rehabilitation Rehabilitating ∂ Restoration∂ Renewal
Disposal Disposal ∂ Decommissioning∂ Abandonment
2.7. Outputs
The outputs of every organization may be divided into strategic, tactical and operationallevels. At the strategic level an output would be the provision of parks services town-wide; at the tactical level an output would be the engineering design by a consultant of anew park; at the operational-level an output would be the maintenance of a specificfence at a tennis court. Each of these outputs may be delivered by differentdepartments such as engineering or operations depending on the asset. Categorizingall of the outputs of specific activities is a long-term exercise for asset management at

the Town of Innisfil but staff have begun to create the databases to facilitateperformance monitoring in the future.2.8. Metrics
The last element of the asset management framework are performance metrics used bythe Town to monitor the delivery of services. Performance monitoring can be brokeninto 3 concepts: metrics, targets and timeframes. Long-term, the Town of Innisfil plansto develop metrics based off the seven elements in the framework. Multiplesustainability, effectiveness and efficiency metrics can be derived using these elements.
For example, total costs can be used to analyze a parcel of land, one facility on a parcelof land or the output of one activity on one asset. The scale at which one assessesperformance can occur across all six of the elements at strategic, tactical andoperational levels. Examples of sustainability, effectiveness and efficiency using theproject-management triangle are provided across elements to highlight howperformance is going to be measured at the Town.
Table 2.7 – Performance MetricsElement Metric
Sustainability
∂ Quality/Parcel∂ Quality/Facility∂ Quality/Service∂ Quality/Asset∂ Quality/Activity∂ Quality/Output
Effectiveness
∂ Scope/Parcel∂ Scope /Facility∂ Scope/Service∂ Scope/Asset∂ Scope/Activity∂ Scope/Output
Efficiency
∂ Cost/Parcel∂ Cost/Facility∂ Cost/Service∂ Cost/Asset∂ Cost/Activity∂ Cost/Output
2.9. Conclusion
In order to implement asset management, it is necessary to conceptualize the processfrom what drives it to what it is intended to achieve in a readily understandable fashion.This section of the report outlines the framework which details the seven elements thatthe Town uses in asset management. The purpose of the data framework is to tie all the

elements of all the services across all of the land that the Town of Innisfil owns into onecoherent system.
3. State of the Infrastructure
3.1. Introduction
The Town has a high-level inventory of its assets created for Public Sector AccountingBoard (PSAB) 3150 financial reporting purposes. The PSAB 3150 inventory wascompleted in 2008 and breaks down assets into the following categories: land; landimprovements; buildings; linear assets; leasehold improvements; machinery/equipment;vehicles; and work-in-progress. This inventory was used for the first AMP ontransportation, stormwater, drinking water and wastewater assets. Commencing Jan 1,2016 InnServices Utilities Inc., a wholly owned corporation of the Town of Innisfil,became the owner and operator of the water and wastewater assets. The sameinventory has also been used by staff to develop this parks and buildings assetmanagement plan.
This section will summarize the state of the infrastructure for the Town of Innisfil’s parksand buildings. It I should be emphasized that Innisfil recognizes the importance of anaccurate and detailed inventory of its assets as all subsequent components of an assetmanagement plan to flow from. The inventory presented in this section providescurrently available information on several variables relating to the technical and financialaspects of parks and building assets. Each of these variables or groups of relatedvariables form a sub-section in this section.
The following variables for each type of asset are outlined in this section:
o Inventoryo Historical Cost, Amortization and Net Book Valueo Replacement Costo Service Life, Current Age and Proportion Utilizationo Condition
3.2. Asset Quantity
Quantity refers to the number of individual assets such as one baseball diamond or onesoccer field. In the future, the extent of each of these parks and buildings assets will bedetermined which refers to size or scale such as acres or square feet. Buildings areconsidered as one larger, comprehensive asset instead of breaking them up into sub-systems or services outlined in the previous section due to the quality of informationavailable at this time. A more detailed inventory is in progress to gather this informationso that buildings can be more properly broken up into constituent parts for assetmanagement and life cycle maintenance activities.

Parks assets were broken up into constituent parts at a high-level. For example, thetechnical and financial aspects of baseball diamonds were available for the wholebaseball diamond. However, detailed information related to the number of fences,benches, infields and outfields will need to be inventoried in the future. The quantity ofbuildings and parks assets are summarized in Table 3.1 – Asset Quantities. Each of thequantities presented are carried forwarded to all subsequent sub-sections of thissection.
Table 3.1 - Asset QuantitiesTypes Quantity
Buildings 41Splash Pads 1Playgrounds 30
Baseball 11Soccer 19
Basketball 8Tennis 2
Volleyball 1Skate parks 2Dog Parks 1Beaches 6
Total 121
3.3. Asset Historical Cost, Amortization and Net Book Value
Using available PSAB 3150 data and interpolated from existing data where necessary,the historical cost, amortization and net book value (historical cost minus amortization)were determined. It is important to note that beaches have costs but are not depreciableassets and were given a value of $1/beach. Values for all three variables are presented.
Table 3.2 – Asset Financial Accounting ValuationTypes Historical Cost Amortization Net Book Value
Buildings $42,306,753 $4,768,299 $37,538,454Splash Pads $130,534 $9,790 $120,744Playgrounds $768,711 $350,956 $417,757
Baseball $421,069 $259,014 $162,055Soccer $503,887 $269,035 $234,852
Basketball $236,463 $99,499 $136,964Tennis $284,524 $120,862 $163,662
Volleyball $30,793 $1,540 $29,253Skate parks $170,716 $170,716 $0Dog Parks $13,268 $995 $13,436Beaches $6 $0 $6

Total $44,866,720 $6,050,706 $38,817,179
3.4. Asset Replacement Cost Valuation
Replacement cost of assets were calculated using an inflation calculator from the Bankof Canada. The rate of inflation every year going back to 1914 is available based off theconsumer price index (CPI). It has been assumed that the rate of increase in CPI overlong periods of time generally matches the rate of inflation of infrastructure. Thereplacement values are presented in Table 3.3 – Asset Replacement Cost Valuation.
Table 3.3 - Asset Replacement Cost ValuationTypes Replacement Cost
Buildings $55,671,080Splash Pads $132,196Playgrounds $906,217
Baseball $685,666Soccer $616,060
Basketball $276,600Tennis $327,042
Volleyball $31,185Skate parks $203,385Dog Parks $13,607Beaches $0
Total $58,863,038
3.5. Asset Service Life, Current Age and Proportion Utilization
The service lives of assets were determined during PSAB 3150 implementation. Theseservices lives along with the current age of existing assets of buildings and parks arepresented. The remainder of service life minus current age represents the amount of anasset that has been utilized. This quantity is referred to as proportion utilization. Table3.4 – Asset Service Life, Current Age and Proportion Utilization presents values below.
Table 3.4 - Asset Service Life, Current Age and Proportion UtilizationTypes Service Life Current Age Proportion Utilization
Buildings 75 31 58%Splash Pads 20 1 5%Playgrounds 20 10 48%
Baseball 30 24 75%Soccer 20 8 40%
Basketball 25 12 48%Tennis 20 9 44%
Volleyball 30 1 3%Skate parks 10 10 100%Dog Parks 20 1 5%

Beaches NA NA 0%Average 27 11 39%
3.6. Condition
The last element of the state of the infrastructure is the condition of the asset. It is goodengineering practice to assess the condition of an asset using a multi-criteria evaluativeprocess. For example, the evaluation of a road is assessed during a roads needs studyuses surface, roadside and rideability amongst other factors to wholly assess the asset.Town staff are currently inventorying assets and a parks condition assessment will becompleted next year to aid in a holistic condition assessment process. In the interim, thecondition of parks and buildings asset assume linear deterioration similar to the financialdepreciation of assets. Table 3.5 – Asset Condition presents the calculated condition ofparks and buildings assets below.
Table 3.5 - Asset ConditionTypes Condition
Buildings 42%Splash Pads 95%Playgrounds 52%
Baseball 25%Soccer 60%
Basketball 52%Tennis 56%
Volleyball 97%Skate parks 0%Dog Parks 95%Beaches 100%Average 61%
3.7. Conclusion
This chapter has presented five groups of variables related to the technical and financialaspects of the parks and buildings assets owned by the Town. Several assumptionsand simplifications have been made in order to complete this report including theassumption that physical deterioration equals financial depreciation, and thesimplification of the components of buildings. Where data has been limited, severalreports have been used to build the inventory including development chargesbackground studies, building condition assessments and discussions with town staff.
Last, an important element of this AMP derived from its completion is the identificationof tools and procedures in order to maintain accuracy and completeness of the assetdata and calculations moving forward. A Data Verification Policy & ConditionAssessment Policy is being developed to address this existing deficiency. Last, someassets presented above only had costing available for the physical asset but did notincluded the engineering and staff time that would have also been inputted into theircreation. The Town will develop procedures and tools so that moving forward the value

of assets reflects not only infrastructure but associated staff and consultant costing inthese values.4. Level of Service
4.1. Introduction
The main purpose of the level of service section of an AMP is to define the performancemeasures, targets and timeframes to achieve targets of the services delivered by amunicipality. Municipalities deliver many services including those at parks and buildingsfacilities summarized in this AMP. Each of these services relates the many aspects ofthe framework presented in Section 2. This section will summarize the risk assessment,management strategy, lifecycle activities and performance metrics for buildings andparks in the Town of Innisfil.
4.2. Risk Assessment
This section begins by conducting a risk assessment on the assets covered by this plan.The Ministry of Infrastructure guideline document presents risk in the assetmanagement strategies component but the decision was made to include it here as riskis what drives service delivery. While risk is a tool that can be used to prioritize whichassets will be repaired or replaced, it is also a tool that can be used to drive whichmaintenance strategies will be followed with respect to a given asset. The samelikelihood and consequence variables can be utilized to qualitatively quantify risk for thedetermination of a maintenance strategy.
The risk assessment for assets covered by this plan incorporates two variables for thedetermination of risk. First, the likelihood of failure of an asset on a three-level scale oflow, medium and high is used to assess whether it is probable that an asset willgenerally fail. Second, the consequence of failure of an asset on a three-level scale oflow, medium and high is used to assess whether it the result of a failure would havedetrimental ramifications. The cross-product of likelihood and consequence results in arisk rating for all assets. All assets are important but using this approach allows formunicipalities to prioritize funding towards assets with greater risk.
Table 4.1 - Asset Risk AssessmentTypes Likelihood Consequence Risk
Buildings High High HighSplash Pads High High HighPlaygrounds Medium Medium Medium
Baseball Medium Medium MediumSoccer Medium Medium Medium
Basketball Low Low LowTennis Low Low Low
Volleyball Low Low LowSkate parks Low Low LowDog Parks Low Low Low

Beaches Low Low Low
4.3. Maintenance Strategy
Following the determination of risk, one of three maintenance strategies are applied toeach of the assets. Multiple strategies can be followed in the maintenance of assets.Incorporating eight lifecycle activities defined in Subsection 2.6, one of three strategiesare utilized by the Town of Innisfil. All assets have elements of each of these strategiesincorporated into their maintenance program but one strategy is used for each assetgreater than the others. For example, all parks and building assets have either a parkscondition assessment or a building condition assessment conducted on them every fiveyears. From a risk point of view, it is prudent to look at the entire land parcel holisticallyas compared to only assessing individual elements. This approach facilitates the long-term capital planning discussed in the next chapter. Each of these strategies is nowdiscussed in turn.
Corrective maintenance strategy: can be understood as a run-to-failure approach.These assets deliver important services but the risks associated with them are low andtherefore it is appropriate to maintain them less than other assets.Preventive maintenance strategy: is used for assets where risk is moderate andscheduled inspections and pre-emptive maintenance can lengthen the service life ofthese assets. Similar to oil changes for an automobile routine inspections on a withinyear (i.e. quarterly) and across year (i.e. condition assessment every 5 years) basis areconducted.Diagnostive maintenance strategy: is utilized for assets that carry high risk. Legalrequirements or levels of service dictate that a higher level maintenance strategy isrequired for these assets.
Table 4.2 – Asset Maintenance Strategies defines which assets have been assignedwhich maintenance strategy.
Table 4.2 - Asset Maintenance StrategyTypes Strategy
Buildings DiagnostiveSplash Pads DiagnostivePlaygrounds Preventive
Baseball PreventiveSoccer Preventive
Basketball CorrectiveTennis Corrective
Volleyball CorrectiveSkate parks CorrectiveDog Parks CorrectiveBeaches Corrective

4.4. Life Cycle Activities
The specific activities for each asset are in the process of being defined for all buildingsand parks assets including those building assets not covered in the state of theinfrastructure section. With respect to buildings, fire protection systems and elevatorshave been assigned a diagnostive maintenance strategy; roofs, enclosures, interiors,plumbing, HVAC and electrical assets have been assigned a preventive maintenancestrategy; foundations and frames have been assigned a corrective maintenancestrategy. Future revisions of this plan will provide more detailed lifecycle activities for all10 buildings assets and all 10 parks assets.
The eleven assets covered by this AMP according to their maintenance strategy havecertain lifecycle activities completed on them. Using a bottom-up approach, assets witha corrective strategy are repaired as needed; assets with a planned strategy arerepaired as needed and also inspected routinely; assets with a diagnostive strategy arerepaired as needed, inspected routinely and follow testing schedules.
Table 4.3 – Buildings and Parks Asset Lifecycle Activities shows how strategy relates toactivities. Staff is currently defining specific activities for each of the assets and willincorporate these corrective, preventive and diagnostive work orders into the worktechsystem used for maintenance management.
Table 4.3 – Asset Maintenance ActivitiesAssets Strategy Life Cycle Activities
Buildings Diagnostive∂ Scheduled testing∂ Routine inspections∂ Repair as needed.
Splash Pads Diagnostive∂ Scheduled testing∂ Routine inspections∂ Repair as needed.
Playgrounds Planned ∂ Routine inspections∂ Repair as needed.
Baseball Planned ∂ Routine inspections∂ Repair as needed.
Soccer Planned ∂ Routine inspections∂ Repair as needed.
Basketball Corrective ∂ Repair as needed
Tennis Corrective ∂ Repair as needed
Volleyball Corrective ∂ Repair as needed
Skate Parks Corrective ∂ Repair as needed
Dog Parks Corrective ∂ Repair as needed

Beaches Corrective ∂ Repair as needed
4.5. Performance Metrics
As outlined in Subsection 2.8, metrics can be used to assess performance across eachof the elements of the framework. Ideally, performance management would target andtrack metrics from land parcels down to the tangible output of a work activity but thisseries of metrics is at the developmental phase at the Town of Innisfil. In the future,operations, engineering, finance and information technology departments will coordinatetechnical and financial metrics across lifecycle phases and across elements of theframework in order to monitor performance with respect to efficiency, effectiveness andsustainability.
At the present time, the Town of Innisfil tracks performance at the group facilities level.Bottom-line costs for all parks and all buildings has been tracked at the Town for theprevious three years. In addition to cost only, cost per unit of dimension for both parks(hectares) and buildings (square footage) have been tracked. Cost per square foot hasremained relatively constant while parks cost have increased as smaller parks havebeen brought online across the 13 settlement zones of the Town. These metrics willcontinue to be tracked and further metrics across elements of the framework will bedeveloped in conjunction with the new performance monitoring specialist in order toassess performance of service delivery at Town of Innisfil.
Table 4.4 – Asset Performance MetricsBuildings Parks
ft2 Cost / ft2 Ha Cost / Ha2013 438,079 9 167.9 26,6392014 449,095 10 170.1 29,7562015 515,295 8 183.7 24,5102016 554,295 9 189.1 27,4232017 554,295 9 193.2 33,2962018 554,295 9 199.1 31,707
Conclusion
This section has presented the level of service strategy for the Town of Innisfil withrespect to asset management. Utilizing risk, three maintenance strategies for the elevenassets covered by the plan have been presented. Specific activities for individual assetsare being developed and in the short term will be put into work management software inorder to track effectiveness of work orders and projects. Additionally, performancemanagement will be strengthened in the short term as efficiency, effectiveness andsustainability metrics are developed across all asset systems at the Town.

5. Asset Management Strategies
5.1. Introduction
The main purpose of the asset management strategies section is to detail the set of allplanned actions that will provide the desired levels of service while minimizing cost andrisk. Each types of project across all six categories of projects are presented asseparate sub-sections and then summarized for each individual asset at the end of thesection.
As discussed in Section 2 and Section 4, the six guideline activities of the BuildingTogether guide are utilized in this AMP but the Town of Innisfil plans to utilize eightactivities which better match the lifecycle stages of assets and the associated projectsand operations that are done upon them. From the condition assessment project thatwas completed earlier this year, multiple needs were identified with the building assetssimilar to a roads needs study. A parks condition assessment is a project that will bediscussed below that is planned to be completed next year which will identify similarneeds for parks assets. This section summarizes all planned actions on the elevenassets discussed in this plan.
5.2. Asset Management Projects
5.2.1. Non-Infrastructure Projects
Table 5.1 – Non-Infrastructure Projects represent the capital projects necessary toachieve level of service goals with respect to non-infrastructure related activities.
Table 5.1 – Non-Infrastructure ProjectsClass Location Cost
Building Designated Substances Survey $45,000Building Facilities Master Plan $100,000
Splashpad Condition Assessment $10,000Playground Condition Assessment $10,000
Baseball Condition Assessment $10,000Soccer Condition Assessment $10,000
Basketball Condition Assessment $10,000Tennis Condition Assessment $10,000
Volleyball Condition Assessment $10,000Skateboard Condition Assessment $10,000Dog Parks Condition Assessment $10,000Beaches Condition Assessment $10,000
Total NA $245,000

5.2.2. Expansion Projects
Table 5.2 – Expansion Projects represent the capital projects necessary to achieve levelof service goals with respect to non-infrastructure related activities.
Table 5.2 - Expansion ProjectsClass Location Cost
Playground Sleeping Lion No.1 $488,750Playground LSAMI P3 $366,000Playground Innisvillage East $222,250Playground Sleeping Lion No.2 $1,400,000Playground LSAMI P4 $366,000Playground Innisvillage West $1,437,500Playground Alcona Community Park $1,032,000Playground Sleeping Lion No.3 $517,500Playground Big Bay Point $1,600,000Playground Cookstown Park Phase 3 $270,000
Baseball Innisfil Recreation Complex $281,250Baseball Innisfil Recreation Complex $281,250
Total NA $8,262,500

5.2.3. Maintenance Projects
Table 5.3 – Maintenance Projects represent the capital projects necessary to achievelevel of service goals with respect to non-infrastructure related activities.
Table 5.3 – Maintenance ProjectsClass Location Cost
Building Cookstown Quonset Enclosure $39,900Building Cookstown Theatre Foundation $26,100Building Cookstown Theatre Roof $13,000Building Cookstown Theatre Enclosure $6,650Building Cookstown Theatre Interiors $13,500Building Centennial Park Gatehouse Structure $26,250Building Centennial Park Storage Structure $26,250Building South Simcoe Police Station Enclosure $23,600Building Town Hall Roof $20,000Building Town Hall Roof $40,500Building Town Hall Enclosure $12,500Building Town Hall Enclosure $157,500Building Town Hall HVAC $35,000Building IRC Enclosure $15,000Building IRC Interiors $200,000Building IRC Interiors $117,000Building IRC HVAC #1 $20,000Building IRC Duct Cleaning/Air Balancing $20,000Building Churchill Community Centre Interiors $18,000Building Alcona Fire Station Roof $146,900Building IBP Gatehouse Interiors $14,750Building IBP Gatehouse Interiors $10,600Building IBP Garage Roof $18,000Building IBP Garage Interiors $13,600Building IBP West Pavilion Roof $39,000Building IBP West Pavilion Enclosure $39,000Building IBP Lakeside Pavilion Roof $39,000Building IBP Lakeside Pavilion Enclosure $39,000Building IBP Lakeside Pavilion Enclosure $11,850Building Lefroy Arena HVAC $15,000
Total NA $1,217,450

5.2.4. Renewal/Rehabilitation Projects
Table 5.4 – Renewal/Rehabilitation Projects represent the capital projects necessary toachieve level of service goals with respect to non-infrastructure related activities.
Table 5.4 – Renewal/Rehabilitation ProjectsClass Location Cost
Building Lefroy Arena Elevator $156,500Baseball Dempster Street Park $70,000
Total NA $226,500
5.2.5. Replacement Projects
Table 5.5 – Replacement Projects represent the capital projects necessary to achievelevel of service goals with respect to non-infrastructure related activities.
Table 5.5 – Replacement ProjectsClass Location Cost
Building Stroud Arena Building $17,800,000Building Centennial Park Pavilion Building $254,000Building Centennial Park Washroom $396,500Building Town Hall Interiors $77,000Building Town Hall Interiors $9,480Building IRC Roof $1,125,000Building IRC Enclosure $75,000Building IRC Interiors $15,000Building IRC Interiors $80,000Building IRC Plumbing $10,000Building IRC HVAC #2 $10,000Building IBP Gate House Enclosure $6,250Building IBP Snack Bar Enclosure $12,500Building IBP Lakeside Washroom Plumbing $28,000Building Lefroy Arena Plumbing $35,000Building Lefroy Arena Building $15,600,000
Playground To-Be-Determined $247,500Playground To-Be-Determined $247,500Playground To-Be-Determined $258,500Playground To-Be-Determined $258,500Playground To-Be-Determined $264,000Playground To-Be-Determined $264,000Playground To-Be-Determined $269,500Playground To-Be-Determined $269,500Playground To-Be-Determined $275,000Playground To-Be-Determined $275,000

Soccer Irrigation System $172,000Total NA $38,334,730
5.2.6. Disposal Projects
Table 5.6 – Disposal Projects represent the capital projects necessary to achieve levelof service goals with respect to non-infrastructure related activities.
Table 5.6 – Disposal ProjectsClass Location Cost
Baseball Innisfil Beach Park $281,250Baseball Innisfil Beach Park $281,250
Total NA $562,500
5.3. Asset Management Strategies
Each of the activities is individually summed for each type of asset along with allprojects for each asset. Table 5.7 – Asset Management Strategies ($000) presents thesummary of planned actions. The total dollar value in Table 5.7 represents potentiallymultiple projects or operations as presented in the sub-sections above. The prioritizationof projects was done by the consultant during the building condition assessment project.An approximate timeframe for when projects should be completed was recommendedand this schedule was followed.
Table 5.7 - Asset Management Strategies ($000)Types AM Expand Maintain Renew Replace Dispose Total
Building $145 $0 $1,221 $157 $35,534 $0 $37,057Splashpad $10 $0 $0 $0 $0 $0 $10Playground $10 $7,701 $0 $0 $2,632 $0 $10,343Baseball $10 $562 $0 $70 $0 $562 $1,204Soccer $10 $0 $0 $0 $172 $0 $182
Basketball $10 $0 $0 $0 $0 $0 $10Tennis $10 $0 $0 $0 $0 $0 $10
Volleyball $10 $0 $0 $0 $0 $0 $10Skatepark $10 $0 $0 $0 $0 $0 $10Offleash $10 $0 $0 $0 $0 $0 $10Beach $10 $0 $0 $0 $0 $0 $10Total $245 $8,263 $1,221 $227 $38,338 $562 $48,856
5.4. Conclusion
The section has detailed how levels of service defined in the last chapter will beachieved through six types of capital projects. The last sub-section of this section haspresented a summary of all planned projects for achieving objectives. Projects wereidentified from building condition assessments and discussions with staff. Now thatpriority projects have been identified, the next section will outline how these projects willbe funded over the course of the 10-year timeframe for this AMP.

6. Financing Strategy
6.1. Introduction
The last section of this AMP is the financial plan that puts the asset managementstrategies identified in the last section into action. This section summarizes yearlyexpenditures, funding sources and provides a tabular summary of all expenditures.
6.2. Historical Expenditures
This sub-sections summarizes historical expenditures on buildings and parks over theprevious four years. Please note that 2016 represents budgeted expenditures. Averagecapital expenditures related to parks and buildings totals $2-4 million per year.Forecasted expenditures fall within this average expenditure range.
Table 6.1 – Financing Strategy ($000) presents the historical expenditures on parks andbuildings capital projects.
Table 6.1 - Financing Strategy ($000)
Year 2012Actual
2013Actual
2014Actual
2015Actual
2016Budget
Buildings $1,185,448 $1,196,932 $6,184,250 $5,842,461 $294,664Parks $1,794,014 $823,844 $564,296 $862,757 $467,590Total $2,979,462 $2,020,776 $6,748,546 $6,705,218 $762,254

6.3. Yearly Expenditures
6.3.1. 2017 Expenditures ($000)
Table 6.2 – 2017 Expenditures ($000) represent the projects and total costs 5.6 –Disposal Projects presents the capital projects that have been budgeted and areproposed for completion in 2017.
Table 6.2 – 2017 Expenditures ($000)Class Project # Location Type Cost
Building PKS208 Designated Substances Survey AM $45Building PKS200 Facilities Master Plan AM $100
Splashpad PKS199.1 Condition Assessment AM $10Playground PKS199.2 Condition Assessment AM $10
Baseball PKS199.3 Condition Assessment AM $10Soccer PKS199.4 Condition Assessment AM $10
Basketball PKS199.5 Condition Assessment AM $10Tennis PKS199.6 Condition Assessment AM $10
Volleyball PKS199.7 Condition Assessment AM $10Skateboard PKS199.8 Condition Assessment AM $10Dog Parks PKS199.9 Condition Assessment AM $10Beaches PKS199.10 Condition Assessment AM $10
Playground PKS82 Sleeping Lion No.1 Expand $489Playground PKS91 LSAMI P3 Expand $366Playground PKS197 Innisvillage East Expand $222
Building PKS235 Cookstown Theatre Foundation Maintain $26Building PKS186 Town Hall Roof Maintain $20Building PKS177 South Simcoe Police Station Enclosure Maintain $24Building PKS280 IRC Enclosure Maintain $15Building PKS289 IRC HVAC #1 Maintain $20Building PKS295 Lefroy Arena HVAC Maintain $15Building PKS319 Town Hall HVAC Maintain $35Building PKS289 IRC Duct Cleaning/Air Balancing Maintain $20Building PKS262 Lefroy Arena Elevator Renew $157Baseball PKS133 Dempster Street Park Renew $70Building PKS287 IRC Plumbing Replace $10Building PKS174 Lefroy Arena Plumbing Replace $35Building PKS263 IRC HVAC #2 Replace $10
Playground PKS20.1 12th Line Park Replace $248Total NA NA NA $2,027

6.3.2. 2018 Expenditures ($000)
Table 6.3 – 2018 Expenditures ($000) represent the projects and total costs 5.6 –Disposal Projects presents the capital projects that have been budgeted and areproposed for completion in 2018.
Table 6.3 – 2018 Expenditures ($000)Class Project # Location Type Cost
Building PKS150 Centennial Park Pavilion Replace $254Building PKS28 Centennial Park Washroom Replace $397Building PKS142 IRC Interiors Replace $200
Playground PKS20.2 Pitt Street Park Replace $248Total NA NA NA $1,099
6.3.3. 2019 Expenditures ($000)
Table 6.4 – 2019 Expenditures ($000) represent the projects and total costs 5.6 –Disposal Projects presents the capital projects that have been budgeted and areproposed for completion in 2019.
Table 6.4 – 2019 Expenditures ($000)Class Project # Location Type Cost
Playground PKS83 Sleeping Lion No.2 Expand $1,400Playground PKS86 LSAMI P4 Expand $366Playground PKS198 Innisvillage West Expand $1,438
Building PKS233 Cookstown Quonset Enclosure Maintain $40Building PKS236 Cookstown Theatre Enclosure Maintain $7Building PKS206 IBP Gatehouse Interiors Maintain $15
Playground PKS20.3 Webster Boulevard Park Replace $259Total NA NA NA $3,525

6.3.4. 2020 Expenditures ($000)
Table 6.5 – 2020 Expenditures ($000) represent the projects and total costs 5.6 –Disposal Projects presents the capital projects that have been budgeted and areproposed for completion in 2020.
Table 6.5 – 2020 Expenditures ($000)Class Project # Location Type Cost
Playground PKS21 Alcona Community Park Expand $1,032Playground PKS85 Sleeping Lion No.3 Expand $518Playground PKS203 Big Bay Point Expand $1,600
Building PKS223 Centennial Park Gatehouse Structure Maintain $26Building PKS227 Centennial Park Storage Structure Maintain $26Building PKS237 Cookstown Theatre Roof Maintain $13Building PKS185 Town Hall Enclosure Maintain $13Building PKS206 IBP Gatehouse Interiors Maintain $11Building PKS231 Churchill Community Centre Interiors Maintain $18Building PKS238 Cookstown Theatre Interiors Maintain $14Building PKS291 IRC Interiors Maintain $117Building PKS281 IRC Enclosure Replace $75Building PKS317 Town Hall Interiors Replace $77
Playground PKS20.4 To-Be-Determined Replace $259Soccer PKS141 Irrigation System Replace $172
Baseball PKS215.1 Innisfil Beach Park Dispose $281Baseball PKS215.2 Innisfil Beach Park Dispose $281
Total NA NA NA $4,533
6.3.5. 2021 Expenditures ($000)
Table 6.6 – 2021 Expenditures ($000) represent the projects and total costs 5.6 –Disposal Projects presents the capital projects that have been budgeted and areproposed for completion in 2021.
Table 6.6 – 2021 Expenditures ($000)Class Project # Location Type Cost
Playground PKS216 Cookstown Park Phase 3 Expand $270Building PKS282 IRC Interiors Replace $15
Playground PKS20.5 To-Be-Determined Replace $264Total NA NA NA $549

6.3.6. 2022 Expenditures ($000)
Table 6.6 – 2022 Expenditures ($000) represent the projects and total costs 5.6 –Disposal Projects presents the capital projects that have been budgeted and areproposed for completion in 2022.
Table 6.7 – 2022 Expenditures ($000)Class Project # Location Type Cost
Baseball PKS215.3 Innisfil Recreation Complex Expand $281Baseball PKS215.4 Innisfil Recreation Complex Expand $281Building PKS205 IBP Garage Roof Maintain $18Building PKS207 IBP Pavilion Enclosure Maintain $39Building PKS148 Alcona Fire Station Roof Maintain $147Building PKS240 IBP Lakeside Pavilion Enclosure Maintain $39Building PKS279 IBP West Pavilion Roof Maintain $39Building PKS315 Town Hall Roof Maintain $41Building PKS316 Town Hall Enclosure Maintain $158Building PKS318 Town Hall Interiors Replace $9Building PKS131 IRC Roof Replace $1,125Building PKS206 IBP Gatehouse Enclosure Replace $6Building PKS275 IBP Snack Bar Enclosure Replace $13Building PKS248 IBP Lakeside Washroom Plumbing Replace $28
Playground PKS20.6 To-Be-Determined Replace $264Total NA NA NA $2,488
6.3.7. 2023 Expenditures ($000)
Table 6.7 – 2023 Expenditures ($000) represent the projects and total costs 5.6 –Disposal Projects presents the capital projects that have been budgeted and areproposed for completion in 2023.
Table 6.8 – 2023 Expenditures ($000)Class Project # Location Type Cost
Building PKS202 IBP Lakeside Pavilion Enclosure Maintain $12Building PKS205 IBP Garage Interiors Maintain $14Building PKS286 IRC Interiors Maintain $80
Playground PKS20.7 To-Be-Determined Replace $270Total NA NA NA $376

6.3.8. 2024 Expenditures ($000)
Table 6.8 – 2024 Expenditures ($000) represent the projects and total costs 5.6 –Disposal Projects presents the capital projects that have been budgeted and areproposed for completion in 2024.
Table 6.9 – 2024 Expenditures ($000)Class Project # Location Type Cost
Playground PKS20.8 To-Be-Determined Replace $270Total NA NA NA $270
6.3.9. 2025 Expenditures ($000)
Table 6.9 – 2025 Expenditures ($000) represent the projects and total costs 5.6 –Disposal Projects presents the capital projects that have been budgeted and areproposed for completion in 2025.
Table 6.10 – 2025 Expenditures ($000)Class Project # Location Type Cost
Building PKS202 IBP Lakeside Pavilion Roof Maintain $39Building PKS136 Stroud Arena Replace $17,800
Playground PKS20.9 To-Be-Determined Replace $275Total NA NA NA $18,114
6.3.10. 2026 Expenditures ($000)
Table 6.10 – 2026 Expenditures ($000) represent the projects and total costs 5.6 –Disposal Projects presents the capital projects that have been budgeted and areproposed for completion in 2026.
Table 6.11 – 2026 Expenditures ($000)Class Project # Location Type Cost
Building PKS135 Lefroy Arena Replace $15,600Playground PKS20.10 To-Be-Determined Replace $275
Total NA NA NA $15,875

6.4. Total Expenditures
This section presents totals of proposed new or replacement capital expenditures forthe two years commencing 2017. A summary of projected expenditures from 2019-2026with a total of all expenditures proposed and projected for a ten year period. Table 6.11– Financing Strategy ($000) presents expenditure forecast for all eleven assets coveredby this plan. The total expenditures in Table 6.11 matches those in Table 5.7. Thedifference between the two tables is that the former breaks down the six types ofprojects that need to be completed whereas the latter summarizes when these projectswill be completed.
Table 6.12 - Financing Strategy ($000)Year 2017 2018 2019-2026 Total
Building $602 $851 $35,674 $37,127Splashpad $10 $0 $0 $10Playground $1,335 $248 $8,760 $10,343Baseball $10 $0 $1,124 $1,134Soccer $10 $0 $172 $182
Basketball $10 $0 $0 $10Tennis $10 $0 $0 $10
Volleyball $10 $0 $0 $10Skatepark $10 $0 $0 $10Offleash $10 $0 $0 $10Beach $10 $0 $0 $10Total $2,027 $1,099 $45,730 $48,856
6.5. Funding Strategy
The expenditures outlined in this plan have been fully costed and compared withfunding sources for the years 2017 and 2018 as part of the two-year proposed capitalbudget. Subsequent years have been reviewed and included for long-term planningpurposes. Four primary funding sources are applied to projects including discretionaryreserves, alternative revenue sources, obligatory reserves primarily developmentcharges) and external contributions. Each of these funding sources are summarized for2017, 2018 and future years. It should be noted that long term debt may be needed inyears beyond 2018 as a financing strategy with the subsequent annual debt servicingcosts provided through property taxation or other revenue sources in order to achievethe projected capital program.
Table 6.13 - Financing Strategy ($000)Year 2017 2018 2019-2026 Total
Discretionary $749 $1,074 $39,107 $40,930ARS $309 $0 $662 $971
Obligatory $969 $0 $5,961 $6,930

External $0 $25 $0 $25Total $2,027 $1,099 $45,730 $48,856
6.6. Conclusion
This last section of this AMP has summarized detailed yearly expenditures, total yearlyexpenditures and revenue sources for all projects comprised in asset managementstrategies section. For budget years 2017 and 2018 projects have been fully costed andfinanced with the remaining projects reviewed and included for long-term capitalplanning purposes. The funding strategy put forward in this section, supplemented bylong term debt, if needed, will allow the Town of Innisfil to meet levels of service for the10year period summarized in this AMP.

APPENDIX A

Table A.1 - Parcels InventoryLand ID Location Settlement ZoneLND-001 Knock Community Centre Innisfil HeightsLND-002 Cookstown Community Centre CookstownLND-003 Cookstown Trailhead CookstownLND-004 Old Cookstown Library CookstownLND-005 Cookstown Theatre CookstownLND-006 Kidd’s Lane Park CookstownLND-007 Dempster Street Park StroudLND-008 Stroud Fire Station StroudLND-009 Sunset Crescent Park StroudLND-010 Lawrence Avenue Park StroudLND-011 Stroud Arena Building StroudLND-012 Stroud Arena Park StroudLND-013 Centennial Community Centre BarclayLND-014 Old Operations Complex BarclayLND-015 South Simcoe Police Station BarclayLND-016 Town Hall BarclayLND-017 Innisfil Recreation Complex BarclayLND-018 Sand/Salt Facility BarclayLND-019 Coral Woods Park ChurchillLND-020 Churchill Community Centre ChurchillLND-021 Churchill Library ChurchillLND-022 Fennell’s Corners Park Fennell’s CornersLND-023 Pitt Street Park Big Bay PointLND-024 Linda Street Park Big Bay PointLND-025 12th Line Park Sandy CoveLND-026 Aspen Street Park Sandy CoveLND-027 Ireton Street Park Sandy CoveLND-028 Leonard’s Beach Park Sandy CoveLND-029 Trinity Street Park Alcona NorthLND-030 Huron Court Park Alcona NorthLND-031 Crossroads Park Alcona NorthLND-032 Andrade Memorial Park Alcona NorthLND-033 Warrington Way Park Alcona NorthLND-034 Alcona Fire Station Alcona NorthLND-035 Innisfil Beach Park Alcona NorthLND-036 Webster Boulevard Park Alcona SouthLND-037 Alcona Community Park Alcona SouthLND-038 Ashwood Avenue Park Alcona SouthLND-039 Anna Maria Avenue Park Alcona SouthLND-040 Lakeshore Library Alcona SouthLND-041 Hastings Avenue Park Alcona SouthLND-042 Previn Court Park Alcona SouthLND-043 Nantyr Park Alcona SouthLND-044 6th Line Park Alcona SouthLND-045 Church Street Park Lefroy – Belle EwartLND-046 Lefroy Arena Complex Lefroy – Belle EwartLND-047 Belle Ewart Park Lefroy – Belle EwartLND-048 Old Lefroy Fire Station Lefroy – Belle EwartLND-049 Circle Park GilfordLND-050 Orm Membery Park Gilford
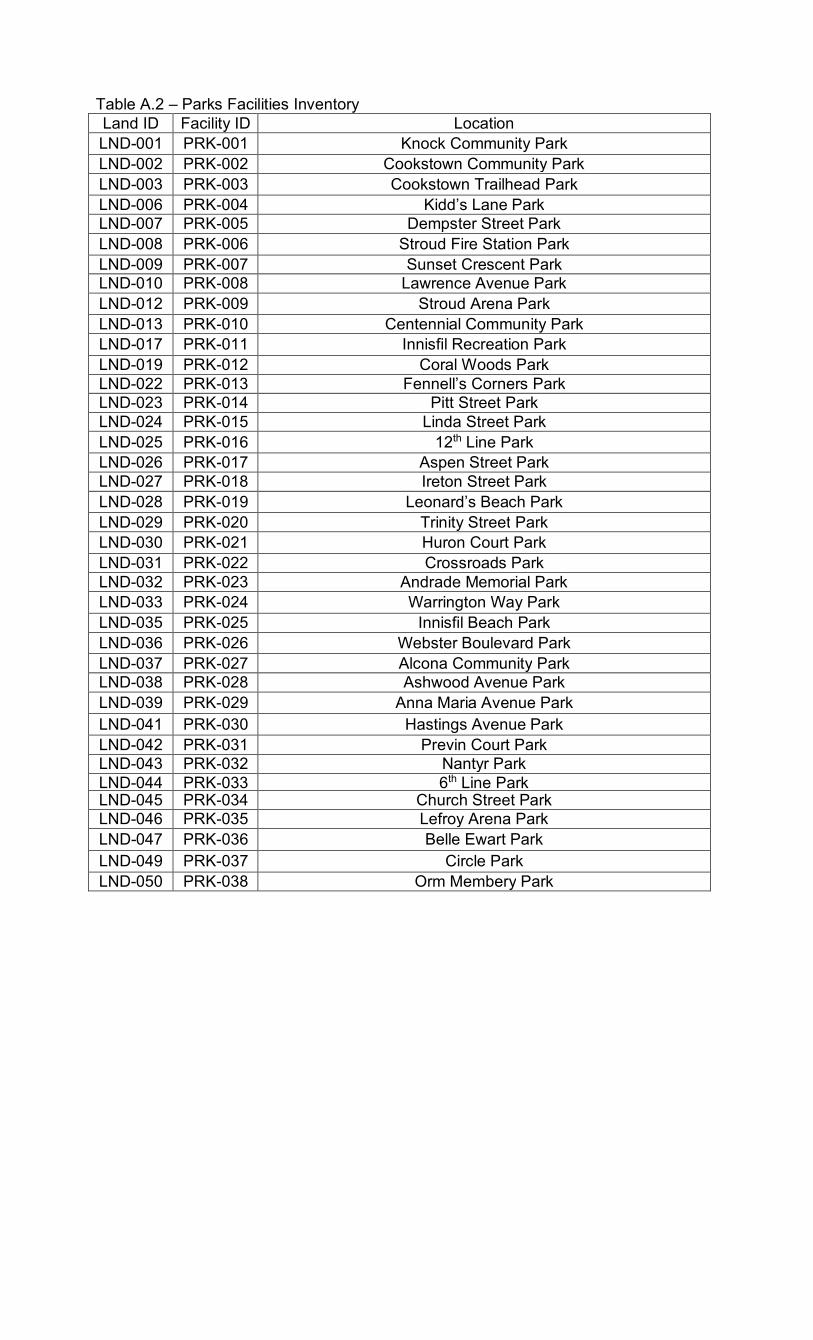
Table A.2 – Parks Facilities InventoryLand ID Facility ID LocationLND-001 PRK-001 Knock Community ParkLND-002 PRK-002 Cookstown Community ParkLND-003 PRK-003 Cookstown Trailhead ParkLND-006 PRK-004 Kidd’s Lane ParkLND-007 PRK-005 Dempster Street ParkLND-008 PRK-006 Stroud Fire Station ParkLND-009 PRK-007 Sunset Crescent ParkLND-010 PRK-008 Lawrence Avenue ParkLND-012 PRK-009 Stroud Arena ParkLND-013 PRK-010 Centennial Community ParkLND-017 PRK-011 Innisfil Recreation ParkLND-019 PRK-012 Coral Woods ParkLND-022 PRK-013 Fennell’s Corners ParkLND-023 PRK-014 Pitt Street ParkLND-024 PRK-015 Linda Street ParkLND-025 PRK-016 12th Line ParkLND-026 PRK-017 Aspen Street ParkLND-027 PRK-018 Ireton Street ParkLND-028 PRK-019 Leonard’s Beach ParkLND-029 PRK-020 Trinity Street ParkLND-030 PRK-021 Huron Court ParkLND-031 PRK-022 Crossroads ParkLND-032 PRK-023 Andrade Memorial ParkLND-033 PRK-024 Warrington Way ParkLND-035 PRK-025 Innisfil Beach ParkLND-036 PRK-026 Webster Boulevard ParkLND-037 PRK-027 Alcona Community ParkLND-038 PRK-028 Ashwood Avenue ParkLND-039 PRK-029 Anna Maria Avenue ParkLND-041 PRK-030 Hastings Avenue ParkLND-042 PRK-031 Previn Court ParkLND-043 PRK-032 Nantyr ParkLND-044 PRK-033 6th Line ParkLND-045 PRK-034 Church Street ParkLND-046 PRK-035 Lefroy Arena ParkLND-047 PRK-036 Belle Ewart ParkLND-049 PRK-037 Circle ParkLND-050 PRK-038 Orm Membery Park

Table 6.14 - Building Facilities InventoryLand ID Facility ID LocationLND-001 BDG-001 Knock Community Centre
LND-002BDG-002 Cookstown Community LibraryBDG-003 Cookstown Community Snack BarBDG-004 Cookstown Community Quonset Hut
LND-003 BDG-005 Cookstown Trailhead GazeboLND-004 BDG-006 Old Cookstown Library
LND-005 BDG-007 Cookstown TheatreBDG-008 Cookstown Theatre Garage
LND-008 BDG-009 Stroud Fire Station BuildingLND-011 BDG-010 Stroud Arena Building
LND-013
BDG-011 Centennial Community Gate House BuildingBDG-012 Centennial Community Washroom BuildingBDG-013 Centennial Community Storage BuildingBDG-014 Centennial Community Pavilion Building
LND-014
BDG-015 Old Operations Centre BuildingBDG-016 Old Operations Garage BuildingBDG-017 Old Operations Storage BuildingBDG-018 Old Operations Storage BuildingBDG-019 Old Operations Sand/Salt Building
LND-015 BDG-020 South Simcoe Police StationLND-016 BDG-021 Town Hall
LND-017 BDG-022 Innisfil Recreation Main BuildingBDG-023 Innisfil Recreation Garage Building
LND-018 BDG-024 Sand/Salt BuildingLND-020 BDG-025 Churchill Community BuildingLND-021 BDG-026 Churchill Library BuildingLND-034 BDG-027 Alcona Fire Station Building
LND-035
BDG-028 Innisfil Beach Garage BuildingBDG-029 Innisfil Beach Gate House BuildingBDG-030 Innisfil Beach Snack Bar BuildingBDG-031 Innisfil Beach Trailer Washroom BuildingBDG-032 Innisfil Beach West Washroom BuildingBDG-033 Innisfil Beach Soccer Washroom BuildingBDG-034 Innisfil Beach Lakeside Washroom BuildingBDG-035 Innisfil Beach West Pavilion BuildingBDG-036 Innisfil Beach Lakeside Pavilion Building
LND-040 BDG-037 Lakeshore Library BuildingLND-042 BDG-038 Previn Court Trellis BuildingLND-046 BDG-039 Lefroy Arena BuildingLND-047 BDG-040 Belle Ewart Pavilion BuildingLND-048 BDG-041 Old Lefroy Fire Station Building

APPENDIX B

Table B.1 - Park Services InventoryLand ID Facility ID Location Splash Pads Playgrounds Baseball Soccer Basketball Tennis Volleyball Skateboard Dogs BeachLND-001 PRK-001 Knock Community Park XLND-002 PRK-003 Cookstown Community Park X X XLND-003 PRK-004 Cookstown Trailhead ParkLND-006 PRK-005 Kidd’s Lane Park XLND-007 PRK-006 Dempster Street Park X XLND-009 PRK-007 Sunset Crescent Park X XLND-010 PRK-008 Lawrence Avenue Park XLND-012 PRK-009 Stroud Arena Park X X XLND-013 PRK-010 Centennial Community Park X X XLND-017 PRK-011 Innisfil Recreation Park X XLND-019 PRK-012 Coral Woods Park X XLND-022 PRK-013 Fennell’s Corners Park X XLND-023 PRK-015 Pitt Street Park X XLND-024 PRK-016 Linda Street Park XLND-025 PRK-017 12th Line Park X XLND-026 PRK-018 Aspen Street Park XLND-027 PRK-019 Ireton Street Park XLND-028 PRK-020 Leonard’s Beach Park X XLND-029 PRK-021 Trinity Street Park XLND-030 PRK-022 Huron Court Park X X XLND-031 PRK-023 Crossroads Park X X XLND-032 PRK-024 Andrade Memorial Park X XLND-033 PRK-025 Warrington Way Park X XLND-035 PRK-026 Innisfil Beach Park X X X X X X XLND-036 PRK-027 Webster Boulevard Park X XLND-037 PRK-028 Alcona Community ParkLND-038 PRK-029 Ashwood Avenue Park XLND-039 PRK-030 Anna Maria Avenue Park XLND-041 PRK-031 Hastings Avenue Park X XLND-042 PRK-032 Previn Court Park X XLND-043 PRK-033 Nantyr Park X X XLND-044 PRK-034 6th Line Park XLND-045 PRK-035 Church Street Park XLND-046 PRK-036 Lefroy Arena Park XLND-047 PRK-037 Belle Ewart Park X XLND-049 PRK-039 Circle ParkLND-050 PRK-040 Orm Membery Park X
Table B.2 – Building Services InventoryLand ID Facility ID Location Foundation Frame Roof Enclosure Interior Conveyance Plumbing HVAC Fire Electrical

Land ID Facility ID Location Foundation Frame Roof Enclosure Interior Conveyance Plumbing HVAC Fire ElectricalLND-001 BDG-001 Knock Community Centre X X X X X X X X XLND-002 BDG-002 Cookstown Community Library X X X X X X X X XLND-002 BDG-003 Cookstown Community Snack Bar X X X X X X X X XLND-002 BDG-004 Cookstown Community Quonset Hut X X X X X X X XLND-003 BDG-005 Cookstown Trailhead Gazebo X X XLND-004 BDG-006 Old Cookstown Library X X X X X X X X XLND-005 BDG-007 Cookstown Theatre X X X X X X X X XLND-005 BDG-008 Cookstown Theatre Garage X X X X XLND-008 BDG-009 Stroud Fire Station Building X X X X X X X X XLND-011 BDG-010 Stroud Arena Building X X X X X X X X X XLND-013 BDG-011 Centennial Community Gate House Building X X X X X XLND-013 BDG-012 Centennial Community Washroom Building X X X X X X X XLND-013 BDG-013 Centennial Community Storage Building X X X X XLND-013 BDG-014 Centennial Community Pavilion Building X X X X XLND-014 BDG-015 Old Operations Centre Building X X X X X X X X X XLND-014 BDG-016 Old Operations Garage Building X X X X XLND-014 BDG-017 Old Operations Storage Building X X XLND-014 BDG-018 Old Operations Storage Building X X XLND-014 BDG-019 Old Operations Sand/Salt Building X X X XLND-015 BDG-020 South Simcoe Police Station X X X X X X X X X XLND-016 BDG-021 Town Hall X X X X X X X X X XLND-017 BDG-022 Innisfil Recreation Main Building X X X X X X X X X XLND-017 BDG-023 Innisfil Recreation Garage Building X X X X XLND-018 BDG-024 Sand/Salt Building X X X X X X X X XLND-020 BDG-025 Churchill Community Building X X X X X X X X XLND-021 BDG-026 Churchill Library Building X X X X X X X X XLND-034 BDG-027 Alcona Fire Station Building X X X X X X X X XLND-035 BDG-028 Innisfil Beach Garage Building X X X X X X X X XLND-035 BDG-029 Innisfil Beach Gate House Building X X X X X X X X XLND-035 BDG-030 Innisfil Beach Snack Bar Building X X X X X X X X XLND-035 BDG-031 Innisfil Beach Trailer Washroom Building X X X X X X X XLND-035 BDG-032 Innisfil Beach West Washroom Building X X X X X X X XLND-035 BDG-033 Innisfil Beach Soccer Washroom Building X X X X X X X XLND-035 BDG-034 Innisfil Beach Lakeside Washroom Building X X X X X X X XLND-035 BDG-035 Innisfil Beach West Pavilion Building X X XLND-035 BDG-036 Innisfil Beach Lakeside Pavilion Building X X XLND-040 BDG-037 Lakeshore Library Building X X X X X X X X XLND-042 BDG-038 Previn Court Trellis Building X XLND-046 BDG-039 Lefroy Arena Building X X X X X X X X X XLND-047 BDG-040 Belle Ewart Pavilion Building X X XLND-048 BDG-041 Old Lefroy Fire Station Building X X X X X X X X X