Embed Size (px)
Citation preview
1
Presentation to EMT, January 18, 2007
Asset Condition Assessment
2
Power Transformer Assessment Health Index, Risk Analysis and Long Term Program Development January 2007
3
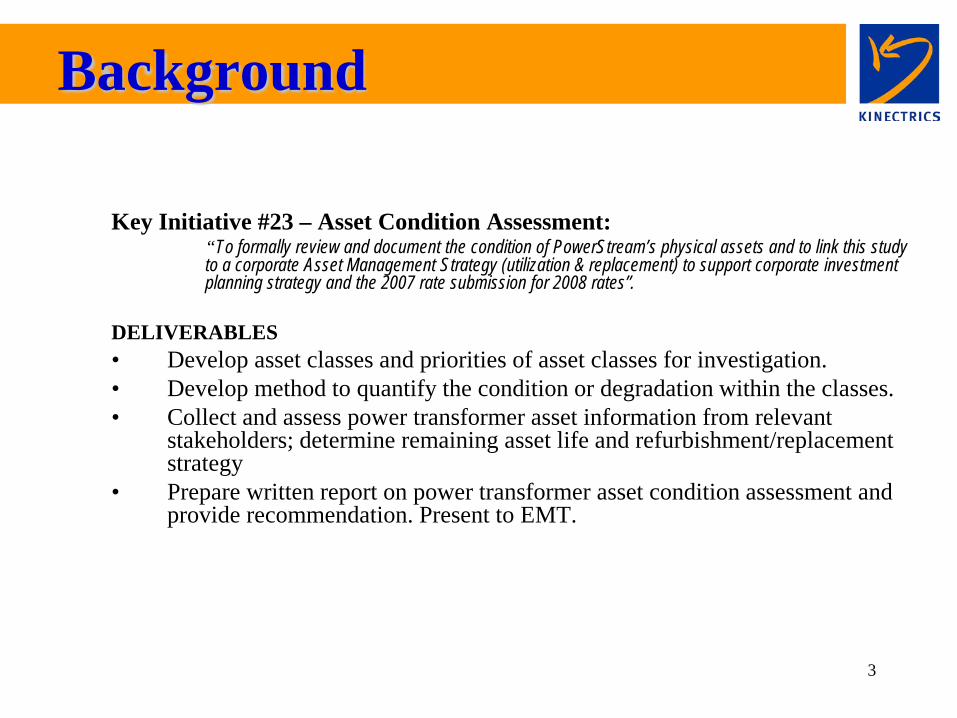
Key Initiative #23 – Asset Condition Assessment: “To formally review and document the condition of PowerStream’s physical assets and to link this study
to a corporate Asset Management Strategy (utilization & replacement) to support corporate investment planning strategy and the 2007 rate submission for 2008 rates”.
DELIVERABLES • Develop asset classes and priorities of asset classes for investigation. • Develop method to quantify the condition or degradation within the classes. • Collect and assess power transformer asset information from relevant
stakeholders; determine remaining asset life and refurbishment/replacement strategy
• Prepare written report on power transformer asset condition assessment and provide recommendation. Present to EMT.
Background
4
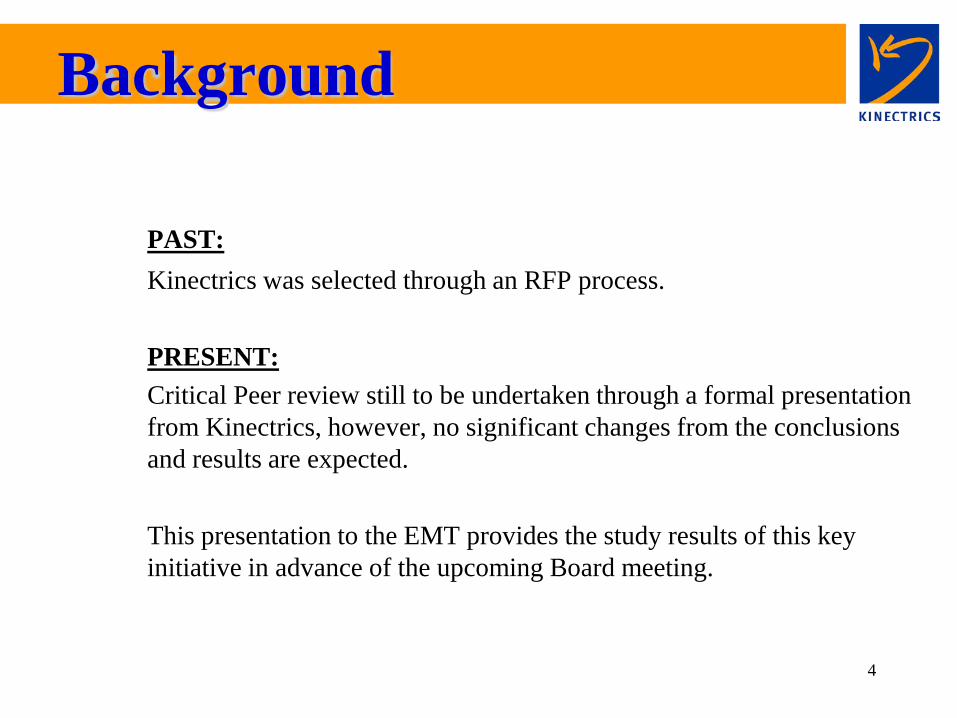
PAST: Kinectrics was selected through an RFP process. PRESENT: Critical Peer review still to be undertaken through a formal presentation
from Kinectrics, however, no significant changes from the conclusions and results are expected.
This presentation to the EMT provides the study results of this key
initiative in advance of the upcoming Board meeting.
Background
5
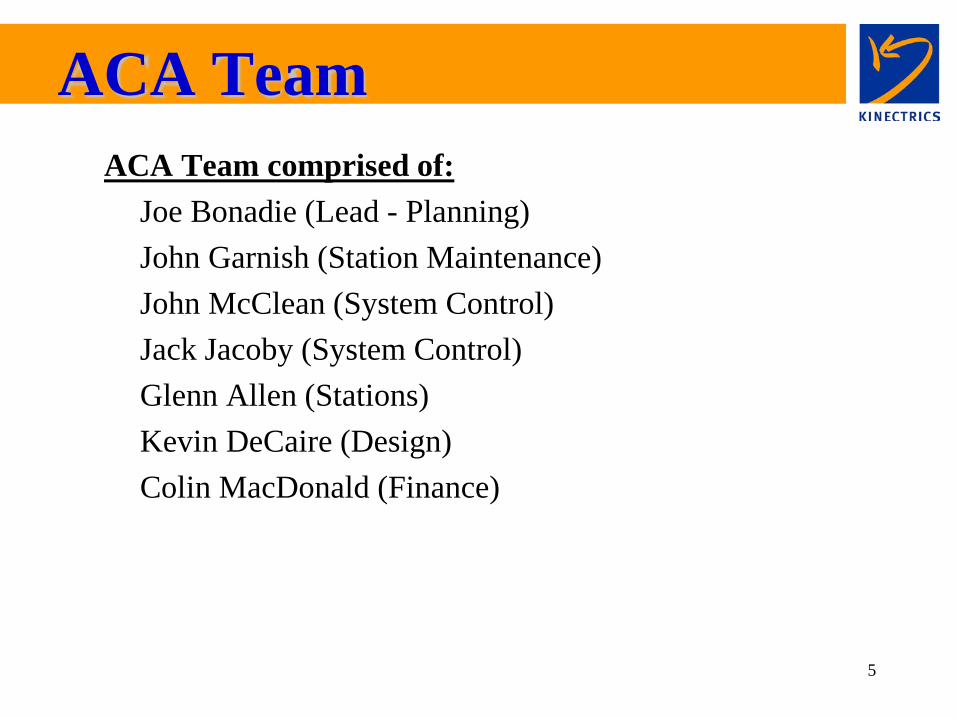
ACA Team comprised of: Joe Bonadie (Lead - Planning) John Garnish (Station Maintenance) John McClean (System Control) Jack Jacoby (System Control) Glenn Allen (Stations) Kevin DeCaire (Design) Colin MacDonald (Finance)
ACA Team
6
1. The Asset Management Framework
1. The Asset Management Framework
2. Asset Evaluations
3. Program Development and Spare Analysis
4. Conclusions
Appendices
1
2
3
4
7
Asset Management Framework
BU
DG
ET
ING
Program DevelopmentAsset Evaluations Risk-Based
AnalysesAsset
Programs
DA
TA
♦ Inventory♦ Degradation♦ HI formulation♦ HI Results♦ Failure conseq.♦ Failure prob.
♦ B/C parameters♦ Discount rate♦ Analytic. Meth.♦ Interventions
♦ Spending req.♦ Prioritization♦ Cost of delay♦ Benefits B
UD
GE
TIN
G
Program DevelopmentAsset Evaluations Risk-Based
AnalysesAsset
Programs
DA
TA
♦ Inventory♦ Degradation♦ HI formulation♦ HI Results♦ Failure conseq.♦ Failure prob.
♦ B/C parameters♦ Discount rate♦ Analytic. Meth.♦ Interventions
♦ Spending req.♦ Prioritization♦ Cost of delay♦ Benefits
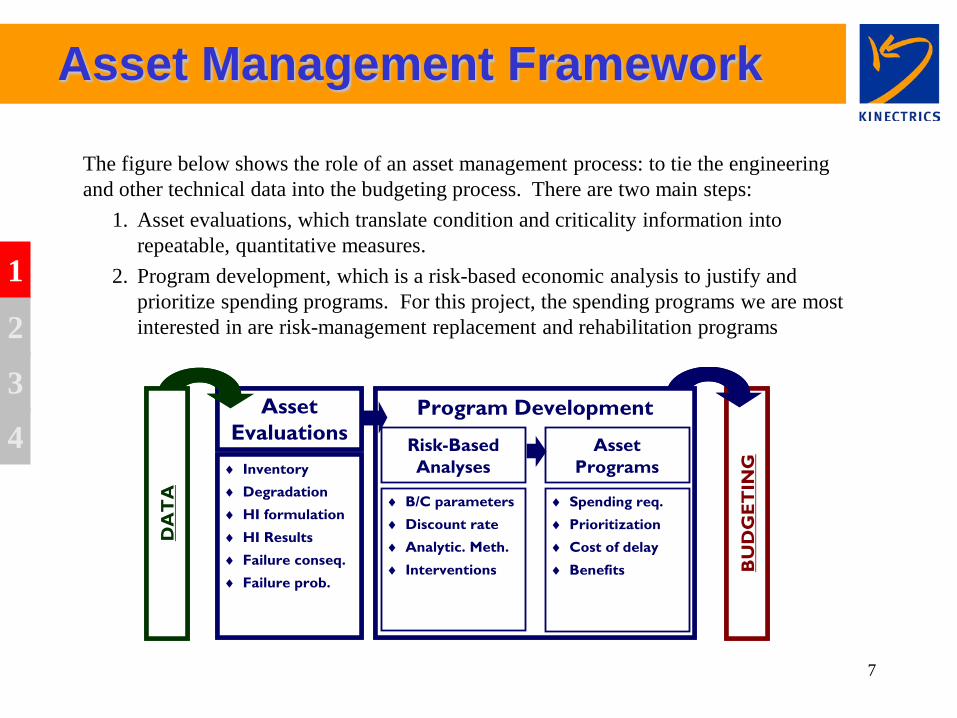
The figure below shows the role of an asset management process: to tie the engineering and other technical data into the budgeting process. There are two main steps:
1. Asset evaluations, which translate condition and criticality information into repeatable, quantitative measures.
2. Program development, which is a risk-based economic analysis to justify and prioritize spending programs. For this project, the spending programs we are most interested in are risk-management replacement and rehabilitation programs
1
2
3
4
8
DATA
ASSET EVALUATIONS
PROGRAM DEVELOPMENT
BUDGETING
Station TransformersBathtub Curve
0%
2%
4%
6%
8%
10%
12%
0 10 20 30 40 50 60 70 80
Effective Age
Prob
abili
ty o
f Fai
lure
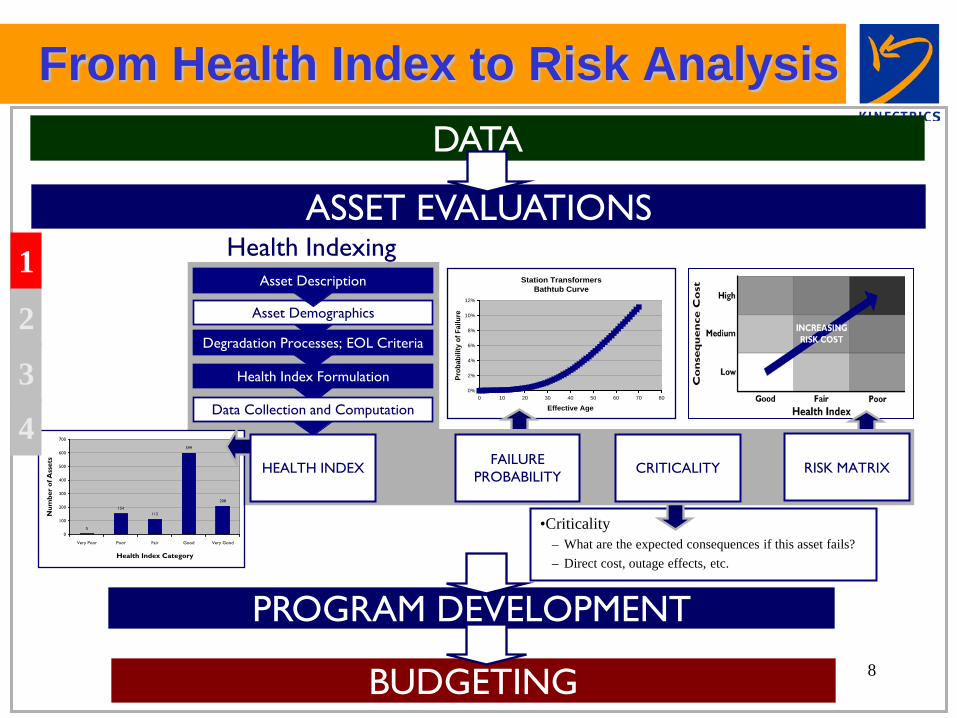
•Criticality – What are the expected consequences if this asset fails? – Direct cost, outage effects, etc.
Health Index Formulation
Asset Demographics
Asset Description
Degradation Processes; EOL Criteria
Data Collection and Computation
Health Indexing
RISK MATRIX FAILURE PROBABILITY CRITICALITY
5
154112
599
208
0
100
200
300
400
500
600
700
Very Poor Poor Fair Good Very Good
Health Index Category
Num
ber
of A
sset
s
HEALTH INDEX
From Health Index to Risk Analysis
1
2
3
4
9
Power Transformers – Summary Slide
ASSET GROUP Typical Life Expectancy Number (units) Estimated
Repl. Cost $M Criticality Data Availability
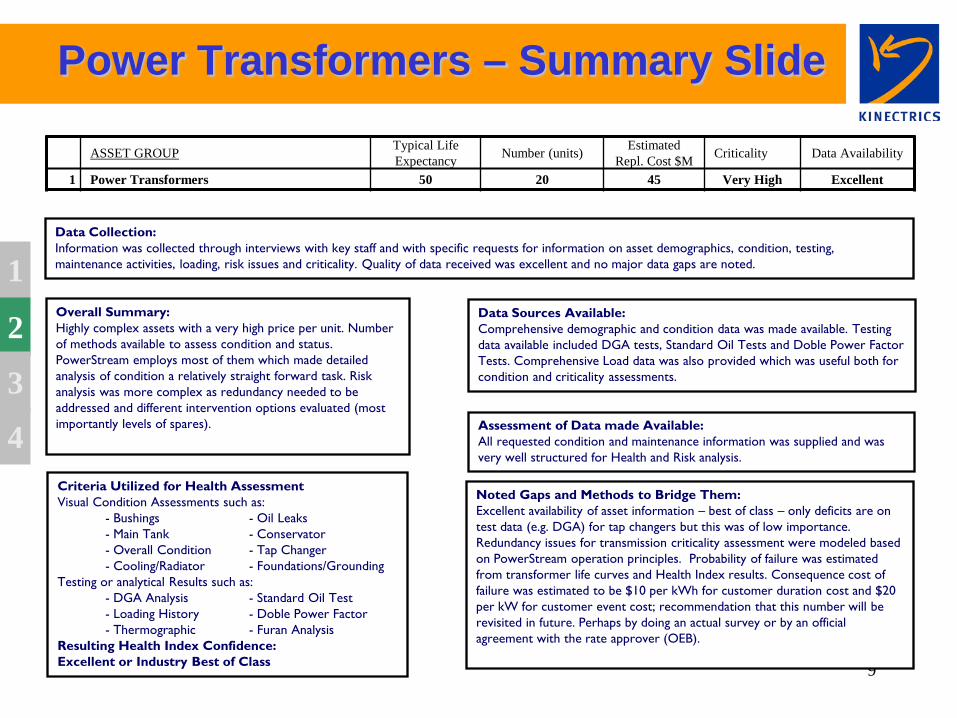
1 Power Transformers 50 20 45 Very High Excellent
Overall Summary: Highly complex assets with a very high price per unit. Number of methods available to assess condition and status. PowerStream employs most of them which made detailed analysis of condition a relatively straight forward task. Risk analysis was more complex as redundancy needed to be addressed and different intervention options evaluated (most importantly levels of spares).
Data Sources Available: Comprehensive demographic and condition data was made available. Testing data available included DGA tests, Standard Oil Tests and Doble Power Factor Tests. Comprehensive Load data was also provided which was useful both for condition and criticality assessments.
Assessment of Data made Available: All requested condition and maintenance information was supplied and was very well structured for Health and Risk analysis.
Noted Gaps and Methods to Bridge Them: Excellent availability of asset information – best of class – only deficits are on test data (e.g. DGA) for tap changers but this was of low importance. Redundancy issues for transmission criticality assessment were modeled based on PowerStream operation principles. Probability of failure was estimated from transformer life curves and Health Index results. Consequence cost of failure was estimated to be $10 per kWh for customer duration cost and $20 per kW for customer event cost; recommendation that this number will be revisited in future. Perhaps by doing an actual survey or by an official agreement with the rate approver (OEB).
Criteria Utilized for Health Assessment Visual Condition Assessments such as:
- Bushings - Oil Leaks - Main Tank - Conservator - Overall Condition - Tap Changer - Cooling/Radiator - Foundations/Grounding
Testing or analytical Results such as: - DGA Analysis - Standard Oil Test - Loading History - Doble Power Factor - Thermographic - Furan Analysis
Resulting Health Index Confidence: Excellent or Industry Best of Class
1
2
3
4
Data Collection: Information was collected through interviews with key staff and with specific requests for information on asset demographics, condition, testing, maintenance activities, loading, risk issues and criticality. Quality of data received was excellent and no major data gaps are noted.
10
Trans-former
Health Index
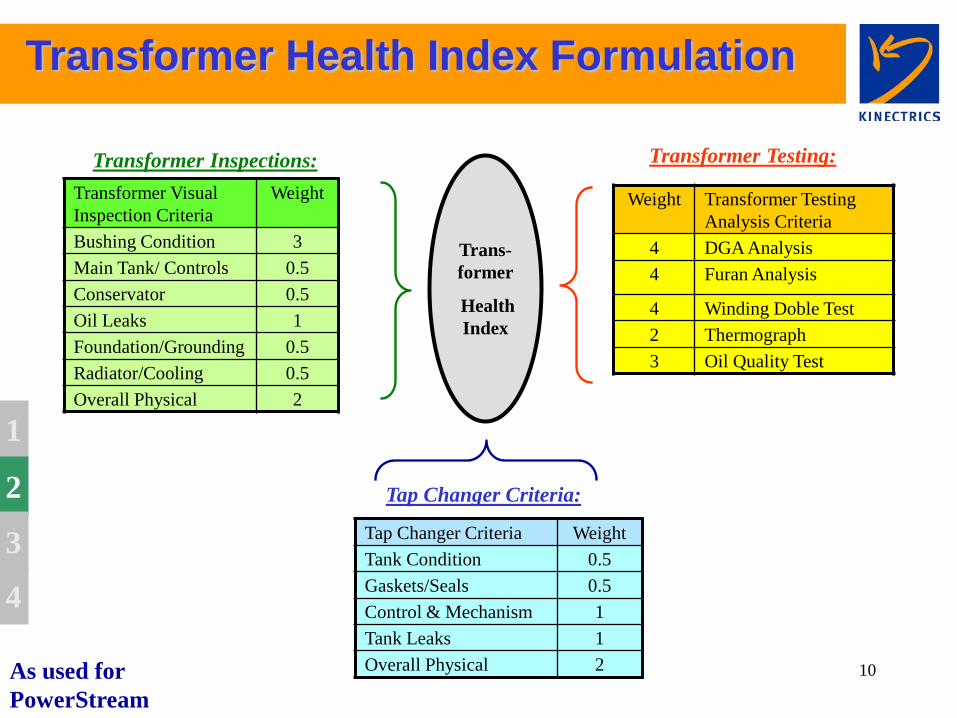
Transformer Visual Inspection Criteria
Weight
Bushing Condition 3 Main Tank/ Controls 0.5 Conservator 0.5 Oil Leaks 1 Foundation/Grounding 0.5 Radiator/Cooling 0.5 Overall Physical 2
Weight Transformer Testing Analysis Criteria
4 DGA Analysis 4 Furan Analysis
4 Winding Doble Test 2 Thermograph 3 Oil Quality Test
Transformer Inspections: Transformer Testing:
Tap Changer Criteria Weight Tank Condition 0.5 Gaskets/Seals 0.5 Control & Mechanism 1 Tank Leaks 1 Overall Physical 2
Tap Changer Criteria:
Transformer Health Index Formulation
As used for PowerStream
1
2
3
4
11
Transformer Health Index Results
1
2
3
4
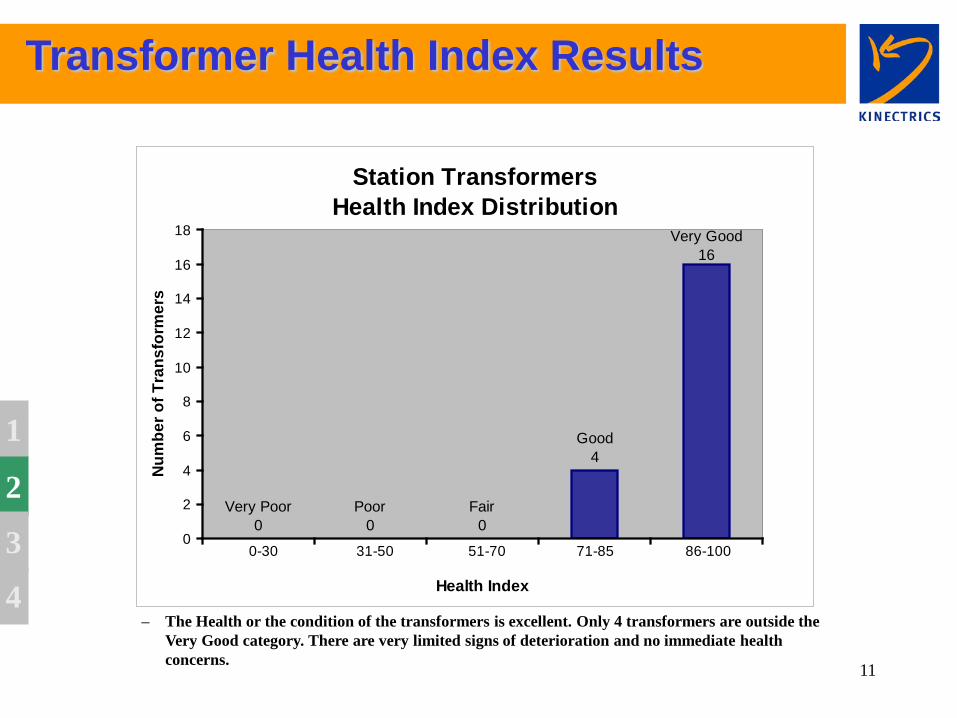
Station TransformersHealth Index Distribution
Very Poor0
Poor0
Fair0
Good4
Very Good16
0
2
4
6
8
10
12
14
16
18
Very Poor Poor Fair Good Very Good
Health Index
Num
ber o
f Tra
nsfo
rmer
s
0-30 31-50 51-70 71-85 86-100
– The Health or the condition of the transformers is excellent. Only 4 transformers are outside the Very Good category. There are very limited signs of deterioration and no immediate health concerns.
12
Transformer Health Index Results
1
2
3
4
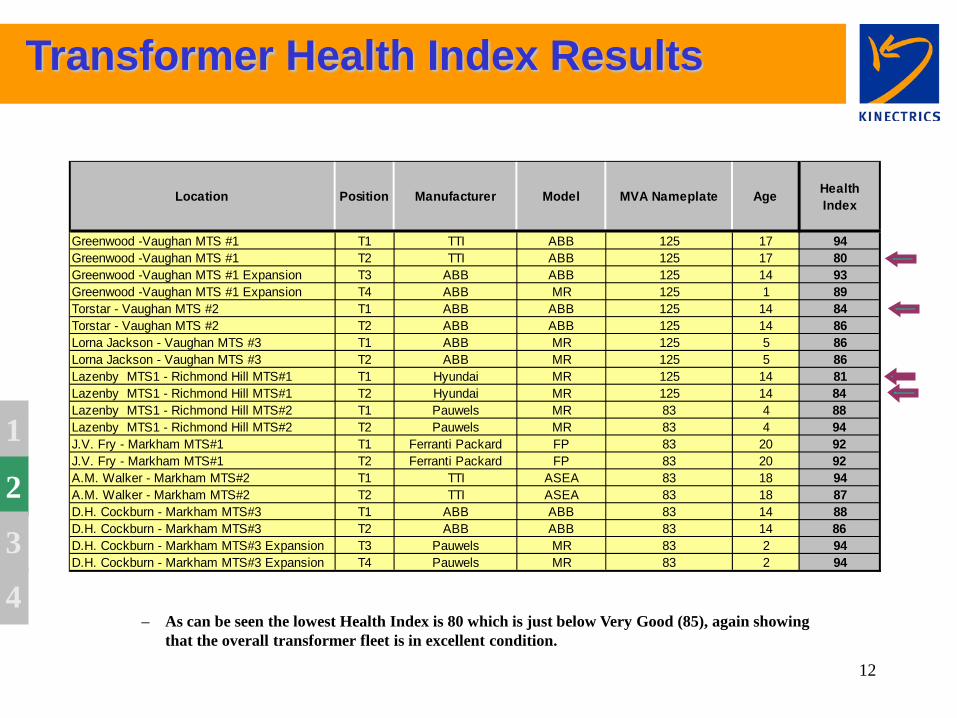
Location Position Manufacturer Model MVA Nameplate Age Health Index
Greenwood -Vaughan MTS #1 T1 TTI ABB 125 17 94Greenwood -Vaughan MTS #1 T2 TTI ABB 125 17 80Greenwood -Vaughan MTS #1 Expansion T3 ABB ABB 125 14 93Greenwood -Vaughan MTS #1 Expansion T4 ABB MR 125 1 89Torstar - Vaughan MTS #2 T1 ABB ABB 125 14 84Torstar - Vaughan MTS #2 T2 ABB ABB 125 14 86Lorna Jackson - Vaughan MTS #3 T1 ABB MR 125 5 86Lorna Jackson - Vaughan MTS #3 T2 ABB MR 125 5 86Lazenby MTS1 - Richmond Hill MTS#1 T1 Hyundai MR 125 14 81Lazenby MTS1 - Richmond Hill MTS#1 T2 Hyundai MR 125 14 84Lazenby MTS1 - Richmond Hill MTS#2 T1 Pauwels MR 83 4 88Lazenby MTS1 - Richmond Hill MTS#2 T2 Pauwels MR 83 4 94J.V. Fry - Markham MTS#1 T1 Ferranti Packard FP 83 20 92J.V. Fry - Markham MTS#1 T2 Ferranti Packard FP 83 20 92A.M. Walker - Markham MTS#2 T1 TTI ASEA 83 18 94A.M. Walker - Markham MTS#2 T2 TTI ASEA 83 18 87D.H. Cockburn - Markham MTS#3 T1 ABB ABB 83 14 88D.H. Cockburn - Markham MTS#3 T2 ABB ABB 83 14 86D.H. Cockburn - Markham MTS#3 Expansion T3 Pauwels MR 83 2 94D.H. Cockburn - Markham MTS#3 Expansion T4 Pauwels MR 83 2 94
– As can be seen the lowest Health Index is 80 which is just below Very Good (85), again showing that the overall transformer fleet is in excellent condition.
13
Inputs for Risk Analysis
1
2
3
4
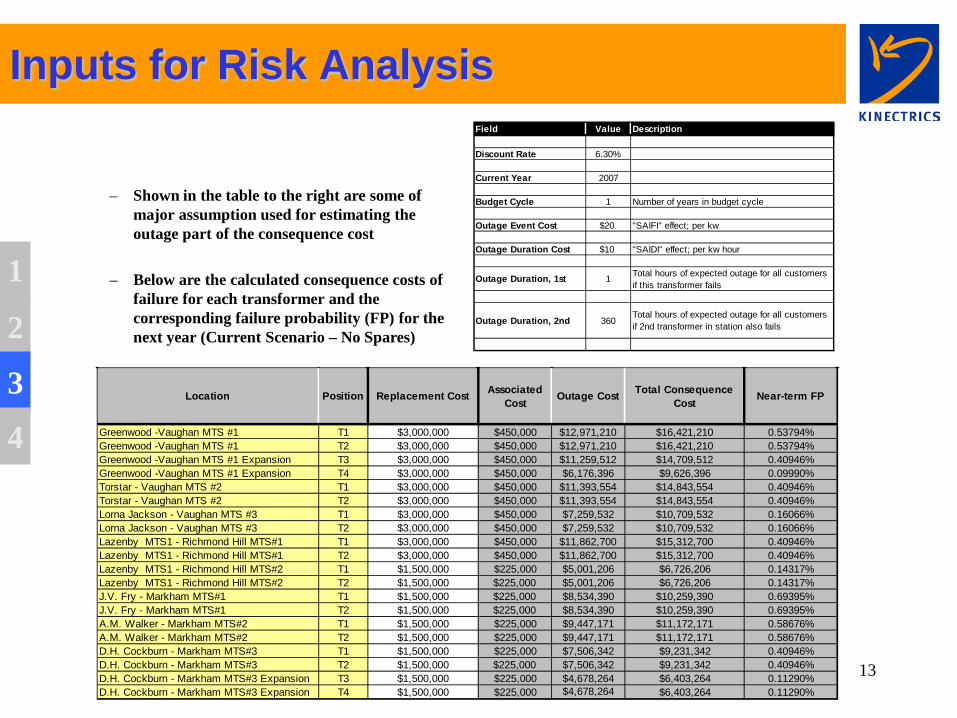
Field Value Description
Discount Rate 6.30%
Current Year 2007
Budget Cycle 1 Number of years in budget cycle
Outage Event Cost $20 "SAIFI" effect; per kw
Outage Duration Cost $10 "SAIDI" effect; per kw hour
Outage Duration, 1st 1 Total hours of expected outage for all customers if this transformer fails
Outage Duration, 2nd 360Total hours of expected outage for all customers if 2nd transformer in station also fails
Location Position Replacement Cost Associated Cost Outage Cost Total Consequence
Cost Near-term FP
Greenwood -Vaughan MTS #1 T1 $3,000,000 $450,000 $12,971,210 $16,421,210 0.53794%Greenwood -Vaughan MTS #1 T2 $3,000,000 $450,000 $12,971,210 $16,421,210 0.53794%Greenwood -Vaughan MTS #1 Expansion T3 $3,000,000 $450,000 $11,259,512 $14,709,512 0.40946%Greenwood -Vaughan MTS #1 Expansion T4 $3,000,000 $450,000 $6,176,396 $9,626,396 0.09990%Torstar - Vaughan MTS #2 T1 $3,000,000 $450,000 $11,393,554 $14,843,554 0.40946%Torstar - Vaughan MTS #2 T2 $3,000,000 $450,000 $11,393,554 $14,843,554 0.40946%Lorna Jackson - Vaughan MTS #3 T1 $3,000,000 $450,000 $7,259,532 $10,709,532 0.16066%Lorna Jackson - Vaughan MTS #3 T2 $3,000,000 $450,000 $7,259,532 $10,709,532 0.16066%Lazenby MTS1 - Richmond Hill MTS#1 T1 $3,000,000 $450,000 $11,862,700 $15,312,700 0.40946%Lazenby MTS1 - Richmond Hill MTS#1 T2 $3,000,000 $450,000 $11,862,700 $15,312,700 0.40946%Lazenby MTS1 - Richmond Hill MTS#2 T1 $1,500,000 $225,000 $5,001,206 $6,726,206 0.14317%Lazenby MTS1 - Richmond Hill MTS#2 T2 $1,500,000 $225,000 $5,001,206 $6,726,206 0.14317%J.V. Fry - Markham MTS#1 T1 $1,500,000 $225,000 $8,534,390 $10,259,390 0.69395%J.V. Fry - Markham MTS#1 T2 $1,500,000 $225,000 $8,534,390 $10,259,390 0.69395%A.M. Walker - Markham MTS#2 T1 $1,500,000 $225,000 $9,447,171 $11,172,171 0.58676%A.M. Walker - Markham MTS#2 T2 $1,500,000 $225,000 $9,447,171 $11,172,171 0.58676%D.H. Cockburn - Markham MTS#3 T1 $1,500,000 $225,000 $7,506,342 $9,231,342 0.40946%D.H. Cockburn - Markham MTS#3 T2 $1,500,000 $225,000 $7,506,342 $9,231,342 0.40946%D.H. Cockburn - Markham MTS#3 Expansion T3 $1,500,000 $225,000 $4,678,264 $6,403,264 0.11290%D.H. Cockburn - Markham MTS#3 Expansion T4 $1,500,000 $225,000 $4,678,264 $6,403,264 0.11290%
– Shown in the table to the right are some of major assumption used for estimating the outage part of the consequence cost
– Below are the calculated consequence costs of
failure for each transformer and the corresponding failure probability (FP) for the next year (Current Scenario – No Spares)
14
Investment Program with No Spares
1
2
3
4
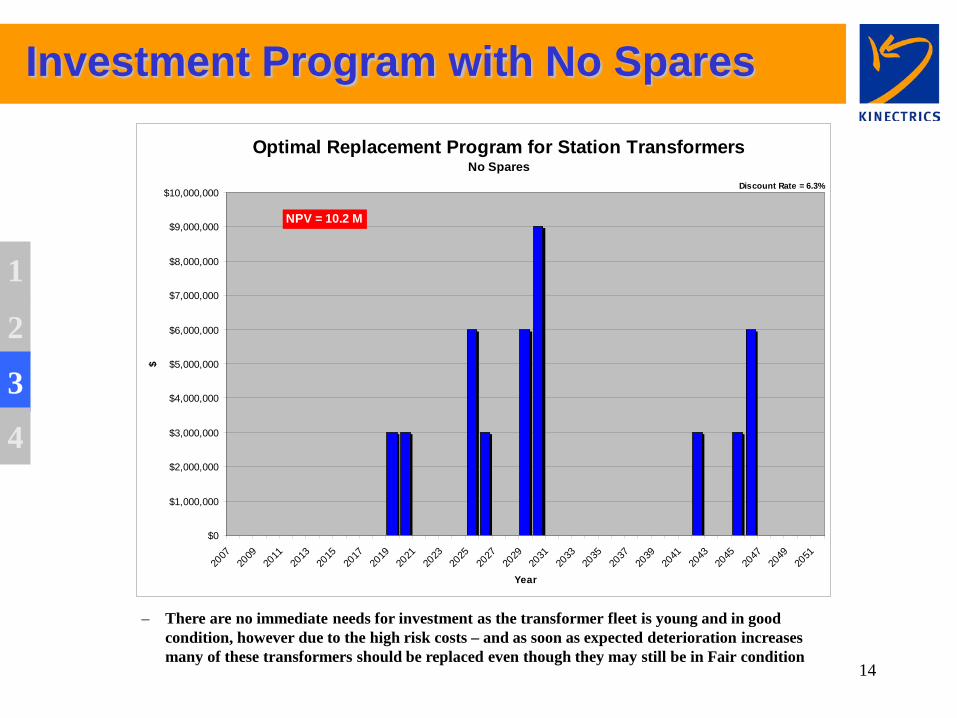
Optimal Replacement Program for Station TransformersNo Spares
$0
$1,000,000
$2,000,000
$3,000,000
$4,000,000
$5,000,000
$6,000,000
$7,000,000
$8,000,000
$9,000,000
$10,000,000
2007
2009
2011
2013
2015
2017
2019
2021
2023
2025
2027
2029
2031
2033
2035
2037
2039
2041
2043
2045
2047
2049
2051
Year
$
NPV = 10.2 M
Discount Rate = 6.3%
– There are no immediate needs for investment as the transformer fleet is young and in good condition, however due to the high risk costs – and as soon as expected deterioration increases many of these transformers should be replaced even though they may still be in Fair condition
15
Investment Program with One Spare
1
2
3
4
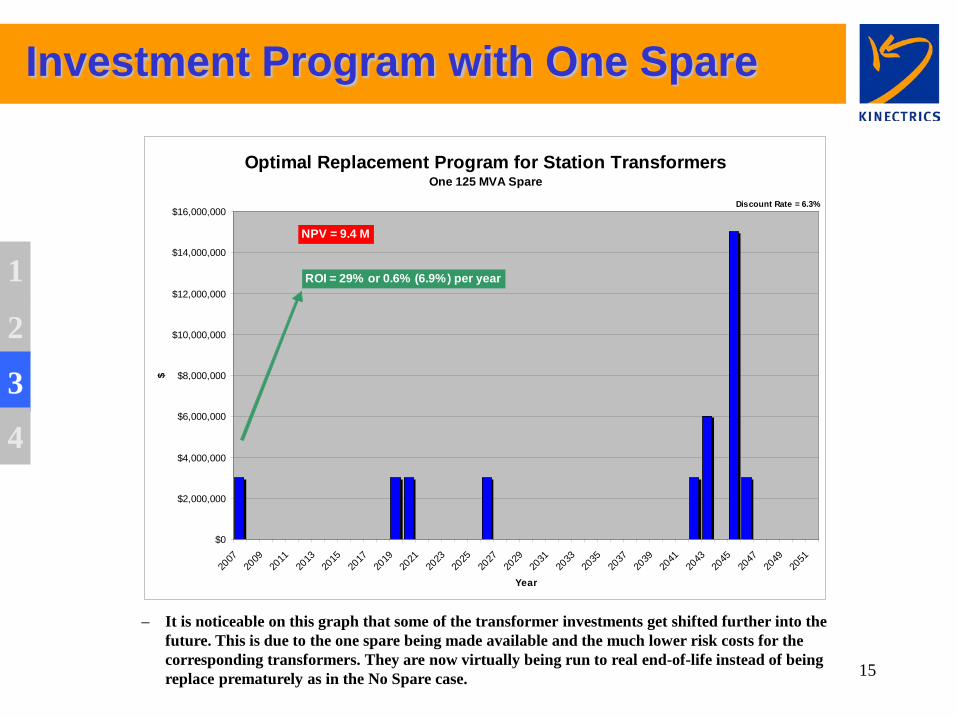
Optimal Replacement Program for Station TransformersOne 125 MVA Spare
$0
$2,000,000
$4,000,000
$6,000,000
$8,000,000
$10,000,000
$12,000,000
$14,000,000
$16,000,000
2007
2009
2011
2013
2015
2017
2019
2021
2023
2025
2027
2029
2031
2033
2035
2037
2039
2041
2043
2045
2047
2049
2051
Year
$
NPV = 9.4 M
ROI = 29% or 0.6% (6.9%) per year
Discount Rate = 6.3%
– It is noticeable on this graph that some of the transformer investments get shifted further into the future. This is due to the one spare being made available and the much lower risk costs for the corresponding transformers. They are now virtually being run to real end-of-life instead of being replace prematurely as in the No Spare case.
16
Investment Program with Two Spares
1
2
3
4
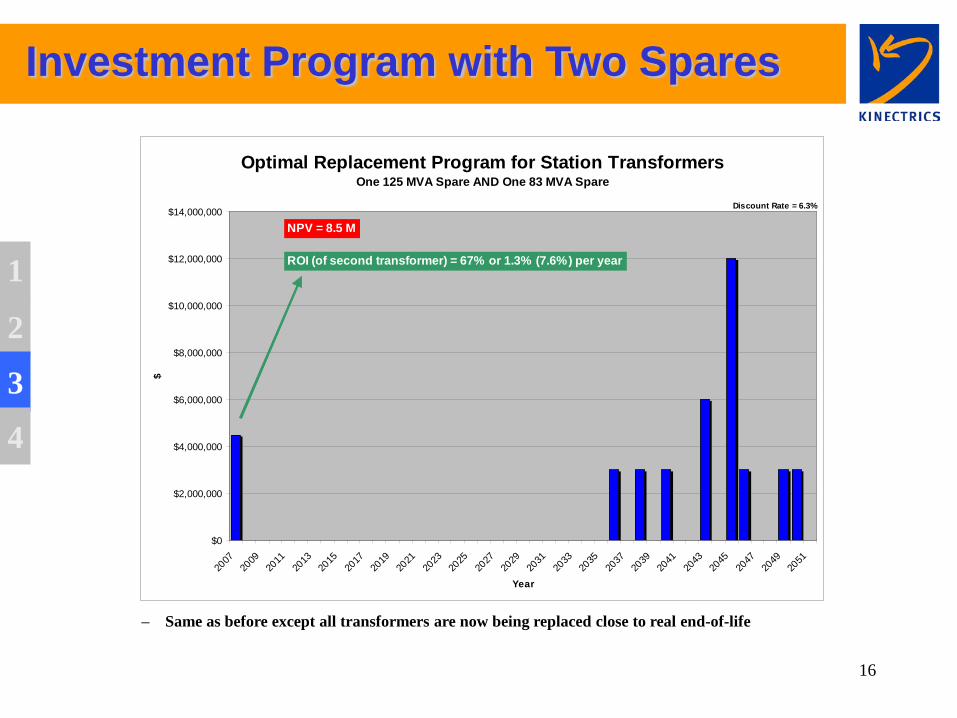
Optimal Replacement Program for Station TransformersOne 125 MVA Spare AND One 83 MVA Spare
$0
$2,000,000
$4,000,000
$6,000,000
$8,000,000
$10,000,000
$12,000,000
$14,000,000
2007
2009
2011
2013
2015
2017
2019
2021
2023
2025
2027
2029
2031
2033
2035
2037
2039
2041
2043
2045
2047
2049
2051
Year
$
NPV = 8.5 M
ROI (of second transformer) = 67% or 1.3% (7.6%) per year
Discount Rate = 6.3%
– Same as before except all transformers are now being replaced close to real end-of-life
17
Conclusions The following main conclusions result from this study:
– The transformers are highly critical to the operation of the system and although system design is robust - catastrophic risk issues need to be considered
– The transformer fleet is quite young (oldest transformers are 20 years old) and their condition is Good or Very Good according to the Health Index analysis. This is considerably better than industry average.
– As a result the probability of transformer failure is low although it is expected to slowly increase with age.
– No specific technical risk factors that affect expected life were found – Determining the consequence cost of failure was quite complex as the redundancy of the system
had to be considered: • The consequence cost of a single failure is low and if the probability of a failure of the
second transformer needed not be considered the transformer should be operated until end-of-life failure.
• However, as the lead time for replacing a failed transformer is about 18 months (if no spare is available) the potential failure of the second transformer needs to be considered.
• The consequence cost of the second failure is very high, mostly because of the extensive outage that would occur.
– The Risk Costs (Probability of Failure x Consequence Cost of Failure) are high with the current operational model of no spares. These high costs result in a long term investment plan (optimal for the life cycle, considering risk costs, investment costs and O&M costs) with an early replacement of transformers as soon as failure rates increase by a small amount.
– If spares were available and the catastrophic consequences of the second transformer failure basically avoided, this would change dramatically and all transformers would be operated much longer or closer to real end-of-life.
1
2
3
4
18
Planning Recommendations
1
2
3
4
Engineering Planning recommends THAT: •This report be received subject to the understanding that a further critical peer review by the ACA Team (and any other interested parties) will be conducted in February. •This process be further developed in 2007 for selected Priority 1 Class assets