Embed Size (px)
Citation preview
Nordic Immunohistochemical Quality Control, ASMA run 55 2019 Page 1 of 9
Assessment Run 55 2019
Alpha-smooth muscle actin (ASMA)
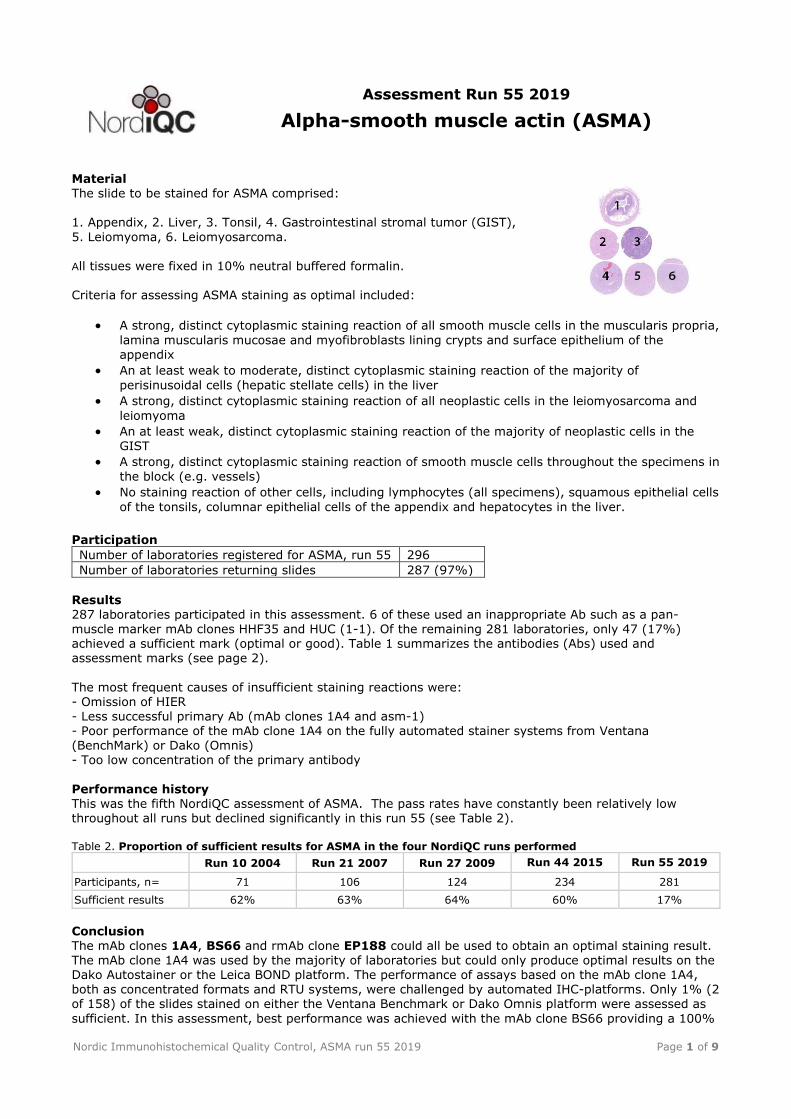
Material The slide to be stained for ASMA comprised: 1. Appendix, 2. Liver, 3. Tonsil, 4. Gastrointestinal stromal tumor (GIST),
5. Leiomyoma, 6. Leiomyosarcoma. All tissues were fixed in 10% neutral buffered formalin. Criteria for assessing ASMA staining as optimal included:
A strong, distinct cytoplasmic staining reaction of all smooth muscle cells in the muscularis propria,
lamina muscularis mucosae and myofibroblasts lining crypts and surface epithelium of the appendix
An at least weak to moderate, distinct cytoplasmic staining reaction of the majority of
perisinusoidal cells (hepatic stellate cells) in the liver
A strong, distinct cytoplasmic staining reaction of all neoplastic cells in the leiomyosarcoma and
leiomyoma
An at least weak, distinct cytoplasmic staining reaction of the majority of neoplastic cells in the GIST
A strong, distinct cytoplasmic staining reaction of smooth muscle cells throughout the specimens in
the block (e.g. vessels)
No staining reaction of other cells, including lymphocytes (all specimens), squamous epithelial cells
of the tonsils, columnar epithelial cells of the appendix and hepatocytes in the liver. Participation
Number of laboratories registered for ASMA, run 55 296
Number of laboratories returning slides 287 (97%)
Results 287 laboratories participated in this assessment. 6 of these used an inappropriate Ab such as a pan-
muscle marker mAb clones HHF35 and HUC (1-1). Of the remaining 281 laboratories, only 47 (17%) achieved a sufficient mark (optimal or good). Table 1 summarizes the antibodies (Abs) used and assessment marks (see page 2).
The most frequent causes of insufficient staining reactions were: - Omission of HIER - Less successful primary Ab (mAb clones 1A4 and asm-1) - Poor performance of the mAb clone 1A4 on the fully automated stainer systems from Ventana (BenchMark) or Dako (Omnis) - Too low concentration of the primary antibody
Performance history This was the fifth NordiQC assessment of ASMA. The pass rates have constantly been relatively low throughout all runs but declined significantly in this run 55 (see Table 2). Table 2. Proportion of sufficient results for ASMA in the four NordiQC runs performed
Run 10 2004 Run 21 2007 Run 27 2009 Run 44 2015 Run 55 2019
Participants, n= 71 106 124 234 281
Sufficient results 62% 63% 64% 60% 17%
Conclusion The mAb clones 1A4, BS66 and rmAb clone EP188 could all be used to obtain an optimal staining result. The mAb clone 1A4 was used by the majority of laboratories but could only produce optimal results on the Dako Autostainer or the Leica BOND platform. The performance of assays based on the mAb clone 1A4, both as concentrated formats and RTU systems, were challenged by automated IHC-platforms. Only 1% (2 of 158) of the slides stained on either the Ventana Benchmark or Dako Omnis platform were assessed as
sufficient. In this assessment, best performance was achieved with the mAb clone BS66 providing a 100%
Nordic Immunohistochemical Quality Control, ASMA run 55 2019 Page 2 of 9
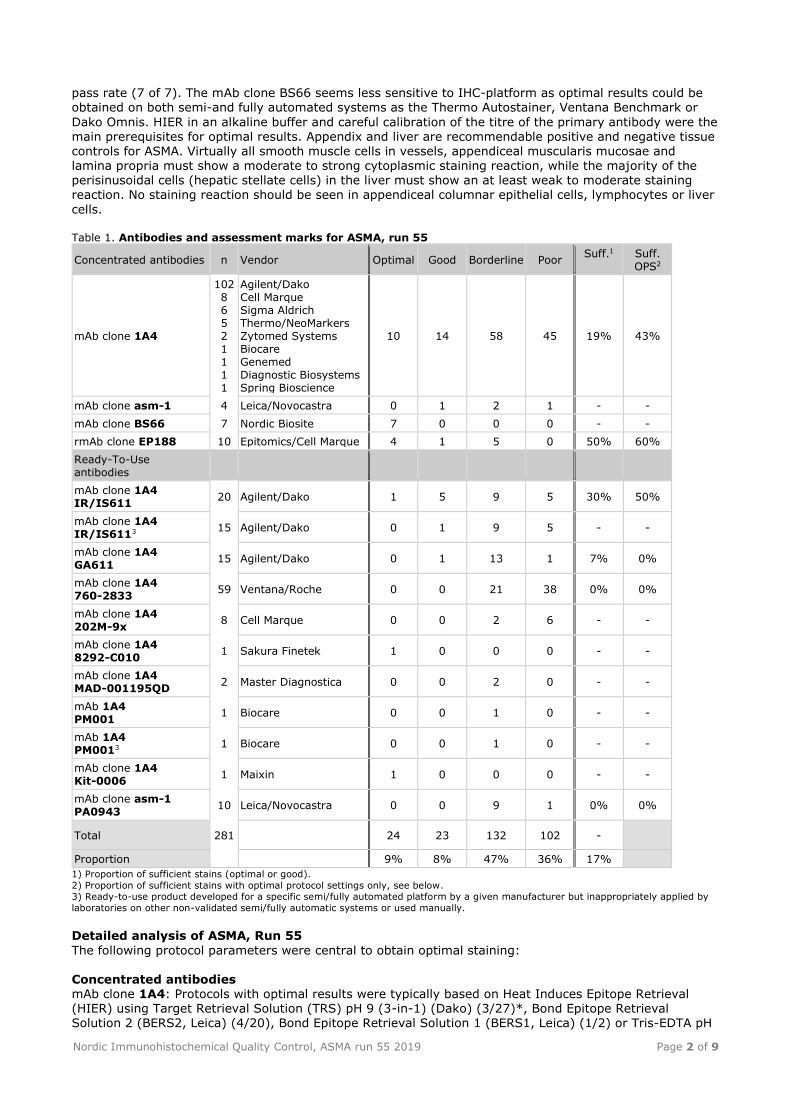
pass rate (7 of 7). The mAb clone BS66 seems less sensitive to IHC-platform as optimal results could be obtained on both semi-and fully automated systems as the Thermo Autostainer, Ventana Benchmark or
Dako Omnis. HIER in an alkaline buffer and careful calibration of the titre of the primary antibody were the main prerequisites for optimal results. Appendix and liver are recommendable positive and negative tissue controls for ASMA. Virtually all smooth muscle cells in vessels, appendiceal muscularis mucosae and lamina propria must show a moderate to strong cytoplasmic staining reaction, while the majority of the perisinusoidal cells (hepatic stellate cells) in the liver must show an at least weak to moderate staining reaction. No staining reaction should be seen in appendiceal columnar epithelial cells, lymphocytes or liver
cells. Table 1. Antibodies and assessment marks for ASMA, run 55
Concentrated antibodies n Vendor Optimal Good Borderline Poor Suff.1 Suff.
OPS2
mAb clone 1A4
102 8 6 5 2 1 1 1 1
Agilent/Dako Cell Marque Sigma Aldrich Thermo/NeoMarkers Zytomed Systems Biocare Genemed Diagnostic Biosystems Spring Bioscience
10 14 58 45 19% 43%
mAb clone asm-1 4 Leica/Novocastra 0 1 2 1 - -
mAb clone BS66 7 Nordic Biosite 7 0 0 0 - -
rmAb clone EP188 10 Epitomics/Cell Marque 4 1 5 0 50% 60%
Ready-To-Use antibodies
mAb clone 1A4 IR/IS611
20 Agilent/Dako 1 5 9 5 30% 50%
mAb clone 1A4 IR/IS6113 15 Agilent/Dako 0 1 9 5 - -
mAb clone 1A4 GA611
15 Agilent/Dako 0 1 13 1 7% 0%
mAb clone 1A4 760-2833
59 Ventana/Roche 0 0 21 38 0% 0%
mAb clone 1A4 202M-9x
8 Cell Marque 0 0 2 6 - -
mAb clone 1A4 8292-C010
1 Sakura Finetek 1 0 0 0 - -
mAb clone 1A4 MAD-001195QD
2 Master Diagnostica 0 0 2 0 - -
mAb 1A4 PM001
1 Biocare 0 0 1 0 - -
mAb 1A4 PM0013 1 Biocare 0 0 1 0 - -
mAb clone 1A4 Kit-0006
1 Maixin 1 0 0 0 - -
mAb clone asm-1 PA0943
10 Leica/Novocastra 0 0 9 1 0% 0%
Total 281 24 23 132 102 -
Proportion 9% 8% 47% 36% 17%
1) Proportion of sufficient stains (optimal or good).
2) Proportion of sufficient stains with optimal protocol settings only, see below. 3) Ready-to-use product developed for a specific semi/fully automated platform by a given manufacturer but inappropriately applied by
laboratories on other non-validated semi/fully automatic systems or used manually.
Detailed analysis of ASMA, Run 55
The following protocol parameters were central to obtain optimal staining: Concentrated antibodies mAb clone 1A4: Protocols with optimal results were typically based on Heat Induces Epitope Retrieval (HIER) using Target Retrieval Solution (TRS) pH 9 (3-in-1) (Dako) (3/27)*, Bond Epitope Retrieval Solution 2 (BERS2, Leica) (4/20), Bond Epitope Retrieval Solution 1 (BERS1, Leica) (1/2) or Tris-EDTA pH
Nordic Immunohistochemical Quality Control, ASMA run 55 2019 Page 3 of 9
9 (2/7) as retrieval buffer. The mAb was typically diluted in the range of 1:100-1:500 (Agilent/Dako) or 1:27,000 (Sigma Aldrich). Using these protocol settings, 15 of 35 (43%) laboratories produced a sufficient
staining result (optimal or good). * (number of optimal results/number of laboratories using this HIER buffer) mAb clone BS66: Protocols with optimal results were based on HIER using TRS pH 9 (3-in-1) (Dako) (4/4), Cell Conditioning 1 (CC1, Ventana) (1/1), CC1 (Ventana) followed by proteolysis in P3 (1/1) and Tris-EDTA pH 9 (1/1) as retrieval buffer. The mAb was diluted in the range of 1:150-1:1500 depending on the total sensitivity of the protocol employed.
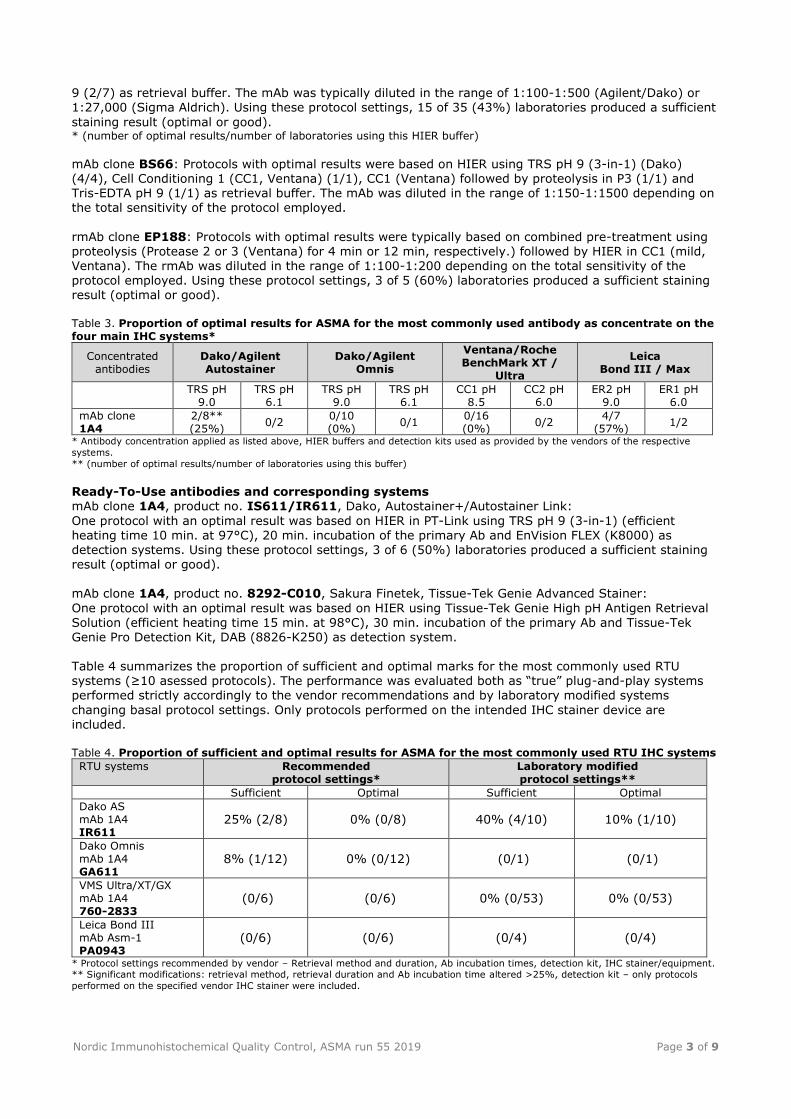
rmAb clone EP188: Protocols with optimal results were typically based on combined pre-treatment using proteolysis (Protease 2 or 3 (Ventana) for 4 min or 12 min, respectively.) followed by HIER in CC1 (mild, Ventana). The rmAb was diluted in the range of 1:100-1:200 depending on the total sensitivity of the protocol employed. Using these protocol settings, 3 of 5 (60%) laboratories produced a sufficient staining result (optimal or good). Table 3. Proportion of optimal results for ASMA for the most commonly used antibody as concentrate on the four main IHC systems*
Concentrated antibodies
Dako/Agilent Autostainer
Dako/Agilent Omnis
Ventana/Roche BenchMark XT /
Ultra
Leica Bond III / Max
TRS pH 9.0
TRS pH 6.1
TRS pH 9.0
TRS pH 6.1
CC1 pH 8.5
CC2 pH 6.0
ER2 pH 9.0
ER1 pH 6.0
mAb clone 1A4
2/8** (25%)
0/2 0/10 (0%)
0/1 0/16 (0%)
0/2 4/7
(57%) 1/2
* Antibody concentration applied as listed above, HIER buffers and detection kits used as provided by the vendors of the respective
systems.
** (number of optimal results/number of laboratories using this buffer)
Ready-To-Use antibodies and corresponding systems mAb clone 1A4, product no. IS611/IR611, Dako, Autostainer+/Autostainer Link:
One protocol with an optimal result was based on HIER in PT-Link using TRS pH 9 (3-in-1) (efficient heating time 10 min. at 97°C), 20 min. incubation of the primary Ab and EnVision FLEX (K8000) as detection systems. Using these protocol settings, 3 of 6 (50%) laboratories produced a sufficient staining result (optimal or good). mAb clone 1A4, product no. 8292-C010, Sakura Finetek, Tissue-Tek Genie Advanced Stainer:
One protocol with an optimal result was based on HIER using Tissue-Tek Genie High pH Antigen Retrieval
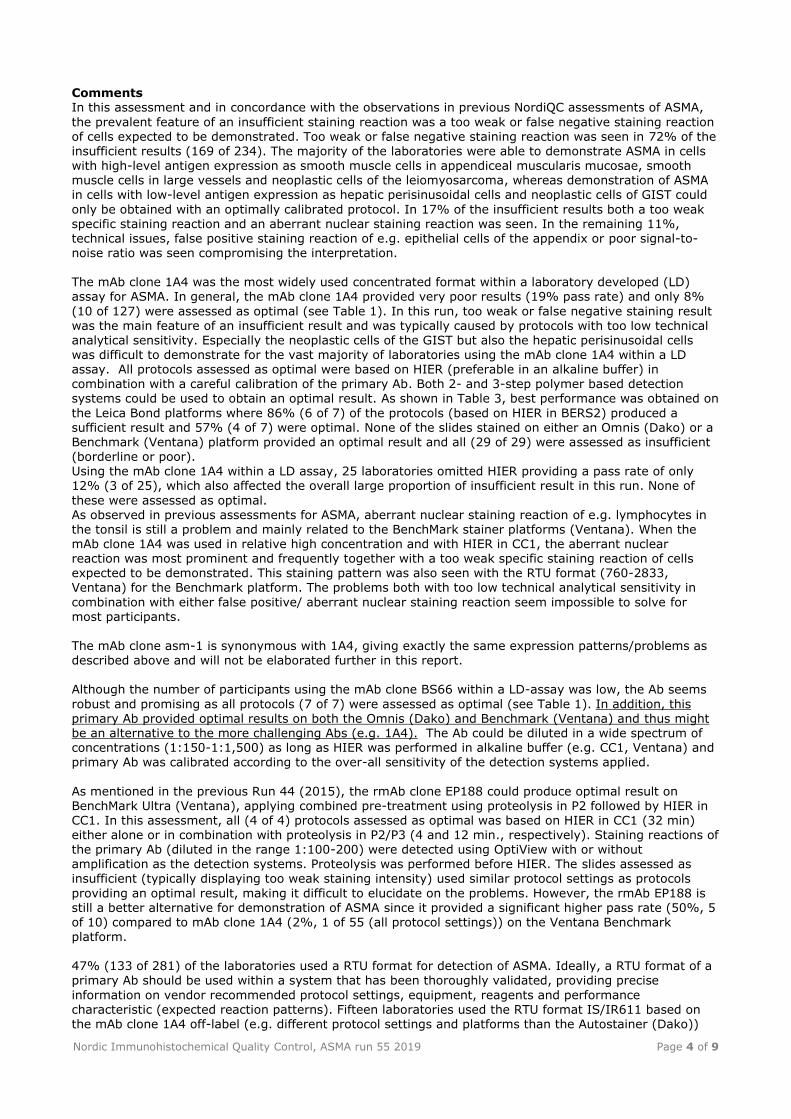
Solution (efficient heating time 15 min. at 98°C), 30 min. incubation of the primary Ab and Tissue-Tek Genie Pro Detection Kit, DAB (8826-K250) as detection system. Table 4 summarizes the proportion of sufficient and optimal marks for the most commonly used RTU systems (≥10 asessed protocols). The performance was evaluated both as “true” plug-and-play systems performed strictly accordingly to the vendor recommendations and by laboratory modified systems
changing basal protocol settings. Only protocols performed on the intended IHC stainer device are included. Table 4. Proportion of sufficient and optimal results for ASMA for the most commonly used RTU IHC systems
RTU systems Recommended protocol settings*
Laboratory modified protocol settings**
Sufficient Optimal Sufficient Optimal
Dako AS mAb 1A4 IR611
25% (2/8) 0% (0/8) 40% (4/10) 10% (1/10)
Dako Omnis mAb 1A4 GA611
8% (1/12) 0% (0/12) (0/1) (0/1)
VMS Ultra/XT/GX mAb 1A4 760-2833
(0/6) (0/6) 0% (0/53) 0% (0/53)
Leica Bond III mAb Asm-1 PA0943
(0/6) (0/6) (0/4) (0/4)
* Protocol settings recommended by vendor – Retrieval method and duration, Ab incubation times, detection kit, IHC stainer/equipment. ** Significant modifications: retrieval method, retrieval duration and Ab incubation time altered >25%, detection kit – only protocols
performed on the specified vendor IHC stainer were included.
Nordic Immunohistochemical Quality Control, ASMA run 55 2019 Page 4 of 9
Comments In this assessment and in concordance with the observations in previous NordiQC assessments of ASMA,
the prevalent feature of an insufficient staining reaction was a too weak or false negative staining reaction of cells expected to be demonstrated. Too weak or false negative staining reaction was seen in 72% of the insufficient results (169 of 234). The majority of the laboratories were able to demonstrate ASMA in cells with high-level antigen expression as smooth muscle cells in appendiceal muscularis mucosae, smooth muscle cells in large vessels and neoplastic cells of the leiomyosarcoma, whereas demonstration of ASMA in cells with low-level antigen expression as hepatic perisinusoidal cells and neoplastic cells of GIST could
only be obtained with an optimally calibrated protocol. In 17% of the insufficient results both a too weak specific staining reaction and an aberrant nuclear staining reaction was seen. In the remaining 11%, technical issues, false positive staining reaction of e.g. epithelial cells of the appendix or poor signal-to-noise ratio was seen compromising the interpretation. The mAb clone 1A4 was the most widely used concentrated format within a laboratory developed (LD) assay for ASMA. In general, the mAb clone 1A4 provided very poor results (19% pass rate) and only 8%
(10 of 127) were assessed as optimal (see Table 1). In this run, too weak or false negative staining result was the main feature of an insufficient result and was typically caused by protocols with too low technical analytical sensitivity. Especially the neoplastic cells of the GIST but also the hepatic perisinusoidal cells was difficult to demonstrate for the vast majority of laboratories using the mAb clone 1A4 within a LD assay. All protocols assessed as optimal were based on HIER (preferable in an alkaline buffer) in
combination with a careful calibration of the primary Ab. Both 2- and 3-step polymer based detection systems could be used to obtain an optimal result. As shown in Table 3, best performance was obtained on
the Leica Bond platforms where 86% (6 of 7) of the protocols (based on HIER in BERS2) produced a sufficient result and 57% (4 of 7) were optimal. None of the slides stained on either an Omnis (Dako) or a Benchmark (Ventana) platform provided an optimal result and all (29 of 29) were assessed as insufficient (borderline or poor). Using the mAb clone 1A4 within a LD assay, 25 laboratories omitted HIER providing a pass rate of only 12% (3 of 25), which also affected the overall large proportion of insufficient result in this run. None of
these were assessed as optimal. As observed in previous assessments for ASMA, aberrant nuclear staining reaction of e.g. lymphocytes in the tonsil is still a problem and mainly related to the BenchMark stainer platforms (Ventana). When the mAb clone 1A4 was used in relative high concentration and with HIER in CC1, the aberrant nuclear reaction was most prominent and frequently together with a too weak specific staining reaction of cells expected to be demonstrated. This staining pattern was also seen with the RTU format (760-2833, Ventana) for the Benchmark platform. The problems both with too low technical analytical sensitivity in
combination with either false positive/ aberrant nuclear staining reaction seem impossible to solve for most participants.
The mAb clone asm-1 is synonymous with 1A4, giving exactly the same expression patterns/problems as described above and will not be elaborated further in this report. Although the number of participants using the mAb clone BS66 within a LD-assay was low, the Ab seems
robust and promising as all protocols (7 of 7) were assessed as optimal (see Table 1). In addition, this primary Ab provided optimal results on both the Omnis (Dako) and Benchmark (Ventana) and thus might be an alternative to the more challenging Abs (e.g. 1A4). The Ab could be diluted in a wide spectrum of concentrations (1:150-1:1,500) as long as HIER was performed in alkaline buffer (e.g. CC1, Ventana) and primary Ab was calibrated according to the over-all sensitivity of the detection systems applied.
As mentioned in the previous Run 44 (2015), the rmAb clone EP188 could produce optimal result on BenchMark Ultra (Ventana), applying combined pre-treatment using proteolysis in P2 followed by HIER in CC1. In this assessment, all (4 of 4) protocols assessed as optimal was based on HIER in CC1 (32 min) either alone or in combination with proteolysis in P2/P3 (4 and 12 min., respectively). Staining reactions of the primary Ab (diluted in the range 1:100-200) were detected using OptiView with or without amplification as the detection systems. Proteolysis was performed before HIER. The slides assessed as
insufficient (typically displaying too weak staining intensity) used similar protocol settings as protocols
providing an optimal result, making it difficult to elucidate on the problems. However, the rmAb EP188 is still a better alternative for demonstration of ASMA since it provided a significant higher pass rate (50%, 5 of 10) compared to mAb clone 1A4 (2%, 1 of 55 (all protocol settings)) on the Ventana Benchmark platform. 47% (133 of 281) of the laboratories used a RTU format for detection of ASMA. Ideally, a RTU format of a primary Ab should be used within a system that has been thoroughly validated, providing precise
information on vendor recommended protocol settings, equipment, reagents and performance characteristic (expected reaction patterns). Fifteen laboratories used the RTU format IS/IR611 based on the mAb clone 1A4 off-label (e.g. different protocol settings and platforms than the Autostainer (Dako))
Nordic Immunohistochemical Quality Control, ASMA run 55 2019 Page 5 of 9
providing a pass rate of 6% (1 of 15) which was significantly lower compared to an overall pass rate of 30% (6 of 20) if the system was used on the Autostainer +/Link (Dako) (see Table 1).
Dako and Ventana Ready-To-Use (RTU) systems based on mAb clone 1A4 were the most widely used RTU systems with similar observations as for LD assays. As shown in Table 4, the Dako RTU system (IS/IR/GA611) provided slightly higher pass rate compared to the Ventana RTU system (760-2833) but the overall performance of these systems was disappointing low. No significant difference could be seen between using official protocol recommendations given by vendors or laboratory modified protocol
settings. Grouped together, the pass rate was only 7% (7 of 94) (see Table 1). In addition, the RTU system PA043 (Leica) based on the mAb clone asm-1 provided a pass rate of 0% (all 10 protocols were assessed as insufficient). For this system, but also for the Ventana RTU system (760-2833), the official recommendations to pre-treatment is based on no antigen retrieval at all. However, and as shown in Table 4, this did not influence the final outcome as there was no difference in performance between applying vendor recommended protocol settings compared to laboratory modified protocol settings typically performing HIER in alkaline buffer.
This was the fifth assessment of ASMA in NordiQC (see Table 2). Although ASMA has been use for many years, the marker is still challenging and the pass rate in this run 55 decreased significantly compared to the latest run 44, 2015. Several elements influenced the final outcome: 1) The tissue included in the block, especially the liver (hepatic perisinusoidal cells) and the neoplastic cells of the GIST, were
challenging for most participants. 2) The consistent poor performance of the mAb 1A4 on Ventana Benchmark platforms (120 laboratories) but also on the Dako Omnis (38 laboratories) accounted for the
overall low pass rate obtained in this run and only 1% (2 of 158) of the users were able to produce a sufficient result. 3) A large proportion of laboratories applied protocol settings based on no antigen retrieval at all, providing a pass rate of only 6% (4 of 62) of which none were assessed as optimal 4) The mAb asm-1, primarily applied on BOND III platforms (concentrates and RTU systems), also provided a large proportion of insufficient results (93%, 13 of 14). Importantly, laboratories should apply an Ab that work on the in-house IHC platform, calibrate the
protocols correctly and stain according to the expected antigen level of the recommended control material (see below). Controls Appendix and liver are recommendable positive and negative tissue controls for ASMA. Virtually all smooth muscle cells in vessels, appendiceal muscularis mucosae and lamina propria must show a moderate to strong cytoplasmic staining reaction, while the majority of the perisinusoidal cells (hepatic stellate cells) in
the liver must show an at least weak to moderate, distinct staining reaction. No staining reaction should be seen in appendiceal columnar epithelial cells, lymphocytes or liver cells.
Nordic Immunohistochemical Quality Control, ASMA run 55 2019 Page 6 of 9
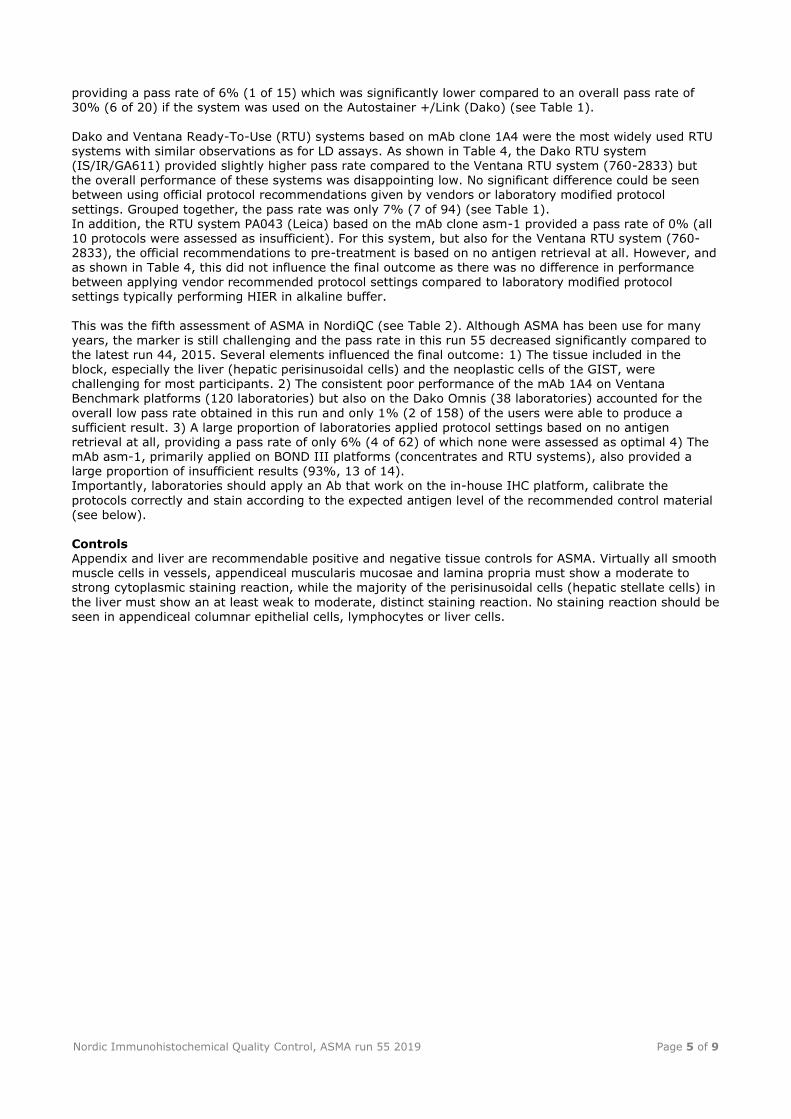
Fig. 1a (x100) Optimal ASMA staining of the appendix using the mAb clone BS66 optimally calibrated, HIER in TRS (3-in-1) pH9 (Dako) and a 3-step polymer based detection system (Flex+, Dako) on the Omnis (Dako). Smooth muscle cells of lamina muscularis mucosae and myofibroblasts lining the epithelial crypts show a distinct cytoplasmic staining reaction. Same protocol used in Figs. 2a-5a.
Fig. 1b (x100) ASMA staining of the appendix using an insufficient protocol with too low sensitivity - based on the mAb clone 1A4 diluted 1:300, HIER in TRS (3-in-1) pH9 (Dako) and a 3-step polymer based detection system (Flex+, Dako) on the Omnis (Dako). The protocol was almost identical to the protocol in Fig. 1a except for the choice of primary Ab. Same protocol used in Figs. 2b-5b. Although the staining pattern is similar to the optimal protocol seen in Fig. 1a (same field), the assay provided too weak staining reaction in critical tissue specimens – compare fig. 3a-3b and 4a-4b. In this assessment, the mAb clone 1A4 seems difficult to optimize on Omnis (Dako) and Benchmark (Ventana) platforms.
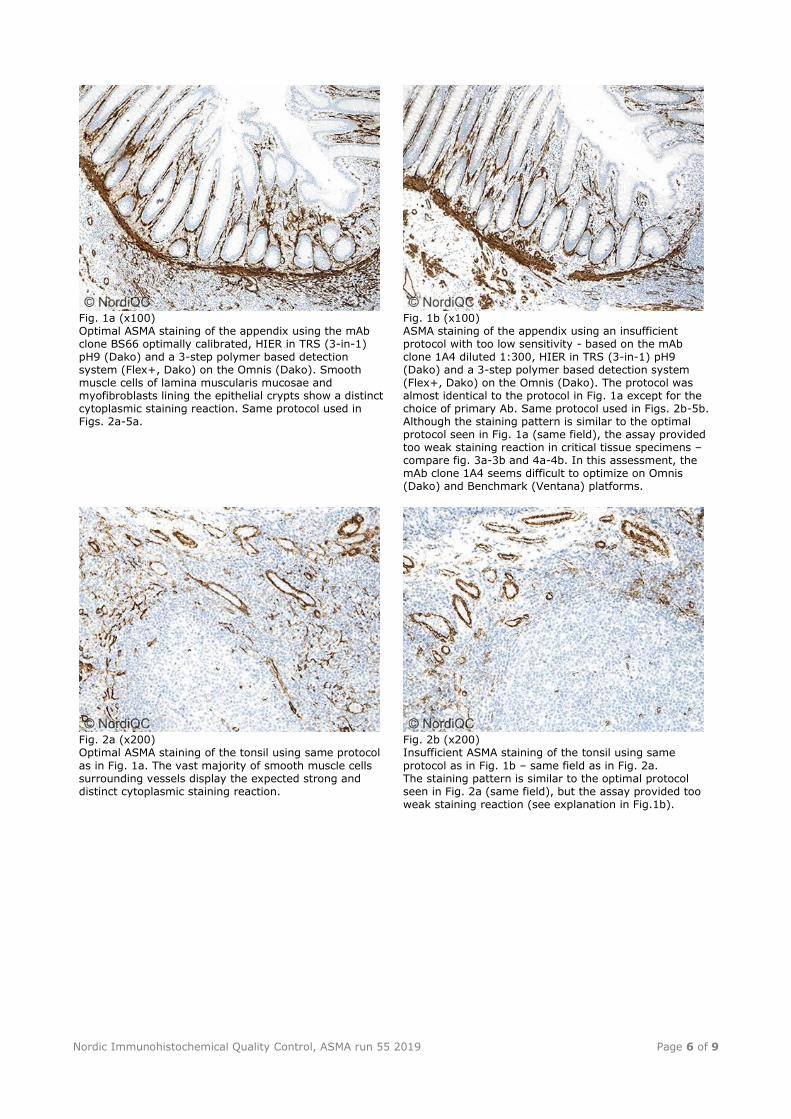
Fig. 2a (x200) Optimal ASMA staining of the tonsil using same protocol
as in Fig. 1a. The vast majority of smooth muscle cells surrounding vessels display the expected strong and distinct cytoplasmic staining reaction.
Fig. 2b (x200) Insufficient ASMA staining of the tonsil using same
protocol as in Fig. 1b – same field as in Fig. 2a. The staining pattern is similar to the optimal protocol seen in Fig. 2a (same field), but the assay provided too weak staining reaction (see explanation in Fig.1b).
Nordic Immunohistochemical Quality Control, ASMA run 55 2019 Page 7 of 9
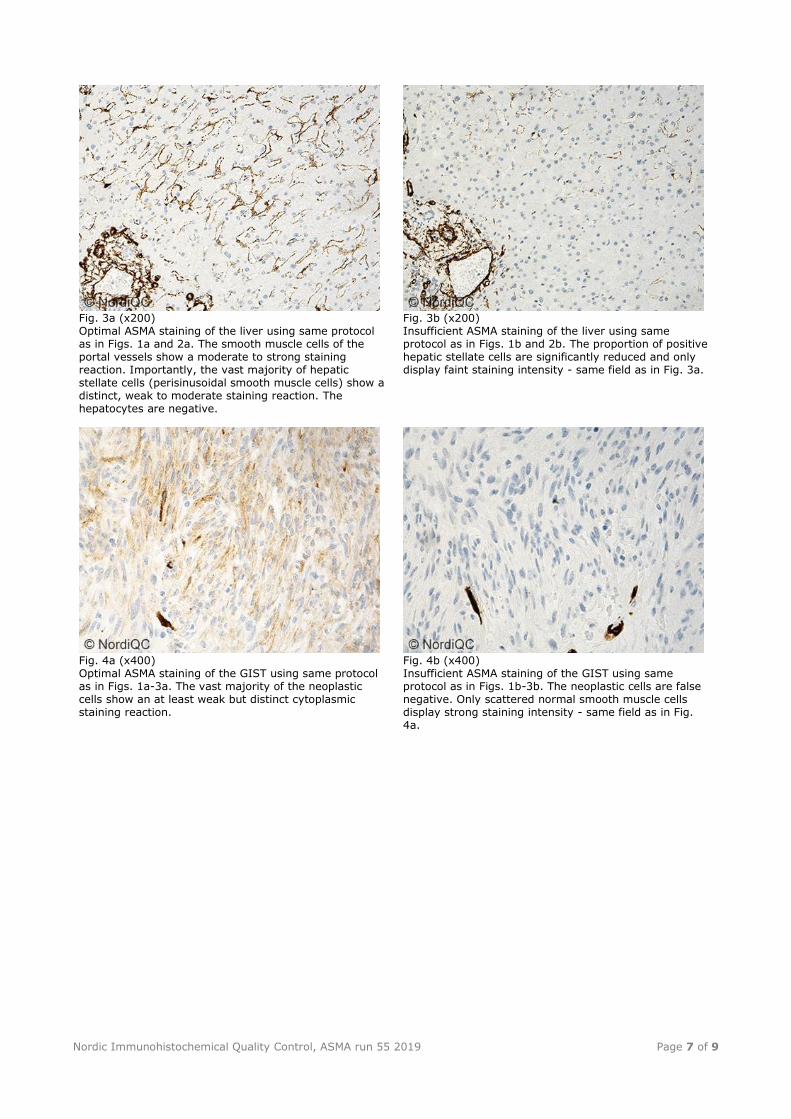
Fig. 3a (x200) Optimal ASMA staining of the liver using same protocol as in Figs. 1a and 2a. The smooth muscle cells of the portal vessels show a moderate to strong staining reaction. Importantly, the vast majority of hepatic stellate cells (perisinusoidal smooth muscle cells) show a distinct, weak to moderate staining reaction. The hepatocytes are negative.
Fig. 3b (x200) Insufficient ASMA staining of the liver using same protocol as in Figs. 1b and 2b. The proportion of positive hepatic stellate cells are significantly reduced and only display faint staining intensity - same field as in Fig. 3a.
Fig. 4a (x400) Optimal ASMA staining of the GIST using same protocol as in Figs. 1a-3a. The vast majority of the neoplastic cells show an at least weak but distinct cytoplasmic staining reaction.
Fig. 4b (x400) Insufficient ASMA staining of the GIST using same protocol as in Figs. 1b-3b. The neoplastic cells are false negative. Only scattered normal smooth muscle cells display strong staining intensity - same field as in Fig. 4a.
Nordic Immunohistochemical Quality Control, ASMA run 55 2019 Page 8 of 9
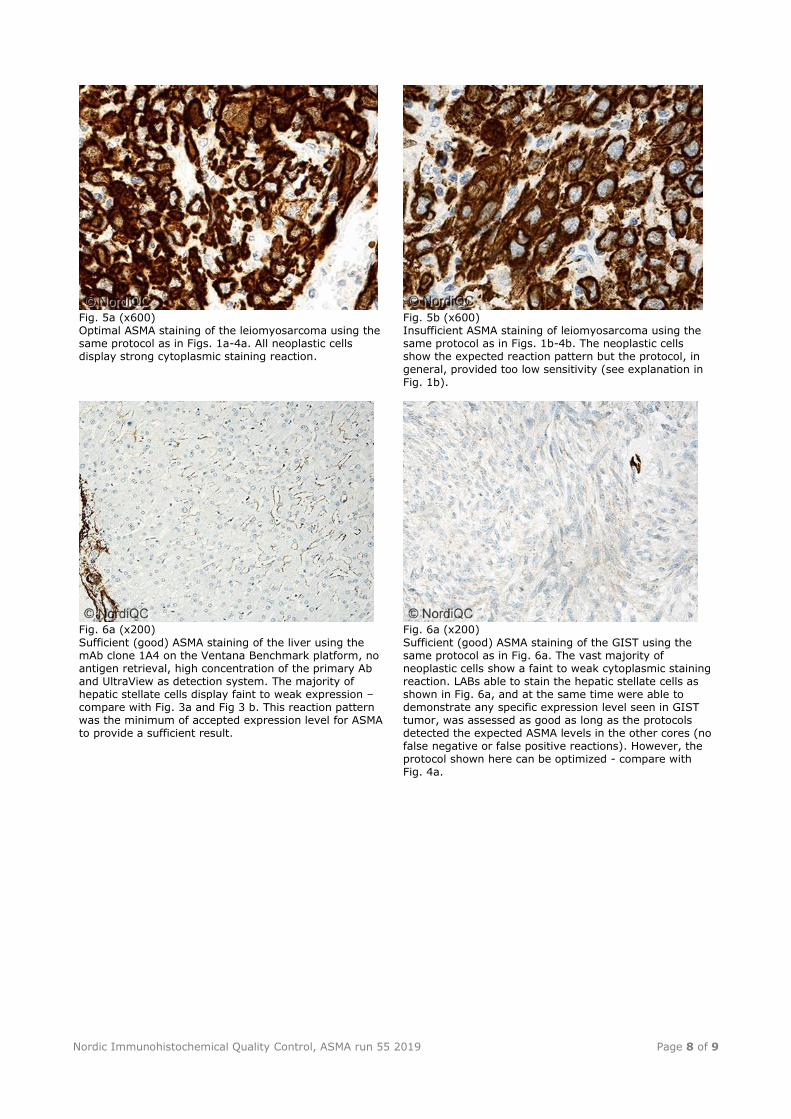
Fig. 5a (x600) Optimal ASMA staining of the leiomyosarcoma using the same protocol as in Figs. 1a-4a. All neoplastic cells display strong cytoplasmic staining reaction.
Fig. 5b (x600) Insufficient ASMA staining of leiomyosarcoma using the same protocol as in Figs. 1b-4b. The neoplastic cells show the expected reaction pattern but the protocol, in general, provided too low sensitivity (see explanation in Fig. 1b).
Fig. 6a (x200)
Sufficient (good) ASMA staining of the liver using the mAb clone 1A4 on the Ventana Benchmark platform, no antigen retrieval, high concentration of the primary Ab and UltraView as detection system. The majority of hepatic stellate cells display faint to weak expression – compare with Fig. 3a and Fig 3 b. This reaction pattern was the minimum of accepted expression level for ASMA to provide a sufficient result.
Fig. 6a (x200)
Sufficient (good) ASMA staining of the GIST using the same protocol as in Fig. 6a. The vast majority of neoplastic cells show a faint to weak cytoplasmic staining reaction. LABs able to stain the hepatic stellate cells as shown in Fig. 6a, and at the same time were able to demonstrate any specific expression level seen in GIST tumor, was assessed as good as long as the protocols detected the expected ASMA levels in the other cores (no false negative or false positive reactions). However, the protocol shown here can be optimized - compare with Fig. 4a.
Nordic Immunohistochemical Quality Control, ASMA run 55 2019 Page 9 of 9
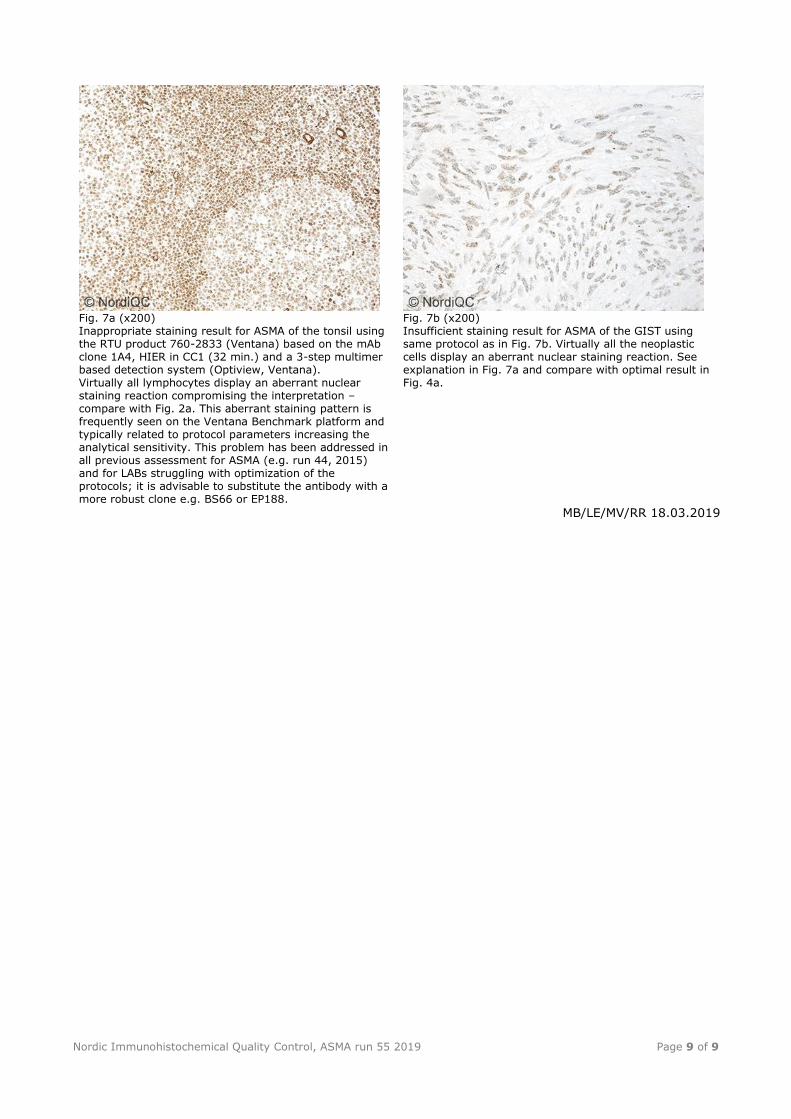
Fig. 7a (x200) Inappropriate staining result for ASMA of the tonsil using the RTU product 760-2833 (Ventana) based on the mAb clone 1A4, HIER in CC1 (32 min.) and a 3-step multimer based detection system (Optiview, Ventana). Virtually all lymphocytes display an aberrant nuclear staining reaction compromising the interpretation – compare with Fig. 2a. This aberrant staining pattern is frequently seen on the Ventana Benchmark platform and typically related to protocol parameters increasing the analytical sensitivity. This problem has been addressed in all previous assessment for ASMA (e.g. run 44, 2015) and for LABs struggling with optimization of the protocols; it is advisable to substitute the antibody with a more robust clone e.g. BS66 or EP188.
Fig. 7b (x200) Insufficient staining result for ASMA of the GIST using same protocol as in Fig. 7b. Virtually all the neoplastic cells display an aberrant nuclear staining reaction. See explanation in Fig. 7a and compare with optimal result in Fig. 4a.
MB/LE/MV/RR 18.03.2019