Embed Size (px)
Citation preview

Assessment of Risk to Infrastructure from Permafrost Degradation and a Changing Climate, Ross River


Assessment of Risk to Infrastructure from Permafrost Degradation and a Changing Climate, Ross River
Assessment of Risk to Infrastructure from Permafrost Degradation and a Changing Climate, Ross River

Lead authors
Fabrice Calmels Northern Climate ExChange, Yukon Research Centre, Yukon College
Brian Horton Northern Climate ExChange, Yukon Research Centre, Yukon College
Louis Philippe Roy Northern Climate ExChange, Yukon Research Centre, Yukon College
Panya Lipovski Yukon Geological Survey, Government of Yukon
Bronwyn Benkert Northern Climate ExChange, Yukon Research Centre, Yukon College
Technical advisors
Richard Trimble, P.Eng Tetra Tech EBA
Chad Cowan, P.Eng Tetra Tech EBA
Marie-Caroline Badjeck Climate Change Impacts and Adaptation Division, Strategic Policy and Operations Branch, Earth Science Sector, Natural Resources Canada
David Lapp, P.Eng Engineers Canada
Michael Westlake Indigenous and Northern Affairs Canada
Kelly Montgomery Standards Council of Canada
Peter Blum Property Management Division, Department of Highways and Public Works, Government of Yukon
Philip Christensen Property Management Division, Department of Highways and Public Works, Government of Yukon
Jody Eikelboom Property Management Division, Department of Highways and Public Works, Government of Yukon
Marianne Gregoire Property Management Division, Department of Highways and Public Works, Government of Yukon
Rob Kelly Property Management Division, Department of Highways and Public Works, Government of Yukon
Spencer Sumanik Property Management Division, Department of Highways and Public Works, Government of Yukon
Technical editing and production
Patricia Halladay Patricia Halladay Graphic Design (editing and layout)
Guinevieve Lalena Lalena Graphic Design (cover design)

AcknowledgementsWe would like to thank the community of Ross River and the Ross River Dena Council for welcoming us on their lands and within the Traditional Territory of Kaska Dena.
This project was made possible with funding support from Natural Resources Canada through the Adaptation Platform. Extensive technical advice and expert guidance was provided Richard Trimble and Chad Cowan, professional engineers at Tetra Tech EBA. Local logistical support in Ross River was provided by Ben Bellefeuille, Building Maintenance Worker.
The project team members would like to thank all the above-noted participants in this project, and any we have unintentionally missed, for their enthusiasm and commitment.

ContentsKey terms ii
1. Introduction 11.1 Report organization 21.2 Methodology 2
1.2.1 Preliminary permafrost assessment and identification of sensitive buildings 21.2.2 Detailed permafrost characterization 3
1.2.2.1 Borehole logs 31.2.2.2 Ground temperature monitoring 31.2.2.3 Electrical resistivity tomography 3
1.3 Summary of key findings 4
2. Context and background 52.1 Community 52.2 Geology 5
2.2.1 Physiography 52.2.2 Bedrock geology 62.2.3 Glacial history 82.2.4 Surficial materials 8
2.2.4.1 Organic materials 92.2.4.2 Volcanic materials 92.2.4.3 Colluvial materials 92.2.4.4 Fluvial materials 92.2.4.5 Glaciofluvial materials 92.2.4.6 Morainal materials 102.2.4.7 Glaciolacustrine materials 10
2.2.5 Stratigraphy 102.3 Climate 11
2.3.1 Contemporary climate 112.3.2 Past climate trends 122.3.3 Projected climate 13
2.4 Vegetation 142.5 Hydrology 15
2.5.1 Surface water 152.5.2 Groundwater 15
2.6 Permafrost 162.6.1 Formation and degradation 162.6.2 Impact of vegetation and soil texture on permafrost characteristics 162.6.3 Contemporary permafrost distribution 17
2.7 Buildings managed by PMD 182.7.1 School 192.7.2 Community Centre 212.7.3 Pool 232.7.4 Recreation Centre and Arena 24
2.8 Building Studied for Best Practices and Recommendations 252.8.1 Highways Maintenance Shed 25

3. Detailed Permafrost Characteristics 263.1 Synopsis of hazard mapping results (risk for overall community) 263.2 Synopsis of Tetra Tech EBA borehole logs 293.3 Permafrost temperature 31
Schoolyard 32The school 33School crawlspace 37The arena 41
3.4 Electrical Resistivity Tomography 423.4.1 The community centre/daycare, pool and recreation centre/arena 43
4. Risk assessment of the structures affected 534.1 Indicators of potential permafrost related foundation distress 534.2 Initial site investigation 56
4.2.1 Types of background information to collect 574.2.1.1 Potential data sources 57
4.2.2 Inspection of structure and site 594.2.3 Soil lithology 60
4.2.3.1 Depth of permafrost and ground temperatures 614.2.3.2 Ground ice content 61
4.2.4 Preparation of an investigation report 624.3 Establishing a monitoring program 62
4.3.1 Observations and documentation to be included 624.3.2 Collection of ground temperature data 63
4.4 Producing a final evaluation report 63
5. Mitigation techniques 645.1 Applicability of remediation techniques to different foundation types 645.2 Site techniques 65
5.2.1 Shading 655.2.2 Drainage 665.2.3 Snow accumulation management 67
5.3 Techniques applied to the structure 695.3.1 Ventilation 695.3.2 Ground insulation 705.3.3 Foundation adjustment and leveling 705.3.4 Mechanized refrigeration or thermosyphons 715.3.5 Foundation replacement 71
5.4 Abandonment and demolition 725.4.1 Site abandonment 725.4.2 Structure demolition 72
5.5 Monitoring 725.5.1 Monitoring existing mitigation measures 725.5.2 Ground temperature monitoring 73
6. Synthesis and conclusion 74
References and Annex 76

Assessment of Risk to infRAstRuctuRe: Ross RiveR, Yukon
ii
Key termsActive layer: This is the layer of ground that is subject to annual thawing and freezing in areas underlain by permafrost.
In the continuous permafrost zone the active layer generally reaches the permafrost table; in the zone of discontinuous permafrost it often does not. The active layer includes the uppermost part of the per-mafrost wherever either the salinity or clay content of the permafrost allows it to thaw and refreeze annually, even though the material remains below 0°C. The active layer is sometimes referred to as the “active zone”; the term “zone,” however, should be reserved for areas of discontinuous and continuous permafrost.
Alluvial: This pertains to material or processes associated with transportation and/or sub-aerial deposition by concentrated running water.
Colluvium: Unsorted, rock fragments and soil mate-rials produced by gravity or mass wasting are called colluvium. Landslides, mudslides and talus are all colluvial deposits. These heterogeneous deposits are generally identifiable in the field and typically lie in a slump at the base of a hill or rock outcrop.
Creep of frozen ground: The slow deformation (or time-dependent shear strain) that results from long-term application of a stress too small to produce failure in the frozen material.
Cryostructure: The structural characteristics of fro-zen earth materials. The cryostructure is determined by the amount and distribution of pore ice (or ice cement) and lenses of segregated ice. The type and arrangement of ice in the frozen material will depend largely on the initial total water content of the ma-terial and the extent of moisture migration during subsequent freezing.
Discontinuous permafrost: This occurs between the continuous permafrost zone and the southern latitu-dinal limit of permafrost in lowlands. Depending on the scale of mapping, several subzones can often be distinguished, based on the percentage of the land surface underlain by permafrost.
Eolian: This means connected with or caused by the action of the wind. Eolian deposits are the result of the accumulation of wind-driven products of the weathering of solid bedrock or unconsolidated alluvi-al, lacustrine, marine or other deposits.
ERT: Electrical resistivity tomography, a geophysical method that measures the resistivity distribution of the subsurface.
Excess ice: This the volume of ice in the ground that exceeds the total pore volume that the ground would have under natural unfrozen conditions.
in standard geotechnical terminology, a soil is con-sidered normally consolidated when its total pore volume or its total water content is in equilibrium with the acting gravity stresses. Due to the presence of ground ice, the total water content of a frozen soil may exceed that corresponding to its normally consolidated state when unfrozen. As a result, upon thawing, a soil containing excess ice will settle under its own weight until it attains its consolidated state.
Fluvial: These are very unsorted sediments. Fine-grained sediments are found at the bottom of the stream channel; very coarse sediments, including cobbles and pebbles, can be found along or in the stream. The particle size varies according to the force of the water flow.
Frost heave: This is the upward or outward move-ment of the ground surface (or objects on or in the ground) caused by the formation of ice in the soil.
Frost action in fine-grained soils increases the vol-ume of the soil not only by freezing of in situ pore water (≈ 9% expansion), but also by drawing water to the freezing front where ice lenses form. Soils that have undergone substantial heaving may consist of alternate layers of ice-saturated soil and relatively clear ice lenses.
The lenses are formed normal to the direction of heat flow and when freezing penetrates from the ground surface (which may be horizontal, sloping or vertical), they form parallel to that surface. When unrestrained, the amount of surface heave may be almost as much as the total thickness of the ice lenses. Frost heave can occur seasonally or continu-ously if the ground freezes without interruption over a period of years.
Differential, or non-uniform, frost heaving is one of the main detrimental aspects of the frost action process and reflects the heterogeneous nature of most soils, or variations in the heat removal rate and groundwater supply over short distances.

KEY TERMS
iii
Depending on the degree of restraint, large freez-ing pressures (up to 1 megapascal) can develop as the ground freezes. These can be transmitted to a foundation, structure or other object placed on the ground surface, or embedded or buried in the ground, as basal (i.e., vertical) forces acting on their underside, or through freezing of the soil to the sides of the foundation, structure or object.
Frost-susceptible ground: This is ground (soil or rock) in which segregated ice will form (causing frost heave) under certain conditions of moisture supply and temperature.
Frost-susceptible ground will eventually become ice-rich, regardless of its initial total water content, if the appropriate moisture supply and temperature conditions persist. By implication, frost-susceptible ground may also be susceptible to thaw weakening effects when it thaws.
Glaciofluvial: These materials are deposited by wa-ters associated with glacial ice that are deposited by a stream or river originating from glacial meltwater.
Glaciolacustral: Materials that are deposited by waters associated with glacial ice include sediments deposited in lakes that border and/or are supplied by the glacier. Deposits from meltwater exhibit some degree of sorting and are often stratified.
GPR: ground penetrating radar, a geophysical meth-od that uses different frequencies of radio waves to measure subsurface properties such as density/min-eral changes, water content, or void space.
Ice-rich permafrost: Permafrost that contains excess ice is ice-rich. Ice-rich permafrost is thaw-sensitive.
Lacustrine: These are fine-grained sediments that are deposited in freshwater lakes. Wave action in lakes carries the finer suspended grained silt and clay sized particles towards deeper water. As the water calms, these particles settle out and accumulate at the bottom of the lake to form what is known as lacustrine soil. The lake may no longer exist.
Metastability: Phenomenon when a system spends an extended time in a configuration other than its state of least energy. During a metastable state of limited lifetime all state-describing parameters reach and hold stationary values. In the case of perma-frost, temperature remains stationary at 0°C until the change in phase of water from solid to liquid, or liquid to solid, is completed.
Morainal (Till): This is unstratified and unsorted debris deposited directly from glacial ice without subsequent movement by wind or water. It consists mainly of mechanically broken fragments of bedrock, as well as any soils or earlier glacial deposits that were overridden by the glacier. it commonly includes a mixture of a few large rock fragments within a matrix of fine sand, silt and clay.
Organic: Organic soils contain well-decomposed organic matter with or without plant fibres at various stages of decomposition.
Permafrost: This is ground (soil or rock, along with ice and organic material) that remains at or below 0°C for at least two consecutive years.
Permafrost is defined on the basis of temperature. It is not necessarily frozen, because the freezing point of the included water may be depressed several degrees below 0°C; moisture in the form of water or ice may or may not be present. in other words, all perennially frozen ground is permafrost, but not all permafrost is perennially frozen. Permafrost should not be regarded as permanent, because natural or human-made changes in the climate or terrain may cause the temperature of the ground to rise above 0°C. Permafrost includes perennial ground ice, but not glacier ice or icings or bodies of surface water with temperatures perennially below 0°C. It also includes human-made perennially frozen ground around or below chilled pipelines, hockey arenas, etc.
Permafrost base: The lower boundary surface of permafrost, above which temperatures are peren-nially below 0°C and below which temperatures are perennially above 0°C.
Permafrost table: This the upper boundary surface of permafrost. The depth of this boundary below the land surface, whether exposed or covered by a water body or glacier ice, varies according to such local factors as topography, exposure to the sun, insulating cover of vegetation and snow, drainage, grain size and degree of sorting of the soil, and thermal prop-erties of the soil and rock.
Permafrost thickness: This the vertical distance between the permafrost table and the permafrost base.

Assessment of Risk to infRAstRuctuRe: Ross RiveR, Yukon
IV
Pore water: This is water that occupies the spaces between sediment particles.
Segregated ice: This is ice in discrete layers or ice lenses. Segregated ice can range in thickness from a hairline to more than 10 m. It commonly occurs in alternating layers of ice and soil.
Solifluction: Slow downslope flow of saturated non-frozen earth materials.
Talik: A layer or body of unfrozen ground occurring in a permafrost area due to a local anomaly in thermal, hydrological, hydrogeological, or hydrochemical conditions.. Supra-permafrost talik is a layer or body of perennially unfrozen ground occurring above permafrost.
Tephra: Solid matter, such as ash, dust and cinders, that is ejected into the air by an erupting volcano. Tephra is a general term for all pyroclastic materials ejected from a volcano.
Thaw-sensitive permafrost: This is perennially frozen ground which, when it thaws, will experience significant thaw settlement and lose strength to a value significantly lower than that of similar material in an unfrozen condition. Ice-rich permafrost is thaw-sensitive.
Thawing front: Also referred to as the thaw front, this is the advancing boundary between thawed ground and frozen ground. The thawing front may be advancing into either seasonally or perennially frozen ground during progressive thawing. in non-perma-frost areas there will be two thawing fronts during the annual thawing period: one moving downward from the surface, the other moving upward from the bottom of the seasonally frozen ground. The thawing front usually coincides more closely with the position of the 0°C isotherm than the freezing front, except in saline permafrost.
Thermokarst: This is the process by which characteristic landforms result from the thawing of ice-rich permafrost or the melting of massive ice.
Till: Drift deposited directly by glacial ice with no sorting action is called till.
1. IntroductionNorthern Canadian communities are at the forefront of climate change. Permafrost thaw is one of the major threats that they face. Many communities, particularly those within the discontinuous permafrost zone, have ground temperatures just below 0°C. This makes them particularly suscepti-ble to permafrost thaw under a changing climate. Permafrost thaw and the resulting ground shifting and changes in hydrology in these areas may have broad-reaching consequences for people’s ability to travel on the land and on roads, access to traditional food sources, and stability of infrastructure, among other things. This report focuses on the effect of permafrost thaw on the stability of buildings operated by Government of Yukon in Ross River, a small community in south-central Yukon.
As in many Yukon communities, much of the critical community infrastructure is built and/or maintained by the Government of Yukon’s Property Management Division (PMD). PMD ensures that infrastructure such as schools, nursing stations and airports are safe and functional in order to help maintain the vibrancy and overall health of the community. This infrastructure is also an important part of maintaining economic competitiveness, and supports both staff recruitment and population retention. In Ross River, PMD-managed buildings include the school, health centre, water treatment plant and fire hall, airport, pool, nurses’ residence, hockey rink and community centre. All these buildings support economic development at a regional scale.
Ross River is located in the extensive discontinuous permafrost zone (Heginbottom et al. 1995), where permafrost temperatures are typically warm (i.e., > –2°C). Because of the nature of permafrost in the region, infrastructure in the community has often been affected by permafrost thaw and may be at greater risk under a changing climate. Over the past thirty years, the mean annual air temperature in Ross River has warmed by 4.8°C, to approximately –2.0°C (Holubec 2008). Permafrost-related damage to infrastructure has been documented in the community, particularly at the school and Yukon College community campus (e.g., Holubec 2008; Laxton and Coates 2010).
This report describes risks to public infrastructure managed by PMD:• risks to PMD-managed buildings that are most sensitive to the impacts of permafrost
degradation or are considered vital to the health of the community;• characteristics of permafrost soils (e.g., soil texture, excess ice content and temperature)
that underlie high-priority buildings managed by PMD;• the potential consequences of permafrost degradation on sensitive PMD-managed buildings,
and the probability of these consequences occurring in the context of changing climate; and• recommended practices and preventative maintenance that could be implemented to
increase the resilience of PMD-managed buildings in Ross River, and to serve as the basis of PMD best practices with regards to protecting and mitigating risks to planned and existing buildings.
Although this report applies directly to Ross River infrastructure, it may also serve as a guide for other northern communities affected by permafrost. The best practices that this project outlines are important in maintaining the functionality and vitality of northern communities, and ensuring their continued contribution to Canada’s northern economy.
1

1.1 Report organizationThis report is organized into six sections:
• Section 1 is the Introduction.• Section 2 reviews the geological history of Ross River and the design and maintenance
history of the buildings that were assessed in Ross River.• Section 3 provides a detailed review of past and newly collected data regarding the nature of
permafrost beneath and around the assessed buildings.• Section 4 cross-references the steps taken in this assessment with those recommended by
the recently released standard, “CAN/CSA-S501-14: Moderating the effects of permafrost degradation on existing buildings foundations,” published by the Canadian Standards Association (CSA Group 2014b). This was the basis of assessing risk from permafrost degradation for the buildings in Ross River.
• Section 5 of the report discusses thaw mitigation and thaw prevention measures described in the Standard and how they apply to the specific issues identified in section 4.
• Section 6 of the report provides a synthesis of the key issues identified in the report and the potential solutions that may help mitigate thaw and prevent permafrost degradation.
Although this report does touch on issues relating to the structural components of PMD-managed buildings in Ross River, the authors are not structural or geotechnical engineers. Matters regarding technical specifications of the buildings, their performance or any necessary design modifications must be discussed with the relevant experts. This report may guide them regarding information gaps or an interpretation of current permafrost conditions under and around the assessed buildings.
1.2 Methodologyin order to ensure that this project was complete and comprehensive, it was guided by a Project Advisory Committee (PAC) with members from local and national engineering organizations, and Government of Yukon representatives from the Property Management Division of the Depart-ment of Highways and Public Works (PMD) and the Yukon Geological Survey (YGS) as well as Natural Resources Canada (NRCan) and the Northern Climate ExChange (NCE). The committee members were kept informed of project activities and provided feedback as key milestones were achieved.
1.2.1 Preliminary permafrost assessment and identification of sensitive buildingsUnder the guidance of the committee, the project began with a preliminary assessment of PMD-managed buildings that are sensitive to damage by permafrost thaw. Buildings were assessed for their importance to the community or their vulnerability to the known permafrost conditions in the location. This pre-assessment was conducted using surficial geology maps and the results of previous permafrost surveys carried by the Yukon Geological Survey (e.g., Lipovsky and Yoshikawa 2008; Laxton and Coates 2010; and unpublished data). The assessment team compiled and reviewed consulting and geotechnical reports, including PMD material, a database containing geotechnical borehole logs available through NCE, and other geotechnical information available for the area. They also consulted a recently completed hazards mapping project by NCE that classified geohazards from permafrost and flooding (Benkert et al. 2015).
Assessment of Risk to infRAstRuctuRe: Ross RiveR, Yukon
2

The pre-assessment of strategically important buildings was informed by discussions with engineers and building maintenance managers at PMD. The work was based on a range of information:
• PMD’s maintenance records for Ross River infrastructure;• internal PMD geotechnical reports;• information from PMD related to design and structural properties of PMD buildings (with a
focus on building foundations);• PMD observations or recorded occurrences of degradation or suspected degradation of
permafrost in the vicinity of PMD buildings, or damage to PMD buildings that was potentially linked to permafrost thaw; and
• the expertise and experience of PMD staff who work on building management in Ross River.
1.2.2 Detailed permafrost characterization
1.2.2.1 Borehole logsThe logs of boreholes drilled during geotechnical surveys performed by Tetra Tech EBA from 1998 to 2007 were reviewed to determine ground characteristics such as soil lithology and assess some of the permafrost properties in the study area. The information provided by the logs consisted of soil description, grain size distribution, geotechnical properties (plasticity and liquid limits), and ground ice type and content. The presence or absence of frozen ground as a function of depth was reported in the logs.
The borehole logs were used to determine the thickness of the active layer at the time of drilling. The nature of the soil provides insight about the thaw sensitivity of the various stratigraphic layers. Ground ice descriptions and percentage of excess ice content are essential to assessing the potential for thaw subsidence.
1.2.2.2 Ground temperature monitoringAs far back as 1998, some of the Tetra Tech EBA boreholes were instrumented with thermistor wires to monitor ground temperature. Data were recorded either manually by an operator (who periodically measured resistance with a digital multimeter), or automatically (using a data log-ger connected to the thermistor wires). During the present assessment, programmable Campbell CR1000 data loggers were attached to the thermistor wires in two boreholes that previously had been monitored only periodically. This type of logger accurately records temperatures ranging from –50°C to +70°C, with interchangeability to a tolerance of +/– 0.05°C or better. The CR1000 processed and stored the data. The loggers, which are locked in an enclosure and record temperature at one-hour intervals, are powered by a six-volt deep-cycle battery.
Data from the ground temperature loggers are used in the vulnerability assessment for the monitored sites; they provide information about the thickness of the active layer and the thermal equilibrium of the permafrost.
1.2.2.3 Electrical resistivity tomographyElectrical resistivity tomography (ERT) is a geophysical method that produces a two- or three- dimensional image of bodies such as permafrost below the ground. Mineral materials (except for specific substances such as metallic ores) are mostly nonconductive. Therefore, the resistivity of soil or rock is governed primarily by the amount and resistivity of water present in soil and the arrange-ment of the pores. This makes ERT very well suited to permafrost and hydrology applications. Most
1. iNTRODUCTiON
3

water in frozen ground is in the solid phase, and it typically has a higher resistivity than unfrozen water content. This means that permafrost distribution can be inferred based on the changes in resistivity between frozen and unfrozen ground.
An ERT system consists of an automated multi-electrode resistivity meter and a set of wires connected to an electrode array. The surveys in this report used an IRIS electrical resistivity system consisting of a one-channel imaging unit and two electrode cables, each with 24 take-outs at five-metre intervals.
To conduct a survey, 48 electrodes are driven into the ground along a survey line and connected to the electrode cables. A direct-current electrical pulse is sent from the resistivity meter along the survey line. The resulting data consists of a cross-sectional (2D) plot of the ground’s resistivity (Ohm.m) versus depth (m) for the length of the survey.
Results of the surveys were post-treated and analyzed at the NCE using inversion software (Res2DInv64 and Res3DInv 32).
1.3 Summary of key findingsThese key findings are expanded on in the text and repeated in Section 6.
• Permafrost is warm, with a temperature close to 0°C; ground temperature profiles show that permafrost is metastable, suggesting that it is on the brink of thawing.
• The active layer has thickened over time. The top of the active layer is now in thaw-sensitive fine-grained soil.
• The thaw-sensitive permafrost can be as thick as 20 m. Its base is located below 28 m at some locations.
• The ground ice content of 15% suggests that there is the potential for 3 m of subsidence at some locations.
• There are persistent disturbances to the permafrost thermal regime caused by buildings that have since been demolished; these areas should be avoid for future construction. The buildings on these previously disturbed areas may continue to be affected by thaw that was triggered by the former buildings.
• Heating of the crawlspace of the school should be controlled to limit the impact on permafrost thermal equilibrium. Shallow ground temperature monitoring stations could be installed in the crawlspace to monitor and better assess the thermosiphon efficiency. Benchmark cards or similar monitoring methods should be employed if and when new cracks appear in the buildings.
• installing a lining in the rink of the arena would avoid disturbance of permafrost when the ice is melted in spring.
• Snow should be cleared at least 4 m away from all walls, particularly north-facing walls.• Actions should be taken to restrict or divert water that overflows from tanks and the delivery
truck during water refill operations.• Where feasible, the installation of adjustable foundations should be preferred over non-
adjustable methods.• The whole area would benefit from improved ground temperature monitoring, including a
permafrost monitoring station in a natural undisturbed area.
Assessment of Risk to infRAstRuctuRe: Ross RiveR, Yukon
4

5
2. Context and backgroundThe people living in Ross River were the driving motivation for this project. They work in, use and rely on the buildings that were assessed in the project. The buildings are each key parts of the sustainability of the community. The most relevant context for the project is provided by the geological history of Ross River and the design and maintenance history of the buildings and the sites where they are located. These are reviewed in the following sections.
2.1 CommunityRoss River (61.98°N, 132.45°W) is located at the confluence of the Ross and Pelly rivers, on the Canol Road, seven kilometres northeast of the Robert Campbell Highway. The community is located 360 km from Whitehorse via the Canol Road and 410 km from Whitehorse via Carmacks.
In 1952, Ross River had the only remaining trading post in the region. At the urging of the federal government, the historical settlement on the north side of the Pelly River was abandoned in the mid-1960s. The new town was constructed on the south bank, where it remains (Zanasi and Taggart 2006).
In 2006 there were 130 occupied private dwellings in Ross River (YBS 2010). In addition to administration buildings, Ross River has an arena, community centre, swimming pool, daycare, nursing facility and emergency health services, and a school that also houses a community library and the Dene Cho Kê’endį campus of Yukon College. In 2013, 352 people lived in Ross River; approximately 85% of the residents were of Kaska descent (Government of Yukon 2014).
Ross River is the administrative hub for the Ross River Dena Council, which, along with the territorial and federal departments located here, is the main employer in the community (Government of Yukon 2014). Accommodation, food services, recreation services and the arts sector also provide employment in Ross River. Many residents of Ross River continue long- established customs of subsistence living through hunting and fishing, which provides a significant portion of their food resources.
2.2 GeologyThis section summarizes the geology and glacial history of Ross River and its surroundings using excerpts from Benkert et al. (2015).
2.2.1 PhysiographyRoss River is located within the Yukon Plateau–North Ecoregion, which encompasses the Stewart Plateau, Macmillan Highland and Ross Lowland (Smith, Meikle and Roots 2004; Mathews 1986). The community is situated northeast of the Tintina Trench. This prominent linear valley follows the Tintina fault and extends in a northwesterly direction for almost 1,000 km, from the Northern Rocky Mountain Trench in British Columbia to central Alaska. The Yukon Plateau-North Ecoregion includes a 450-km section of the Tintina Trench.
The Stewart Plateau is a series of plateaus separated by a network of broad, deeply cut valleys. The Macmillan Highland consists of small mountain ranges — the Anvil (north of Faro), South Fork, Wilkinson and Russell ranges — which are also separated by broad valleys. The Ross Lowland is slightly lower in elevation, with rolling, rounded hills separated by broad valleys.

Assessment of Risk to infRAstRuctuRe: Ross RiveR, Yukon
6
in the vicinity of Ross River, the Yukon Plateau-North Ecoregion is bounded on the southwest by the Pelly Mountains and on the southeast by the Simpson Range; both are marked by classic alpine mountain ridges and peaks (Jackson 1994). In the Pelly Mountains, elevations range from major valley floors at 700 metres above sea level (masl) to summits that exceed 2,100 m (Jackson 1994). The Tintina Trench separates the Pelly Mountains from the MacMillan Highland, Ross Lowland and Simpson Range (Jackson 1994).
The Pelly River hugs the north side of the Tintina Trench and has an elevation of approximately 700 masl near Ross River; the Pelly River drains northwest into the Yukon River. The Ross Lowland in the region consist of rolling, rounded hills (less than 1,500 masl) and wide, low-elevation valleys. This area contains the headwaters of the Pelly and Ross rivers, as well as the community of Ross River (Jackson 1994).
2.2.2 Bedrock geologyTintina fault is the most striking bedrock geological feature of the study area. It roughly forms the southwest boundary of Tintina Trench (Figure 2.2.2.1) and has not been active since approximately 65 million years ago. The fault juxtaposes rocks of the Cassiar terrane (a displaced fragment of the North American passive continental margin) to the southwest and rocks of the Yukon-Tanana and Slide Mountain terranes (formed in the Paleo-Pacific Ocean) to the northeast. Cretaceous and Tertiary igneous rocks are observed on both sides of the fault. Small basins bounded by normal faults occur near Ross River within a broader Tintina fault zone where early Tertiary volcanic and sedimentary rocks were deposited.
Immediately southwest of the Tintina Trench, the Pelly Mountains are underlain by rocks of the St. Cyr assemblage, a component of the Cassiar terrane. Rocks of the St. Cyr assemblage consist of marine slate and shale (CDS1, 3, 4 and 5 in Figure 2.2.2.1).
Yukon-Tanana and Slide Mountain terranes within and northeast of the Tintina fault zone comprise a wide diversity of rock types. Chert and cherty tuff (a fragmental volcanic rock) are found directly northeast of the Tintina fault (CK3 on Figure 2.2.2.1). A prominent light grey limestone (CK2) is found north of the Danger Creek fault. Dark grey metamorphosed shale (carbonaceous phyllite; DMF3) and pale green metamorphosed basalt (DMF1) are also found in this region. A belt of metamorphosed basalt and chert (CPSM2) is found north of these rocks and extends to the Lapie River fault. Between the Lapie River fault and the northern limit of the Tintina Trench, metamorphosed sandstone, shale and mafic igneous rocks (PDS5) occur.
South of the Ross River townsite, the Tintina fault zone lies between the Tintina fault proper to the south, and the Lapie River fault to the north (Figure 2.2.2.1). In this region, Cretaceous (KS6; ~100 Ma) and Tertiary (lTR3; ~55 Ma) sedimentary and volcanic rocks are faulted against, and possibly locally deposited on, older metamorphosed and deformed sedimentary and volcanic rocks of Yukon-Tanana and Slide Mountain terranes. Near Whisker Lake, approximately three km south of the Ross River townsite, coal-bearing sandstone and conglomerate are faulted against the surrounding rocks of Yukon-Tanana and Slide Mountain terranes. Coal within this sequence was mined in order to dry ore from the Faro lead-zinc mine prior to shipping. Tertiary rocks occur mainly between the Tintina and Danger Creek faults. Tertiary volcanic rocks are primarily rhyolite with lesser basalt; the sedimentary rocks comprise mainly sandstone and conglomerate with local coal.

2. CONTExT AND BACKGROUND
7
Figure 2.2.2.1 Simplified bedrock geology of the Ross River areaSource: Benkert et al. 2015
The southwestern portion of the Ross Lowlands are primarily underlain by mafic volcanic rocks (e.g., basalt, gabbro and greenstone (CPSM1 KS6 on Figure 2.2.2.1); chert (CPSM2); and lesser ultra-mafic rocks (pieces of the earth’s mantle; CPSM4) of the accreted Slide Mountain terrane. Farther to the north, the Ross Lowland is underlain by ancient North American (Laurentian) sedimentary rocks (COR1 and lCG1), and mid-Cretaceous (~109-97 Ma) Tay River Suite plutonic rocks (mKgTR), including quartz monzonite and granodiorite.
LEGENDSiMPLiFiED GEOLOGYLOWER TERTIARY, MOSTLY(?) EOCENE (2-65 Ma)
ITR3: Ross claystone, siltstone, shale, coal, sandstone and conglomerateMID-CRETACEOUS (~97-109 Ma)
mKgTR: Tay River granodioriteLOWER CRETACEOUS (65-97 Ma)
KS6: Sharp Mountain chert sandstone and chert pebble conglomerateLOWER AND MIDDLE JURASSIC, HETTANGIAN TO BAJOCIAN (145-200 Ma)
JFP3: Faro Peak shale and limestoneLATE DEVONIAN TO MISSISSIPPIAN (320-380 Ma)
MqSR: Simpson Range granite and granodioriteDEVONIAN, MISSISSIPPIAN (320-420 Ma) AND(?) OLDER
DMF3 (Yukon Tanana Terrane): Finlayson carbonaceous phyllite, quartzite and chertDMF1 (Yukon Tanana Terrane): Finlayson mafic volcanic rocks
LATE PROTEROZOIC AND PALEOZOICPDS5 (Yukon Tanana Terrane): Snowcap psammite, quartzite and amphibolite metamorphosed to eclogite faciesPDS2 (Yukon Tanana Terrane): Snowcap marble
CARBONIFEROUS (290-360 Ma)CK2 (Yukon Tanana Terrane): Klinkit limestone CK3 (Yukon Tanana Terrane): Klinkit epiclastics (tuff)
CARBONIFEROUS TO PERMIAN (250-360 Ma)CPSM (Slide Mountain Terrane): (1) mafic volcanic; and (4) ultramafic rocksCPSM2 (Slide Mountain Terrane): chert
CAMBRIAN TO DEVONIAN (362-544 Ma) OR YOUNGER CDS (Cassiar Terrane): St. Cyr (1) calcareous shale and silty limestone; (3) slate and silty shale; (4) siltstone and orthoquartzite; and (5) phyllite and limestone
UPPER CAMBRIAN AND ORDOVICIAN (~443-500 Ma)COR1 (Laurentia): Rabbitkettle limestone and calcareous phyllite; siltstone and chert; local mafic flows, breccia, and tuff
LOWER CAMBRIAN (~520 Ma)lCG1 (Laurentia): Gull Lake shale, siltstone and mudstone with local limestone, phyllite and schist
OTHER FEATURESsurficial geology map extent (Turner 2014)community hazard mapping footprint1:5M physiographic regions (Mathews 1986)
FAULTSRELiABiLiTY
inferredapproximatedefined
TYPEnormalthruststrike-slip

Assessment of Risk to infRAstRuctuRe: Ross RiveR, Yukon
8
2.2.3 Glacial historyThe present-day landscape of Ross River is largely a product of glacial activity during the Pleistocene (2.6 million years to 10 thousand years (ka) before present). This activity combined with more recent Holocene (10 ka to present) modification by streams, erosion and deposition, and by colluvial (gravity) and cryogenic (ground freezing) processes.
Although the area was repeatedly glaciated during the Pleistocene, most of the material deposited by glaciations has been eroded or buried. The oldest glacial sediments in the study area could be from either the early Wisconsin Gladstone glaciation (ca. 75–60 ka) or the previous Reid glaciation (ca. 190–130 ka). These sediments are mostly buried beneath younger deposits (Plouffe 1989; Jackson 1994). Most of the surficial materials and glacial landforms in the study area were deposited in the late Wisconsin McConnell glaciation (ca. 25–10 ka).
During the onset of the McConnell glaciation, ice flowed from well-developed alpine cirques in the Pelly Mountains and down the Lapie River valley into the Tintina Trench (Plouffe 1989). The influx of meltwater into the trench from these accumulating glaciers caused the Pelly River to develop a braided and rapidly building floodplain (Ward and Jackson 2000). This initial phase of glaciation was followed by an advance of the Selwyn lobe of the Cordilleran ice Sheet from its source region in the Selwyn Mountains (Jackson and Harington 1991). During glacial maximum, an ice divide formed east of Finlayson Lake. Ice from this divide flowed southeast toward the Liard Lowland and northwest down Tintina Trench across the study area.
At its maximum, the Cordilleran Ice Sheet reached elevations between 1,550 and 1,900 masl over Faro and Ross River (Jackson 1994), covering all but the highest peaks. The ice sheet was composed of numerous ice streams that coalesced around and out of large topographic obstacles such as the Anvil Range (Jackson 1989; Bond 1999). The maximum age for the start of the McConnell glaciation in the Ross River area is 26,350 ± 280 before present (BP) (Jackson and Harington 1991).
Following McConnell ice retreat, a large glacial lake formed in the Tintina Trench (Bond 2001a; Jackson 1994). It deposited the thick glaciolacustrine sediments that are exposed in steep escarpments below the town of Faro and along the banks of the Pelly River in many places.
During the Holocene, a number of changes to the landscape occurred in the shift from a glacial to a non-glacial regime. At the beginning of the Holocene, freshly exposed and unstable glacial deposits contributed increased sediment loads to braided streams; this caused the rapid build-up of alluvial fans and the Pelly and Ross river floodplains. Organic deposits began to accumulate at the surface as warmer and wetter climatic conditions returned and vegetation and soil processes were re-established. As the supply of upland erosion and sediment gradually declined, streams changed from braided to meandering systems. Terraces (such as the glaciofluvial terrace at the mouth of the Ross River) formed as streams incised into the former fans, floodplains and glacial sediments. This began at least 8,000 years BP (Jackson 1994) and continued until sometime before 1,200 years BP (Jackson 1994).
2.2.4 Surficial materialsSurficial materials in the Ross River area are broadly classified into a variety of genetic types, based on the physical processes they derive from. These processes are organic (soil development); colluvial (downslope movement or creep); fluvial (rivers and streams); and glacial (ice, glacial streams and

2. CONTExT AND BACKGROUND
9
lakes). Each of these material types are described below, according to their texture or grain size (e.g., gravel, sand, silt or clay); sorting (variety of grain sizes); structure (e.g., layering or bedding); association with permafrost; and general distribution.
2.2.4.1 Organic materialsOrganic materials are produced by the accumulation of decomposing vegetative matter and contain at least 30% organic matter by weight. They are generally found at the surface in flat or low-lying areas and in poorly drained depressions. Poor drainage associated with these materials inhibits their decomposition. Shallow permafrost is commonly encountered in or beneath these materials due to their insulating capacity.
2.2.4.2 Volcanic materialsA distinctive white layer of volcanic ash is known as the White River tephra. In most areas the tephra is immediately below the surface organic layer where plants now grow. it is generally not mapped because it is so thin (typically 10–20 cm thick in this area). The source of the volcanic ash was near Mt. Bona-Churchill in the St. Elias Mountains, about 25 km west of the Yukon-Alaska border. The most recent eruption occurred approximately 1,200 years ago (Lerbekmo and Campbell 1969; Clague et al. 1995; Lerbekmo 2008; Jensen et al. 2014).
2.2.4.3 Colluvial materialsColluvium is sediment that is transported and deposited on or at the foot of slopes by gravity- driven processes such as creep, solifluction, landslides and snow avalanches. Colluvium is common on moderately steep to steep slopes and in areas of high relief such as the Pelly Mountains. it typically comprises poorly sorted sediment that ranges in size from clay to boulders. The extent of permafrost in colluvium varies greatly, depending on soil texture, topography and surface expression.
2.2.4.4 Fluvial materialsFluvial sediments are transported by streams and rivers and deposited as floodplains, alluvial fans and terraces. They typically consist of well-sorted, stratified sand and rounded gravel, with varying amounts of silt and organic materials. Silt, sand and organic materials make up thinly laminated or massive deposits that are often combined with coarser gravel deposits. Floodplain sediments are widespread adjacent to the Pelly River and in and around Ross River, where they reach thicknesses greater than 13 m (Environment Yukon 1976). Fans are common where streams enter broad valleys. Narrow, higher-elevation floodplains typically contain coarser-grained deposits compared to large, lower-elevation floodplains, where finer-grained sediments tend to accumulate. Steep bedrock canyons have also been cut along the Lapie River. Permafrost is uncommon in active fluvial deposits that have recently flooded or are subject to regular flooding, but may be found at depth in inactive floodplain areas.
2.2.4.5 Glaciofluvial materialsGlaciofluvial sediment was deposited by glacial meltwater either directly in front of, or in contact with, late Wisconsin McConnell glacial ice. The sediment is typically poorly to well-sorted; rocks are rounded; and deposits tend to be composed of stratified gravel and sand. Typically, glaciofluvial fans are partly covered by smaller Holocene fans. Glaciofluvial materials are highly porous, which results in largely ice-free deposits or deep active layers. Sediments may be more ice-rich in areas with discontinuous fine-grained sand and silt beds.

Assessment of Risk to infRAstRuctuRe: Ross RiveR, Yukon
10
2.2.4.6 Morainal materialsMorainal deposits (also referred to as till) were deposited by late Wisconsin McConnell glacial ice without modification by any other process. These deposits are widespread, both in valley bottoms and across gentle to moderate slopes in the Tintina Trench. Till is typically a poorly sorted and consolidated mixture of silt, sand and clasts that are rounded to angular and pebble to boulder-sized. Till may be thin (less than 15 cm) at high elevations, but can be more than 50 m thick across the study area (Environment Yukon 1990). Morainal deposits typically follow the underlying topography (Plouffe 1989; Bond 2001b). Heavily compacted basal till is abundant across the Tintina Trench.
2.2.4.7 Glaciolacustrine materialsGlaciolacustrine materials primarily consist of clay, silt, and sand that was deposited in glacial lakes during late Wisconsin McConnell deglaciation. Glaciolacustrine deposits are widespread in the Tintina Trench, and reach thicknesses greater than 10 m. Many of these deposits are covered by glaciofluvial, colluvial, lacustrine and organic sediment. A notable exception to this are the large gla-ciolacustrine terraces on the southwest side of the Pelly River. These terraces are approximately 30 m above the Pelly River floodplain. Glaciolacustrine terraces also exist on the northeast side of the river, but they have been covered by 5–10 m of glaciofluvial sediment and are therefore mapped as glaciofluvial deposits. The low permeability of glaciolacustrine deposits promotes thin active layers. Thermokarst lakes and segregated ice lenses are common in these deposits, indicating the presence of ice-rich permafrost near the surface.
2.2.5 StratigraphyThe stratigraphy of the Ross River area varies greatly (Figure 2.2.5.1), but generally reflects glacial history and subsequent Holocene fluvial and colluvial activity. Pre-McConnell till, as well as glacio-lacustrine and glaciofluvial sediments, have been documented at the base of a few scattered expo-sures along the Pelly and Lapie rivers (Plouffe 1989; Jackson 1993). However, most of the study area is blanketed by McConnell till up to 40 m thick (Turner 2014) that was deposited by gravity on slopes and escarpments. In some cases, the till is interbedded with glaciofluvial and/or glaciolacustrine sediments as a result of complex deglaciation processes and active ice retreat.
Figure 2.2.5.1 Hypothetical stratigraphy across Tintina Trench in the vicinity of Ross RiverSource: Benkert et al. 2015. Note: Unit thicknesses are exaggerated for visual clarity. Relative thicknesses are estimated based on aerial photo interpretation, borehole logs and observation of stratigraphic exposures. Bedrock labels refer to units described in Figure 2.2.2.1.

2. CONTExT AND BACKGROUND
11
During McConnell deglaciation, a large glacial lake formed in the Tintina Trench, depositing thick glaciolacustrine sediments in the valley bottom (Bond 2001a); glaciofluvial sediments were also deposited in surrounding areas. After the lake drained, thick fluvial sediments were deposited above the glaciolacustrine sediments in the Pelly River and major tributary valleys. Beneath the Ross River School, fluvial sediments 6 m thick were deposited on at least 20 m of glaciolacustrine clay, silt and sand (EBA Engineering Consultants 2007; unpublished data).
2.3 ClimateThe 100-km2 region that includes the communities of Faro and Ross River is located in the central Yukon Basin (Wahl et al. 1987). The St. Elias Mountains and the region’s distance from the Gulf of Alaska influence its climate, making it different from areas in southern Yukon. Temperatures are highly variable; summers can be extremely warm, while winters can have long, very cold periods. Precipitation in Faro and Ross River is typically lower than at other stations in this region, due to a local rain shadow provided by the St. Cyr Range in the Pelly Mountains. Storms commonly skirt this region, especially in winter (Wahl et al. 1987).
2.3.1 Contemporary climateClimate data from Faro Airport were obtained from Environment Canada. This is the nearest location where long-term data have been collected. The station is similar in elevation to Ross River, and is also located in the Tintina Trench, so Ross River and Faro are expected to have very compara-ble climatology. A weather station has operated at the Faro airport using a combination of manual observations and automatic station measurements with limited interruptions since the mid-1960s, although changes in observation methods and small adjustments in station location make it difficult to use data collected before the 1960s. The automatic station was installed in the 1980s.
Most years had some missing temperature data. Sometimes it was a few consecutive days, some-times a few random days, at other times whole months. Missing days were usually replaced with their twenty-year average. If manual observations were missing, data from the automatic station were used, adjusted for the difference in the average values between those of the manned and the automatic stations. There were no useful data from either station for the year 2002. Data for the years 2007–10 were taken entirely from the automatic station (Michael Purves, pers. comm., 2011).
Faro is missing precipitation records for December 2000 and many records for 2002 on, except for 2006. Records from the automatic station did not appear to be very reliable, so the analysis of Faro’s precipitation ended at 2001 (Michael Purves, pers. comm., 2011).
Mean annual air temperature (MAAT) in Faro is –3.2°C; average January and July temperatures are –20.1°C and +15.0°C, respectively. Average annual precipitation is 319.7 millimetres (mm), approximately one-third of which falls as snow during the winter (Environment Canada 2014b). Month-by-month climate normal temperature and precipitation data are summarized in Figure 2.3.1.1.
Air temperatures vary with elevation. Measurements at several elevations on the road between the valley bottom and treeline show that MAAT decreases by –2.3°C per 1,000 m increase in elevation (Lewkowicz and Bonnaventure 2011). This is a much slower rate of cooling than the global average of –6.5°C per 1,000 m and is due to cold air pooling in the valley bottoms in winter, which offsets the more normal warmer conditions in the valley bottoms in summer.

Assessment of Risk to infRAstRuctuRe: Ross RiveR, Yukon
12
Figure 2.3.1.1 Climate normal (1981–2010) data for the Faro Airport meteorological monitoring stationSource: Environment Canada 2014b. Note: To calculate total precipitation in mm, snowfall was converted to snow water equivalent (SWE) and summed with rainfall.
2.3.2 Past climate trendsEnvironment Canada produces regional summaries of climate and precipitation data that generalize climate trends by integrating data from several stations (Environment Canada 2014a). For this region, Environment Canada amalgamates data from northern British Columbia and Yukon stations; this has allowed them to develop a record of regional climate trends that spans the past 65 years. Data indicate that between ~1950 and 1975, the regional climate was generally cooler and drier than nor-mal (based on 1961–1990 climate conditions); between ~1975 and 2013, the climate was generally warmer and wetter than normal (Figure 2.3.2.1).
To examine past climate trends, the historical data record from the Faro Airport meteorological mon-itoring station was studied. Temperature data is available for the period 1979–2013 (Figure 2.3.2.2). The data were amalgamated by season for simplicity, and linear regressions were superimposed on seasonal data records. Although the trends they represent are not statistically significant, the regres-sion lines provide a basis for identifying potential temperature trends over the period.
The greatest range in seasonal temperature variability occurred in the winter, with a 14.8°C dif-ference in the highest and lowest recorded temperatures over the period of record. in contrast, summer temperature variability was only 3.7°C. Temperature ranges in spring are similar to those in fall (6.4°C and 8.1°C, respectively). Regression lines suggest that winter temperatures increased slightly over the period of record, which is consistent with modelling that predicts that temperature increases due to climate change will be greatest in winter (Warren and Lemmen 2014). Interestingly, summer temperatures also appear to have increased slightly over the period of record, while shoul-der-season temperatures (spring and fall) remained relatively stable or declined slightly.

2. CONTExT AND BACKGROUND
13
Figure 2.3.2.1 Regional climate trends for northern British Columbia and YukonSource: based on data amalgamated by Environment Canada (2014b). Note: Data has been normalized to indicate deviation from 1961–1990 climate normal conditions. Negative values indicate precipitation amounts and temperatures below normal for the 1961-1990 period, while positive values indicate above normal conditions.
2.3.3 Projected climateProjected yearly and seasonal temperature changes for the Faro and Ross River region are shown in Table 2.3.3.1. This table shows the modest change scenario (B1) as well as the medium to high change scenario (A1B). Global emissions are currently above what was projected in the A1B scenario.
In Table 2.3.3.1, change is expressed in degrees Celsius relative to baseline climate normal values for 1961–1990 (SNAP 2013; Michael Purves, pers. comm., 2011). Values in brackets are relative amounts indicating change from the 1961–1990 baseline and include direction and amount of projected change. Increasing and decreasing trends are indicated by “+” and “–”, respectively.
Table 2.3.3.1 Baseline and projected temperatures for Faro (0°C)
Season Baseline (1961–90)
Modest climate change (B1) Medium-high climate change (A1B)
2030 2050 2030 2050
annual –3.2 –0.5 (+0.2) –0.1 (+3.1) –0.7 (+2.5) 1.2 (+4.4)
spring –2.6 0.8 (+3.4) 1.6 (+3.6) 0.8 (+3.4) 2.9 (+5.5)
summer 10.5 13.8 (+3.3) 14.1 (+3.6) 13.2 (+2.7) 14.6 (+4.1)
autumn –3.6 –1.1 (+2.5) –0.2 (+3.4) –1.3 (+2.3) –0.2 (+3.4)
winter –16.8 –16.3 (+0.5) –15.7 (–0.9) –15.7 (–0.9) –13.5 (+3.3)

Assessment of Risk to infRAstRuctuRe: Ross RiveR, Yukon
14
Figure 2.3.2.2 Past temperature records measured at the Faro Airport meteorological monitoring station Source: Environment Canada, 2014b. Note: Seasonal average and mean annual temperatures are illustrated (spring = Mar–May; summer = Jun–Aug; fall = Sep–Nov; winter = Dec–Feb). Dotted lines denote linear regressions for each data series.
The frost-free period in the Faro and Ross River region is projected to become longer by 19 to 31 days by 2050. Following this projection, the date of freeze-up in the region is expected to occur 11 to 14 days later by 2050. The date of thaw in the Faro region is expected to occur 10 to 16 days earlier by 2050.
2.4 VegetationVegetation in the area ranges from boreal to alpine, depending on elevation, topography and micro-climate. Northern boreal forest exists at elevations up to 1,500 m. Areas of higher elevation in this ecoregion are characterized by shrub and lichen tundra. in the subalpine environment, the dominant vegetation types include shrub birch, pine, white spruce, subalpine fir and a lichen understorey. Extensive shrublands exist at mid-elevations and on valley bottoms. In the boreal zone, open black spruce forest with a moist moss or drier lichen understorey is dominant. Black spruce dominates in poorly drained areas and often indicates the presence of underlying permafrost (Jackson 1994).
2. CONTExT AND BACKGROUND
15
Mixed-canopy forests are common and are the result of frequent forest fires (Smith, Meikle and Roots 2004). The fires are most often caused by thunderstorms and lightning strikes along the Tintina Trench, which are frequent in the area. Lodgepole pine frequently invades burned areas, occasionally forming extensive forests. Trembling aspen and balsam poplar are also common on disturbed sites. Paper birch is scattered throughout the ecoregion, usually at cooler sites.
Low ericaceous shrubs, prostrate willows and lichens dominate the alpine. Talus slopes are common at high elevations and support communities of crustose lichens. Moister sites support more moss and graminoids than lichen.
Grasslands consisting of sagewort, juniper, kinnikinnick, forbs and aspen are common along the banks of large rivers.
The wetlands on the margins of small lakes, marshes and shallow open water are dominated by willows, sedges and aquatic plants. Black spruce bogs, containing sedge tussocks and sphagnum moss and underlain by permafrost, occur in lowland areas.
2.5 Hydrology2.5.1 Surface waterThe subwatershed of the Ross River region is part of the Yukon River watershed. Its drainage flows west from the southern foothills of the Selwyn Mountains to the Yukon River. The streams that descend from the foothills are generally steep and relatively short, producing rapid responses during the spring melt and some of the highest peak flows in Yukon. Mean annual runoff is moderately high compared with other regions of the territory, at 236–385 mm (average 309 mm; Smith, Meikle and Roots 2004). Peak river flows generally occur in May and June in response to melting snow in spring; secondary discharge peaks in response to late summer and autumn rainfall are also possible. Lowest flows typically occur in this region in March and April, when groundwater contributions, the only inputs to river discharge at this time, are minimal (Janowicz 2008).
The community of Ross River is situated at the confluence of the Ross and Pelly rivers, at 693 masl on an alluvial terrace of the Pelly River. Here, the 100-year flood elevation of the Pelly River is estimated at 694 masl (Gartner Lee Limited 2003), making the community susceptible to flooding. Notably, localized flooding occurred twice in Ross River in summer 2013, when high water due to heavy snowpack and a break in an upstream ice jam breached the dike that protects the community (CBC 2013). The Ross River, from its headwaters in the Mackenzie Mountains to its confluence with the Pelly River at the town of Ross River, drains an area of approximately 7,300 km2 (Water Survey of Canada 2015).
2.5.2 GroundwaterRelatively little information is available regarding groundwater in the Ross River area. The water table is reported to be 1.0–3.2 m below the surface, within shallow deposits of sand and gravel that are likely hydraulically connected to the Pelly River (Gartner Lee Limited 2003). There are four ground-water wells in Ross River: two domestic, one commercial/institutional, and one municipal/communal (installed in 1986 and considered to be the municipal well). The municipal well is in a deep aquifer, which occurs at 105–110 m below the ground surface (Gartner Lee Limited 2003). Low-permeability silt and sand deposits are between the shallow water table and the deep aquifer in the area.

Assessment of Risk to infRAstRuctuRe: Ross RiveR, Yukon
16
2.6 Permafrost2.6.1 Formation and degradationPermafrost can take decades or even centuries to form, and similarly long periods to degrade, although degradation can quicken if water accumulates on the surface or if ice within the ground is exposed. The surface organic mat and vegetation can help preserve the permafrost if there is a warm period that lasts several decades. This is termed ecosystem-protected permafrost (Shur and Jorgenson 2007). Conversely, forest fires that are severe enough to destroy the organic mat may lead to rapid, permanent loss of permafrost. Due to the cold climate, it can be assumed that permafrost existed beneath any exposed land during the last glacial period and formed in newly exposed land during deglaciation. During the Holocene, permafrost may have aggraded and degraded several times in response to climate fluctuations. The latest phases of such changes are the cooler period of the Little Ice Age (which lasted for several centuries up to the late 19th century), and the 20th century warming that has continued through to the present. Since there are usually lags in the reaction of permafrost, permafrost in the area is likely in a degrading phase.
2.6.2 Impact of vegetation and soil texture on permafrost characteristicsIn undisturbed settings, forest cover keeps the ground cool by providing shade, increasing soil moisture (moisture absorbs heat before it reaches the permafrost) and diffusing energy from the sun before it hits the ground. in the winter, trees retain snow; this reduces the snow cover on the ground that provides an insulating layer between the atmosphere and the ground (Brown 1963; Brown and Péwé 1973). Clearing the forest cover by machinery or forest fire usually leads to a deepening of the active permafrost layer and degradation of the upper layers of permafrost. When low-lying vegetation such as mosses and grasses is also removed, these effects are much more pronounced.
The organic soil (i.e., peaty materials) that is generally found near the surface has very low thermal conductivity when dry, which reduces heat transfer to lower sediment beds in summer. However, the porous nature of peat allows it to retain a significant amount of water or pore ice, and in winter, when the peat is frozen and saturated with ice, it increases heat transfer. Consequently, under a thick organic mat, the active layer is thin and colder permafrost may develop. Peat is solid when frozen, but becomes highly compressible when thawed. if it is compressed, porosity and hydraulic conductivity decrease and thermal conductivity increases. Since organic cover is one of the most significant drivers of ground ice sustainability, removing or compacting it can initiate degradation of the underlying permafrost. Additionally, high hydraulic conductivity in areas of groundwater flow can lead to preferential flow paths and discharge areas. When a flow pattern is disturbed by removal or compaction of the organic cover and degradation of the underlying perma-frost, water accumulation may trigger further localized permafrost degradation by heat advection through groundwater and subsequent freeze-back (latent heat of water).
Four surface material types were identified in the Ross River area based on their geotechnical characteristics. They were classified using the Unified Soil Classification System (USCS) as gravel, sand, silty sand and silt.
The gravel has a fluvial origin. A sample from the old townsite of Ross River contains a layer composed of sub-rounded cobbles and pebbles, with little fine-grained matrix. Since fluvial sediments are generally coarse-grained and well-drained, they generate deposits that are not susceptible to frost. Where permafrost is present, these sediments do not contain excess ice and

2. CONTExT AND BACKGROUND
17
are mechanically stable when they thaw. However, fluvial gravel sometimes contains a significant amount of fine-grained material such as silt. The presence of finer grained sediments increases the potential for segregated ice to form. When contained in permafrost, these deposits display layers with ice-rich cryostructures and are characterized by strong, differential thaw settlement.
Sand layers are generally well-drained and do not contain excess ice. However, fine and very fine sand is susceptible to frost, and may contain excess ice in the form of alternating ice lenses. When materials with excess ice thaw they undergo thaw settlement and will drain more slowly than medium to very coarse sand. Under certain hydrologic and thermal conditions, coarse silt and fine sand may contain a great amount of excess ice in various forms; these two deposit types have significant potential for ice segregation (Darrow et al. 2008).
Silt deposits in the area have a fluvial or lacustrine origin. They are usually highly susceptible to frost. If silt is present in the active layer, and if water is available, this leads to annual frost heave and ground settlement. If a silty layer occurs at or below the permafrost table the upper part of the permafrost will typically be ice-rich and mechanically unstable when it thaws. Poor drainage characterizes these permafrost-degraded areas.
2.6.3 Contemporary permafrost distributionThe spatial pattern of current permafrost conditions in the Ross River region can be extracted from a model of permafrost probability developed for the southern half of Yukon (Bonnaventure et al. 2012). This model is essentially climate based and takes into account the impacts of solar radiation and air temperature trends as well as elevation (Lewkowicz and Bonnaventure 2011), but does not account for site-specific factors such as snow depth or surficial materials. Most of the terrain in the region has permafrost probabilities of 60–70%. Permafrost probability is lower on many south-facing slopes (50–60%) and higher on north-facing slopes (70–80%; figure 2.6.3.1).
Figure 2.6.3.1 Permafrost probability under current climate conditions for the Ross River study areaBased on Bonnaventure et al. 2012

Assessment of Risk to infRAstRuctuRe: Ross RiveR, Yukon
18
2.7 Buildings managed by PMDEarly in the project, NCE staff met with officials from PMD to discuss the public buildings that the Government of Yukon is responsible for in Ross River. From that discussion and subsequent research it was determined that resources would best be spent by focusing on four buildings in a central cluster of the village, rather than on sites across a broader area. These four buildings are the school, community centre, pool, and recreation centre and arena (Figure 2.7.1). They are highly valued by the community and strategically important to the Government of Yukon. in many cases, they have a history of maintenance problems related to permafrost degradation and differential shifting.
Two other buildings are described briefly below: the public works building and a grader maintenance building. These are referred to in specific parts of our risk assessment and recommendations (Section 4 and 5, respectively), but were not included in the detailed assessment.
Figure 2.7.1 Four buildings being assessed
At the beginning of the survey, the four buildings ranged in age from 1 to 15 years old. The site history of each building and its use and construction style introduce a number of variables to the assessment of risk from permafrost thaw induced by climate change. Key features of each building are described below. This information was collected from building condition reports, communication with PMD officials, and direct observation.

2. CONTExT AND BACKGROUND
19
2.7.1 School
Year completed: 2001 (built from 1999–2001)
General site characteristics:
Flat ground with limited near-by vegetation. Slight grading from east to west.
Foundation: Steel frame on concrete pil-ings; enclosed, heated crawlspace 1.5–2 m below grade. Crawlspace floor system has thin concrete skim-coat on poly vapour barrier, 150 mm of rigid insulation, sand and compacted gravel.
Building has thermosyphons 2–2.5 m below grade after excavation of original material (11–12 fins are flat-looped in 3 zones).
Use: Elementary school (K–10); library; Yukon College Community Campus
Site history (if known):The previous school was located west of the new school, on a lot now vacant between the school and the daycare/community centre. The old school was built in 1972 on a concrete slab at grade foundation with cryo-anchors. It was demolished in 2002. Water leaks from the washrooms caused damage to the structure, and likely affected the permafrost under the building; water pooled towards the middle of the structure.
Assessment of Risk to infRAstRuctuRe: Ross RiveR, Yukon
20
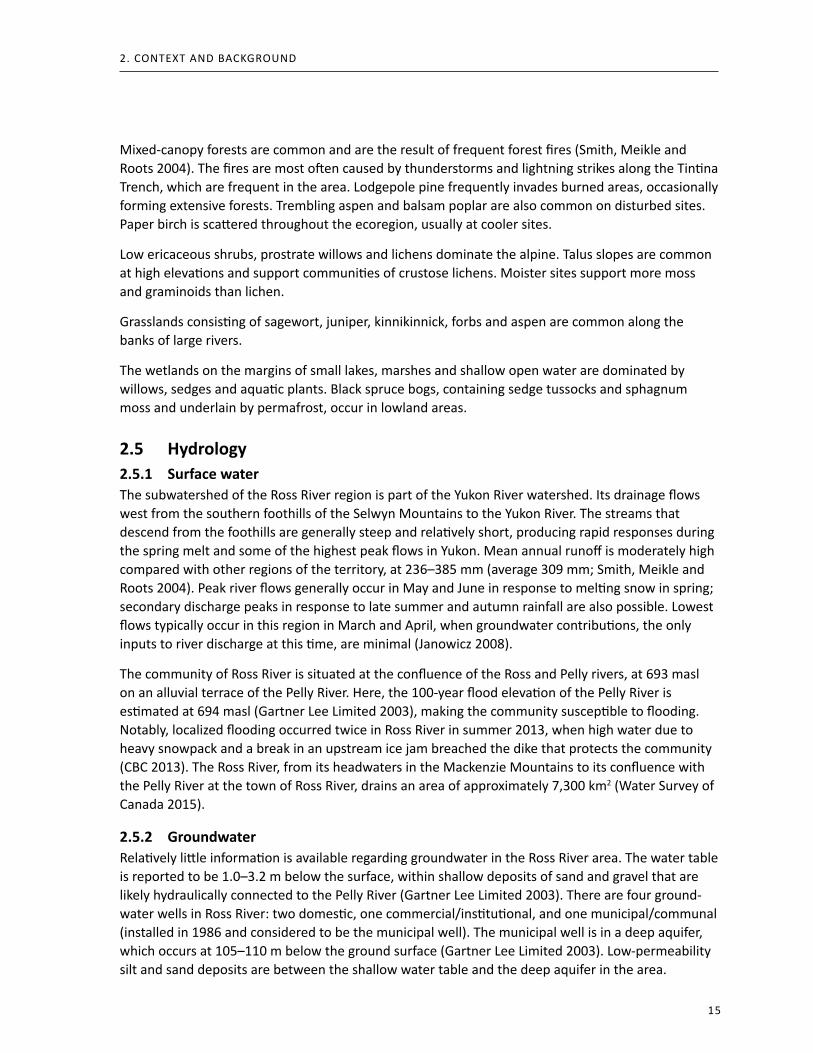
Figure 2.7.1.1 Damage to drywall in the northeast part of the school
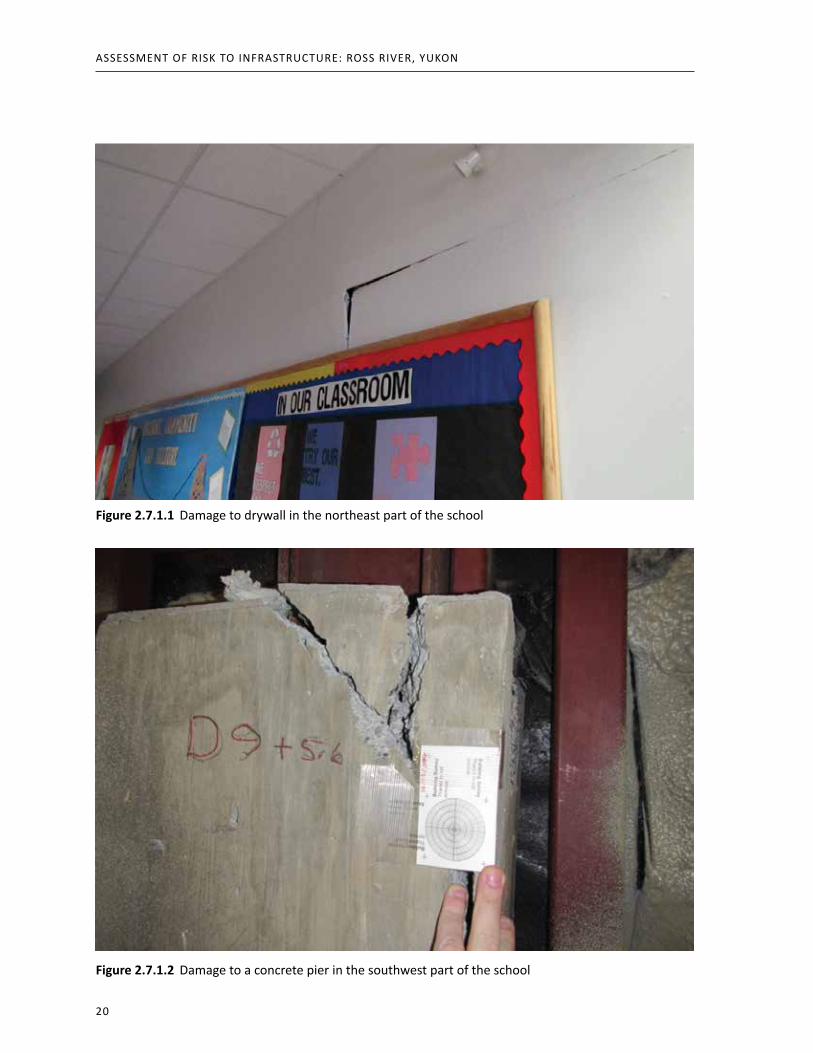
Figure 2.7.1.2 Damage to a concrete pier in the southwest part of the school

2. CONTExT AND BACKGROUND
21
2.7.2 Community Centre
Year completed: 2005 (built from 2004–2005)
General site characteristics:
Flat ground with nearby low shrubby vegetation nearbySlight grading from east to west; drainage ditch along north side
Foundation: Steel piles and gravel pad
Use: Community centre and daycare
Site history (if known):Previously this was the site of the curling rink, a log building on a gravel pad.

Assessment of Risk to infRAstRuctuRe: Ross RiveR, Yukon
22
Figure 2.7.2.1 Repaired sewer line; sewer line had leaked for an unknown amount of time
Figure 2.7.2.2 Extension added to piers on the community centre/daycare

2. CONTExT AND BACKGROUND
23
2.7.3 Pool
Year completed: 1999
General site characteristics:
Flat ground surrounded by low shrubby vegetation
Foundation: Changing area, manager quarters on concrete pad at grade; concrete pool basin and mechanical area 2–3 m deep; thermosyphon below the pool
Use: Pool; seasonal use
Site history (if known):No known history

Assessment of Risk to infRAstRuctuRe: Ross RiveR, Yukon
24
2.7.4 Recreation Centre and Arena
Year completed: Originally built 1989; rebuilt after fire, completed in 2014
General site characteristics:
Flat ground with forested area to south
Slight grading from south to north; drainage ditch along north side
Foundation: Steel pilings of unknown depth; gravel arena surface
Water tank under boiler room in Recreation Centre
ice from arena melts directly into ground unless removed mechanically
Use: Arena; seasonal use
Site history (if known):This has been the site of the Recreation Centre since 1989. The building was unused for many years. No prior history was collected. Temperature monitoring has occurred around the building, but not directly below it.

2. CONTExT AND BACKGROUND
25
2.8 Building Studied for Best Practices and Recommendations2.8.1 Highways Maintenance Shed
Year completed: Original building in 1965; addition in 1969
General site characteristics:
Flat gravel pad; no vegetation; poor drainage from site
Foundation: Concrete slab at grade; no cooling
Use: Grader maintenance shed
Summary of damage from movement:Differential movement has caused siding to buckle and roofline to bowSubstantial cracking in slab
Site history (if known):No known history
3. Detailed Permafrost Characteristics
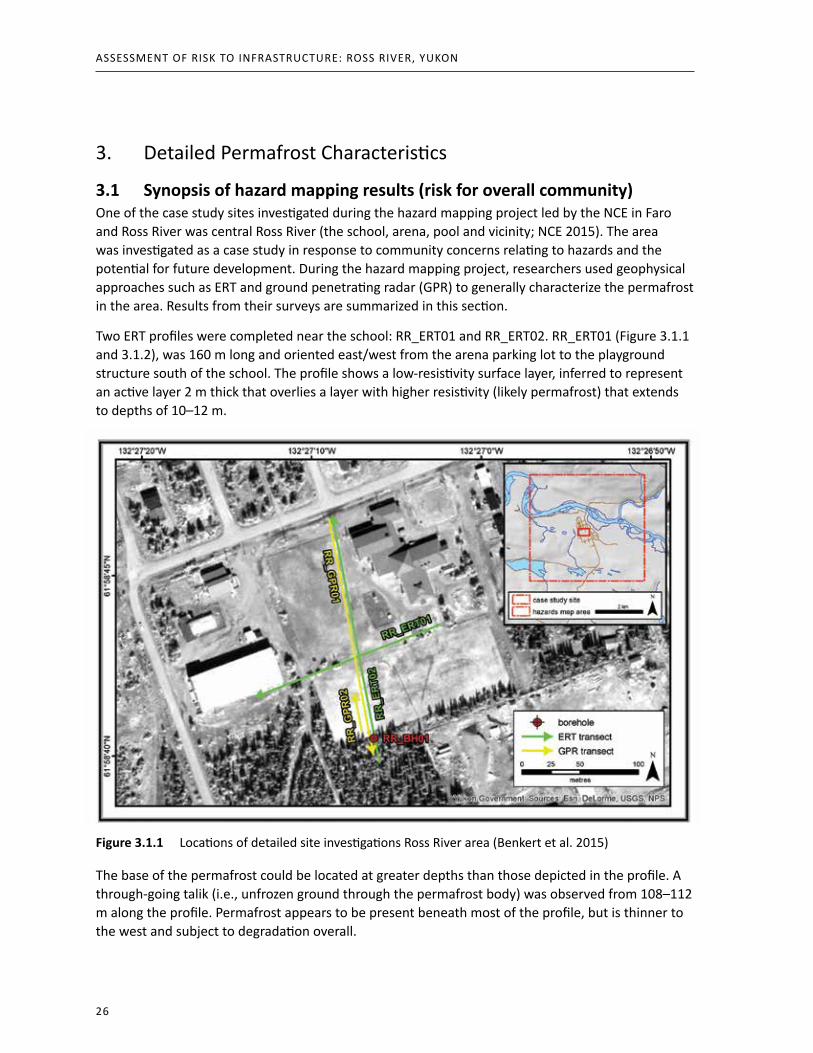
3.1 Synopsis of hazard mapping results (risk for overall community)One of the case study sites investigated during the hazard mapping project led by the NCE in Faro and Ross River was central Ross River (the school, arena, pool and vicinity; NCE 2015). The area was investigated as a case study in response to community concerns relating to hazards and the potential for future development. During the hazard mapping project, researchers used geophysical approaches such as ERT and ground penetrating radar (GPR) to generally characterize the permafrost in the area. Results from their surveys are summarized in this section.
Two ERT profiles were completed near the school: RR_ERT01 and RR_ERT02. RR_ERT01 (Figure 3.1.1 and 3.1.2), was 160 m long and oriented east/west from the arena parking lot to the playground structure south of the school. The profile shows a low-resistivity surface layer, inferred to represent an active layer 2 m thick that overlies a layer with higher resistivity (likely permafrost) that extends to depths of 10–12 m.
Figure 3.1.1 Locations of detailed site investigations Ross River area (Benkert et al. 2015)
The base of the permafrost could be located at greater depths than those depicted in the profile. A through-going talik (i.e., unfrozen ground through the permafrost body) was observed from 108–112 m along the profile. Permafrost appears to be present beneath most of the profile, but is thinner to the west and subject to degradation overall.
Assessment of Risk to infRAstRuctuRe: Ross RiveR, Yukon
26
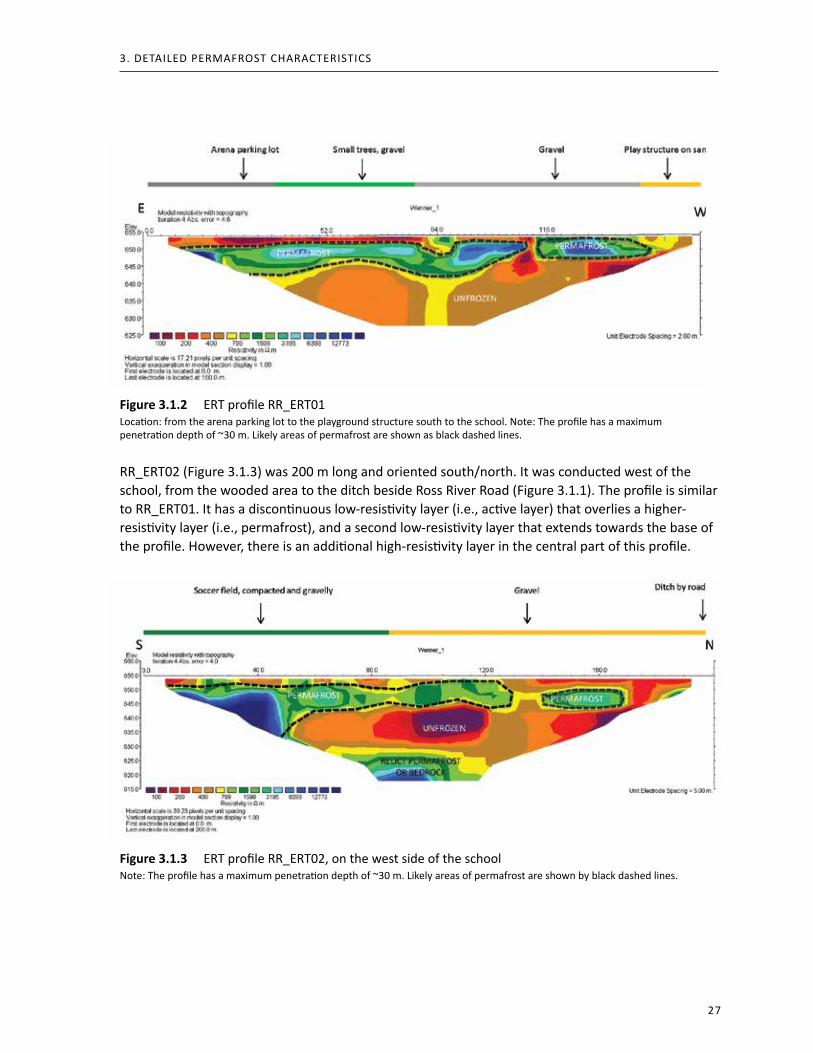
Figure 3.1.2 ERT profile RR_ERT01Location: from the arena parking lot to the playground structure south to the school. Note: The profile has a maximum penetration depth of ~30 m. Likely areas of permafrost are shown as black dashed lines.
RR_ERT02 (Figure 3.1.3) was 200 m long and oriented south/north. It was conducted west of the school, from the wooded area to the ditch beside Ross River Road (Figure 3.1.1). The profile is similar to RR_ERT01. It has a discontinuous low-resistivity layer (i.e., active layer) that overlies a higher- resistivity layer (i.e., permafrost), and a second low-resistivity layer that extends towards the base of the profile. However, there is an additional high-resistivity layer in the central part of this profile.
Figure 3.1.3 ERT profile RR_ERT02, on the west side of the schoolNote: The profile has a maximum penetration depth of ~30 m. Likely areas of permafrost are shown by black dashed lines.
3. DETAILED PERMAFROST CHARACTERISTICS
27

Permafrost is believed to reach depths of up to 20 m at the southern end of the transect, decreasing to less than 10 m at about 80 m along the profile (near the transition to the surface gravel), and possibly disappearing or being overlain by a supra-permafrost talik within 30 m of the road. The high resistivity at depth at the southern end of this profile may represent high ice content or a stratigraphic change. The high resistivity below 30 m in the centre of the profile may indicate deep permafrost that is gradually thawing or a bedrock contact beneath the glaciolacustrine sediments.
Two GPR surveys were performed in the central Ross River area. The first, RR_GPR01 (Figure 3.1.4), was 185 m long and ran parallel to ERT profile RR_ERT02. It was run from north to south. The signal penetrated to a depth of ~4 m. An irregular layer, believed to be the permafrost table, was observed at a depth of ~1.7 m at the beginning of the profile; it got deeper towards the forest, reached a maxi-mum depth of ~3 m, and rose again to a depth of ~2 m under the forest cover.
Figure 3.1.4 GPR profile (RR_GPR01) from the field next to the schoolNote: this illustrates a strong horizontal reflection at ~170 cm that likely corresponds with the top of the permafrost table.
The second GPR survey, RR_GPR02 (Figure 3.1.5), was run south-north, parallel to GPR survey RR_GPR01. It depicts the stratigraphic reflection at a depth of ~160 cm, which likely represents the contact between the active layer and permafrost. The hummocky appearance of the layers may correspond to the sand and gravel fill used in the construction of the playing field. This strong reflection could correspond to the change in resistivity visible on the south side of ERT profile RR_ERT02 (Figure 3.1.3).
Figure 3.1.5 GPR profile (RR_GPR02) from the field adjacent to the schoolNote: This runs parallel to GPR survey RR_GPR01 (see Figure 3.1.4), and shows a stratigraphic reflection at 1.6 m that likely corresponds with the top of the permafrost table.
Assessment of Risk to infRAstRuctuRe: Ross RiveR, Yukon
28

The result of the GPR and ERT surveys conducted during the hazard mapping project was consistent with the geological context (see Section 2.1). It confirms that the community is located on a fluvial terrace of the Pelly River that is comprised of interbedded silt, sand and gravel. Some silt and clay laminated sediments were found; these likely represent slackwater overbank flood deposits. Coarse deposits of sand and gravel were deposited by moving water on active floodplains and bars. As presented in detail in the next section, the fluvial sediments are underlain by a thick layer of fine-grained glaciolacustrine materials. These were deposited in a large glacial lake that filled the Tintina Trench at the end of the McConnell glaciation.
Based on the surveys described above, the undisturbed ground appears to be stable and the perma-frost table is located in ice-poor material. However, any future disturbances to the thermal regime of the ground surface (e.g., vegetation clearing, increase in snow accumulation, and/or increase in mean annual air temperature) could lead to further permafrost degradation and thaw settlement.
3.2 Synopsis of Tetra Tech EBA borehole logsNew development in central Ross River beginning in the late 1990s required several boreholes to be drilled. This work was completed by the private company Tetra Tech EBA between 1998 and the present. Figure 3.2.1 shows the locations of the 13 boreholes that were considered in this study; 9 of them were fitted with thermistor wires to monitor ground temperatures. Table 3.2.1 summarizes soil and permafrost properties observed in these boreholes. Borehole logs for the 9 boreholes with thermistor wires are presented in the Annex (Tetra Tech EBA, unpublished data).
Figure 3.2.1 Location of boreholes in the study areaSource: modified from Tetra Tech EBA (unpublished data)
Ten boreholes were drilled within or very near the school, and 6 were equipped with thermistor wires. An additional borehole, W14101031, was located in the schoolyard about 15 m west of the building; it was also equipped with a thermistor wire. It was the deepest borehole drilled in the area, with a final depth of 27.7 m.
The nature of the soil described in the borehole logs is consistent with the area’s geological history. Fill or topsoil extends from the ground surface down to a depth between 0.5 to 1.5 m, below which is alluvial material down to 4 to 6 m. Below that is fine glaciolacustrine material consisting of silt and clay that was deposited in the large glacial lake that filled the Tintina Trench at the end of the McConnell glaciation.
3. DETAILED PERMAFROST CHARACTERISTICS
29

Table 3.2.1 Summary of Tetra Tech EBA borehole logs for the school area
Testhole andborehole
number (date)
Fill topsoiland gravel
Surficial silt Alluvial sandand gravel
Glacio- lacustrine silt
Top ofpermafrost
Percent excess icecontent
13117-01(1998)
0.0–0.3 m 0.3–0.8 m 0.8–4.0 m 4.0–8.0 m 5.5 m 15–25 %
13117-02(1998)
0.0–0.3 m 0.3–1.3 m 1.3–5.0 m 5.0–7.6 m 5.2 m 10–20%
13117-03(1998)
0.0–0.3 m 0.3–0.7 m 0.7–4.2 m 4.2–7.6 m 5.9 m 10–15 %50% from 7.2 m
13117-04(1998)
0.0–0.3 m 0.3–1.2 m 1.2–4.9 m 4.9–7.6 m 6.5 m 20%
13117-05(1998)
0.0 – 0.3 m
0.3–1.3 m 1.3–5.0 m Notpresent
Notpresent
No permafrost
13117.2-BH01(1999)
0–1.5 m Notpresent
1.5–6.5 m 6.5–13.5 m 6.1 m Not described
13117.2-BH02(1999)
0–1.5 m Notpresent
1.5–5.9 m 5.9–13.5 m 7.4 m < 5 %
13117.2-BH03(1999)
0–1.5 m Notpresent
1.5–3.9 m 3.9–13.5 m 4.1 m 5–20 %
1200096-BH04 (2004)
0–3.0 m Notpresent
3.0–6.1 m 6.1–10.2 m 5.5 m 15–20 %
1200096-BH05 (2004)
0–0.6 m Notpresent
0.6–6.1 m 6.1–10.0 m 6.1 m 20–25 %
1200096-BH06 (2004)
0.0–0.5 m Notpresent
0.5–5.8 m 5.8–11.3 m 5.7 m Not described
W14101031- BH01 (2007)
0.0–4.0 m Notpresent
4.0–5.8 m 5.8–27.7 m 7.0 m(base @ 24.5 m)
Not described;lenses up to 20 cm thick
1200069-BH01 (2003)
Notpresent
0.0–1.0 m 1.0–7.0 m 7.0–12.1 m 7.8 m 5–30 %
13278.1-BH1(1998)
0.0–0.4 m Notpresent
0.4–2.3 m 2.3–7.3 m 4.5 m 5–10 %
The top of the permafrost layer at the time of the drilling was generally between 1 and 1.5 m below the contact between alluvial and glaciolacustrine material. Permafrost was observed only in the fine glaciolacustrine sediment. Thick ice lenses were observed in the area, and ground ice appears to be widespread along the profile within the glaciolacustrine material, with excess ice content that varies from less than 5% to as much as 50%. The borehole observations indicate that the thaw of the glaciolacustrine material is responsible for the subsidence observed in the area.
Assessment of Risk to infRAstRuctuRe: Ross RiveR, Yukon
30

Borehole W14101031, which is almost 30 m deep, provides the most useful information. It was drilled in the schoolyard in 2007 and encountered 4 m of sand overlying 2 m of gravel and 21 m of glaciolacustrine material, including clay, silt and sand. This suggests that the thickness of this deposit may exceed 20 m for the study area (EBA Engineering Consultants, unpublished data). At the time of drilling, the thawed layer was approximately 7 m thick, and the base of the permafrost was reported at 24.5 m depth, which means that the permafrost was more than 17 m thick. Excess ground ice is reported down to 21 m. Another source has reported a depth to the base of permafrost of 15–18 m (Stanley Associates Ltd. 1986).
These observations show that there is high potential for thaw subsidence throughout the area, and that the thaw of the glaciolacustrine sediments has caused thaw settlement, which has resulted in damage to the school.
Boreholes were drilled in the area of the pool and community centre. One of them (13278.1-BH1) was drilled directly below the location where the pool has since been built. The stratigraphic sequence consists of topsoil followed by alluvial gravelly material and then glaciolacustrine silt. In contrast, at borehole 1200069-BH01 silt occurs deeper than anywhere else (7 m), with the permafrost table 0.8 m below this contact. A possible explanation for the depth of the permafrost table is that the borehole was drilled at the former location of the curling rink. It is likely that the building was heated and that this heat — and possibly also the seasonal thawing of the curling ice — had an impact on permafrost. The impact of previous buildings on permafrost in the area is discussed further in subsection 3.4, where ERT results are presented.
Several key points arise from a review of the EBA logs:• thaw-sensitive material (potentially ice-rich silt) is located between 4 and 7 m deep. The
thickness of this silty layer is not known from the logs, but frost has been observed as deep as 24.5 m.
• thaw settlement observed in the area can likely be attributed to the thaw of this silty material.
• buildings that have now been dismantled may have had a negative impact on permafrost.
3.3 Permafrost temperatureNine of the boreholes drilled by EBA had thermistor wires to monitor ground temperature. The boreholes were located under the new school, in the schoolyard, below the pool and in the yard next to the community centre. Their locations are shown in Figure 3.2.1.
The thermistor wire located in the yard close to the new school (W14101031- BH01) was monitored periodically by an operator using a multimeter. The six wires located in boreholes below the school were connected to loggers, which allowed continuous monitoring. In addition, ten Hobo pendant loggers were set up on the floor of the crawlspace to measure how heating was affecting the ground temperature and the thermal balance of the permafrost. Unfortunately, the closure of the school and subsequent construction activities in the crawlspace presented unforeseen challenges. Four loggers were lost and the remaining six were removed earlier than planned. The limited data that were retrieved are presented later in this section.
Prior to August 2015, the EBA thermistor wires located under the pool and beside community centre were monitored periodically using a multimeter. In August 2015, these wires were connected to
3. DETAILED PERMAFROST CHARACTERISTICS
31

Campbell Scientific CR1000 programmable data loggers to improve monitoring of permafrost temperature in the study area. These new loggers process and store data on an hourly basis with an accuracy of +/– 0.05°C or better, a significant improvement over the previous method.
A thermal assessment was conducted in the arena using four U12 HOBO stainless temperature data loggers that were buried 15 cm below the surface of the arena in August 2014. The loggers collected data that allowed researchers to better understand the effects of arena maintenance on ground temperature below the rink.
SchoolyardThe ground temperature measured at borehole W14101031-BH01, located in the schoolyard west of the school (see Figure 3.2.1), provides the most information about permafrost conditions in the study area. As shown in Figure 3.3.1 and Table 3.3.1, ground temperatures were measured from July 2008 to June 2013. Ground temperatures are presented overlaying the stratigraphy described in the borehole log.
The ground temperature measurements provide two crucial pieces of information. First, the measurements show that the ground is frozen (T<0°C) down to the bottom of the borehole at 27.7 m. This suggests that permafrost is thicker than 20 m and that its base could be as deep as 30 m. Second, permafrost temperature is warm: close to 0°C. This means that only the ice present in the fine glaciolacustrine sediment is preventing permafrost thaw. At this temperature, liquid water content is likely significant and permafrost is very sensitive to degradation.
Figure 3.3.1 Ground temperature measurements (°C) from the schoolyard boreholeSource: Tetra Tech EBA. Note: Measurements for area overlaying the stratigraphy described in borehole log W14101031-BH01
Assessment of Risk to infRAstRuctuRe: Ross RiveR, Yukon
32

Table 3.3.1 Ground temperature measurements (°C) from the schoolyard borehole
Depth (m) 23-Jul-08 20-Nov-08 18-Feb-09 19-Apr-09 10-Jul-09 28-Sep-09 7-Apr-10 22-Jul-11 20-Jun-13
0.0 13.4 –4.2 -9.7 –4.7 16.5 6.5 –6.5 16.2 12.0
1.5 13.4 –3.8 -9.6 –4.8 16.3 6.6 –6.5 16.3 12.1
3.5 4.0 1.5 –0.9 –3.1 1.2 5.4 –3.7 4.0 –0.7
5.5 –0.1 1.5 0.0 –0.1 –0.1 2.1 –0.3 –0.2 –0.1
7.5 0.0 0.6 0.1 0.0 0.0 0.4 0.0 0.0 0.0
9.5 –0.1 –0.1 –0.1 –0.1 –0.1 –0.1 –0.1 –0.1 –0.1
11.5 –0.2 –0.2 –0.2 –0.1 –0.1 –0.2 –0.1 –0.2 –0.2
13.5 –0.2 –0.2 –0.2 –0.2 –0.2 –0.2 –0.2 –0.2 –0.2
15.5 –0.2 –0.2 –0.2 –0.2 –0.2 –0.2 –0.2 –0.2 –0.2
17.5 –0.2 –0.2 –0.2 –0.2 –0.2 –0.2 –0.2 –0.2 –0.2
19.5 –0.2 –0.2 –0.2 –0.2 –0.1 –0.2 –0.2 –0.2 –0.2
21.5 –0.1 –0.2 –0.2 –0.1 –0.1 –0.2 –0.1 –0.2 –0.2
23.5 –0.1 –0.1 –0.1 –0.1 –0.1 –0.1 –0.1 –0.2 –0.2
25.5 –0.1 –0.1 –0.1 0.0 0.0 –0.1 0.0 –0.1 –0.1
27.5 0.0 0.0 0.0 0.1 0.1 0.0 0.1 0.0 0.0
Source: Tetra Tech EBA. Note: Measurements for area overlaying the stratigraphy described in borehole log W14101031-BH01
The active layer appears to have thickened over time, with the top of permafrost deepening from 7.0 m to 9.5 m. These data suggest that permafrost in the study area might be thicker than previously reported. This will affect the magnitude and duration of any subsidence.
The schoolTwo groups of boreholes underneath the school were equipped with thermistor wires. One group of three boreholes was drilled in 1998 directly below the school foundation (13117.2-BH01 to BH03). In 2004, three additional boreholes were drilled around the periphery of the building, and thermosiphons were added (1200096-BH04 to BH06).
The first group of borehole temperatures (13117.2-BH01 to BH03) is presented in Figures 3.3.2a and b and 3.3.3a. The records show that the deepest temperatures, at 13.5 m, have increased between 0.5 and 0.6°C. These temperatures are now close to –0.1°C. It is revealing that while the early permafrost temperature curves showed fluctuations, more recent curves are almost flat and have no fluctuation. This indicates that permafrost is close to thawing. Typically, the freezing and thawing of the liquid water content prevent seasonal temperature fluctuation, but this is not occur-ring in these boreholes. Consequently, permafrost as deep as 13.5 m is close to thawing.
The second group of borehole temperatures (1200096-BH04 to BH06) is presented in Figures 3.3.3b and 3.3.4a and b. These are more problematic to interpret: although the data recorded from 2004–08 seems rational, the data from 2009–14 seems questionable. The data from 2004–08 shows very warm permafrost temperatures — close to 0°C — in the three boreholes.
3. DETAILED PERMAFROST CHARACTERISTICS
33

Figure 3.3.2a and b Ground temperatures recorded by Tetra Tech EBA below the schoolSource: Boreholes 13117.2-BH01 and 13117.2-BH02
In 2009, after a period of inactivity, the thermistor wires were connected to new data loggers. Between 2009 and 2014, the data curves show a cooling trend that cannot be confirmed, consider-ing inconsistencies in the recorded data. To better understand this, the temperature record from a single day (August 13, 2013) was plotted in a graph showing temperature vs. depth (Figure 3.3.5). The figure shows erratic temperatures as a function of depth, with a temperature variation of more than 17 degrees for a single depth for different boreholes. Some of the temperatures observed deep in the profile are three to four times colder than the MAAT. These data seem aberrant and should be verified.
Assessment of Risk to infRAstRuctuRe: Ross RiveR, Yukon
34

Figure 3.3.3a and b Ground temperatures recorded by Tetra Tech EBA below the schoolSource Boreholes 13117.2-BH03 and 1200096-BH04
We hypothesize two possible explanations for the inconsistencies: 1) the depths may not be labelled properly in the logger program, since Figures 3.3.3b and 3.3.4a and b show cooling trends at all sensors, but at random depths; or 2) because all three boreholes show unrealistically cold temperature, there may be other issues with the setup. The resistors in the thermistors may be faulty, or the conversion of resistance to temperature may have errors.
3. DETAILED PERMAFROST CHARACTERISTICS
35

Figure 3.3.4a and b Ground temperatures recorded by Tetra Tech EBA below the schoolSource: Boreholes 1200096-BH05 and 1200096-BH06
Assessment of Risk to infRAstRuctuRe: Ross RiveR, Yukon
36

Figure 3.3.5 Ground temperature curves for wires EBA 4, 5 and 6 in 1200096-BH04, -BH05, and -BH06Location: near the school, August 13, 2013
School crawlspaceAs described above, pendant loggers were placed on the floor of the school crawlspace. Figure 3.3.6 shows the location of the loggers and plots of the recorded temperatures. Logger 1 recorded the coldest temperatures, varying between 13.3 and 20.7°C during the period of the survey (about one year); other loggers show temperatures that vary between 16.0 and 20.7°C. The overall average of the air temperature at the floor surface during the period of the survey is 18.4°C. Temperatures this high are likely to disturb the underlying ground thermal regime.
Figure 3.3.6 Temperature recorded at ground surface level in the crawlspace of the school
3. DETAILED PERMAFROST CHARACTERISTICS
37
logger retrievedlogger not retrieved
2014 2015
2014 20158 9 10 11 12 1 2 3 4 5 6 7 8 9
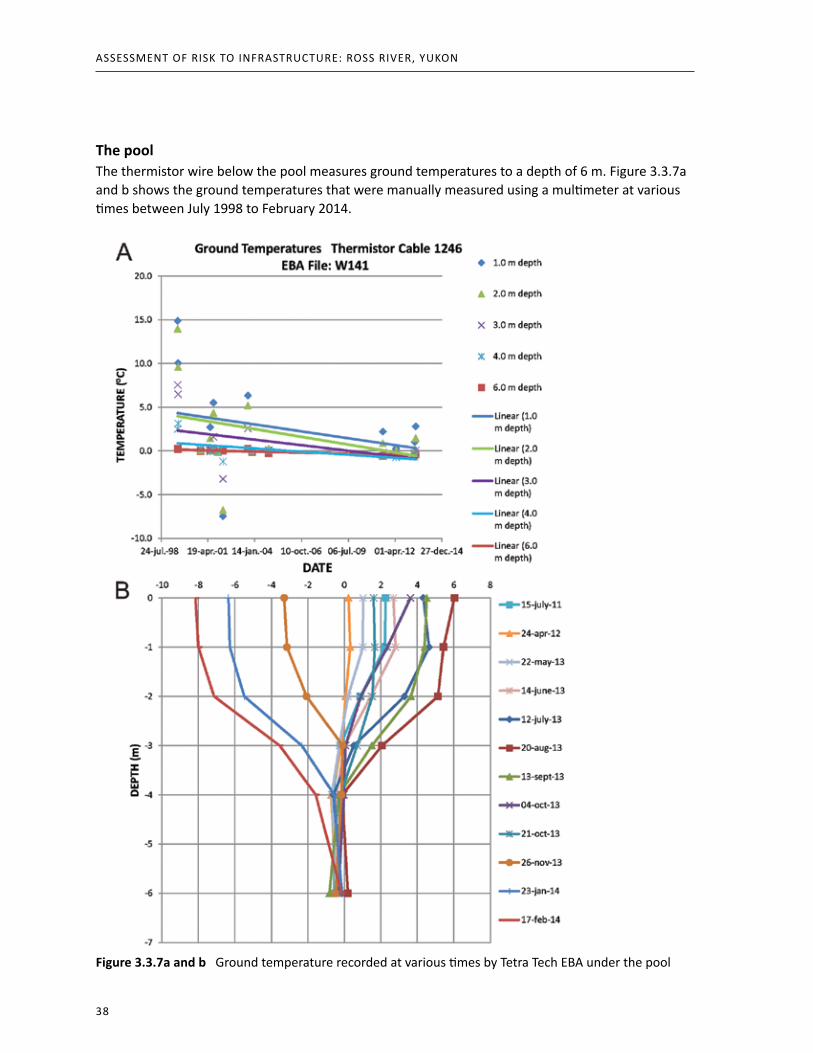
The poolThe thermistor wire below the pool measures ground temperatures to a depth of 6 m. Figure 3.3.7a and b shows the ground temperatures that were manually measured using a multimeter at various times between July 1998 to February 2014.
Figure 3.3.7a and b Ground temperature recorded at various times by Tetra Tech EBA under the pool
Assessment of Risk to infRAstRuctuRe: Ross RiveR, Yukon
38

Figure 3.3.7a shows a trend of cooling from 1998 to 2014; Figure 3.3.7b shows that the deepest tem-perature (at 6 m) has warmed steadily over time.
More recent data, acquired by means of a newly installed CR1000 logger from July to October 2015, are shown in Figure 3.3.8a and b. This shows that the ground is unfrozen down to 4 m deep. A bad connection with the logger prevented the temperature at 6 m from being recorded, but the curves suggest that the ground was likely unfrozen at 6 m in October.
Figure 3.3.8a and b Ground temperature below the pool, July–October 2015
3. DETAILED PERMAFROST CHARACTERISTICS
39

The community centreThe thermistor wire located in the yard south of the community centre measures ground temperatures down to the depth of 12 m. Figure 3.3.9 shows the ground temperatures that were manually measured using a multimeter at various times between May 2013 to February 2014. Both Figure 3.3.9a and Figure 3.3.9b show a warming trend. The record shows that the permafrost table has moved down to a depth of 10.5 m.
Figure 3.3.9a and b Ground temperature recorded at various times by Tetra Tech EBALocation: the yard south of the Community Centre
Assessment of Risk to infRAstRuctuRe: Ross RiveR, Yukon
40

At the deepest sensor (12 m) the temperature is –0.3°C, but has steadily warmed over time. More recent data, acquired by means of a newly installed CR1000 logger from July to October 2015, are shown in Figure 3.3.10a and b. The figure shows that the ground is frozen down to 12 m depth. Water condensation on the logger made the temperature reading unstable.
Figure 3.3.10a and b Ground temperature recorded July–October 2015Location: the yard south of the Community Centre. Note: In Figure 2.2.10b, data was not collected for all of October, so no monthly mean is provided.
The arenaThe location and temperatures recorded by four U12 loggers buried 15 cm in the gravel below the arena are shown in Figure 3.3.11. The four records show the same temperature trend, demonstrating that the icing and thaw of the ice in the arena is the same everywhere in the ice rink
3. DETAILED PERMAFROST CHARACTERISTICS
41

area. The mean annual temperature 15 cm below the ground surface is 1.2° C (from August 2014 to October 2015). These temperatures are well above 0°C and confirm that the arena ice prevents permafrost cooling. Permafrost is currently degrading below the arena.
Figure 3.3.11 Temperatures recorded in the ice rink area of the arena, 15 cm below the ground surfaceNote: Locations of the loggers are shown in the upper part of the figure
3.4 Electrical Resistivity TomographyElectrical resistivity tomography (ERT) is a geophysical method that measures the resistivity distribution of the subsurface. Resistivity is the mathematical inverse of conductivity: it measures how strongly a material opposes the flow of electric current. Mineral materials (with the exception of specific substances such as metallic ores) are mostly non-conductive. Therefore, the resistivity of a soil or rock profile is governed primarily by the amount and resistivity of pore water present in the profile, and by the arrangement of the pores. This makes ERT very well suited to permafrost and hydrology applications. Permafrost distribution can be inferred based on changes in resistivity
Assessment of Risk to infRAstRuctuRe: Ross RiveR, Yukon
42

between frozen and unfrozen ground, because most water content in frozen ground is in the solid phase and typically has a higher resistivity than unfrozen water content.
An ERT system consists of an automated multi-electrode resistivity meter and a set of wires connect-ed to an array of electrodes. An IRIS electrical resistivity system was used for the surveys presented in this report. It has a one-channel imaging unit (the resistivity meter) and two electrode cables, each with 24 take-outs at five-metre intervals. To conduct a survey, 48 electrodes are driven into the ground along a survey line and connected to the electrode cables. A direct current electrical pulse is sent from the resistivity meter along the survey line. The resulting data is processed to produce a cross-sectional (2D) plot of the ground’s resistivity (Q.m) versus depth (m) for the length of the survey. At the NCE laboratory, results of the surveys are post-treated and analyzed using inversion software (Res2DInv64 and Res3DInv 32).
Eleven ERT surveys were performed for the study. The surveys are presented in Figures 3.4.1 to 3.4.11. Each figure includes a plan of the location where the survey was conducted, the ERT profile, and a contextual diagram of the profile results relative to an aerial view of the site. Four areas were targeted, some of which overlapped. The community centre, pool and recreation centre/arena were investigated in surveys S1, S2, S6, S7, S8, S9, S10 and S11; the school was investigated in surveys S3, S4 and S5.
In the ERT profiles, warm colors (yellows, oranges, reds, purples), indicate areas of lower resistivity. When permafrost is present, low resistivity indicates the presence of more liquid water content, which means that the permafrost is warm or has thawed. Cool colors (blues, greens) indicate areas of higher resistivity. High resistivity indicates ground with greater ice content and/or gravels and sediments with larger grain size.
3.4.1 The community centre/daycare, pool and recreation centre/arenaThe community centre, pool and recreation centre/arena are located on the site of the old curling rink and the old school. When interpreting the ERT results, it was important to consider these former uses. Both these buildings had an impact on permafrost, which resulted in a destabilization of its thermal regime. Even now, several years after the buildings were removed, the disturbance persists below the ground surface.
Survey S1 (Figure 3.4.1) was oriented west/east below the community centre. Low resistivity areas were detected between 60 to 75 m along the survey line and near the 100-m point. Surprisingly, these areas do not coincide with the location of the centre, but do align approximately with the footprints of the former curling rink and the former school. Any offset between the low-resistivity areas and the building footprints is likely due to inaccuracies in the GPS and blueprints. The location of the ERT survey has a GPS accuracy of +/–3 m; the footprints of the old buildings were approximated based on the blueprint of the pool.
Survey S2 (Figure 3.4.2) was made south of the community centre, and was oriented west/east. Low resistivity areas were detected between 20 to 40 m and between 80 m and the end of the survey line. The first area may be attributed to the reported leak of the pool. The second area coincides approximately with the location of the former school.
There are limited data, but based on evidence from other buildings in similar conditions elsewhere in the north, it is likely that permafrost warming was induced by the former buildings. This warming has resulted in an increase of liquid water content in the ice-rich glaciolacustrine silt.
3. DETAILED PERMAFROST CHARACTERISTICS
43

Figure 3.4.1 ERT survey S1, made under the community centre/daycare; oriented west/east
Figure 3.4.2 ERT survey S2, made south of the community centre, oriented west/east
Assessment of Risk to infRAstRuctuRe: Ross RiveR, Yukon
44

Although this ground is frozen, the presence of liquid water has significantly decreased electrical resistivity at the location of the former buildings. At this site, frozen ice-rich silt may be less resistive than unfrozen alluvial gravel (which is unusual). These results raise the possibility that damage to the daycare is the result of ongoing thermal impacts from the former curling rink.
Survey S6 (Figure 3.4.3) was made east of the pool and community centre and was oriented north/south. Low resistivity areas were detected between 32 to 48 m (deeper in the profile) and between 66 to 74 m (closer to the surface) along the survey line. In this profile, the borehole logs indicate that the top of permafrost is at about 9–10 m depth and the contact between gravel and silt is less deep (about 7 m). This makes it difficult to distinguish the influence of the soil texture from that of the thermal state. The data suggest, however, that the first area of low resistivity coincides with the area where the pool has leaked, while the second area can be attributed to either the former curling rink and/or the present-day community centre. Some high resistivity sections were detected at the south and north ends of the profile. These coincided with open areas that are free of buildings and vegetation. The soil may still have been seasonally frozen at the time of the survey.
Figure 3.4.3 ERT survey S6, made east of the pool and community centre, oriented south/north
Survey S8 (Figure 3.4.4) was parallel to S6, but about 25 m east of it. The survey shows similar results to S6, but with a larger scope. Low-resistivity areas were recorded between about 24 to 45 m and about 70 to 95 m (deeper in the profile) along the survey line. The first low-resistivity area is located in front of the arena. This could be attributable to the presence of the building or/and disturbance by the meltwater from the skating rink each spring. The second low-resistivity area is consistent with the one observed in S6. It is bulb-shaped and starts at about 9 m depth. Although it is 40 m away
3. DETAILED PERMAFROST CHARACTERISTICS
45
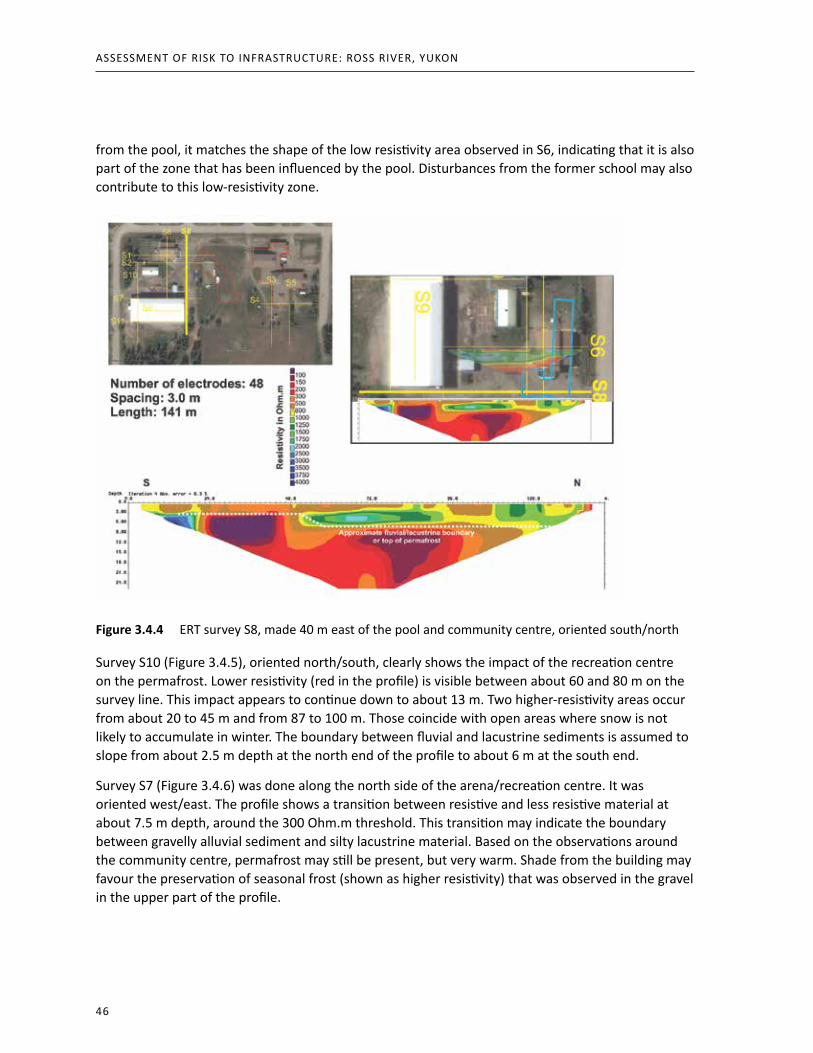
from the pool, it matches the shape of the low resistivity area observed in S6, indicating that it is also part of the zone that has been influenced by the pool. Disturbances from the former school may also contribute to this low-resistivity zone.
Figure 3.4.4 ERT survey S8, made 40 m east of the pool and community centre, oriented south/north
Survey S10 (Figure 3.4.5), oriented north/south, clearly shows the impact of the recreation centre on the permafrost. Lower resistivity (red in the profile) is visible between about 60 and 80 m on the survey line. This impact appears to continue down to about 13 m. Two higher-resistivity areas occur from about 20 to 45 m and from 87 to 100 m. Those coincide with open areas where snow is not likely to accumulate in winter. The boundary between fluvial and lacustrine sediments is assumed to slope from about 2.5 m depth at the north end of the profile to about 6 m at the south end.
Survey S7 (Figure 3.4.6) was done along the north side of the arena/recreation centre. It was oriented west/east. The profile shows a transition between resistive and less resistive material at about 7.5 m depth, around the 300 Ohm.m threshold. This transition may indicate the boundary between gravelly alluvial sediment and silty lacustrine material. Based on the observations around the community centre, permafrost may still be present, but very warm. Shade from the building may favour the preservation of seasonal frost (shown as higher resistivity) that was observed in the gravel in the upper part of the profile.
Assessment of Risk to infRAstRuctuRe: Ross RiveR, Yukon
46

Figure 3.4.5 ERT survey S10, made west of the pool and arena, oriented north/south
Figure 3.4.6 ERT survey S7, made along the north side of the recreation centre/arena, oriented west/east
3. DETAILED PERMAFROST CHARACTERISTICS
47

Survey S11 (Figure 3.4.7) was done along the south side of the arena/recreation centre. It was oriented west/east. The profile is similar to S7, with a threshold between resistive and less resistive material. In S11, the threshold is shallower than on the north side (in S7); it is about 5 m depth and around the 70 Ohm.m threshold. The lower-resistivity threshold may be due to the south-facing aspect creating warmer ground temperatures and a deeper permafrost table. The higher gravel/silt boundary is consistent with the observations in survey S10. The low-resistivity area observed between about 20 to 50 m may be attributable to the drainage of the meltwater from the rink. External factors such as previous buildings or localized snow drifting may also be relevant.
Figure 3.4.7 ERT survey S11, made along the south side of the recreation centre/arena, oriented west/east
Survey S9 (Figure 3.4.8) was made in the middle of the arena rink, and oriented west/east. This was a short survey, with electrodes placed closer together than usual. The resulting profile is limited in depth to about 10 m, but with higher resolution. Like several other surveys, this survey indicates a contact between gravel and silt at about 7.5 m. The resistivity is similar to that detected on the north side of the arena.
Assessment of Risk to infRAstRuctuRe: Ross RiveR, Yukon
48
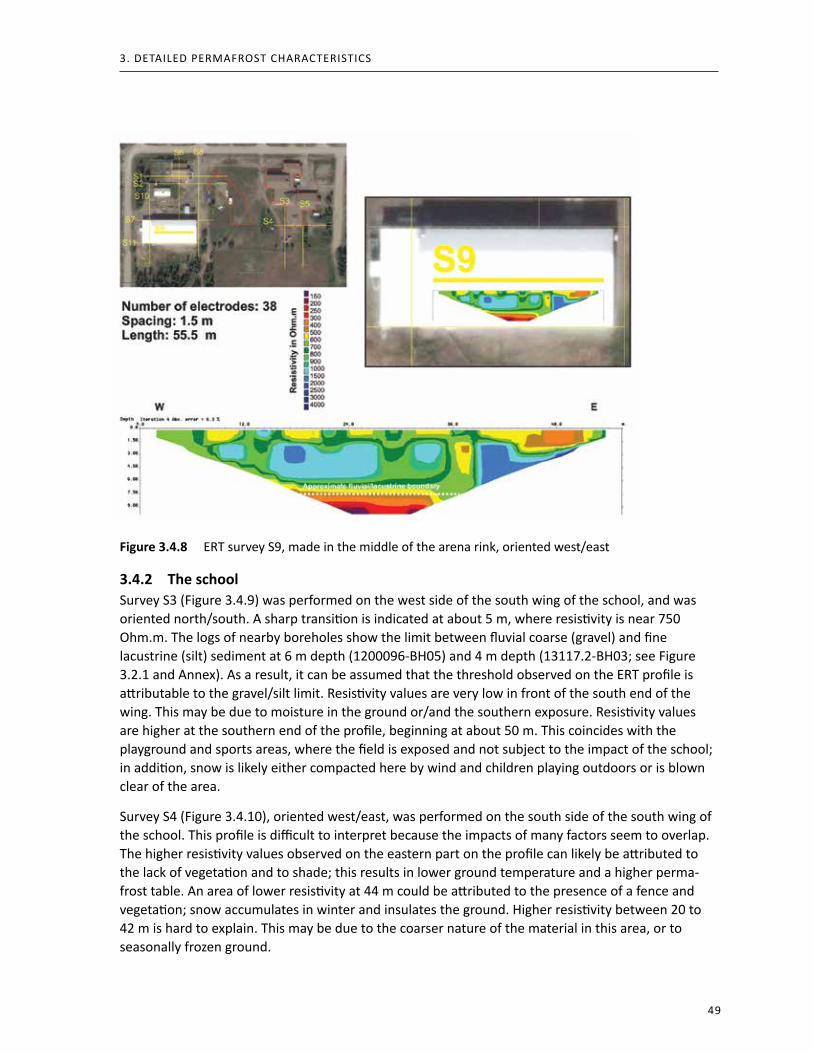
Figure 3.4.8 ERT survey S9, made in the middle of the arena rink, oriented west/east
3.4.2 The schoolSurvey S3 (Figure 3.4.9) was performed on the west side of the south wing of the school, and was oriented north/south. A sharp transition is indicated at about 5 m, where resistivity is near 750 Ohm.m. The logs of nearby boreholes show the limit between fluvial coarse (gravel) and fine lacustrine (silt) sediment at 6 m depth (1200096-BH05) and 4 m depth (13117.2-BH03; see Figure 3.2.1 and Annex). As a result, it can be assumed that the threshold observed on the ERT profile is attributable to the gravel/silt limit. Resistivity values are very low in front of the south end of the wing. This may be due to moisture in the ground or/and the southern exposure. Resistivity values are higher at the southern end of the profile, beginning at about 50 m. This coincides with the playground and sports areas, where the field is exposed and not subject to the impact of the school; in addition, snow is likely either compacted here by wind and children playing outdoors or is blown clear of the area.
Survey S4 (Figure 3.4.10), oriented west/east, was performed on the south side of the south wing of the school. This profile is difficult to interpret because the impacts of many factors seem to overlap. The higher resistivity values observed on the eastern part on the profile can likely be attributed to the lack of vegetation and to shade; this results in lower ground temperature and a higher perma-frost table. An area of lower resistivity at 44 m could be attributed to the presence of a fence and vegetation; snow accumulates in winter and insulates the ground. Higher resistivity between 20 to 42 m is hard to explain. This may be due to the coarser nature of the material in this area, or to seasonally frozen ground.
3. DETAILED PERMAFROST CHARACTERISTICS
49

Figure 3.4.9 ERT survey S3, made on the west side of the school’s south wing, oriented north/south
Figure 3.4.10 ERT survey S4, made on the south side of the south wing of the school, oriented west/east
Assessment of Risk to infRAstRuctuRe: Ross RiveR, Yukon
50

Survey S5 (Figure 3.4.11), oriented north/south, was made on the east side of the south wing of the school. The low-resistivity area observed between about 0 and 20 m can be attributed to the thermal impact of the building. A high-resistivity area at about 30 m is located in an open area between the school and the fence. Lower resistivity characterizes the area between 32 and 52 m, where there is a fence and shrubs. Low resistivity is observed at about 60 m, where there is a south-facing slope from the schoolyard toward the baseball field, and where the exposure and the snow accumulation, packed by the wind during winter, may contribute to ground warming. High resistivity was observed in the open, where the baseball field is located.
Figure 3.4.11 ERT survey S5, made on the east side of the south wing of the school, oriented north/south
3. DETAILED PERMAFROST CHARACTERISTICS
51

3.2.3 Additional survey – the grader stationAn additional ERT survey, oriented north/south, was performed in a garage of the HPW grader station, on the road entering the community (Figure 3.4.12). The building has been affected by permafrost thaw, and the objective of the survey was to see whether an ERT assessment was feasible across a building with a concrete slab foundation. Although it was difficult to get electricity to pass through the concrete slab, the data that was obtained suggest a permafrost table and/or a gravel/silt limit located at 4 m depth in the vacant lot and a permafrost table at 7 m depth below the garage.
Figure 3.4.12 ERT survey made through the HPW grader station, oriented north/south
Assessment of Risk to infRAstRuctuRe: Ross RiveR, Yukon
52

4. Risk assessment of the structures affectedThis section mirrors the subsections of part 5 of the Canadian Standards Association standard, “CAN/CSA-S501-14: Moderating the effects of permafrost degradation on existing building foundations,” referred to here as “the Standard” (CSA 2014b). This report is an assessment of the steps of the assessment with the requirements of the standard.
4.1 Indicators of potential permafrost related foundation distressThe assessment identifies numerous indicators of potential permafrost degradation beneath the inspected structures (see Section 2.7). Five indicators of potential permafrost-related foundation distress are described in the Standard:
a) Interior cosmetic damage:Before renovation work in summer 2015, damage was notable in the school. Drywall was heavily cracked (Photo 4.1.1), and there were cracks in the floor (Photo 4.1.2) and gaps in joints between walls and between walls and the floor (Photo 4.1.3). Less damage was observed in the community centre, where only small cracks were observed between walls and ceiling (Photo 4.1.4). Minor cracking of the walls was also observed in the recreation centre. In the pool, a gap was observed between the wall and the floor (Photo 4.1.5).
Figure 4.1.1 Cracked drywall, school Figure 4.1.2 Cracks in the floor, school
b) Doors and/or windows sticking or not sealing:In the school, several doors and windows did not fit. In one notable example, a window in the school’s library fell from its frame. The glass was replaced by plywood (Photo 4.1.6).
53
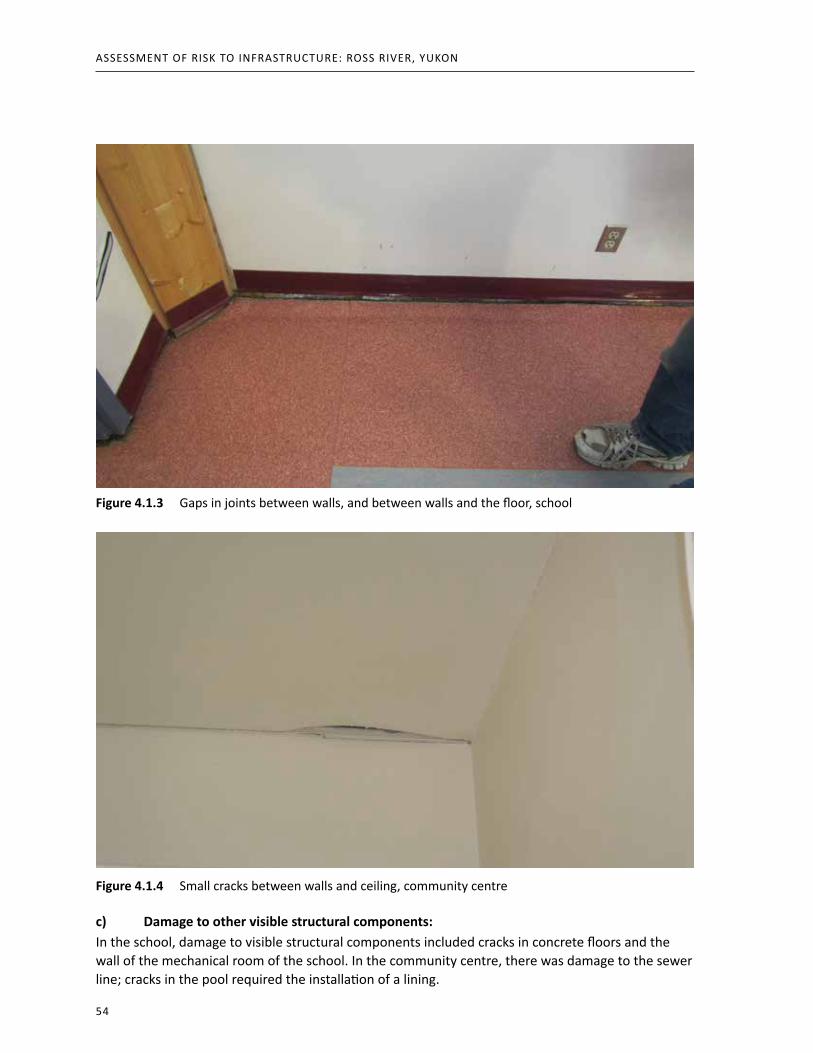
Figure 4.1.3 Gaps in joints between walls, and between walls and the floor, school
Figure 4.1.4 Small cracks between walls and ceiling, community centre
c) Damage to other visible structural components:In the school, damage to visible structural components included cracks in concrete floors and the wall of the mechanical room of the school. in the community centre, there was damage to the sewer line; cracks in the pool required the installation of a lining.
Assessment of Risk to infRAstRuctuRe: Ross RiveR, Yukon
54

Figure 4.1.5 Gap between the wall and the floor, pool
Figure 4.1.6 Window glass replaced by plywood, school
4. RISK ASSESSMENT OF THE STRUCTURES AFFECTED
55

d) Cracks and deformations in the foundation of the structure:Multiple cracks and deformations were observed in the foundation of the school. Six of the concrete pilings where the steel frame rests were cracked. in some instances, the steel frame had been wedged. While the jacking and releveling of the steel frame might be responsible for some of the damage to concrete pilings, ground movement has likely contributed as well. The repair of steel pilings in the community centre is evidence that there has been deformation of the foundation there. At the pool, the concrete floor (located at ground level) appears to be cracked (Photo 4.1.7). The steel piles of the recreation centre have been repaired in response to 30 cm of subsidence.
e) Ground surface settlement or heaveSettlement of the ground surface was indirectly observed through the breaks in and repairs to the building foundations. The school had to be releveled in 2005 and 2015 because of ground subsidence. The steel piles of both the community centre and recreation centre had to be repaired following damage caused by ground subsidence. Apart from these indicators, no ground surface settlement or heave was directly observed in or around the buildings being assessed.
Figure 4.1.7 Cracks in concrete floor, pool
4.2 Initial site investigationAs prescribed by the Standard, the first step in assessing existing structures for suspected permafrost-related surface displacement is the initial site investigation. The investigation should include three phases; these were performed during the course of this study.
a. collection and documentation of background information;b. inspection of the structure, foundation and site; andc. collection of site-specific subsurface data.
Assessment of Risk to infRAstRuctuRe: Ross RiveR, Yukon
56

4.2.1 Types of background information to collectThis permafrost study was preceded by an earlier hazard mapping project (NCE 2015; see Section 3.1). That project provided extensive background information regarding the community’s biophysical context, including geology, geomorphology, hydrology, climate and permafrost conditions. It is important to note that this hazard mapping project allowed us to expand the characterization of the biophysical properties of the Ross River landscape beyond what is required by the Standard. The biophysical history of the location conditions the characteristics of permafrost and the nature of the issues encountered, such as the nature of the ground ice and its extent, and the temperature of the permafrost.
This is some of the information that was considered in the initial site investigation:a. A history of structural problems was assessed, including information from PMD engineers
and on-site managers. Professional engineers at Tetra Tech EBA were also consulted.b. Documentation of the nature and magnitude of seasonal ground deformation and surface
displacement was not available. The assessment was conducted in the community on disturbed ground. In addition, the risk of damage by vandalism meant that we could not leave instruments within the central cluster of buildings.
c. A history of building maintenance and site management practices has been developed based on information provided by PMD engineers and on-site managers, and Tetra Tech EBA (see Section 2.7).
d. An assessment of drainage, ponding, snow accumulation and vegetation condition was conducted during a field visit on April 28, 2014. No noticeable features were observed in terms of drainage, ponding or vegetation. However, some snow patches remained, close to the north-facing sides of the buildings (Photo 4.2.1.1).
e. An assessment of any extreme short-term weather events was not available or feasible considering the duration of the survey. Long-term climate change effects have been considered (see Section 2.3).
4.2.1.1 Potential data sourcesThis project merges the data from the hazard mapping project with that from the current assessment, and with these data sources, to provide background and baseline data.
a) Maps: Surficial geology maps of the Ross River Region (Open File parts of NTS 105K/1 and 2 and 105F/15 and 16; 1:25 000 scale) were produced by the Yukon Geological Survey as part of the hazards mapping project. These maps were used to develop an understanding of the geomor- phological context of the study area (Section 2.2).
b) Stereo air photo pairs and c) Aerial or satellite imagery: in the Standard, these categories are separate, but it is our view that they should be merged, since stereo air photo pairs are aerial imagery. Air photos were used for this survey and the hazards mapping project (National Air Photo Library roll A28547).
The scale of the air photos (1:40,000) did not allow for in-depth observation of the study area. Google Earth Pro software was used to obtain and review satellite imagery. The software provides access to images from three dates: April 26, 2006; May 3, 2010; and July 31, 2014. The image from 2006 shows snow distribution in the area, and the 2010 images were used for this report’s figures
4. RISK ASSESSMENT OF THE STRUCTURES AFFECTED
57

and reporting. Google Earth Pro also aided in interpretation of the context for boreholes (Section 3.2) and ERT survey locations (Section 3.4).
d) Previous site-specific geotechnical reports: Tetra Tech EBA was very helpful in providing reports concerning the school from May 1998 (EBA File:0201-97-13117), June 2005 (EBA File: 1200096.001), September 2005 (EBA File: 1200096.002) and December 2010 (EBA File: W1401211.003). The 1998 report presents the results from the geotechnical site evaluation for the school. The June 2005 report presents the results of foundation inspections and permafrost monitoring of the school. The September 2005 report provides a geothermal evaluation of the school. The December 2012 report provides a review of ground temperature data for that year.
e) Climate information: Past, present and future climate were investigated using climate observations from Environment Canada and climate projections from SNAP (see Section 2.3). The mean annual air temperature (MAAT) and total annual precipitation for the last three years for Faro (the weather station closest to Ross River) are shown in Table 4.2.1.1.1. Past climate trends are described in Section 2.3.2. The past 30 years show a trend toward a warmer and wetter climate. Climate projections are presented in Section 2.3.3. They show an increase in MAAT of 1.4°C by 2050 and 3.0°C by 2080. Two scenarios suggest MAAT above 0°C by 2080, which means that permafrost would no longer be sustainable even if there was organic cover and if buildings and infrastructure were not present.
Figure 4.2.1.1 Remaining snow patches close to the north-facing side of the arena, April 2014
Assessment of Risk to infRAstRuctuRe: Ross RiveR, Yukon
58

Table 4.2.1.1.1 Mean annual air temperature (MAAT) and total precipitation, Faro, 2013–2015
MAAT precipitation
2013 –2.01°C 250 mm
2014 –1.53°C 355 mm
2015 –0.70°C 284 mm
f) Design information: Design information for the buildings being assessed was provided by PMD and Tetra Tech EBA (see Section 2.7). Blueprints of the school and its foundation were made available by Tetra Tech EBA. Blueprints were not obtained for the other buildings as they were not seen as necessary for this assessment.
g) Construction reports: No construction reports were available for this project.
4.2.2 Inspection of structure and siteA complete inspection to assess damage was undertaken in 2014. The inspection documented the following factors.
a) Deviations from design: Relative to design information provided by PMD and Tetra Tech EBA it was evident that there had been repairs to the concrete piles and metal frame of the school. in ad-dition, insulating foam had been added after the completion of the school, as well as a second set of thermosiphons at the periphery of the school. in the community centre, the metal pilings had been lengthened in order to relevel the building (see Section 2.7). There had also been repairs and/or renovations to the recreation centre following the fire there. These alterations do not constitute “deviation,” but rather are repairs and adaptations in response to damage observed to the buildings.
b) Cracks and deformations in the foundation of the structure: Cracks and deformations were observed in the school foundation, most notably in the concrete pilings. Observation of damage was recorded on a blueprint of the school foundation. When possible, benchmark cards (see figure 2.7.1.2, Section 2.7) were installed to monitor movement. The releveling and reconstruction work carried out in the school led to the removal of these benchmark cards. New benchmark cards can be installed if/when cracks appear again.
c) Ground-surface settlement or heave: We looked for evidence of ground surface settlement and heave, but found none within the study area.
d) Interior cosmetic damage: As described above, interior cosmetic damage was observed and noted in the buildings. The school showed extensive damage, including cracks in the drywalls and in the floor, before reconstruction work was completed in summer 2015. Less damage was observed in the community centre and the recreation centre (see Section 4.1). The cracks have been mapped in a plan of the school, and benchmark cards were installed to monitor their movement. The reconstruction that took place in summer 2015 required the removal of the benchmark card monitoring.e) Any damage to structural components: Damage was observed and noted in the concrete structures (wall and stairwell) and floor of the school and the pool.
4. RISK ASSESSMENT OF THE STRUCTURES AFFECTED
59

f) Surface drainage characteristics around the site: Drainage conditions were observed around each building during field visits. No issues such as streams, ponding, gullies or ravines were observed in the vicinity of the buildings. Intercepting ditches that surround the area were properly drained. However, the uppermost layer of ground (mostly fluvial gravel) is permeable and therefore may prevent water accumulating at the ground surface. Surface water, either runoff or meltwater, is more likely to be absorbed by the coarse surficial material and to pool or be drained at the contact between frozen and unfrozen ground. Consequently, the potential impact of runoff and melt- water may be difficult to assess, considering the lack of surficial indicators such as ponds, puddles or streams.
g) Observed changes in adjacent development, vegetation or similar conditions around the site: Vegetation near the buildings was generally limited or nonexistent. The vegetation is unlikely to trigger snow drifting and the resulting insulating impact on the permafrost below the buildings. Small patches of low vegetation (grass or/and shrubs) are present in vacant lots, and near fences. These areas are unlikely to constitute a threat to the buildings.
h) Review of maintenance and operations procedures and records of the facility, including interviews with facility operators and maintenance staff: The on-site building manager for PMD guided the research team during visits to the sites and inside the buildings. He provided information about maintenance and operational procedures. No specific issues regarding the maintenance and operations procedures were identified, but the project team noted a few points:
• The heating of the crawlspace is detrimental to permafrost equilibrium, as demonstrated by the temperature recorded by the temperature loggers (a mean annual air temperature at floor level of 18.4°C; see Section 3.3).
• The meltwater from the rink in the arena continues to disturb permafrost equilibrium, as shown by the mean annual temperature of 1.2°C recorded at 15 cm depth by the loggers.
• Overfill of the drinking water tanks can threaten permafrost equilibrium, since overflow goes in the ground next to the building. Although the quantity might be considered negligible, the frequency of the filling may have a cumulative negative impact on permafrost.
(i) Monitoring of any in-situ instrumentation present on the site: Various types of instrumentation have been installed in the process of the study. The relevelling and construction during summer 2015 resulted in the removal of some instrumentation (the benchmark cards and the temperature loggers set on the floor of the crawlspace). The loggers installed in the arena ground had to be retrieved for data downloads and battery replacement by the manufacturer. All of these instruments can easily be redeployed, if desired. The boreholes located near the community centre and below the pool have been fitted with CR1000 data loggers and will remain functional in the upcoming years.
4.2.3 Soil lithologySoil lithology was determined using two sources: the hazard mapping survey that occurred in 2013 and 2014, and 2) the geotechnical assessments led by Tetra Tech EBA between 1998 and 2015.
The hazard mapping project provides information about the study area at the community scale (Section 2.2.5 and 3.1). During this project, soil samples were collected in the general vicinity of the buildings in this assessment, but not from areas immediately adjacent to any of them.
As discussed in Section 3.2, Tetra Tech EBA has performed geotechnical drilling in the study area. Borehole logs can be reviewed in the Annex.
Assessment of Risk to infRAstRuctuRe: Ross RiveR, Yukon
60

The soil samples were tested at the laboratory to determine four factors:• moisture content;• salinity;• particle size and distribution; and• plasticity.
The hazard mapping project and geotechnical assessments indicate that the soil lithology of the study area consists of 4-7 m of coarse fluvial sediment overlying more than 20 m of fine glacio- lacustrine sediment.
4.2.3.1 Depth of permafrost and ground temperaturesThe Standard recommends that ground temperature cables be installed under buildings and in “undisturbed terrain” to monitor changes in ground temperature. As discussed in Section 3.3, this step was completed by Tetra Tech EBA. Thermistor cables are installed under the buildings and in relatively undisturbed terrain. Since the “undisturbed terrain” cables are located within the community, they cannot be considered to be in undisturbed natural terrain.
Because the permafrost temperature is close to 0°C, it is very difficult to determine the depth of zero annual amplitude. The permafrost thermal regime can therefore be defined as metastable.
The active layer thickness varies from one borehole to another, depending on surficial condition (outdoor, under a building, etc.):
• the active layer appears to have thickened over time;• the top of the permafrost is generally located at or above the contact between the fluvial
and glaciolacustrine sediment; and• the active layer may be as thick as 10 m in some locations, with the top of the permafrost
located in fine, thaw-sensitive material (potentially ice-rich glaciolacustrine silt).
The drilling logs from Tetra Tech EBA log report frozen ground as deep as 24.5 m. Ground tempera-ture data suggest that permafrost may be present as deep as 30 m in the glaciolacustrine material.
4.2.3.2 Ground ice contentAs outlined in the Standard, the presence of ground ice may pose a threat to a structure due to the risk of thaw settlement if the ice melts. Consequently, the project studied the characterization of the ice content at various depths. The borehole logs by Tetra Tech EBA (see Annex) provide the most complete information available regarding ground ice.
On average, excess ice content of 15–20% is reported at various depths in the glaciolacustrine material. The thickness of ice lenses ranges from a few millimetres to 20 cm. The thickness of the ice lenses appears to increase with depth, as observed in borehole W14101031-BH01 (in the schoolyard). The thickest lenses were observed at around 15 m depth.
Based on the available information, it is difficult to forecast the magnitude of any potential thaw subsidence. A permafrost thickness of 20 m in thaw sensitive material, with excess ice content of 15%, could result in 3 m of subsidence; subsidence could be about 4 m in locations where excess ice content is 20%.
4. RISK ASSESSMENT OF THE STRUCTURES AFFECTED
61

4.2.4 Preparation of an investigation reportThe Standard recommends the preparation of an investigation report that documents the following:
a. the work completed as part of the initial site investigation;b. the existing conditions, based on the results of the initial site investigation;c. an interpretation of the cause of permafrost degradation; andd. detailed recommendations for future monitoring, remedial structural work, or both.
The assessment was carried out in an area that has already been subject to various developments. In some cases, present-day buildings are built on locations with a complex history of construction, demolition and reconstruction. As a result, the present survey cannot entirely fulfil the recommen-dation regarding an investigation report. There is no record of an initial site investigation in the area prior to the 1950s. Subsequent studies have documented existing conditions, but not relative to the initial site investigation. Present-day conditions are the result of a long site history. An advantage of this situation is that the area has been monitored for a period exceeding the standard minimum requirement of at least one annual freeze/thaw cycle.
The cause of permafrost degradation can be identified, and multiple disturbances of the permafrost equilibrium have been identified. These include heating of the school crawlspace, heating and leaking from the pool, meltwater from the rink in the arena, disturbance created by former buildings that have since been demolished, and climate trends (warming temperature and increased precipitation). The combined impact of these disturbances has resulted in an increase of the active layer down to the thaw-sensitive glaciofluvial material. Further disruption of the permafrost equilibrium will result in thaw subsidence, based on borehole and ERT observations.
Detailed recommendations for future monitoring are presented in Section 5, as are recommenda-tions for maintenance practices. Recommendations for remedial structural work are not discussed, as this is beyond the scope of the present assessment. This assessment is provided as a potential resource for structural remediation experts.
4.3 Establishing a monitoring programPMD operates the buildings evaluated in this report, and leads the monitoring programs to verify their structural integrity. The need for new monitoring activities for the school are currently under discussion. Regularly scheduled inspections and monitoring of the other buildings are ongoing.
Since the beginning of this project, Tetra Tech EBA has improved the monitoring of ground thermal temperature of the school, and NCE has installed more advanced logging equipment for the thermistors in the boreholes under the pool and outside of the community centre.
4.3.1 Observations and documentation to be includedPrior to the closure and releveling of the school, a monitoring program was under development as part of this assessment. This monitoring included observations and documentation of the following building and site features:
a. progression of cracks and deformations in the foundation of the structure;b. progression of ground surface deformation;c. progression of doors and/or windows sticking or not sealing;d. progression of interior cosmetic damage;
Assessment of Risk to infRAstRuctuRe: Ross RiveR, Yukon
62

e. progression of any other damage to other visible structural components;f. climate data;g. depth of permafrost; andh. ground temperature.
Photography and benchmark cards were used to monitor items (a) to (e). Data collected from the ground temperature monitoring station and Environment Canada weather station provided the required monitoring for (f) to (h).
The benchmark cards were removed from the school during renovation work, but they are easily redeployed, and have since been installed in buildings elsewhere in Yukon.
4.3.2 Collection of ground temperature dataThe Standard provides recommendations and requirements regarding the collection of ground temperature data. Tetra Tech EBA provided valuable ground temperature data. These were either collected manually by an operator recording thermistor resistances using a digital multimeter, or automatically using data loggers connected to a thermistor wire. Thermistor resistances were converted to temperatures using a look-up table, or the Steinhart Hart equation.
In the context of this assessment, two ground temperature monitoring stations (consisting of multi-point thermistors at predetermined spacing on a cable) were converted from manual to automated monitoring. These cables were installed in boreholes by Tetra Tech EBA at the time of drilling, and were monitored manually until August 2015. Connecting these wires to a permanent logger system ensures continuous monitoring of ground temperatures. The system of combined NCE/Tetra Tech EBA installations complies with or exceeds the recommendations of the standard in this matter:
• it is set to record ground temperature hourly instead of monthly;• it uses thermistors that are installed within a sealed small-diameter casing within a backfilled
borehole;• it records and monitors ground temperatures in both outdoor areas and under two of the
buildings being assessed; and• as part of monitoring activities, it provides data that are forwarded to the geotechnical
engineering firm (Tetra Tech EBA) and the end user (PMD).
4.4 Producing a final evaluation reportThe Standard recommends that after the monitoring period, the monitoring data, together with the other investigations completed, shall be used to propose three actions:
a. alternative mitigative measures for the structure, including estimated costs to implement and maintain each alternative;
b. recommendations for implementation of the appropriate mitigative measures; andc. development of an implementation plan, including a schedule for implementing the
recommendations.
These matters are addressed in Section 5 of this report.
4. RISK ASSESSMENT OF THE STRUCTURES AFFECTED
63

5. Mitigation techniquesThis section mirrors the subsections of Part 6 of the Canadian Standards Association standard, “CAN/CSA-S501-14: Moderating the effects of permafrost degradation on existing buildings foundations,” referred to here as “the Standard” (CSA Group 2014b). Part 6 of the Standard is entitled “Mitigation techniques for structures impacted by changing permafrost conditions.” This section cross-references the steps prescribed by the Standard in terms of adaptation guidance that may be useful in the specific context of Ross River. Determining whether they are in fact useful and implementing the measures described in this section should be done in consultation with appropri-ate officials who have detailed knowledge of building maintenance and/or geotechnical expertise.
5.1 Applicability of remediation techniques to different foundation typesThe Standard suggests various techniques to restore the foundation stability of structures affected by changing permafrost conditions. It divides the techniques into two categories: 1) those applied to the site; and/or 2) those applied to the structure itself and its foundation. Table 5.1 summarizes how the various techniques apply to each foundation type.
Table 5.1 Applicability of various techniques to moderating the effects of permafrost degradation
Mitigation technique Shallow foundations Deep foundations
Surfacefootings
Buriedfootings
Slab on grade
Adfreezepiles
Grouted/ End-bearing
piles
Shading — see subsection 5.2.1 yes yes yes yes yes
Drainage — see subsection 5.2.2 yes yes yes yes yes
Snow management— see subsection 5.3.3
yes yes yes yes yes
Ventilation — see subsection 5.3.1 yes yes no yes no5
Ground Insulation— see subsection 5.3.2
yes yes no1 yes maybe2
Adjustment/levelling of existing foundation — see subsection 5.3.3
yes yes maybe3 yes yes
Mechanized refrigeration — see subsection 5.3.4
yes yes maybe5 yes yes
Thermosyphons — see subsection 5.3.4 yes yes maybe5 yes yes
Foundation replacement— see subsection 5.3.5
yes yes no5 maybe4 maybe4
Notes: 1) Perimeter insulation might be effective. Insulation under slab likely not feasible, except per Note 3. 2) Perimeter insulation will be feasible. Feasibility of insulation under building will depend on access. 3) Relevelling by grout or foam injection may be feasible. 4) Replacing piles with adjustable footings could be considered. It might be feasible to replace piles under building with beams and outrigger piles; less likely would be underpinning with micropiles. 5) Might be feasible under rare circumstances (modified from CSA Group 2014b: 12).
Assessment of Risk to infRAstRuctuRe: Ross RiveR, Yukon
64

5.2 Site techniques5.2.1 ShadingThe Standard suggests that vegetation may be planted around the structure to shade the ground surface in summer and help moderate ground surface temperatures. it recommends the following for the use of shade:
a. Any planted vegetation shall not restrict airflow under an elevated structure;b. Vegetation and trees that provide natural shading should not be cut down; andc. Sun screens may be constructed on south-facing locations (CSA Group 2014b: 20).
The Standard considers the vegetation only from a shading perspective. Although it notes that vegetation may restrict airflow, other possible negative impacts are not mentioned. For example, vegetation that is too dense may act as a snow fence and be detrimental to permafrost if it is located too close to a building. Also, vegetation may provide shading to areas where snow accumulates, thereby delaying its melt and prolonging its insulating effect and the warming effect of the meltwater runoff later in the season. Consequently, we argue that vegetation for shading should be used only in conjunction with an effective snow management strategy.
Considering the physical characteristics of the study area, it might be difficult to implement vegetation shading. The most suitable area would likely be the south-facing side of the arena/ recreation centre.
Other shading techniques may also be of use. For example, snow sheds in use along a test section of the Alaska Highway outside of Beaver Creek have proved to be efficient (Figure 5.1). They prevent snow from accumulating directly on the ground and also shade the ground surface while allowing air flow. The school could be a potential candidate for such a technique because it would not involve modification of the building.
Figure 5.1 Snow shed used to preserve permafrost along the Alaska Highway
5. MITIGATION TECHNIQUES
65

5.2.2 DrainageDrainage considerations are discussed in great detail in the CAN/CSA S503-15 standard, “Community drainage system planning, design, and maintenance in northern communities” (CSA Group 2015). It considers drainage as essential to preserving permafrost. The CAN/CSA-S501-14 Standard that is the focus of this section also considers drainage essential to preventing permafrost thaw and provides the following recommendations for helping to ensure proper drainage:
a. Drainage ditches or swales should not be excavated in ice-rich permafrost without detailed design and measures to control erosion and prevent progressive permafrost degradation;
b. The area under and within approximately 4 m of the perimeter of the structure should be graded to encourage rapid drainage of surface water away from the structure;
c. Water shall not be allowed to pond at any location within approximately 4 m of the structure;
d. During spring thaw, water shall be kept from ponding under or adjacent to any structure. Additional fill should be placed as needed to promote positive drainage; and
e. Downspouts from buildings shall be directed onto splash pads that discharge to natural ground at least 4 m away from all structures. Where no eavestroughs are installed, the area surrounding the building perimeter shall be sloped away from the structure at no less than 4% slope (CSA Group 2014b: 20).
Recommendation (a) does not apply to the study area as there are no ditches in close proximity to the buildings. To our knowledge there are no plans to build ditches in the study area.
Regarding recommendations (b), (c) and (d), water accumulation was observed only on the south-facing side of the arena during a rainy day (Figure 5.2). This area, less than 4 m from the building, may require some leveling. Otherwise, the whole study area appears in general to be well drained. There is no obvious need for additional grading. However, due to the coarse nature of the upper levels of the soil, water is likely absorbed by the gravel and may pool or flow at depth on the thaw front.
Figure 5.2 Water accumulation at the south side of the arena
Assessment of Risk to infRAstRuctuRe: Ross RiveR, Yukon
66

Recommendation (e) is likely to be the most relevant to the study area. The Standard recommends that water flowing from downspouts be conveyed 4 m away from the building. This recommendation is not met in the study area and should be considered, especially for the school. A challenge to implementing this recommendation is the fact that vehicles pass close to the buildings and may damage such a drainage system. A solution to consider could be to bury a 4-m-wide impervious geotextile at a shallow depth below the ground surface around the building. The geotextile would intercept runoff water and could be installed sloping away from the building. This would allow water absorbed by the upper layer of soil to be conveyed away from the building. Indeed, this solution has been attempted at the school, although the geotextile does not extend out by 4 m.
Some drainage issues specific to the study area are not mentioned in the Standard. For example, while not strictly “drainage” issues, the leaks of the pool and sewer system of the community centre have resulted in release of water into the ground and subsequent disruption of the perma-frost equilibrium. In contrast, the procedure for melting ice in the arena could be dealt with using the Standard’s recommendations relating to drainage. Building ice directly on the ground and then allowing meltwater to go directly into the ground is an avoidable practice that likely disrupts the permafrost thermal regime. A solution could be to install a liner that collects meltwater. The liner could be sloped so that water drains clear of structures, or the meltwater could be pumped clear of the structure.
Another issue not mentioned by the Standard is that the water truck habitually overfills the drinking water tank, spilling water onto the ground. This was observed at the school, but may also occur at other buildings (all the buildings studied have tanks). Solutions could be extending the current overfill spout that carries the excess water four meters away from the building, or installing a tank whistle that sounds when a tank is nearly full. These are commonly used on commercial heating oil tanks, and could easily be installed on water tanks.
5.2.3 Snow accumulation managementSnowbanks and snowdrifts around structures reduce ventilation and insulate the ground; this impedes the cooling of the active layer and of the underlying permafrost in winter. Snow also creates significant meltwater in the spring that could negatively affect the foundation. Although snow management considerations are presented in more detail in the CAN/CSA-S502-14 standard, “Managing changing snow load risks for buildings in Canada’s North” (CSA Group 2014a), the Standard related to building foundations (CSA Group 2014b) also considers this issue and provides the following recommendations related to the mitigation of permafrost degradation for existing buildings:
a. Snow should be cleared away in winter from around all structures to promote more rapid seasonal frost penetration that will maintain the permafrost; and
b. A maintenance program should be implemented to keep snow cleared all winter (CSA Group 2014b: 20).
In addition, the Standard recommends that it is best to move the snow to a location where it can be left to melt in the spring without causing problems for other structures or critical parts of the community. Snowbanks should be managed so that meltwater in the spring does not pond within four metres of any buildings. If it is not practical to remove snowdrifts, a snow study should be undertaken to determine if a snow fence or other mitigative measures can be implemented.
5. MITIGATION TECHNIQUES
67

During a site visit in April 2014, some snow remained near the north-facing sides of the buildings (Figure 5.3). The most snow was observed next to the school and the pool. It is not known whether this is because more snow had accumulated there, or whether it was simply slower to melt. Systematic removal of snow from the north-facing sides of these buildings would decrease the amount of meltwater released in spring.
Figure 5.3 Snow accumulation on the north-facing side of the pool (above) and the school (below)
Assessment of Risk to infRAstRuctuRe: Ross RiveR, Yukon
68

5.2.4 Additional consideration not mentioned in the standardThe Standard recommends avoiding construction activities around existing buildings that may negatively affect the permafrost thermal regime. However, the Standard does not make any recommendation regarding the development history of a site.
This assessment has found a number of examples where past uses of a site are relevant to the present-day thermal regime of the permafrost. The ERT surveys (Section 3.4) show ongoing negative impacts to the permafrost thermal regime from the former school and curling rink. This disturbed area should be avoided, or design enhancements should be considered if new development occurs here. Also, the disturbances induced by the former curling rink on permafrost are at least partially responsible for some of the damage observed to the community centre, which is built on the site of a previous building.
5.3 Techniques applied to the structureThe Standard specifies that if techniques applied to the structure are being considered, a qualified professional shall be consulted. It further specifies that implications of climate change should be considered in the design of these techniques. The PLUS 4011 technical guide provides guidance on adaptation to climate change for the design of infrastructure in permafrost (CSA Group 2010).
This section is limited to describing an inventory of the techniques that are already applied in some of the buildings. Providing guidance regarding techniques applied to the structure is beyond the scope of this report. Experts in foundation technology should be consulted if further detail is required.
5.3.1 VentilationOpen air spaces under buildings provide a means to isolate building heat from the permafrost terrain and reduce the opportunity for permafrost degradation. The Standard provides the following recommendations for the use of ventilation:
a. The structure shall be elevated to maintain a clear ventilated air space of at least 0.6 metres to permit winter air flow under and around the foundation;
b. Any vegetation that may be restricting foundation ventilation shall be removed;c. Mesh such as chickenwire or chainlink fence should be installed to protect the ventilated air
space from the accumulation of debris and other items that might restrict winter airflow. If mesh is not used, alternate materials should be installed that maintain adequate airflow capacity; and
d. Shipping containers or sheds shall not be placed immediately adjacent to a building (CSA Group 2014b: 13–14).
The community centre and the recreation centre fulfil recommendation (a). Nevertheless, damage to the foundation has occurred for various reasons. The damage required significant repairs to the steel pile structures. This highlights a weak point of the type of structural elements used in these two buildings. The current steel frame installation does not have built-in flexibility to allow periodic releveling. Such a system could be adapted with a screw-jacks or wedge system. This would eliminate the need to cut the steel frame and weld new pieces into it.
5. MITIGATION TECHNIQUES
69

Regarding recommendation (b), no vegetation was observed that was restricting foundation ventilation.
Both the community centre and the recreation centre follow recommendation (c). Mesh protects the ventilated air space from the accumulation of objects.
No shipping containers or sheds are placed immediately adjacent to the community centre or the recreation centre, as recommended by (d).
5.3.2 Ground insulationGround insulation can reduce the rate of heat transfer from a building or water/sewer service components into the ground. The Standard provides the following recommendations and requirements for the use of insulation:
a. In areas where mean annual ground temperatures are below –4°C (i.e., cold permafrost), the placement of insulation on or just below the ground surface should be considered;
b. In areas where mean annual ground temperatures (MAAT) are between –2°C and 0°C (i.e., warm permafrost), ground surface insulation should not be used, as it will restrict ground cooling in winter;
c. For mean annual ground temperatures between –4°C and –2°C, ground surface insulation should be used only on the recommendation of a qualified professional; and
d. Lawns and flowerbeds should be planted in bare ground surface areas to provide additional natural insulation to the ground surface. Any such landscaping should not obstruct access to the structure and foundations (CSA Group 2014b: 14).
Ross River currently has an MAAT between –4°C and –2°C. Therefore, based on the Standard, the community should qualify only for the use of insulation under the recommendation of a qualified professional. It is interesting to note that with climate change, the community MAAT is projected to rise above –2°C within decades. The MAAT of Faro (the nearest Environment Canada weather station) was –2.1 in 2013, –1.53°C in 2014, and –0.70°C in 2015 (see Table 4.2.1.1.1). If MAAT does rise above –2°C, the Standard would prohibit the use of insulation for Ross River.
Although insulation is currently in use in the crawlspace of the school, this is an unusual case. The crawlspace is a closed, heated area where cool air temperature cannot contribute to ground cooling in winter.
Recommendation (d) could be considered, as it may also promote cooling via evapotranspiration and build an organic mat that would promote cooling in winter and insulation in summer. Currently, none of the assessed buildings have lawns or flowerbeds next to them.
5.3.3 Foundation adjustment and levelingIt is sometimes possible to rehabilitate a foundation in a way that allows for periodic adjustment, to increase the service life of the structure. The Standard recommends the following techniques:
a. Screw jacks on wooden cribbing;b. Wedges on wooden cribbing;c. Slotted columns with foundation jacking points;d. Mud jacking of concrete foundation slabs; ande. Underpinning of foundation elements using pile jacking (CSA Group 2014b: 14).
Assessment of Risk to infRAstRuctuRe: Ross RiveR, Yukon
70

Based on our observations, none of these techniques have been applied to the assessed buildings. This explains some of the repairs observed in the study area, such as the community centre (see Figure 2.7.2.2). Although the foundation of the school was built with some capacity for releveling, this capacity was exceeded during the first years; the required range of adjustment had been underestimated.
Each technique presented in the standard (e.g., range of adjustment) should be specifically designed for each structure and each site by a qualified professional.
Future design in the Ross River area should in general consider the use of one or several of the techniques to allow periodic and less expensive leveling. Techniques to avoid or reduce damage from ground movement attributable to permafrost thaw should also be used. This method of adaptation has proved to be successful in many northern communities. Also, in most cases, extensions can be added to levelling systems to expand their adjustment range.
5.3.4 Mechanized refrigeration or thermosyphonsA refrigeration or thermosyphon system may be installed under a slab or shallow foundation or around deep foundations to cool the foundation soils to a stable thermal condition. The Standard provides the following recommendations for existing buildings:
a. in all cases, geothermal modeling shall be undertaken;b. The refrigeration or thermosyphon system shall be designed and installed by qualified
professionals; andc. To avoid the generation of frost heave in soils below the foundation that may not have
experienced the cold temperatures generated by the system, the refrigeration or thermosyphon system shall be installed with a layer of non-frost-susceptible soil in which the freezing/thawing front is maintained (CSA Group 2014b: 14).
The thermosiphons installed under the school and the pool comply with all these recommendations. it is assumed that they were subject to geothermal modelling, have been designed and installed by qualified professionals, and are installed in non-frost-susceptible soil.
5.3.5 Foundation replacementThe Standard notes that it may be possible to replace the foundation at the existing site:
a. Shallow foundations should be placed on engineered granular pads above the surrounding terrain;
b. Installing steel piles (or adding to existing piles) or footing around the exterior of structure and then supporting the structure on new beams resting on these new foundations; and
c. Lifting the structure off its present foundation and moving it to a new foundation specifically designed for the structure and the site.
It is not within the scope of this report or the competency of the authors to consider foundation replacement for the buildings in the study area. If this solution is considered by PMD under qualified professional advice, each technique suggested by the Standard should be specifically designed for each structure and each site.
5. MITIGATION TECHNIQUES
71

5.4 Abandonment and demolitionThe Standard addresses the possibility of abandoning or demolishing buildings affected by permafrost thaw. in the past, buildings in the study area such as the old school were demolished due to damage induced by settlement and permafrost thaw. Abandonment and demolition may be considered at some point for buildings located in the study area, but that is beyond the scope of this report and should be addressed by PMD and qualified professionals if necessary.
5.4.1 Site abandonmentThe Standard states that if a structure is considered to be repairable and/or reusable, but is located on warm permafrost that cannot be preserved, the site should be abandoned and the structure should be moved to a new location with a foundation designed specifically for the site conditions. The community centre and the recreation centre are the only assessed buildings with light pile foundations above the ground. They are likely to be the only assessed buildings where this may be possible, should the necessity arise.
5.4.2 Structure demolitionThe Standard considers that if the structure is considered to be damaged beyond repair or is a public safety hazard, it should be demolished.
5.5 MonitoringMonitoring is covered in Section 4 of the Standard, but we feel it is more suitable at the end of this section.
5.5.1 Monitoring existing mitigation measuresThe Standard provides recommendations regarding monitoring to ensure that measures taken to maintain permafrost or provide building heat interception, such as thermosiphons or mechanical cooling, are performing as intended.
Plans to monitor the performance of the structure and foundation and mitigation techniques depend on site-specific conditions. According to the Standard, performance monitoring may include the following:
a. routine visual inspections;b. recording and assessing crack monitoring points;c. conducting floor elevation and foundation element surveys;d. thermal monitoring of the subgrade, open air gaps, and floors;e. surface and groundwater monitoring; andf. operational monitoring of thermosyphons or other cooling techniques, if present
(CSA Group 2014b: 15).
Because of the history of damage to and repair of the assessed buildings, monitoring should be a high priority. A level survey of the buildings should be done periodically: at least once a year. To date, this practice has been inconsistently carried out. Any damage observed to a structure should be recorded and reported. if damage worsens it should be monitored using benchmark cards or a similar device that allows consistent tracking of progression. Any damage that is liable to disrupt the equilibrium of the thermal regime of permafrost, such as leaks in the pool, pipes or water tanks, should be repaired as soon as possible.
Assessment of Risk to infRAstRuctuRe: Ross RiveR, Yukon
72

5.5.2 Ground temperature monitoringIn addition to monitoring buildings, ground temperature should be subject to detailed attention. Ground temperature monitoring can provide an early indication of changes in the permafrost thermal regime. The Standard states that temperature sensors should be installed under the building and in undisturbed terrain to allow trends in ground temperatures to be monitored.
More importantly, as recommended by Section 4.3.4.3 and 5.3.4.3 of the Standard (CSA Group 2014b) , a reference ground temperature monitoring station that records temperature to a depth of at least 10 m should be installed in a natural, undisturbed area (i.e., in the wooded area south to the study area). This would allow monitors to discern between the thermal effects of climate variation and change from the thermal effects of disruption and buildings. Air temperature should also be monitored in the immediate area to provide more accurate climate data.
The school and the pool are already monitored using thermistor wires. This monitoring could be made more robust with consistent use of data loggers. The discrepancies in the data described in section 3.3 should be further investigated and any technical deficiencies with the loggers or thermistors should addressed.
We suggest the installation of additional monitoring in the crawlspace of the school in at least three locations, focusing on the first 1.5 m below the ground surface. Each monitoring station would record temperatures at the ground surface level, at the contact between the concrete skim coat and the insulating foam, at the level of flat-looped thermosiphons, and at the depth of 1.5 m. The purpose of this monitoring would be to better evaluate the performance of the thermosiphons and the impact of heat in the crawlspace. Collecting these data would allow better thermal modelling.
The thermistor wires located in the schoolyard should be connected permanently to a logger, ensuring that ground temperature can be monitored down to 27.7 m depth.
Finally, a thermistor wire connected to a logger could be installed below the rink of the arena to monitor permafrost temperature to the depth of at least 10 m.
5. MITIGATION TECHNIQUES
73
Assessment of Risk to infRAstRuctuRe: Ross RiveR, Yukon
74
6. Synthesis and conclusionThe objective of this report was to describe risks to PMD-managed buildings that are most sensitive to the impacts of permafrost degradation or are considered vital to the health of the community. This was achieved by describing the characteristics of four buildings managed by PMD and reviewing their design and maintenance history. Characteristics of permafrost soils (e.g., soil texture, excess ice content and temperature) that underlie these buildings was described using borehole, ground temperature and geophysical data.
These data were collected by TetraTech EBA and NCE. The remainder of the report is structured to mirror the Canadian Standards Association standard, “CAN/CSA-S501-14: Moderating the effects of permafrost degradation on existing buildings foundations,” referred to here as “the Standard” (CSA Group 2014b). The Standard provides a framework to evaluate the impacts of permafrost degrada-tion on buildings and describes practices with regards to protecting and mitigating risks to planned and existing buildings. Practices recommended by the Standard are discussed in the context of the permafrost found in Ross River. This results in the following key findings:
• Permafrost is warm, with a temperature close to 0°C; ground temperature profiles show that permafrost is metastable, suggesting that it is on the brink of thawing.
• The active layer has thickened over time. The top of the active layer is now in thaw-sensitive fine-grained soil.
• The thaw-sensitive permafrost can be as thick as 20 m. Its base is located below 28 m at some locations.
• The ground ice content of 15% suggests that there is the potential for 3 m of subsidence at some locations.
• There are persistent disturbances to the permafrost thermal regime caused by buildings that have since been demolished; these areas should be avoid for future construction. The buildings on these previously disturbed areas may continue to be affected by thaw that was triggered by the former buildings.
• Heating of the crawlspace of the school should be controlled to limit the impact on permafrost thermal equilibrium. Shallow ground temperature monitoring stations could be installed in the crawlspace to monitor and better assess the thermosiphon efficiency. Benchmark cards or similar monitoring methods should be employed if and when new cracks appear in the buildings.
• installing a lining in the rink of the arena would avoid disturbance of permafrost when the ice is melted in spring.
• Snow should be cleared at least 4 m away from the walls, particularly north-facing walls.• Actions should be taken to restrict or divert water that overflows from tanks and the delivery
truck during water refill operations.• Where feasible, the installation of adjustable foundations should be preferred over non-
adjustable methods.• The whole area would benefit from improved ground temperature monitoring, including a
permafrost monitoring station in a natural undisturbed area.
75
As stated in Section 7 of the Standard, two important issues need to be considered for the long-term performance of any foundation rehabilitation technique used to maintain permafrost or remediate permafrost degradation around existing buildings or structures:
• the time required for the applied mitigation strategy to become effective, and• the need for performance monitoring (CSA Group 2014b: 22).
Table 5.1, modified from the Standard, lists potential mitigation techniques to address foundation distress due to permafrost degradation. In selecting an appropriate mitigation technique, both its short-term and long-term performance should be considered. For example, one technique may provide long-term mitigation but not address the effects of permafrost degradation in the short term. In some cases it can take five or more years for a new thermal equilibrium to be established in the permafrost under the structure. For this reason, and depending on site-specific conditions, more than one mitigation technique may be needed in order to address both immediate and long-term stability requirements. If the planned building life exceeds 20 years, the potential for climate change should be taken into account when selecting mitigation strategies.
Regardless of the combination of mitigation techniques applied, the building designer, PMD engineers and maintenance staff all have expertise that is relevant when developing a sustainable monitoring program and schedule that is appropriate to the site-specific conditions.

Assessment of Risk to infRAstRuctuRe: Ross RiveR, Yukon
76
References
Benkert, B.E., D. Fortier, P. Lipovsky, A. Lewkowicz, I. de Grandpré, K. Grandmont, D. Turner, S. Laxton, K. Moote and L.-P. Roy. 2015. Ross River Landscape Hazards: Geoscience Mapping for Climate Change Adaptation Planning. Northern Climate ExChange, Yukon Research Centre, Yukon College.
Bond, J.D. 2001a. Quaternary geology and till geochemistry of the Anvil district (parts of 105K/2, 3, 5, 6 and 7), Central Yukon Territory. Bulletin 11. Whitehorse: Exploration and Geological Services Division, Indian and Northern Affairs Canada.
Bond, J.D. 2001b. Surficial geology and till geochemistry of Weasel Lake map area (105G/13), east central Yukon. In D.S. Emond and L.H. Weston (eds.). Yukon Exploration and Geology 2000. Whitehorse: Exploration and Geological Services Division, Indian and Northern Affairs Canada, pp. 73–96.
Bond, J.D. 1999. McConnell ice-flow map of the Anvil District (105K), central Yukon. 1:250 000 scale. Exploration and Geological Services Division, Yukon Region, Indian and Northern Affairs, Canada, Open File 1999-14.
Bonnaventure, P.P., A.G. Lewkowicz, M. Kremer and M. Sawada. 2012. “A regional permafrost probability model for the southern Yukon and northern British Columbia, Canada.” Permafrost and Periglacial Processes, Vol. 23: 52–68. doi:10.1002/ppp.1733.
Brown, R.J.E. 1963. Influence of vegetation on permafrost. Proceedings of International Permafrost Conference. Washington, D.C.: National Academy of Sciences, Publication No. 1287, pp. 20–25.
Brown, R.J.E. and T.L. Péwé. 1973. Distribution of permafrost in North America and its relationship to the environment: A review, 1963–1973. In North American Contribution to the Second International Conference on Permafrost. Washington, D.C.: National Academy of Sciences, pp.71–100.
CBC (Canadian Broadcasting Corporation). 2013. Ross River, Yukon, homes flooded a second time. www.cbc.ca/news/canada/ north/ross-river-yukon-homes-flooded-a-second-time-1.1332252.
Clague, J.J., S.G. Evans, V.N. Rampton and G.J. Woodsworth. 1995. “Improved age estimates for the White River and Bridge River tephras, western Canada.” Canadian Journal of Earth Sciences, Vol. 32: 1172–1179.
CSA Group. 2015. Community drainage system planning, design, and maintenance in northern communities. CAN/CSA-S503-15 Standard. http://shop.csa.ca/en/canada/infrastructure-and- public-works/cancsa-s503-15/invt/27037832015.
CSA Group. 2014a. Managing changing snow load risks for buildings in Canada’s North. CAN/CSA-S502-14 Standard. Toronto: CSA Group. http://shop.csa.ca/en/canada/infrastructure-and-public-works/cancsa-s502-14/invt/27037662014.
CSA Group. 2014b. Moderating the effects of permafrost degradation on existing building foundations. CAN/CSA-S501 Standard. Toronto: CSA Group. http://shop.csa.ca/en/canada/infrastructure-and- public-works/cancsa-s501-14/invt/27037462014.
CSA Group. 2010. PLUS 401.1. Infrastructure in permafrost: A guideline for climate change adaptation. Technical guide. 1st edition. http://shop.csa.ca/en/canada/infrastructure-and-public-works/plus-4011-1st-ed-pub-2010/invt/27030762010.
Darrow, M.M., S.L. Huang, Y. Shur and S. Akagawa. 2008. “Improvements in frost heave laboratory testing of fine-grained soils.” Journal of Cold Regions Engineering, Vol. 22: 65–78.

77
RefeRences
EBA. 2012. Ross River School: 2012 Ground Temperature Data Review. Report prepared for Government of Yukon, Highways and Public Works.
EBA (EBA Engineering Consultants). 2007. Borehole W14101031-BH01 drill log. Report prepared for Government of Yukon.
EBA (EBA Engineering Consultants). 2005a. Geothermal evaluation of school, Ross River, YT. Report prepared for Government of Yukon, Highways and Public Works.
EBA (EBA Engineering Consultants). 2005b. Results of Foundation Inspection and Permafrost Monitoring New School, Ross River, Yukon. Report prepared for Government of Yukon, Property Management Agency.
EBA (EBA Engineering Consultants Ltd. 1998. Geotechnical Site Evaluation, New School: Ross River, Yukon. internal report prepared for the Government of Yukon, Property Management Agency.
Environment Canada. 2014a. Climate Trends and Variations. Environment Canada, Ottawa, Ontario. http://ec.gc.ca/adsc-cmda/default.asp?lang=En&n=F3D25729-1.
Environment Canada. 2014b. Historical Climate Data. Environment Canada, Ottawa, Ontario. http://climate.weather.gc.ca/index_e.html.
Environment Yukon. 1990. Groundwater Information, Network water well 211030017. http://gw-info.net.
Environment Yukon. 1976. Groundwater Information, Network water well 211030018. http://gw-info.net.
Gartner Lee Limited. 2003. Yukon Groundwater and Ground Source Heat Potential Inventory. Report # 22-680. Prepared for Energy Solutions Centre, Whitehorse.
Government of Yukon. 2014. Ross River. Yukon Community Profiles. www.yukoncommunities.yk.ca/ross-river.
Heginbottom, J.A., M.A. Dubreuil and P.T. Harker. 1995. Permafrost Map of Canada. Sheet MRC 4177, 1: 7,500,000 scale. In The National Atlas of Canada, 5th Edition (1978–1995). Ottawa: Natural Resources Canada.
I. Holubec Consulting. 2008. Flat Loop Thermosyphon Foundations in Warm Permafrost. Report prepared for Government of NT Asset Management Division, Public Works and Services and the Canadian Council of Professional Engineers. www.pws.gov.nt.ca/pdf/publications/Thermosyphon%20Foundations%20in%20warm%20permafrost%20.pdf.
Jackson, L.E. Jr. 1994. Terrain Inventory and Quaternary History of the Pelly River area (105 F, G, J, K), Yukon Territory. Memoir 437. Ottawa: Geological Survey of Canada.
Jackson, L.E. Jr. 1993. Surficial geology, Bruce Lake, Yukon Territory. Map 1791A, 1:100,000 scale. Ottawa: Geological Survey of Canada.
Jackson, L.E. Jr. and C.R. Harington. 1991. “Pleistocene mammals, stratigraphy, and sedimentology at the Ketza River site, Yukon Territory.” Géographie Physique et Quaternaire, Vol. 45: 69–77.
Jensen, B.J., S. Pyne-O’Donnell, G. Plunkett, D.G. Froese, P.D. Hughes, M. Sigl, J.R. McConnell, M.J. Amesbury, P.G. Blackwell, C. van den Bogaard, C.E. Buck, D.J. Charman, J.J. Clague, V.A. Hall, J., Koch, H. Mackay, G. Mallon, L. McColl and J.R. Pilcher. 2014. “Transatlantic distribution of the Alaskan White River Ash.” Geology, Vol. 42, No. 10: 875–878.
Laxton, S. and J. Coates. 2010. Geophysical and borehole investigations of permafrost conditions associated with compromised infrastructure in Dawson and Ross River, Yukon. in K.E. MacFarlane, L.H. Weston and C. Relf (eds.). Yukon Exploration and Geology 2010. Whitehorse: Yukon Geological Survey, pp. 135–148.

Assessment of Risk to infRAstRuctuRe: Ross RiveR, Yukon
78
Lerbekmo, J.F. 2008. “The White River Ash: Largest Holocene Plinian tephra.” Canadian Journal of Earth Sciences, Vol. 45: 693–700.
Lerbekmo, J.F. and F.A. Campbell. 1969. “Distribution, composition and source of the White River Ash, Yukon Territory.” Canadian Journal of Earth Sciences, Vol. 6: 109–116.
Lewkowicz, A.G. and P.P. Bonnaventure. 2011. “Equivalent elevation: A method to incorporate variable lapse rates into mountain permafrost modeling.” Permafrost and Periglacial Processes, Vol. 22: 153–162.
Lipovsky, P.S. and K. Yoshikawa. 2008. Initial results from the first year of the Permafrost Outreach Program, Yukon, Canada. in L.H. Weston, L.R. Blackburn and L.L. Lewis (eds.). Yukon Exploration and Geology 2008. Whitehorse: Yukon Geological Survey, pp. 161–172.
Mathews, W.H. 1986. Physiographic map of the Canadian Cordillera. Map 1701A, scale 1:5,000,000. Ottawa: Geological Survey of Canada.
Plouffe, A. 1989. Drift prospecting and till geochemistry in Tintina Trench, southeastern Yukon. MSc thesis, Department of Earth Sciences, Carleton University, Ottawa.
Purves, M. 2011. Climate Change in the Yukon: More Observations. Internal Report YWC-11-111, Yukon Weather Centre.
Shur, Y.L. and M.T. Jorgenson. 2007. “Patterns of permafrost formation and degradation in relation to climate and ecosystems.” Permafrost Periglacial Processes, Vol. 18, Issue 1: 7–19. doi:lO.l002/ppp. 582.
Smith, C.A.S., J.C. Meikle and C.F. Roots (eds.). 2004. Ecoregions of the Yukon Territory: Biophysical Properties of Yukon Landscapes. PARC Technical Bulletin 04-01, Agriculture and Agri-Food Canada, Summerland, British Columbia.
SNAP (Scenarios Network for Alaska and Arctic Planning). 2013. Data portal. www.snap.uaf.edu.
Stanley Associates Ltd. 1986. Groundwater supply investigation, Ross River, Yukon. Report to Department of Community and Transportation Services, Government of Yukon.
Turner, D.G. 2014. Surficial geology, Ross River region, Yukon. Map: parts of NTS 105K/1 & 2 and 105F/15 & 16. 1:25,000 scale. Open File 2014-13. Whitehorse: Yukon Geological Survey.
Wahl, H.E., D.B. Fraser, R.C. Harvey and J.B. Maxwell. 1987. Climate of Yukon. Ottawa: Atmospheric Environment Service, Environment Canada.
Ward, B.C. and L.E. Jackson Jr. 2000. Surficial Geology of the Glenlyon Map Area, Yukon Territory. Bulletin 559. Ottawa: Geological Survey of Canada.
Warren, F.J. and D.S. Lemmen (eds.). 2014. Canada in a Changing Climate: Sector Perspectives on Impacts and Adaptation. Ottawa: Government of Canada.
Water Survey of Canada. 2015. National Water Quantity Survey Program. Ottawa: Environment Canada. https://wateroffice.ec.gc.ca.
YBS (Yukon Bureau of Statistics). 2010. Government of Yukon Socio-Economic and Web Portal – Ross River: Housing Tenure, Condition, Period of Construction and Structural Type Census 2006. www.sewp.gov.yk.ca/data?regionId=YK.RR&subjectId=POPCOM&groupId=POP COM.DWELL&dataId=CENSUS_2006_DWELLINGS&tab=region.
Zanasi, L. and M. Taggart. 2006. Building on Strength: An Economic Development Strategy for Ross River. Report prepared for the Ross River Dena Council, Ross River, Yukon.

Annex: EBA Tetra Tech borehole logs
79

Assessment of Risk to infRAstRuctuRe: Ross RiveR, Yukon
80

Annex: eBA TeTrA Tech Borehole logs
81

Assessment of Risk to infRAstRuctuRe: Ross RiveR, Yukon
82

Annex: eBA TeTrA Tech Borehole logs
83

Assessment of Risk to infRAstRuctuRe: Ross RiveR, Yukon
84

Annex: eBA TeTrA Tech Borehole logs
85

Assessment of Risk to infRAstRuctuRe: Ross RiveR, Yukon
86
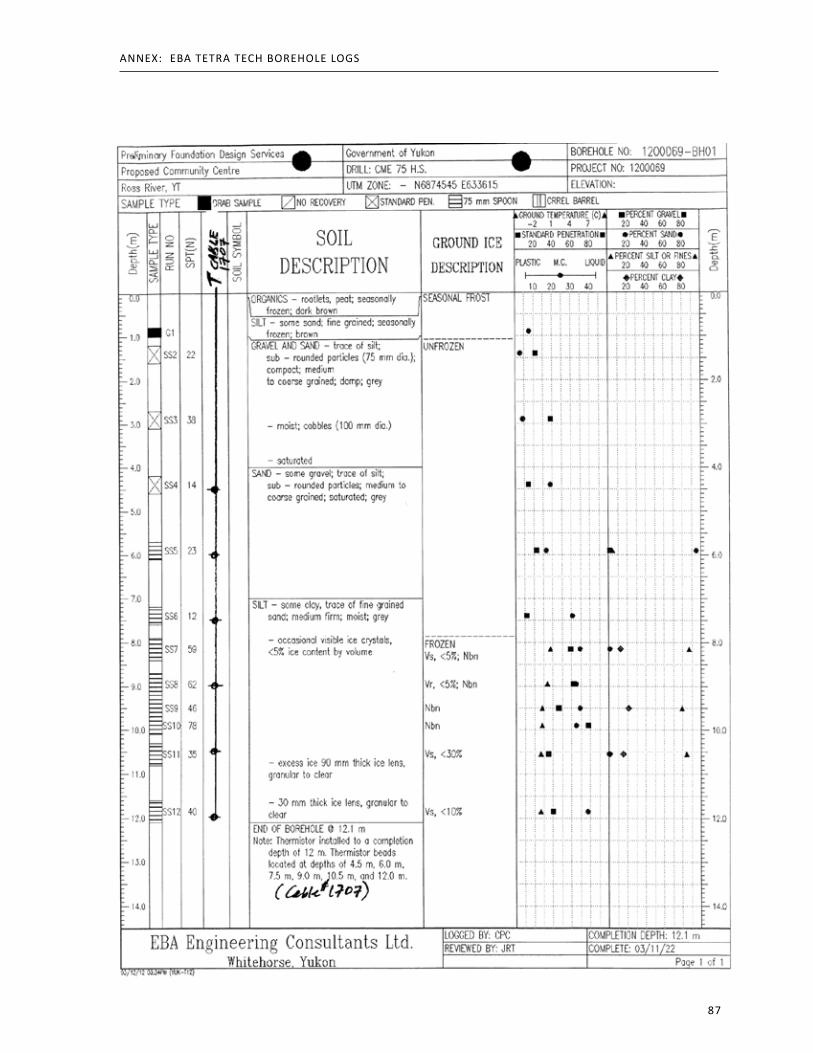
Annex: eBA TeTrA Tech Borehole logs
87

Assessment of Risk to infRAstRuctuRe: Ross RiveR, Yukon
88