Embed Size (px)
Citation preview
Effect of Permafrost Thaw Slumps on
Benthic Invertebrates and on Concentrations of Persistent
Organic Pollutants in lakes of the Mackenzie Delta Uplands,
NT
Rebecca D’Onofrio
Thesis submitted to the
Faculty of Graduate and Postdoctoral Studies
In partial fulfillment of the requirements
For the Masters in Biology
Thèse soumise à
La Faculté des études supérieures et postdoctorales
Université d’Ottawa
En vue de l’obtention de la maîtrise en sciences
Department of Biology
Faculty of Science
University of Ottawa
© Rebecca D’Onofrio, Ottawa, Canada, 2014
1
Contents Abstract ......................................................................................................................................................... 3
Résumé ......................................................................................................................................................... 3
Acknowledgements ....................................................................................................................................... 5
General Introduction..................................................................................................................................... 6
Permafrost thaw and the Mackenzie Delta Uplands ................................................................................ 6
The biomass size spectrum ....................................................................................................................... 7
Persistent Organic Pollutants and Permafrost thaw ................................................................................ 9
References .............................................................................................................................................. 12
Chapter 1- Impact of Permafrost Thaw Slumps on Benthic Macroinvertebrate Assemblages and on the
Biomass Size Spectrum of Small Lakes of the Mackenzie Delta Uplands ................................................... 19
Abstract ................................................................................................................................................... 20
Introduction ............................................................................................................................................ 21
Study Site ................................................................................................................................................ 22
Materials and Methods ........................................................................................................................... 23
Statistical Analysis ................................................................................................................................... 25
Results ..................................................................................................................................................... 26
PCAs .................................................................................................................................................... 27
Size Spectra ......................................................................................................................................... 28
Fish ...................................................................................................................................................... 29
Discussion................................................................................................................................................ 30
Size Spectra ......................................................................................................................................... 32
Conclusion ............................................................................................................................................... 33
References .............................................................................................................................................. 35
Chapter 2 – Impact of Permafrost Thaw Slumps on Contaminant Concentrations in Amphipods and Fish
of the Mackenzie Delta uplands, NT ........................................................................................................... 50
Abstract ................................................................................................................................................... 51
Introduction ............................................................................................................................................ 52
Methods .................................................................................................................................................. 53
Study area ........................................................................................................................................... 53
Sampling methodology ....................................................................................................................... 55
Analsysis of Persistent Organic Pollutants .......................................................................................... 55
2
Contaminant Extraction and Lipid Analysis ........................................................................................ 56
Statistical Analysis ................................................................................................................................... 57
Results ..................................................................................................................................................... 58
Results of POP extractions .................................................................................................................. 59
Results of statistical analyses .............................................................................................................. 60
Discussion................................................................................................................................................ 64
Biota-Sediment Accumulation Factors and Sediments ....................................................................... 68
Conclusion ............................................................................................................................................... 68
References .............................................................................................................................................. 71
General Conclusions.................................................................................................................................... 93
Appendix A – Benthic invertebrate identification (raw data) ..................................................................... 97
Appendix B – Benthic invertebrate PCB concentration (ng/g lipid) ......................................................... 105
Appendix C – Fish PCB concentrations (ng/g lipid) ................................................................................... 106
Appendix D – Concentrations of OC Pesticides in Gammarus (ng/g lipid) ............................................... 108
Appendix E – Concentrations of OC Pesticides in Fish (ng/g lipid) ........................................................... 109
Appendix F – Concentrations of PCB homologues in sediments (ng/g organic carbon) ......................... 110
Appendix G – Concentrations of OC Pesticides in sediments (ng/g organic carbon) ............................... 111
3
Abstract
Permafrost thaw slumping along lakeshores in lakes of the Mackenzie Delta Uplands, NT is known to
alter water chemistry significantly. Its impact on benthic communities and persistent organic pollutant
(POP) behaviour in lakes is not known. Benthic invertebrate communities responded to slumps through
changes to community composition and size spectra. Larger taxa tended to dominate in lakes with
slumps. Variability in biomass size spectra was related to total dissolved nitrogen concentration and
slump size. Concentrations of POPs in Gammarus were negatively correlated with total phosphorus and
positively correlated with the percentage of the catchment slumped. Lakes with slumps generally had
higher mean concentrations of POPs in Gammarus (ex. ΣPCBsDisturbed = 27.54 ng/g lipid, ΣPCBsUndisturbed =
16.97 ng/g lipid; ΣDDT Disturbed =18.47 ng/g lipid and ΣDDTUndisturbed =10.86 ng/g lipid). Benthic
invertebrate biomass was also negatively correlated with concentrations of contaminants in Gammarus,
supporting the biomass dilution hypothesis. Thaw slumps have large enough impacts on the physico-
chemical characteristics of lakes that they alter benthic invertebrate community composition and size-
structure, and contaminant concentrations in Gammarus.
Résumé
Les glissements de fonte rétrogressifs au bords des lacs dans la région du Delta du Mackenzie, NT, ont
un effet connu sur la chimie de l’eau. Cepedant, l’effet de glissements de fonte rétrogressifs sur les
communautés de macroinvertébrés benthiques et sur le comportement de polluants organiques
persistents (POPs) dans l’eau n’est pas connu. Les communautés de macroinvertébrés benthiques ont
répondus aux glissements de fonte avec des changements dans la composition de communautés et des
changements dans la spectre de taille des lacs. Les taxons plus grands ont dominés dans les lacs
pertubés. La variabilité des spectres de taille était lié à la concentration d’azote total dissous et à la
taille des glissements. Les concentrations de polluants dans l’amphipode Gammarus étaient
négativement correlés avec la concentration de phosphore total et positivement correlés avec le
pourcentage du bassin versant affecté par un glissement de fonte. Les lacs avec les glissements avaient
des concentrations de POP plus hautes que les lacs sans glissements (ex. ΣBPCPerturbés = 27.54 ng/g de
lipide, ΣBPCsNon-perturbés = 16.97 ng/g de lipide; ΣDDT Perturbé =18.47 ng/g de lipide and ΣDDTNon-perturbé
=10.86 ng/g de lipide). La biomasse de macroinvertbré benthique était aussi négativement correlé avec
4
la concentration de POPs dans Gammarus, ce qui soutient l’hypothèse de la dilution par biomasse. Les
glissements de fonte rétrogressifs ont un impact assez fort sur les charactéristiques physico-chimiques
des lacs qu’ils ont un effet sur les communautés de macroinvertébrés benthiques (composition des
communautés et spectre de taille), et sur les concentrations de POPs dans Gammarus.
5
Acknowledgements
I would like to thank my supervisors Dr. Antoine Morin and Dr. Jules Blais for their help, expertise and
support throughout this project.
I greatly appreciate the expertise, feedback and guidance provided by Linda Kimpe and by my
committee members, Dr Frances Pick, Dr Alexandre Poulain and Dr Chris Burn.
This research would not have been possible without NSERC’s Northern Research Internship and INAC’s
Northern Scientific Training Program.
Sample collection would not have been possible without the help of Adam Houben. A special thanks to
lab assistants, especially Claudine Lefebvre and Hannah Volt, for help with benthic invertebrate
identification.
Finally, thank-you to lab-mates in the Morin and Blais labs, especially Bernadette Charpentier, for the
help and support throughout my project.
6
General Introduction
Permafrost thaw and the Mackenzie Delta Uplands
While climate change is a global phenomenon, the increase in annual average temperature since
1980 has been twice as high over the Arctic as it has been over the rest of the world (AMAP
2011). The Intergovernmental Panel on Climate Change suggests that the global mean temperature will
probably further increase by 1.4-5.8°C over the next 100 years (IPCC 1995) with warming that will be
more pronounced around the poles (Lemke et al. 2007). The temperatures between the years 2005-
2010 have been the warmest period ever recorded in the Arctic (AMAP 2011). In the Mackenzie Delta
uplands east of the Mackenzie Delta, NWT, the mean annual air temperature has increased by more
than 2.5°C since the 1970s (Burn and Kokelj 2009). Higher surface temperatures are driving changes in
the ground temperatures and in the cryosphere (AMAP 2011). Permafrost underlies approximately 24%
of the exposed land area of the Northern hemisphere (Taylor et al. 1999), a large portion of which is in
Canada.
Thawing permafrost can lead to different terrain features. If thawing occurs in areas with large
amounts of ground ice, the terrain will have a very pronounced physical response to thawing.
Permafrost thaw slumps are a common type of thaw formation in permafrost terrain. They are large
crater-like depressions initiated by the exposure of ice-rich permafrost following a disturbance or
erosion (Burn and Lewkowicz 1990). Increased rates of permafrost thaw slump formation along lake
banks have recently been observed in the Mackenzie Delta region (Lantz and Kokelj 2008). Once ice-
rich permafrost thaws, the material and meltwater flow to the foot of the thawed face (Burn and
Lewkowicz 1990). Slump expansion may span several years, with the head-wall retreating as more ice-
rich substrate becomes exposed. A slump head-wall may retreat several metres in a single season.
Slump expansion may slow when the ground ice becomes exhausted, or when the angle of the footslope
becomes such that mud does not flow off it. As the slump stabilizes, it may become revegetated as
plants begin to colonize the footslope. Stable slumps may also be re-initiated after several years. This
may occur as a result of talik (the unfrozen zone beneath a lake) expansion beneath the lake into ice-rich
materials, causing lake-bottom subsidence and rejuvenation of shoreline slumping (Kokelj et al. 2009a).
7
In this way, permafrost slumps can persist and expand for many years (Lantz and Kokelj 2008; Kokelj et
al. 2009a).
The tundra terrain of the Mackenzie Delta uplands is underlain with ice-rich permafrost that can
be several hundred meters thick (Mackay 1971). The near-surface permafrost is also ion rich because of
soluble materials that become entrapped in the permafrost by a rising permafrost table, in conjunction
with downward migration of ions along thermally induced moisture gradients (Kokelj and Burn 2003).
The Mackenzie Delta uplands are also interspersed with thousands of small lakes (Burn and Kokelj
2009), almost one in ten of which are directly impacted by permafrost thaw slumps (Kokelj et al.
2009b). Because of the ion-rich nature of the permafrost, slump materials in the region tend to have
very high concentrations of major ions and can have significant effects on lake physico-chemical and
biological parameters (Kokelj et al. 2005; Thompson et al. 2010). In lakes with slumps, specific
conductivity and the concentration of major ions (Ca, Mg, Na, K) increased significantly (Kokelj et al.
2005). pH also correlated positively with the % of the catchment slumped. Slump size negatively
correlated with water colour and dissolved organic carbon (DOC) in the water column. The decrease in
DOC and colour is likely due to the higher concentrations of base cations in lakes with slumps, which can
increase the adsorption and flocculation of coloured dissolved organic matter (CDOM) from the water
column (Thompson et al. 2008). Decreased concentrations of chlorophyll a, total dissolved nitrogen
(TDN) and total phosphorus (TP) in the water column of lakes with slumps have also been found
(Thompson et al. 2010). Mesquita (et al. 2010) also linked increased macrophyte biomass to permafrost
slump presence, potentially due to the higher degree of light penetration to the sediments. Because of
the rapid rate of climate warming in the Canadian Arctic, understanding how thawing permafrost affects
lake ecosystems is of great importance.
This thesis will examine how thawing permafrost is currently altering benthic invertebrate
assemblages and persistent organic pollutant (POP) behavior in lakes of the Mackenzie delta region.
Studying a subset of lakes may shed light on how the Arctic landscape will change in the coming years.
The biomass size spectrum
The first chapter of my thesis describes the response of benthic invertebrate assemblages to
permafrost thaw slumps. Benthic macroinvertebrates are an important component of secondary
8
production in lake ecosystems, and are a food source for fish. Changes to benthic macroinvertebrate
assemblages will also likely impact larger lake biota. Benthos may respond to the water chemistry
changes caused by permafrost thaw slumping, and to the changes in pelagic and littoral primary
productivity related to decreased planktonic chlorophyll, increased light penetration, and increased
macrophyte biomass in slumped lakes.
I will also combine a taxonomic description with size spectra analysis to describe how benthic
invertebrate assemblages vary along a spatial gradient of increasing permafrost thaw slumping. The
biomass size spectrum describes the distribution of living biomass across the entire range of organism
size. The concept was first developed by Sheldon et al. (1972, 1973) to describe the planktonic
communities of marine systems. The distribution of biomass among individuals in a community is a
useful indicator of ecosystem structure, and describes how energy and nutrients are partitioned in an
ecosystem(Boudreau et al. 1991), and how energy flows up an ecosystem through predator-prey
interactions (Kerr and Dickie 2001). Size spectra are quantified as a log-density versus log-body size
linear relationship. They are remarkably consistent across ecosystem types, though the parameters of
the spectra such as slope, intercept or number of size classes will vary slightly with local environmental
conditions (Boudreau et al. 1991; Rasmussen 1993; Bourassa and Morin 1995; Petchey and Belgrano
2010). Because size-spectra are independent of taxonomic composition, they allow for the comparison
of ecosystem structure between different communities and therefore allow comparisons among
assemblages formed by different species or in different habitat types. They can be used to describe,
compare, and make predictions about biological assemblages and are therefore a complementary
technique to taxonomic description of assemblages. Biomass size distributions have been shown to vary
with environmental factors and with perturbations to the ecosystem (Sprules and Munawar 1986;
Hanson 1990; Rasmussen 1993; Bourassa and Morin 1995). They have also been used to assess human
impacts on systems, for example the impact of fisheries, agricultural practices, or warming temperatures
(Boudreau and Dickie 1989; Gamble et al. 2006; Yvon-Durocher et al. 2011). I propose to use biomass
size spectra to assess the impact of permafrost thaw slumps on benthic invertebrate communities. The
changes to the system caused by thawed permafrost material should be reflected by changes to the
biomass size spectrum. If larger taxa are favoured by the changes, the angle of the slope should
decrease, while the angle of the slope would increase if smaller taxa are favoured. Alternatively, if all
9
size classes are impacted to the same degree, an over-all decrease in biomass in each size class is
expected.
Persistent Organic Pollutants and Permafrost thaw
Changes to water chemistry caused by thawed permafrost material will also necessarily impact
other parts of the lake systems. Among the water chemistry variables altered by thaw slumps, many
will also impact the behavior of persistent organic pollutants in water. The second chapter of my thesis
will focus on persistent organic pollutant (POP) concentrations in lake biota. The Arctic is largely free
from direct inputs of many chemicals and contaminants, and there are now strict restrictions on
production and use of persistent contaminants and pesticides throughout North America and Europe.
However, contaminants remain present in air, water, animal and human populations in the Arctic. The
presence of these chemicals in the Arctic has been known for many years, but the current changing
Arctic climate raises new questions with regard to contaminant behaviour and presence in the Arctic.
Two POP groups are examined in this study, polychlorinated biphenyls (PCBs) and
organochlorine pesticides (OCs). PCBs and OCs were widely used throughout the world beginning in the
1940s (Macdonald et al. 2000). Contaminant concentrations in the Arctic abiotic environment have
been measured since the late 1980s, and in some cases even earlier (Harner et al. 2003). The
Stockholm convention was the major international, legally binding instrument to manage POPs on a
global scale, and came into force in 2004. It has since been ratified by 153 countries(AMAP 2009).
PCBs are a group of related chlorinated hydrocarbons formed by the chlorination of a biphenyl
base molecule with molecular chlorine. A PCB molecule can have from one to ten chlorine atoms
substituted around the biphenyl ring structure, making 209 different congeners. PCBs are synthetic
compounds that are not easily degraded in the environment, have high molecular weights and low
vapour pressures. They are highly stable, and have been used as lubricants, heat conductors and
plasticizers (Newman and Unger 2003). Their high stability, coupled with their lipophilicity, allows them
10
to remain in the environment for long periods and to accumulate in biota through the food chain. OCs
are also synthetic, chlorinated compounds. These compounds have chlorine substituted for hydrogen
on a hydrocarbon molecule. Like PCBs, they are very stable in the environment, degrade slowly, and
tend to accumulate in lipids. These POPs have various negative impacts on human and animal health,
and can affect the nervous system, immune system, reproductive system and endocrine system
(Newman and Unger 2003). These chemicals are of particular interest because they accumulate through
the food chain and are highly persistent in the environment.
Contaminants are transported to the arctic via long range transport (Wania and Mackay 1996).
Most POPs are volatile enough to evaporate and deposit among air, water and soil at ordinary
temperatures. Warm temperatures favour evaporation whereas cooler temperatures at higher latitudes
favour deposition. Furthermore, contaminants of different volatilities will migrate at different velocities,
and deposit at different temperatures. Highly volatile POPs tend to remain in the atmosphere for longer
periods of time and at cooler temperatures, and less volatile POPs will deposit sooner. In this way,
different compounds may reach the same latitudes at different rates. Once a compound reaches the
latitude at which it will deposit, it may partition onto water, snow, ice, soil or vegetation. By this
mechanism, contaminants tend to migrate and accumulate at the poles of the Earth.
Once the contaminant is deposited on lakes, the water chemistry of the lake will affect how it
will partition within the lake system, Contaminant uptake to biota from water is largely governed by the
chemical properties of the contaminants, and the physico-chemical properties of the water and
sediments (Newman and Unger 2003). Because permafrost thaw slumps affect water chemistry, they
will also likely impact contaminant uptake to biota. DOC, one parameter altered significantly by thaw
material, has a well-established effect on contaminant behavior in lake systems (Kukkonen 1991; Haitzer
et al. 1998; Haitzer 1999). Because contaminants are hydrophobic, freely dissolved POPs tend to bind to
DOC in the water column when it is present. This renders them less bioavailable for uptake by
organisms.
11
Total phosphorus and total nitrogen also tend to decrease in lakes with thaw slumps (Kokelj et
al. 2005), which in turn affects planktonic biomass. Biomass of algae and other aquatic organisms can in
turn impact contaminant concentration through biodilution, since biota in more productive lakes also
tend to have lower concentrations of contaminants (Larsson et al. 1992; Holmqvist et al. 2005). Algae
settling can also draw contaminants down to the sediments leading to their burial.
While concentrations of legacy POPs in Arctic air have been decreasing since the 1990s (Hung et
al. 2009), conflicting trends for contaminant concentrations in Arctic freshwater biota have been
reported. Some studies indicate that concentrations of POPs in biota from arctic freshwater systems
may be rising through time, while others seem to indicate the opposite. Carrie et al. (2010) found that
concentrations of PCBs and mercury in burbot of the Mackenzie River have increased in the last 25
years, despite declining or stable atmospheric concentrations. This change correlates with warming
temperatures and reduced ice cover in the area. This also correlates with increased permafrost thaw in
the Mackenzie Valley and along the Mackenzie River (Aylsworth and Duk-Rodkin 1997). Conversely,
lower concentrations of POPs have been observed in Yukon Lakes between the period of 1992 to 2003
and 1992 and 2010 (Ryan et al. 2005; Ryan et al. 2013). These changes were mainly attributed to
changes in biotic factors (decreased lipid content and increased body mass) over the study period, and
possibly to the increase of lake plankton productivity. This study will shed light on how thawing
permafrost impacts contaminant loads in biota in Arctic lakes.
12
References
Ahrens MA, Peters RH (1991) Patterns and Limitations in Limnop ankton Size Spectra. Can J Fish Aquat Sci 48:1967–1978.
Allen-Gil SM, Gubala CP, Wilson R, et al. (1997) Organochlorine Pesticides and Polychlorinated Biphenyls ( PCBs ) in Sediments and Biota from Four US Arctic Lakes. Arch Environ Contam Toxicol 33:378–387.
AMAP 2009 (2009) Arctic Pollution 2009. Arct Monit Assess Program 83.
Arctic Monitoring and Assessment Report (AMAP) (2011) Snow, Water, Ice and Permafrost in the Arctic (SWIPA): Climate Change and the Cryosphere. Oslo
Arnot JA, Gobas FAPC (2004) A Food Web Bioaccumulation Model for Organic Chemicals in Aquatic Ecosystems. Environ Toxicol Chem 23:2343–2355.
Aylsworth JM, Duk-Rodkin A (1997) Landslides and Permafrost in the Mackenzie Valley. In: Cohen SJ (ed) Final Rep. Mackenzie Basin Impact Study. pp 117–121
Benke AC, Huryn AD, Smock LA, Wallace JB (1999) Length-Mass Relationships for Freshwater Macroinvertebrates in North America with Particular Reference to the Southeastern United States for freshwater in North macroinvertebrates relationships America with particular reference to the southeastern United. Society 18:
Berglund O, Larsson P, Ewald G, Okla L (2001) The effect of Lake Trophy on Lipid Content and PCB concentrations in Planktonic Food Webs. Ecology 82:1078–1088.
Black MC, McCarthy JF (1988) Dissolved Organic Macromolecules Reduce the Uptake of Hydrophobic Organic Contaminants by the Gills of Rainbow Trout. Environ Toxicol Chem 7:593–600.
Blom G, Duin EHS Van, Aalderink RH, et al. (1992) Modelling sediment transport in shallow lakes - interactions between sediment transport and sediment composition. 153–166.
Boudreau PR, Dickie LM (1989) Biological model of Fisheries production based on physiological and ecological scalings of body size. Can. J. Fish. Aquat. Sci. 44:
Boudreau PR, Dickie LM, Kerr SR (1991) Body-size spectra of production and biomass as system-level indicators of ecological dynamics. J Theor Biol 152:329–339. doi: 10.1016/S0022-5193(05)80198-5
Bourassa N, Morin A (1995) Relationships between Size Structure of Invertebrate Assemblages and Trophy and Substrate Composition in Streams. J North Am Benthol Soc 14:393–403.
Brown KM, Lydeard C (2010) Mollusca : Gastropoda. In: Thorp JH, Covich AP (Editor) (eds) Ecol. Classif. North Am. Freshw. Invertebr., Third Edit. Elsevier Ltd, pp 277–306
13
Brunson EL, Canfield TJ, Dwyer FJ, et al. (1998) Assessing the Bioaccumulation of Contaminants from Sediments of the Upper Mississippi River Using Field-Collected Oligochaetes and Laboratory-Exposed Lumbriculus variegatus. 201:191–201.
Burn CR, Kokelj S V (2009) The Environment and Permafrost of the Mackenzie Delta Area. Permafr Periglac Process 105:83–105. doi: 10.1002/ppp
Burn CR, Lewkowicz AG (1990) Retrogressive Thaw Slumps. Can Geogr G 34:273–276. doi: 10.1111/j.1541-0064.2000.tb00712.x
Carrie J, Wang F, Sanei H, et al. (2010) Increasing contaminant burdens in an arctic fish, Burbot ( Lota lota ), in a warming climate. Environ Sci Technol 44:316–22. doi: 10.1021/es902582y
Charles F, Lopez-Legentil S, Grémare A, et al. (2005) Does sediment resuspension by storms affect the fate of polychlorobiphenyls (PCBs) in the benthic food chain? Interactions between changes in POM characteristics, adsorption and absorption by the mussel Mytilus galloprovincialis. Cont Shelf Res 25:2533–2553. doi: 10.1016/j.csr.2005.08.004
Deison R, Smol JP, Kokelj S V, et al. (2012) Spatial and temporal assessment of mercury and organic matter in thermokarst affected lakes of the Mackenzie Delta uplands, NT, Canada. Environ Sci Technol 46:8748–55. doi: 10.1021/es300798w
Evans MS, Muir D, Lockhart WL, et al. (2005) Persistent organic pollutants and metals in the freshwater biota of the Canadian Subarctic and Arctic: an overview. Sci Total Environ 351-352:94–147. doi: 10.1016/j.scitotenv.2005.01.052
Evans RD (1994) Empirical evidence of the importance of sediment resuspension in lakes. Hydrobiologia 284:5–12. doi: 10.1007/BF00005727
Gamble AE, Lloyd R, Aiken J, et al. (2006) Using zooplankton biomass size spectra to assess ecological change in a well-studied freshwater lake ecosystem : Oneida Lake , New York. Can J Fish Aquat Sci 63:2687–2699. doi: 10.1139/F06-153
Gewurtz SB, Lazar R, Haffner GD (2000) Comparison of polyclic aromatic hydrocarbon and polychlorinated biphenyl dynamics in benthic invertebrates of Lake Erie, USA. Environ Toxicol Chem 19:2943–2950.
Gilinsky E (1984) The Role of Fish Predation and Spatial Heterogeneity in Determining Benthic Community Structure Author ( s ): Ellen Gilinsky Reviewed work ( s ): Published by : Ecological Society of America Stable URL : http://www.jstor.org/stable/1941408 . THE ROLE OF F. Ecology 65:455–468.
Gobas FAPC, McCorquodale JR, Haffner GD (1993) Intestinal Absorption and Biomagnification of Organochlorines. Environ Toxicol Chem 12:567–576.
14
Haitzer M (1999) Relationship between concentration of dissolved organic matter (DOM) and the effect of DOM on the bioconcentration of benzo[a]pyrene. Aquat Toxicol 45:147–158. doi: 10.1016/S0166-445X(98)00097-6
Haitzer M, Höss S, Traunspurger W, Steinberg C (1998) Effects of Dissolved Organic Matter (DOM) on the Bioconcentration of Organic Chemicals in Aquatic Organisms - A Review. Chemosphere 37:1335–1362.
Hanson JM (1990) Macroinvertebrate size-distributions of two contrasting freshwater macrophyte communities. Freshw Biol 481–491.
Harner T, Bidleman T, Jantunen L, et al. (2003) Northern Contaminants Program Canadian: Arctic Contaminants Assessment Report II - Sources, Occurence, Trends and Pathways in the Physical environment. Indan and Northern Affairs Canada
Holmqvist N, Stenroth P, Berglund O, et al. (2005) Lake trophic status and bioaccumulation of polychlorinated biphenyls in benthic organisms : a comparison between littoral and profundal invertebrates. Can J Fish Aquat Sci 62:1201–1209. doi: 10.1139/F05-018
Hung H, Blanchard P, Halsall CJ, et al. (2005) Temporal and spatial variabilities of atmospheric polychlorinated biphenyls (PCBs), organochlorine (OC) pesticides and polycyclic aromatic hydrocarbons (PAHs) in the Canadian Arctic: results from a decade of monitoring. Sci Total Environ 342:119–44. doi: 10.1016/j.scitotenv.2004.12.058
Hung H, Kallenborn R, Breivik K, et al. (2009) Atmospheric monitoring of organic pollutants in the Arctic under the Arctic Monitoring and Assessment Programme (AMAP): 1993-2006. Sci Total Environ 408:2854–73. doi: 10.1016/j.scitotenv.2009.10.044
Jorgenson JK (1992) Response of Amphipoda and Trichoptera to Lake Fertilization in the Canadian Arctic. Can J Fish Aquat Sci 49:2354–2362. doi: 10.1139/f92-259
Kelly BC, Gobas FAPC, Machlan MS (2004) INTESTINAL ABSORPTION AND BIOMAGNIFICATION OF ORGANIC CONTAMINANTS IN FISH , WILDLIFE , AND HUMANS. Environ Toxicol Chem 23:2324–2336.
Kelly DW, Dick JTA, Montgomery WI (2002) The functional role of Gammarus ( Crustacea , Amphipoda ): shredders , predators , or both ? Hydrobiologia 485:199–203.
Kemp ALW, Anderson TW, Thomas RL, Mudrochova A (1974) Sedimentation rates and recent sediment history of lakes Ontario, Erie and Huron. J Sediment Petrol 44:207–218.
Kerr SR, Dickie LM (2001) The Biomass Spectrum: A Predator-prey Theory of Aquatic Production. Kerr, Stephen R., and Lloyd Merlin Dickie. The biomass spectrum: a predator-prey theory of aquatic production. Columbia University Press, 2001.
15
Kidd K a, Schindler DW, Hesslein RH, Muir DC (1998a) Effects of trophic position and lipid on organochlorine concentrations in fishes from subarctic lakes in Yukon Territory. Can J Fish Aquat Sci 55:869–881. doi: 10.1139/f97-307
Kidd K, Hesslein RH, Ross BJ, et al. (1998b) Bioaccumulation of organochlorines through a remote freshwater food web in the Canadian Arctic. Environ Pollut 102:91–103. doi: 10.1016/S0269-7491(98)00068-2
Kidd KA, Paterson MJ, Hesslein RH, et al. (1999) Effects of northern pike (Esox lucius) additions on pollutant accumulation and food web structure, as determined by δ13 C and δ15 N , in a eutrophic and an oligotrophic lake. Can J Fish Aquat Sci 56:2193–2202. doi: 10.1139/cjfas-56-11-2193
Kokelj S V, Burn CR (2003) Ground Ice and Soluble Cations in Near-Surface Permafrost, Inuvik, Northwest Territories, Canada. Permafr Periglac Process 14:275–289. doi: 10.1002/ppp.458
Kokelj S V, Burn CR (2005) Geochemistry of the active layer and near-surface permafrost , Mackenzie delta region , Northwest Territories , Canada 1. Earth 48:37–48. doi: 10.1139/E04-089
Kokelj S V, Lantz TC, Kanigan J, et al. (2009a) Origin and Polycyclic Behaviour of Tundra Thaw Slumps , Mackenzie Delta Region , Northwest Territories , Canada. Permafr Periglac Process 184:173–184. doi: 10.1002/ppp
Kokelj S V, Smith CAS, Burn CR (2002) Physical and Chemical Characteristics of the Active Layer and Permafrost , Herschel Island , Western Arctic Coast , Canada. Permafr Periglac Process 185:171–185. doi: 10.1002/ppp.417
Kokelj S V, Zajdlik B, Thompson MS (2009b) The Impacts of Thawing Permafrost on the Chemistry of Lakes across the Subarctic Boreal-Tundra Transition , Mackenzie Delta Region ,. Permafr Periglac Process 199:185–199. doi: 10.1002/ppp
Kokelj S V., Jenkins RE, Milburn D, et al. (2005) The influence of thermokarst disturbance on the water quality of small upland lakes, Mackenzie Delta region, Northwest Territories, Canada. Permafr Periglac Process 16:343–353. doi: 10.1002/ppp.536
Kukkonen J (1991) Bioavailability of Organic Pollutants in Boreal Waters With Varying Levels of Dissolved Organic Material. Water Res 25:455–463.
Kukkonen JVK, Landrum PF, Mitra S, et al. (2004) The role of desorption for describing the bioavailability of select polycyclic aromatic hydrocarbon and polychlorinated biphenyl congeners for seven laboratory-spiked sediments. Environ Toxicol Chem 23:1842–51.
Lantz TC, Kokelj S V. (2008) Increasing rates of retrogressive thaw slump activity in the Mackenzie Delta region, N.W.T., Canada. Geophys Res Lett 35:1–5. doi: 10.1029/2007GL032433
Larsson P, Collvin L, Okla L, Meyers G (1992) Lake Productivity and Water Chemistry as Governors of the Uptake of Persistent Pollutants in Fish. Environ Sci Technol 26:346–352.
16
Lemke P, Ren J, Alley RB, et al. (2007) Observations: Changes in Snow, Ice and Frozen Ground. Clim. Chang. 2007 Phys. Sci. Basis. Contrib. Work. Gr. 1 to Fourth Assess. Rep. Intergov. Panel Clim. Chang.
Loconto PR (2006) Trace Environmental Qualitative Analysis: principles, techniques and application, 2nd editio. 44.
M.O.E. (Ontario Ministry of the Environment) (1999) Lake Ontario Nearshore Sediment Quality Monitoring. Surf. Water Monit. Assess. 1997 Lake Ontario Rep. Featur. a Summ. Tribut. Nearshore Cond. Trends Lake Ontario Basin. Ontario Ministry of the Environment, pp 36–43
Macdonald RW, Barrie L a, Bidleman TF, et al. (2000) Contaminants in the Canadian Arctic: 5 years of progress in understanding sources, occurrence and pathways. Sci Total Environ 254:93–234.
Mackay D (1982) Correlation of bioconcentration factors. Environ Sci Technol 16:274–8. doi: 10.1021/es00099a008
Mackay D, Shiu WY, Ma K, Lee SC (2006) HANDBOOK OF Physical-Chemical Properties and Environmental Fate for Organic Chemicals: Second Edition, Volume II.
Mackay JR (1971) The Origin of Massive Icy Beds in Permafrost, Western Arctic Coast, Canada. Can J Earth Sci 8:397–422.
Mackay JR (1979) Pingos of the Tuktoyaktuk Peninsula Area, Northwest Territories. Géographie Phys Quat 33:3–61. doi: 10.7202/1000322ar
Macneil C, Dick JT a., Elwood RW (1997) The Trophic Ecology of Freshwater Gammarus Spp. (Crustacea: Amphipoda): Problems and Perspectives Concerning the Functional Feeding Group Concept. Biol Rev Camb Philos Soc 72:349–364. doi: 10.1017/S0006323196005038
Madsen JD, Chambers PA, James WF, et al. (2001) The interaction between water movement , sediment dynamics and submersed macrophytes. 71–84.
McCafferty WP (Editor), Covich AP (Editor) (1981) Aquatic Entomology - The Fishermen’s and Ecologists' Illustrated Guide to Insects and Their Relatives. 448.
Mesquita PS (2008) Effects of Retrogressive Permafrost Thaw Slumping on Benthic Macrophyte and Invertebrate Communities of Upland Tundra Lakes. University of Victoria
Mesquita PS, Wrona FJ, Prowse TD (2010) Effects of retrogressive permafrost thaw slumping on sediment chemistry and submerged macrophytes in Arctic tundra lakes. Freshw Biol 2347–2358. doi: 10.1111/j.1365-2427.2010.02450.x
Morin A, Stephenson J, Strike J, Solimini AG (2004) Sieve retention probabilities of stream benthic invertebrates. J North Am Benthol Soc 23:383–391.

17
Morrison H a., Gobas F a. PC, Lazar R, Haffner GD (1996) Development and Verification of a Bioaccumulation Model for Organic Contaminants in Benthic Invertebrates. Environ Sci Technol 30:3377–3384. doi: 10.1021/es960280b
Newman MC, Unger MA (2003) Fundamentals of ecotoxicology, Second Edi. 458.
Petchey OL, Belgrano A (2010) Body-size distributions and size-spectra: universal indicators of ecological status? Biol Lett 6:434–7. doi: 10.1098/rsbl.2010.0240
R Core Team (2013) R: A language and environment for statistical computing. doi: ISBN 3-900051-07-0
Rasmussen JB (1993) Patterns in the Size Structure of Littoral Macroinvertebrate Communities. Can. J. Fish. Aquat. Sci. 50:
Richardson ES, Reist JD, Minns CK (2001) Life History Characteristics of Freshwater Fishes Occurring in the Northwest Territories and Nunavut , With Major Emphasis on Lake Habitat Requirements. Can Manuscr Rep Fish Aquat Sci 2569 2569:146.
Roessink I, Moermond CT a, Gillissen F, Koelmans A a (2010) Impacts of manipulated regime shifts in shallow lake model ecosystems on the fate of hydrophobic organic compounds. Water Res 44:6153–63. doi: 10.1016/j.watres.2010.07.013
Ryan MJ, Stern G a, Diamond M, et al. (2005) Temporal trends of organochlorine contaminants in burbot and lake trout from three selected Yukon lakes. Sci Total Environ 351-352:501–522. doi: 10.1016/j.scitotenv.2004.08.022
Ryan MJ, Stern G a, Kidd K a, et al. (2013) Biotic interactions in temporal trends (1992-2010) of organochlorine contaminants in the aquatic food web of Lake Laberge, Yukon Territory. Sci Total Environ 443:80–92. doi: 10.1016/j.scitotenv.2012.10.055
Sheldon RW, Prakash A, Sutcliffe WH (1972) The Size Distribution of Particles in the Ocean. Limnol Oceanogr 17:327–340.
Sheldon RW, Sutcliffe WH, Prakash. A (1973) The Production of Particles in the Surface Waters of the Ocean with Particular Reference to the Sargasso Sea. Limnol Oceanogr 18:719–733.
Sijm DTHM, Selnen W, Opperhuizen A (1992) Life-Cycle Biomagnification Study in Fish. Environ Sci Technol 26:2162–2174.
Smith AJ, Delorme LD (2010) Ostracoda. Ecol. Classif. North Am. Freshw. Invertebr. Elsevier Inc., San Diego, California, pp 725–771
Smith IM, Cook DR, Smith BP (2010) Water Mites ( Hydrachnidiae ) and Other Arachnids. In: Thorp JH, Covich AP (Editor) (eds) Ecol. Classif. North Am. Freshw. Invertebr., Third Edit. Elsevier Ltd, pp 485–586
Sokal RR, Rohlf FJ (1995) Biometry, 3rd Edit. 850.
18
Sprules WG, Munawar M (1986) Plankton Size Spectra in Relation to Ecosystem Productivity , Size , and Perturbation. Can J Fish Aquat Sci 43:1789–1794.
Taylor P, Zhang T, Barry RG, et al. (1999) Statistics and characteristics of permafrost and ground ‐ ice distribution in the Northern Hemisphere. 37–41.
Taylor W, Carey J, Lean D, McQueen D (1991) Organochlorine Concentrations in the Plankton of Lakes in Southern Ontario and Their Relationship to Plankton Biomass. Can J Fish Aquat Sci 48:1960–1966.
Thompson MS, Kokelj S V., Prowse TD, Wrona FJ (2008) The Impact of Sediments Derived from Thawing Permafrost on Tundra Lake Water Chemistry: An Experimental Approach. In: D.L. Kane, K.M. Hinkel (eds) Proc. Ninth Int. Conf. Permafr. Institute of Northern Engineering, University of Alaska Fairbanks, Alaska., Fairbanks, Alaska, pp 1763–1767
Thompson MS, Wrona FJ, Prowse TD (2010) The effect of shoreline retrogressive thaw slumping on chlorophyll a, nutrient and light relationships in small tundra lakes. Abstr. H43H-04, Present. 2010 Fall Meet. 13-17 Dec.
Thorp JH, Covich AP (2010) Ecology and Classification of North American Freshwater Invertebrates, Third Edit. Academic Press
Tracey G, Hansen D (1996) Use of Biota-Sediment Accumulation Factors to Assess Similarity of Nonionic Organic Chemical Exposure to Benthically-Coupled Organisms of Differing Trophic Mode. Arch Environ Contam Toxicol 30:467–75.
Viganò L, Farkas A, Guzzella L, et al. (2007) The accumulation levels of PAHs, PCBs and DDTs are related in an inverse way to the size of a benthic amphipod (Echinogammarus stammeri Karaman) in the River Po. Sci Total Environ 373:131–45. doi: 10.1016/j.scitotenv.2006.11.006
Wania F, Mackay D (1996) Tracking the Distribution of Persistent Organic Pollutants. Environ Sci Technol 30:390–396.
Wetzel RG (2001) Limnology - Lake and River Ecosystems, Third. Limnol - Lake River Ecosyst 1006.
Yvon-Durocher G, Montoya JM, Trimmer M, Woodward G (2011) Warming alters the size spectrum and shifts the distribution of biomass in freshwater ecosystems. Glob Chang Biol 17:1681–1694. doi: 10.1111/j.1365-2486.2010.02321.x
(2008) Image-Pro ® Plus (Version 6.3 for windows).
19
Chapter 1- Impact of Permafrost Thaw Slumps on Benthic
Macroinvertebrate Assemblages and on the Biomass Size Spectrum of
Small Lakes of the Mackenzie Delta Uplands
20
Abstract
Permafrost slumping along lakeshores has been shown to alter water chemistry significantly, but its
impact on benthic communities has not been determined. Here, benthic invertebrates were sampled in
lakes of the Mackenzie Delta Uplands, NT, that were affected to varying degrees by permafrost thaw
slumps. Ostracoda, Diptera and Arachnida (mites) were the dominant taxa in undisturbed lakes. In
contrast, disturbed lakes were dominated by Bivalvia, Ostracoda and Nematoda. In general, larger taxa
had higher densities in disturbed lakes (Mollusca, Nematoda and Trichoptera) whereas smaller taxa
(Ostracoda and Arachnida) had higher densities in undisturbed lakes. Variability in size spectra was
most significantly related to variation in total dissolved nitrogen (TDN) concentration and permafrost
thaw slump size. Overall abundance per size class increased with increased TDN and decreased with
increased disturbance size, however responses to TDN were largest for the smallest invertebrates
whereas the larger invertebrates seemed to benefit from increased thaw slump size. The positive effect
of disturbance is possibly due to the increased macrophyte biomass in lakes with slumps, which
increases the habitat for certain large invertebrate taxa. This study indicates that thawing permafrost is
altering not only composition, but also the size-structure of benthic invertebrate communities in small
lakes.
21
Introduction
The uplands east of the Mackenzie Delta, NT, are covered in ice-rich permafrost that is several
hundred meters thick (Mackay 1971) and is interspersed with thousands of small lakes (Burn and Kokelj
2009). Almost one in ten lakes greater than 1ha in area are directly impacted by retrogressive thaw
slumps, one of the most dramatic forms of thawing permafrost (Kokelj et al. 2009b). These thaw slumps
are common formations in permafrost terrain, and are initiated by the exposure of ice-rich permafrost
following a disturbance or erosion of the active layer (Burn and Lewkowicz 1990). Permafrost slumps
can persist and expand for many years , and may be re-initiated by talik (unfrozen ground) expansion
beneath the lake, causing lake-bottom subsidence and rejuvenation of shoreline slumps (Lantz and
Kokelj 2008; Kokelj et al. 2009b). Thawing of ice-rich sediment creates a mud-slurry which, if formed on
the banks of rivers or lakes, can flow into open waters. Due to climate warming, permafrost thaw slump
activity in the Mackenzie Delta uplands has been increasing since the 1950s and is expected to continue
increasing as temperatures warm (Lantz and Kokelj 2008). The clays of the Mackenzie Delta uplands are
ion-rich, and can have significant impacts on water chemistry. Changes to water chemistry include
decreased dissolved organic carbon (DOC) and water colour in lakes, and increased concentration of
certain major ions (Ca, Mg, Na, K, SO42-, CO3
2-, and HCO3-) (Kokelj et al. 2005). The increased water
clarity associated with slumping, along with increased nutrients in the sediments of lakes with slumps
(calcium, magnesium and strontium) are also linked to increased macrophyte biomass and the
development of a more complex benthic habitat (Mesquita et al. 2010). Slumps are also linked to
decreases in the concentrations of chlorophyll-a, total dissolved nitrogen (TDN) and total phosphorus
(TP) in the water column. These parameters are sometimes used as indicators of lake productivity, and
changes to them may affect higher trophic levels within the lake systems.
Benthic macroinvertebrates are important contributors to secondary production in lake
ecosystems. The biomass size spectrum, describing the distribution of living biomass across the range of
organism sizes, is a useful indicator of ecosystem structure and describes how energy and nutrients are
partitioned in an ecosystem. Because spectra are independent of taxonomic composition, they facilitate
the comparison of ecosystem structure among assemblages formed by different species or in different
habitat types. They can be used to describe, compare, and make predictions about biological
communities, and are therefore a complementary technique to taxonomic description of communities.
22
Biomass size distributions have been shown to vary with environmental factors and with perturbations
to the ecosystem (Sprules and Munawar 1986; Hanson 1990; Rasmussen 1993; Bourassa and Morin
1995). They have also been used to assess human impacts on systems, for example the impact of
fisheries, agricultural practices, or warming temperatures (Boudreau and Dickie 1989; Gamble et al.
2006; Yvon-Durocher et al. 2011).
In the uplands east of the Mackenzie Delta, where dissolved ions, nutrients, and organic carbon
concentrations in lakes are dramatically altered following permafrost thaw slump formation, it is likely
that macroinvertebrates will also respond in some way to thaw slumping. However, the response is
difficult to predict. The increased macrophyte biomass of lakes with slumps would provide greater
habitat complexity for benthos and allow a wider variety of species, greater densities and greater
biomass. Alternatively, decreased chlorophyll-a, dissolved nutrients, and DOC, as found in slump
affected lakes, may coincide with lower inverterbrate biomass and density (Jorgenson 1992). If
invertebrates are resource-limited, it is expected that benthic invertebrate biomass and density will be
lower in slump affected lakes, due to their lower chlorophyll-a concentrations. On the other hand, if
invertebrate abundance is limited by habitat complexity in these systems, the negative impact of
reduced pelagic nutrients on abundance of invertebrates could be compensated by the increased
habitat complexity related to higher macrophyte biomass in slumped lakes.
Study Site
Sixteen small lakes were sampled in the tundra uplands to the east of the Mackenzie Delta
between June and July 2010 (figure 1). The density of lakes in the uplands area is very high (Kokelj et al.
2009b), many of which have taliks beneath them (Burn and Kokelj 2009). The permafrost in this area
contains large amounts of ground ice that, if exposed, is susceptible to thaw. The ice and surrounding
sediments are ion-rich, due to entrapment of soluble materials by a rising permafrost table, and
downward migration of ions along thermally-induced suction gradients (Kokelj and Burn 2005). Thawing
of this iron-rich permafrost and ground ice due to the formation of permafrost thaw slumps along the
23
banks of lakes has been shown to significantly alter water chemistry (Kokelj et al. 2005). Lakes with
slumps have increased concentrations of major ions (Ca, Mg, Na, K, SO42-, CO3
2-, and HCO3-) and
increased specific conductivity (Kokelj et al. 2005). The ion-rich clays are also linked to the flocculation
of organic material in the water and its precipitation to the sediments, which in turn leads to lower
dissolved organic carbon (DOC) and water colour (Thompson et al. 2008). Permafrost thaw slumps are
also linked to decreases of planktonic chlorophyll-a concentrations, total dissolved nitrogen (TDN) and
total phosphorus (TP) in the water column. Changes to the macrophyte communities have also been
observed (Mesquita et al. 2010), with higher macrophyte abundances being found in lakes affected by
slumping. This was linked to increased nutrients in sediments of slump lakes and increased water
clarity.
All lakes selected for this study were taken from a list of lakes studied in the area, provided by
Dr. Steven Kokelj (Aboriginal and Northern Affairs Canada, Yellowknife, NT). In order to quantify the
effect of the permafrost thaw slumping on the lake, the % of the catchment that is thawed was
calculated using the area of the permafrost thaw slump and the area of the catchment (Kokelj et al.
2005). This proportion has been shown to correlate with changes to water chemistry that are
associated with permafrost thawing, such as dissolved organic carbon and specific conductivity (Kokelj
et al. 2005).
The percentage of the lake’s total lake catchment area occupied by retrogressive thaw slump
ranged between 0-34% (Table 1). Five reference lakes that had no thaw slumps in their catchments were
also included. To minimize the effect of latitude, distances between lakes were kept to a minimum: all
lakes were within 70km of each other.
Materials and Methods
All 17 lakes were accessed by helicopter between June 12th 2010 and July 6th 2010. Water was
sampled twice during this period, once at the beginning and once at the end. Benthic invertebrates
were sampled with an Ekman dredge once between these dates. Three Ekman samples were taken in
24
the littoral zone of each lake, at similar depths (between 50 cm and 90 cm) and in similar soft substrate
types – macrophytes were avoided (due to problems with the Ekman dredge jaws closing around
macrophytes), as were very sandy or gravelly substrate. Samples were stored in sealed plastic
containers until the return to the laboratory, at which point they were sieved to 500 μm and stored in
95% ethanol. Samples were split using a Folsom splitter in order to achieve a more manageable sample
size, and identified, generally to Family, using keys from McCafferty (1981) and Thorp & Covich (2010).
One Ekman dredge was also taken at each lake to obtain a surficial sediment sample for isotopic analysis
(analysed for %C and %N by the G.G. Hatch Isotope Lab, University of Ottawa).
All identified invertebrates were measured in order to estimate biomass. Digital images were
captured with a scanner at 600DPI, and each individuals’ total length was measured using Image-Pro
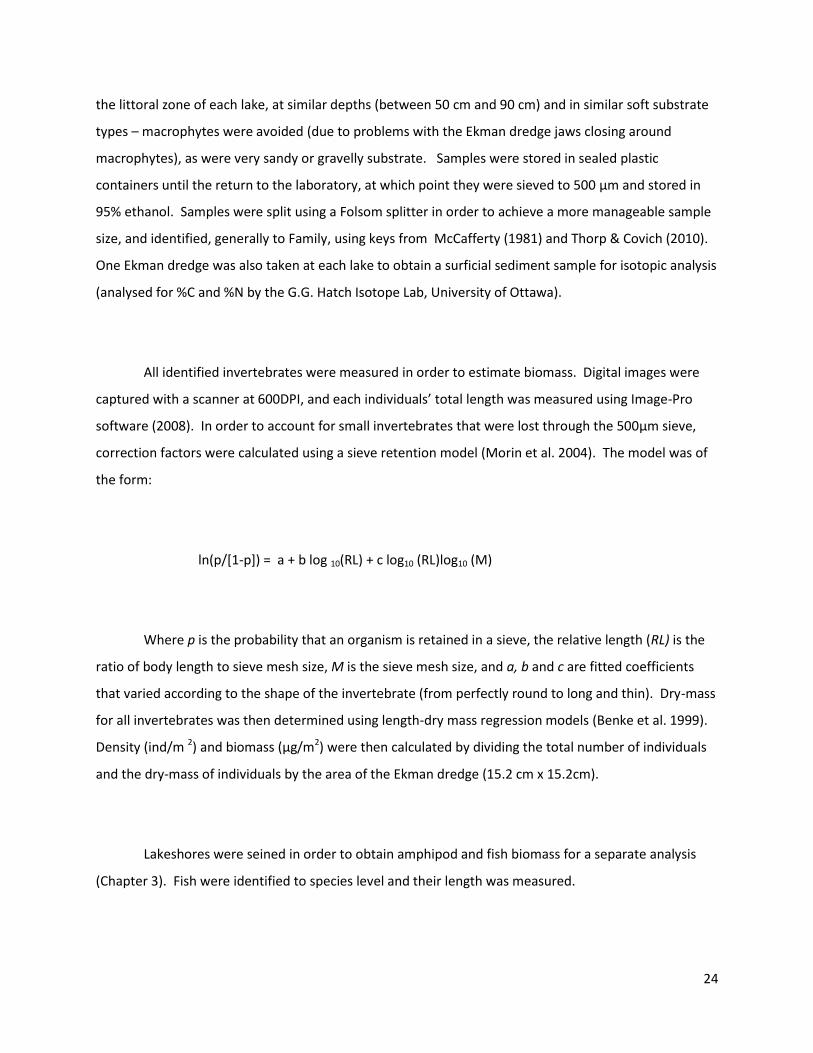
software (2008). In order to account for small invertebrates that were lost through the 500μm sieve,
correction factors were calculated using a sieve retention model (Morin et al. 2004). The model was of
the form:
ln(p/[1-p]) = a + b log 10(RL) + c log10 (RL)log10 (M)
Where p is the probability that an organism is retained in a sieve, the relative length (RL) is the
ratio of body length to sieve mesh size, M is the sieve mesh size, and a, b and c are fitted coefficients
that varied according to the shape of the invertebrate (from perfectly round to long and thin). Dry-mass
for all invertebrates was then determined using length-dry mass regression models (Benke et al. 1999).
Density (ind/m 2) and biomass (µg/m2) were then calculated by dividing the total number of individuals
and the dry-mass of individuals by the area of the Ekman dredge (15.2 cm x 15.2cm).
Lakeshores were seined in order to obtain amphipod and fish biomass for a separate analysis
(Chapter 3). Fish were identified to species level and their length was measured.
25
Water samples were sent to the National Centre for Environmental Testing (NLET, Burlington,
ON) for nutrient analysis and to the Taiga Environmental Laboratory (Yellowknife, NT) for analysis of
ions. Average values of the two sample periods were used for statistical analyses.
Statistical Analysis
Linear regressions of nutrients (chlorophyll-a, total dissolved nitrogen and total phosphorus)
were first constructed as a function of % Catchment Disturbed to establish that the trends observed in
previous studies on nearby lakes were consistent with trends in this selection of lakes (see Figure 3). A
principal component analysis was then run on a correlation matrix of environmental variables to
determine if other strong trends existed between environmental variables and different matrices of
catchment disturbance. The first two principal components are plotted in Figure 4. A second PCA was
run on a correlation matrix of environmental variables and invertebrate biomass per taxon. Taxa that
accounted for over 95% of biomass were included in the ordination to remove noise caused by rare taxa.
Size spectra were constructed for each lake. Organisms were grouped into log2 size classes
based on dry-mass (μg), and plotted as log10 density (ind/m2) against the upper limit of log10 mass (μg)
for each size class following previously established methods (Ahrens and Peters 1991). A polynomial
regression model was fitted to the constructed size spectra to best represent the shape and variability of
the data. Several water chemistry parameters and slumping parameters were included in the initial
model (including specific conductivity, chlorophyll-a, % catchment disturbed, disturbance size,
catchment area, lake area, % O2, TDN and TP). Stepwise regression analysis was then used to select the
terms that best described the variation in density per size class.
All statistical analyses were done using R 2.15.2 (R Core Team 2013). Data were log-
transformed prior to analysis to meet the assumptions of parametric analyses.
26
Results
The taxa collected from the litoral zone with the Ekman dredge were Ostracoda (Order
Podocopida, Families Candonidae, Ilyocyprididae, Limnocytheridae, Cytherididae, Cyprididae),
Arachnida (Suborder Hydracarina, Halacaridae, Oribatei), Bivalvia (Family Sphaeriidae), Copepoda (Order
Cyclopoida), Gastropoda (families Valvatidae and Lymnaeidae), Clitellata (Subclasses Oligochaeta and
Hirudinae), Nematoda, Malacostra (Order Amphipoda, Family Gammaridae (Genera Gammarus)),
Insecta (Order Trichoptera, Families Limnephilidae, Molannidae, Phryganeidae, Lepidostomatidae,
Leptoceridae and Order Diptera, Family Chironomidae), Coleoptera (Families Chrysomelidae, Haliplidae)
and the phylum Tardigrada. These taxa were similar to those found by Mesquita (2008) in nearby lakes
of the Mackenzie Delta.
To compare densities between lakes, raw data were used that had not been put through the
sieve retention model (Fig. 2). This was done in order to make values more comparable with other
studies that had not used this model. Ostracoda had the highest mean abundance when comparing
mean abundance per taxa in all lakes (44 903 ind/m2). This group was followed by Diptera (29 823
ind/m2) and Arachnida (19 820 ind/m2). In undisturbed lakes, the three most abundant taxa were also
Ostracoda(63 123 ind/m2), Diptera(42 373 ind/m2) and Arachnida (34 097 ind/m2). In disturbed lakes,
the three most abundant taxa were Bivalvia (31 235 ind/m2), Ostracoda (26 683 ind/m2) and Nematoda
(24 021 ind/m2). Dominant taxa are those presented in the PCA analysis (Fig. 4). T-tests revealed no
significant differences between the mean densities of all disturbed and undisturbed lakes for any taxa
aside from mites and diptera (which had higher densities in Undisturbed lakes). Mean abundances of
Ostracods, Copepods, Coleoptera, Hirudinae and Oligochaetes were also higher in undisturbed lakes,
but not significantly. Disturbed lakes had higher mean densities of Bivalva, Mollusca, Nematoda and
Tardigrada, though no differences were significant.
Total dissolved nitrogen, total phosphorous and chlorophyll-a in lake water decreased
significantly with increasing % catchment disturbed (see Figure 3). Total dissolved nitrogen varied from
0.69mg/L to 1.56mg/L, total phosphorus varied from 0.32 g/L to 20g/L, with one very high
27
concentration of 61g/L , and chlorophyll-a varied from 0.7µg/L to 4.55µg/L, though one lake had very
high concentrations (14.6µg/L).
Average biomass and density per lake were significantly negatively correlated with disturbance
size and positively correlated with total dissolved nitrogen (Table 2). Biomass alone was positively
correlated with TP. There were no significant correlations with % catchment disturbed or catchment
size.
Total nitrogen, total phosphorous and chlorophyll-a in lakes did not vary between lakes with and
without slumps (One-way ANOVA, p>0.05), although total dissolved nitrogen was close to significance,
with a p = 0.052. When lakes were further divided by slump activity (active slump, stable slump or no
slump), no significant differences were detected.
The percent organic Carbon and Nitrogen in the sediments were very strongly correlated
(r=0.98). Both %C and %N appeared negatively correlated with % catchment slumped, though neither
was a significant correlation (r = -0.44 , p=0.074 and r = -0.45, p=0.071 respectively). This is likely
because of the limited data set of 17 lakes.
PCAs
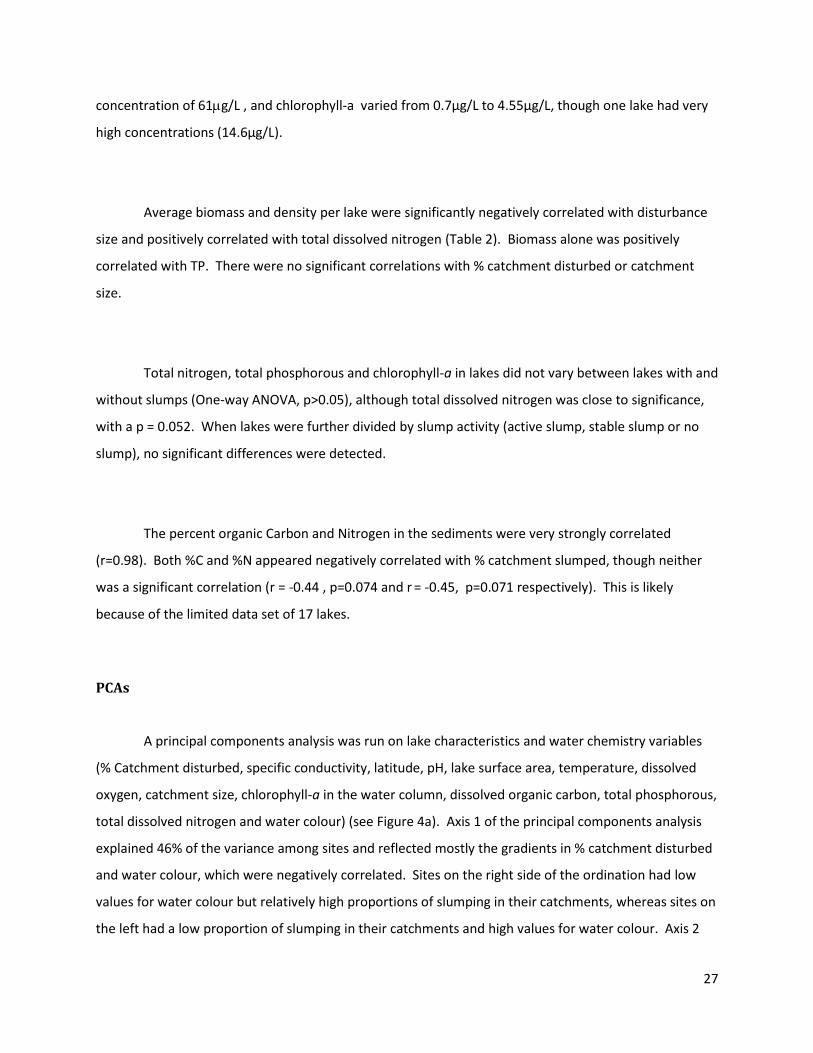
A principal components analysis was run on lake characteristics and water chemistry variables
(% Catchment disturbed, specific conductivity, latitude, pH, lake surface area, temperature, dissolved
oxygen, catchment size, chlorophyll-a in the water column, dissolved organic carbon, total phosphorous,
total dissolved nitrogen and water colour) (see Figure 4a). Axis 1 of the principal components analysis
explained 46% of the variance among sites and reflected mostly the gradients in % catchment disturbed
and water colour, which were negatively correlated. Sites on the right side of the ordination had low
values for water colour but relatively high proportions of slumping in their catchments, whereas sites on
the left had a low proportion of slumping in their catchments and high values for water colour. Axis 2
28
explained an extra 16% of the variance among sites. This axis reflected mostly the size of the catchment
and the temperature of the water. Total phosphorous, total nitrogen and chlorophyll-a contributed
slightly more to the first axis, but contributed to both axes. Lakes falling on the left of the figure are
mainly reference lakes, whereas lakes on the right have thaw slumps. Lakes on the left of the figure
tend to have higher concentrations of chlorophyll-a, total nitrogen and total phosphorous. Lakes in the
bottom of the figure tend to have larger catchments and higher chlorophyll-a in their water columns.
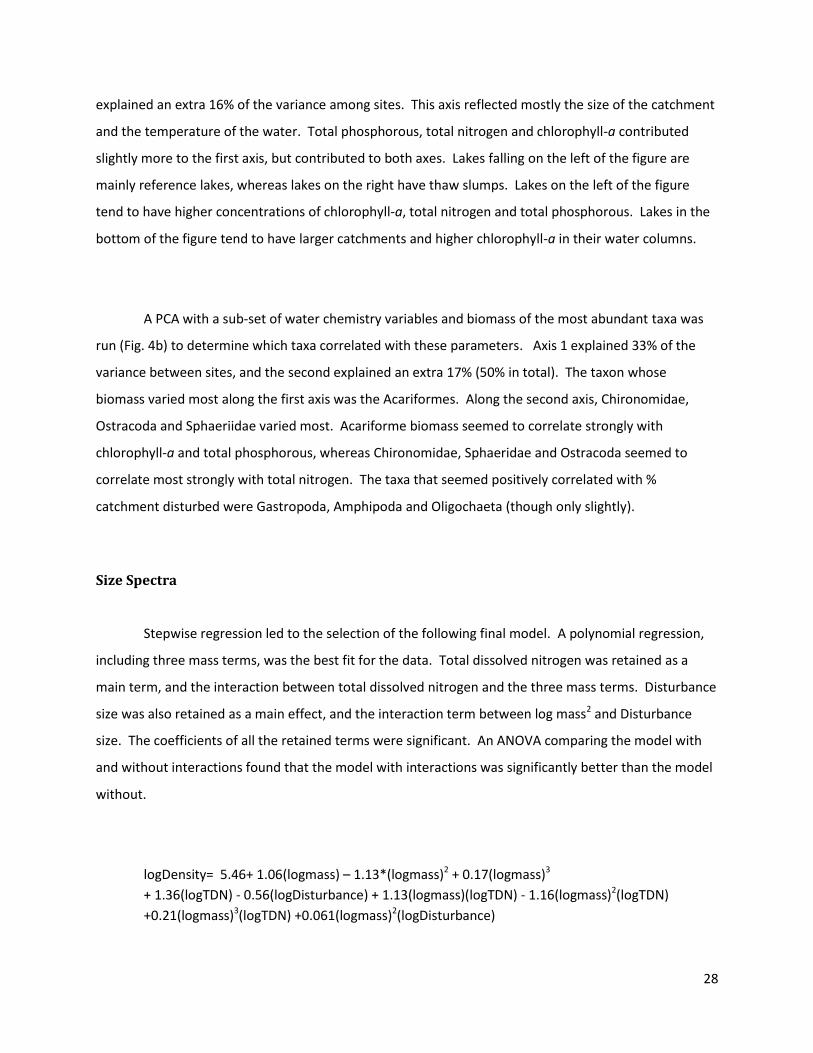
A PCA with a sub-set of water chemistry variables and biomass of the most abundant taxa was
run (Fig. 4b) to determine which taxa correlated with these parameters. Axis 1 explained 33% of the
variance between sites, and the second explained an extra 17% (50% in total). The taxon whose
biomass varied most along the first axis was the Acariformes. Along the second axis, Chironomidae,
Ostracoda and Sphaeriidae varied most. Acariforme biomass seemed to correlate strongly with
chlorophyll-a and total phosphorous, whereas Chironomidae, Sphaeridae and Ostracoda seemed to
correlate most strongly with total nitrogen. The taxa that seemed positively correlated with %
catchment disturbed were Gastropoda, Amphipoda and Oligochaeta (though only slightly).
Size Spectra
Stepwise regression led to the selection of the following final model. A polynomial regression,
including three mass terms, was the best fit for the data. Total dissolved nitrogen was retained as a
main term, and the interaction between total dissolved nitrogen and the three mass terms. Disturbance
size was also retained as a main effect, and the interaction term between log mass2 and Disturbance
size. The coefficients of all the retained terms were significant. An ANOVA comparing the model with
and without interactions found that the model with interactions was significantly better than the model
without.
logDensity= 5.46+ 1.06(logmass) – 1.13*(logmass)2 + 0.17(logmass)3
+ 1.36(logTDN) - 0.56(logDisturbance) + 1.13(logmass)(logTDN) - 1.16(logmass)2(logTDN)
+0.21(logmass)3(logTDN) +0.061(logmass)2(logDisturbance)
29
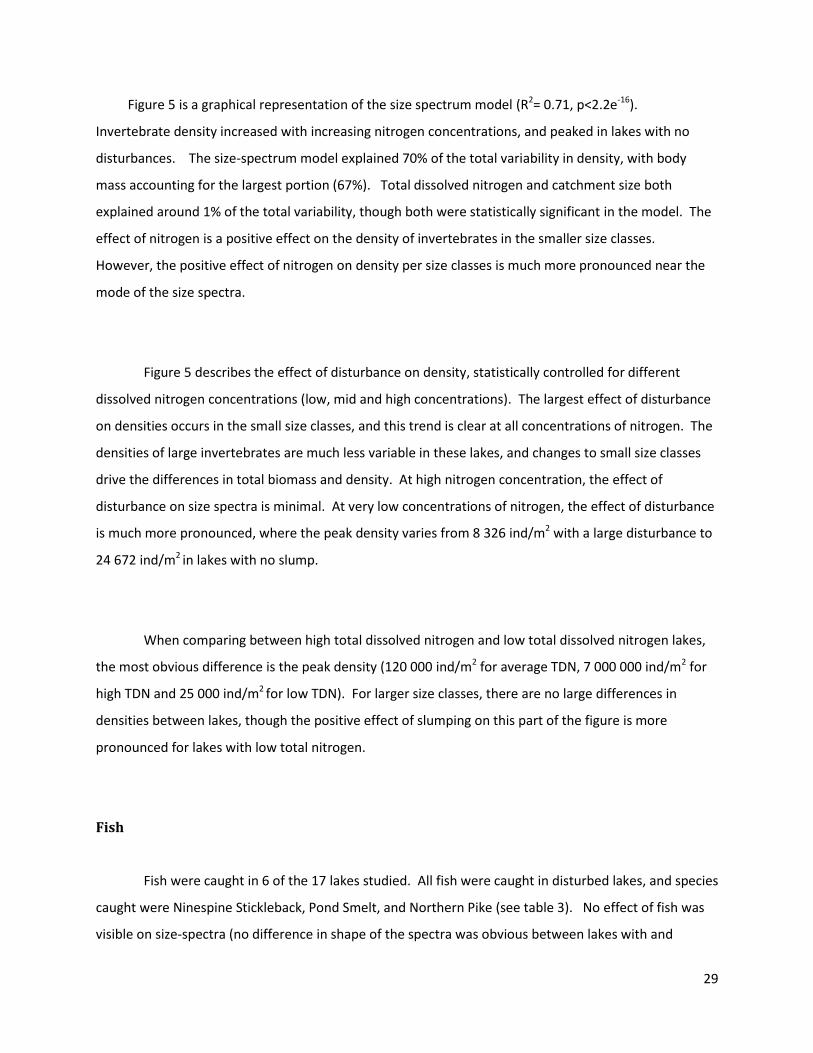
Figure 5 is a graphical representation of the size spectrum model (R2= 0.71, p<2.2e-16).
Invertebrate density increased with increasing nitrogen concentrations, and peaked in lakes with no
disturbances. The size-spectrum model explained 70% of the total variability in density, with body
mass accounting for the largest portion (67%). Total dissolved nitrogen and catchment size both
explained around 1% of the total variability, though both were statistically significant in the model. The
effect of nitrogen is a positive effect on the density of invertebrates in the smaller size classes.
However, the positive effect of nitrogen on density per size classes is much more pronounced near the
mode of the size spectra.
Figure 5 describes the effect of disturbance on density, statistically controlled for different
dissolved nitrogen concentrations (low, mid and high concentrations). The largest effect of disturbance
on densities occurs in the small size classes, and this trend is clear at all concentrations of nitrogen. The
densities of large invertebrates are much less variable in these lakes, and changes to small size classes
drive the differences in total biomass and density. At high nitrogen concentration, the effect of
disturbance on size spectra is minimal. At very low concentrations of nitrogen, the effect of disturbance
is much more pronounced, where the peak density varies from 8 326 ind/m2 with a large disturbance to
24 672 ind/m2 in lakes with no slump.
When comparing between high total dissolved nitrogen and low total dissolved nitrogen lakes,
the most obvious difference is the peak density (120 000 ind/m2 for average TDN, 7 000 000 ind/m2 for
high TDN and 25 000 ind/m2 for low TDN). For larger size classes, there are no large differences in
densities between lakes, though the positive effect of slumping on this part of the figure is more
pronounced for lakes with low total nitrogen.
Fish
Fish were caught in 6 of the 17 lakes studied. All fish were caught in disturbed lakes, and species
caught were Ninespine Stickleback, Pond Smelt, and Northern Pike (see table 3). No effect of fish was
visible on size-spectra (no difference in shape of the spectra was obvious between lakes with and
30
without fish), though no statistical analyses were conducted. Including fish in the spectra would require
an estimate of biomass, which was not measured (lakes were seined until enough biomass was reached
for a separate analysis, without taking into account the area seined or the number of passes made).
Discussion
As witnessed in previous studies (Kokelj et al. 2005), permafrost slumping on the banks of lakes
caused significant differences in water chemistry ( Fig 4b). Specific conductivity and pH correlate
positively and significantly with % catchment slumped whereas water colour and DOC correlated
negatively and significantly with % catchment slumped. Total dissolved nitrogen, total phosphorous and
chlorophyll-a were all negatively correlated with % catchment slumped. It appears that permafrost
slumping is removing these TDN and TP from the water column, potentially precipitating them to the
sediment or even removing them from surface run-off before they reach the lake by adsorption onto
exposed clays . Thompson et al. (2008) showed that the experimental addition of slump materials into
lake water likely causes the precipitation of organic matter from the water column, due to flocculation
of organic matter brought about by increased cations in lakes with slumps. Carbon and Nitrogen
content in the sediments were very strongly correlated. This might indicate that carbon and nitrogen
are precipitating simultaneously from the water column as organic matter. Phosphorus has been shown
to adsorb onto organic and inorganic particles in the water column, and onto sedimenting clays or
organic matter. Major divalent metal ions in water, such as calcium and magnesium (which are higher in
slumped lakes) tend to enhance the aggregation and sedimentation rates of these particles (Wetzel,
2001). Because slump material is composed of ion-rich clay, its addition to the water column increases
specific conductivity of the water, resulting in organic matter (carbon, nitrogen) and phosphorus
precipitation from the water column. As phosphorus and nitrogen are removed, algal productivity
decreases and chlorophyll-a in the water column drops.
The slight decreases in phosphorus and nitrogen in slump lakes, and subsequent decreases in
chlorophyll-a concentrations, are likely partially responsible for the observed decreases in invertebrate
biomass and densities in slump lakes, suggesting these small arctic lakes are nutrient limited. This
relationship is similar to how invertebrate biomass increased following experimental additions of
31
phosphorus and nitrogen to arctic lakes (Jorgenson 1992). The regression analysis also revealed that the
abundance of small animals declines with increasing slump size, independent of nitrogen. The
additional decrease of small invertebrates in slumped lakes (beyond what would be expected based on
nitrogen alone) is possibly a result of the changes to habitat brought about by shoreline slumps. The
increased macrophyte abundance may favour larger invertebrates, such as bivalves, mollusks and
amphipods.
No significant correlation between biomass or density of invertebrates and %catchment area
slumped was discernible, though both invertebrate biomass and density are negatively correlated with
disturbance size (ha). In lakes with slumps, water is clearer (Kokelj et al 2005) and others have indicated
that benthic macrophyte communities are better developed (Mesquita et al. 2010). Gilinsky (1984)
showed that when macrophytes were experimentally added to caged portions in a lake, density of
invertebrates in surrounding sediments tended to decrease as certain taxa migrated onto the new
habitat. Since this study sampled sediments only (macrophytes were avoided), the lower densities on
sediments in lakes with more macrophytes (lakes with permafrost thaw slumps, as described by
Mesquita et al. 2010) might be caused by a similar phenomenon of migration of invertebrates into
macrophytes.
Invertebrate taxa identified here were similar to those identified by Mesquita (2008) in other lakes
of the Mackenzie Delta Uplands. However, densities calculated here were an order of magnitude higher
than densities from Mesquita. This is likely caused by the differences between the sampled areas in
both studies, since only littoral sediments were sampled here as opposed to transects through the
entire lake irrespective of sediment type and depth in Mesquita (2008). The most abundant taxa were
not significantly different between disturbed and undisturbed lakes (when comparing densities with t-
tests). However, in general, the smallest taxa had higher densities in undisturbed lakes (Ostracoda,
Arachnida and Copepoda). Bivalvia and Mollusca both had higher mean densities in undisturbed lakes,
taxa often associated with macrophytes. The size-spectra revealed that size-structure of benthic
invertebrate communities was also changing in response to slumping and to nitrogen concentrations.
32
Size Spectra
Variations in density of invertebrates in each size class depended most on body mass. Density was
also significantly related to total dissolved nitrogen and disturbance size, though these factors explained
only a small portion of the variability in density in each size class compared to body mass alone. The
main effect of nitrogen was an increase in invertebrate density per size class, whereas the main effect of
permafrost slump size was a decreased density per size class across spectra. For the beginning portion
of the figure (smallest size classes), total nitrogen had a positive effect on density per size class.
Smallest invertebrates respond most to total nitrogen. The PCA analysis of biomass and water chemistry
variables shows that Acariformes (mites), Ostracoda and Chironomidae are the taxa that vary most
closely with TDN. These taxa accounted for most of the density of small and medium size classes. The
distribution of benthic ostracods at the sediment-water interface is a function of the availability of food,
the substratum surface and the particle size distribution (Smith and Delorme 2010). No particle-size
analysis was done on the sediments sampled, so a comparison of these is difficult in the context of the
present study. However, as similar habitats were targeted while sampling, I will assume that substratum
surface and particle size distribution were similar among lakes. Food availability is likely the dominant
driver of Ostracoda abundance. Ostracods are detrivores and herbivores, and require particulate
organic matter that can easily be picked up and “swept” into their mouths. Ostracods can also feed off
algae or plants, if present. Here, chlorophyll-a concentration (which is an expression of algal biomass)
was significantly related to total dissolved nitrogen, which is higher in lakes without slumps. Because
aquatic mites were not identified past Order, little can be said about their relationship with nitrogen and
chlorophyll. Different species can inhabit different habitats, and there are several functional feeding
groups including predacious, parasitic and algivorous (Smith et al. 2010). In these lakes, their density
and biomass is related to nitrogen concentrations, and a large portion of species present might
therefore be algivorous.
The negative size-nitrogen interaction on density for medium to larger size classes (2.99 µg to
696µg) is unexpected, and also corresponds to a positive influence of disturbance size in this same part
of the figure. Lakes with low nitrogen and permafrost thaw slumps would also be lakes with higher
macrophyte biomass, which would alter the benthos species composition in sediments. Certain taxa
(such as chironomids) might migrate onto macrophytes when they are present, leading to lower
33
densities in the sediments (Gilinsky 1984). The increased densities of very large invertebrates (above
1000 µg) related to the % of the catchment slumped is probably also related to increased macrophyte
biomass in slump lakes. The PCA shows amphipod and gastropod biomass are the most closely
correlated with % catchment slumped. These two taxa composed the majority of the large size classes.
Amphipods are mobile, epi-benthic invertebrates whose abundance is generally higher in macrophytes,
where refugia from predators exist. Gastropods in freshwater habitats are generally detrivores or
herbivores, which are often associated with macrophytes or cobbles where they scrape periphyton for
food (Brown and Lydeard 2010). They are also mobile and can migrate between habitats. The increased
abundance of macrophytes in lakes with disturbances, in spite of decreasing nitrogen in these lakes, is
the most likely explanation for increased density of large taxa.
Fish were found in a small sub-set of lakes (6 of the 17 lakes), and were only present in lakes with
permafrost slumps (though fish have been caught in lakes without permafrost slumps in similar nearby
lakes). No clear effect of fish presence could be seen on size spectra. This might perhaps be caused by
low fish densities in lakes. Lakes with slumps do appear to present better habitat for fish. Macrophyte
biomass is higher (Mesquita et al. 2010), which acts as refugia and shelter. Certain invertebrate taxa
that are normally found in and around macrophytes, such as amphipods and chironomids, are also prey
for many minnow-size fish. Periphyton growing on macrophytes, and the macrophytes themselves, are
also a food source for small minnow-size fish. Ninespine stickleback in particular require vegetation for
nesting, and adults are often found in association with dense vegetation (Richardson et al. 2001).
Conclusion
Benthic invertebrate density, biomass, and the size-structure of the benthic community appear
to be changing following thaw slump formation. Density and biomass tended to decrease with
disturbance size, likely due to the decreased trophy of disturbed lakes (decreased chlorophyll-a, total
dissolved nitrogen and total phosphorus). This is therefore an indirect effect of slumping on benthic
communities.
34
Size spectrum analysis suggests that nitrogen concentration in the water column and the size of
the permafrost thaw slump affect the benthic invertebrate size-structure of lakes. Densities of small
size classes are positively correlated with total dissolved nitrogen. Small invertebrate density is also
reduced in lakes with large disturbances but this reduction is less important or reversed for large
invertebrates. This differential response to slumping and nitrogen by small and large invertebrates
could be due to the increased macrophyte biomass in slump lakes. In slump lakes, density of certain
invertebrates in sediments might decrease due to migration onto macrophytes, whereas other
invertebrate species which tend to prefer macrophyte habitats such as amphipods and gastropods
would become more abundant, resulting in spill-over onto sediments from macrophytes.
This research focused only on one substrate type, though studies have shown that different
substrates can significantly alter species composition and size-structure of communities (Gilinsky 1984;
Bourassa and Morin 1995). Because macrophyte abundance is increasing in slump lakes, sampling
invertebrate communities from macrophytes would give a clearer picture of how the entire lake system
is likely to change. Obtaining data for fish would also expand the size-spectra, potentially revealing how
fish communities are affected by slump formations.
As temperatures in the Arctic continue to rise, increased permafrost thaw in the Northern
hemisphere is inevitable. This study indicates that freshwater lakes in ice rich permafrost terrain will
likely be changing in the coming years, with possible decreases in biomass and density of benthic
invertebrates, and shifts in the size-structure of benthic communities. If the entire Canadian Arctic
responds in the same manner to permafrost thaw, the potential impacts on Northern communities may
be vast.
35
References
Ahrens MA, Peters RH (1991) Patterns and Limitations in Limnop ankton Size Spectra. Can J Fish Aquat Sci 48:1967–1978.
Allen-Gil SM, Gubala CP, Wilson R, et al. (1997) Organochlorine Pesticides and Polychlorinated Biphenyls ( PCBs ) in Sediments and Biota from Four US Arctic Lakes. Arch Environ Contam Toxicol 33:378–387.
AMAP 2009 (2009) Arctic Pollution 2009. Arct Monit Assess Program 83.
Arctic Monitoring and Assessment Report (AMAP) (2011) Snow, Water, Ice and Permafrost in the Arctic (SWIPA): Climate Change and the Cryosphere. Oslo
Arnot JA, Gobas FAPC (2004) A Food Web Bioaccumulation Model for Organic Chemicals in Aquatic Ecosystems. Environ Toxicol Chem 23:2343–2355.
Aylsworth JM, Duk-Rodkin A (1997) Landslides and Permafrost in the Mackenzie Valley. In: Cohen SJ (ed) Final Rep. Mackenzie Basin Impact Study. pp 117–121
Benke AC, Huryn AD, Smock LA, Wallace JB (1999) Length-Mass Relationships for Freshwater Macroinvertebrates in North America with Particular Reference to the Southeastern United States for freshwater in North macroinvertebrates relationships America with particular reference to the southeastern United. Society 18:
Berglund O, Larsson P, Ewald G, Okla L (2001) The effect of Lake Trophy on Lipid Content and PCB concentrations in Planktonic Food Webs. Ecology 82:1078–1088.
Black MC, McCarthy JF (1988) Dissolved Organic Macromolecules Reduce the Uptake of Hydrophobic Organic Contaminants by the Gills of Rainbow Trout. Environ Toxicol Chem 7:593–600.
Blom G, Duin EHS Van, Aalderink RH, et al. (1992) Modelling sediment transport in shallow lakes - interactions between sediment transport and sediment composition. 153–166.
Boudreau PR, Dickie LM (1989) Biological model of Fisheries production based on physiological and ecological scalings of body size. Can. J. Fish. Aquat. Sci. 44:
Boudreau PR, Dickie LM, Kerr SR (1991) Body-size spectra of production and biomass as system-level indicators of ecological dynamics. J Theor Biol 152:329–339. doi: 10.1016/S0022-5193(05)80198-5
Bourassa N, Morin A (1995) Relationships between Size Structure of Invertebrate Assemblages and Trophy and Substrate Composition in Streams. J North Am Benthol Soc 14:393–403.
36
Brown KM, Lydeard C (2010) Mollusca : Gastropoda. In: Thorp JH, Covich AP (Editor) (eds) Ecol. Classif. North Am. Freshw. Invertebr., Third Edit. Elsevier Ltd, pp 277–306
Brunson EL, Canfield TJ, Dwyer FJ, et al. (1998) Assessing the Bioaccumulation of Contaminants from Sediments of the Upper Mississippi River Using Field-Collected Oligochaetes and Laboratory-Exposed Lumbriculus variegatus. 201:191–201.
Burn CR, Kokelj S V (2009) The Environment and Permafrost of the Mackenzie Delta Area. Permafr Periglac Process 105:83–105. doi: 10.1002/ppp
Burn CR, Lewkowicz AG (1990) Retrogressive Thaw Slumps. Can Geogr G 34:273–276. doi: 10.1111/j.1541-0064.2000.tb00712.x
Carrie J, Wang F, Sanei H, et al. (2010) Increasing contaminant burdens in an arctic fish, Burbot ( Lota lota ), in a warming climate. Environ Sci Technol 44:316–22. doi: 10.1021/es902582y
Charles F, Lopez-Legentil S, Grémare A, et al. (2005) Does sediment resuspension by storms affect the fate of polychlorobiphenyls (PCBs) in the benthic food chain? Interactions between changes in POM characteristics, adsorption and absorption by the mussel Mytilus galloprovincialis. Cont Shelf Res 25:2533–2553. doi: 10.1016/j.csr.2005.08.004
Deison R, Smol JP, Kokelj S V, et al. (2012) Spatial and temporal assessment of mercury and organic matter in thermokarst affected lakes of the Mackenzie Delta uplands, NT, Canada. Environ Sci Technol 46:8748–55. doi: 10.1021/es300798w
Evans MS, Muir D, Lockhart WL, et al. (2005) Persistent organic pollutants and metals in the freshwater biota of the Canadian Subarctic and Arctic: an overview. Sci Total Environ 351-352:94–147. doi: 10.1016/j.scitotenv.2005.01.052
Evans RD (1994) Empirical evidence of the importance of sediment resuspension in lakes. Hydrobiologia 284:5–12. doi: 10.1007/BF00005727
Gamble AE, Lloyd R, Aiken J, et al. (2006) Using zooplankton biomass size spectra to assess ecological change in a well-studied freshwater lake ecosystem : Oneida Lake , New York. Can J Fish Aquat Sci 63:2687–2699. doi: 10.1139/F06-153
Gewurtz SB, Lazar R, Haffner GD (2000) Comparison of polyclic aromatic hydrocarbon and polychlorinated biphenyl dynamics in benthic invertebrates of Lake Erie, USA. Environ Toxicol Chem 19:2943–2950.
Gilinsky E (1984) The Role of Fish Predation and Spatial Heterogeneity in Determining Benthic Community Structure Author ( s ): Ellen Gilinsky Reviewed work ( s ): Published by : Ecological Society of America Stable URL : http://www.jstor.org/stable/1941408 . THE ROLE OF F. Ecology 65:455–468.
37
Gobas FAPC, McCorquodale JR, Haffner GD (1993) Intestinal Absorption and Biomagnification of Organochlorines. Environ Toxicol Chem 12:567–576.
Haitzer M (1999) Relationship between concentration of dissolved organic matter (DOM) and the effect of DOM on the bioconcentration of benzo[a]pyrene. Aquat Toxicol 45:147–158. doi: 10.1016/S0166-445X(98)00097-6
Haitzer M, Höss S, Traunspurger W, Steinberg C (1998) Effects of Dissolved Organic Matter (DOM) on the Bioconcentration of Organic Chemicals in Aquatic Organisms - A Review. Chemosphere 37:1335–1362.
Hanson JM (1990) Macroinvertebrate size-distributions of two contrasting freshwater macrophyte communities. Freshw Biol 481–491.
Harner T, Bidleman T, Jantunen L, et al. (2003) Northern Contaminants Program Canadian: Arctic Contaminants Assessment Report II - Sources, Occurence, Trends and Pathways in the Physical environment. Indan and Northern Affairs Canada
Holmqvist N, Stenroth P, Berglund O, et al. (2005) Lake trophic status and bioaccumulation of polychlorinated biphenyls in benthic organisms : a comparison between littoral and profundal invertebrates. Can J Fish Aquat Sci 62:1201–1209. doi: 10.1139/F05-018
Hung H, Blanchard P, Halsall CJ, et al. (2005) Temporal and spatial variabilities of atmospheric polychlorinated biphenyls (PCBs), organochlorine (OC) pesticides and polycyclic aromatic hydrocarbons (PAHs) in the Canadian Arctic: results from a decade of monitoring. Sci Total Environ 342:119–44. doi: 10.1016/j.scitotenv.2004.12.058
Hung H, Kallenborn R, Breivik K, et al. (2009) Atmospheric monitoring of organic pollutants in the Arctic under the Arctic Monitoring and Assessment Programme (AMAP): 1993-2006. Sci Total Environ 408:2854–73. doi: 10.1016/j.scitotenv.2009.10.044
Jorgenson JK (1992) Response of Amphipoda and Trichoptera to Lake Fertilization in the Canadian Arctic. Can J Fish Aquat Sci 49:2354–2362. doi: 10.1139/f92-259
Kelly BC, Gobas FAPC, Machlan MS (2004) INTESTINAL ABSORPTION AND BIOMAGNIFICATION OF ORGANIC CONTAMINANTS IN FISH , WILDLIFE , AND HUMANS. Environ Toxicol Chem 23:2324–2336.
Kelly DW, Dick JTA, Montgomery WI (2002) The functional role of Gammarus ( Crustacea , Amphipoda ): shredders , predators , or both ? Hydrobiologia 485:199–203.
Kemp ALW, Anderson TW, Thomas RL, Mudrochova A (1974) Sedimentation rates and recent sediment history of lakes Ontario, Erie and Huron. J Sediment Petrol 44:207–218.
38
Kerr SR, Dickie LM (2001) The Biomass Spectrum: A Predator-prey Theory of Aquatic Production. Kerr, Stephen R., and Lloyd Merlin Dickie. The biomass spectrum: a predator-prey theory of aquatic production. Columbia University Press, 2001.
Kidd K a, Schindler DW, Hesslein RH, Muir DC (1998a) Effects of trophic position and lipid on organochlorine concentrations in fishes from subarctic lakes in Yukon Territory. Can J Fish Aquat Sci 55:869–881. doi: 10.1139/f97-307
Kidd K, Hesslein RH, Ross BJ, et al. (1998b) Bioaccumulation of organochlorines through a remote freshwater food web in the Canadian Arctic. Environ Pollut 102:91–103. doi: 10.1016/S0269-7491(98)00068-2
Kidd KA, Paterson MJ, Hesslein RH, et al. (1999) Effects of northern pike (Esox lucius) additions on pollutant accumulation and food web structure, as determined by δ13 C and δ15 N , in a eutrophic and an oligotrophic lake. Can J Fish Aquat Sci 56:2193–2202. doi: 10.1139/cjfas-56-11-2193
Kokelj S V, Burn CR (2003) Ground Ice and Soluble Cations in Near-Surface Permafrost, Inuvik, Northwest Territories, Canada. Permafr Periglac Process 14:275–289. doi: 10.1002/ppp.458
Kokelj S V, Burn CR (2005) Geochemistry of the active layer and near-surface permafrost , Mackenzie delta region , Northwest Territories , Canada 1. Earth 48:37–48. doi: 10.1139/E04-089
Kokelj S V, Lantz TC, Kanigan J, et al. (2009a) Origin and Polycyclic Behaviour of Tundra Thaw Slumps , Mackenzie Delta Region , Northwest Territories , Canada. Permafr Periglac Process 184:173–184. doi: 10.1002/ppp
Kokelj S V, Smith CAS, Burn CR (2002) Physical and Chemical Characteristics of the Active Layer and Permafrost , Herschel Island , Western Arctic Coast , Canada. Permafr Periglac Process 185:171–185. doi: 10.1002/ppp.417
Kokelj S V, Zajdlik B, Thompson MS (2009b) The Impacts of Thawing Permafrost on the Chemistry of Lakes across the Subarctic Boreal-Tundra Transition , Mackenzie Delta Region ,. Permafr Periglac Process 199:185–199. doi: 10.1002/ppp
Kokelj S V., Jenkins RE, Milburn D, et al. (2005) The influence of thermokarst disturbance on the water quality of small upland lakes, Mackenzie Delta region, Northwest Territories, Canada. Permafr Periglac Process 16:343–353. doi: 10.1002/ppp.536
Kukkonen J (1991) Bioavailability of Organic Pollutants in Boreal Waters With Varying Levels of Dissolved Organic Material. Water Res 25:455–463.
39
Kukkonen JVK, Landrum PF, Mitra S, et al. (2004) The role of desorption for describing the bioavailability of select polycyclic aromatic hydrocarbon and polychlorinated biphenyl congeners for seven laboratory-spiked sediments. Environ Toxicol Chem 23:1842–51.
Lantz TC, Kokelj S V. (2008) Increasing rates of retrogressive thaw slump activity in the Mackenzie Delta region, N.W.T., Canada. Geophys Res Lett 35:1–5. doi: 10.1029/2007GL032433
Larsson P, Collvin L, Okla L, Meyers G (1992) Lake Productivity and Water Chemistry as Governors of the Uptake of Persistent Pollutants in Fish. Environ Sci Technol 26:346–352.
Lemke P, Ren J, Alley RB, et al. (2007) Observations: Changes in Snow, Ice and Frozen Ground. Clim. Chang. 2007 Phys. Sci. Basis. Contrib. Work. Gr. 1 to Fourth Assess. Rep. Intergov. Panel Clim. Chang.
Loconto PR (2006) Trace Environmental Qualitative Analysis: principles, techniques and application, 2nd editio. 44.
M.O.E. (Ontario Ministry of the Environment) (1999) Lake Ontario Nearshore Sediment Quality Monitoring. Surf. Water Monit. Assess. 1997 Lake Ontario Rep. Featur. a Summ. Tribut. Nearshore Cond. Trends Lake Ontario Basin. Ontario Ministry of the Environment, pp 36–43
Macdonald RW, Barrie L a, Bidleman TF, et al. (2000) Contaminants in the Canadian Arctic: 5 years of progress in understanding sources, occurrence and pathways. Sci Total Environ 254:93–234.
Mackay D (1982) Correlation of bioconcentration factors. Environ Sci Technol 16:274–8. doi: 10.1021/es00099a008
Mackay D, Shiu WY, Ma K, Lee SC (2006) HANDBOOK OF Physical-Chemical Properties and Environmental Fate for Organic Chemicals: Second Edition, Volume II.
Mackay JR (1971) The Origin of Massive Icy Beds in Permafrost, Western Arctic Coast, Canada. Can J Earth Sci 8:397–422.
Mackay JR (1979) Pingos of the Tuktoyaktuk Peninsula Area, Northwest Territories. Géographie Phys Quat 33:3–61. doi: 10.7202/1000322ar
Macneil C, Dick JT a., Elwood RW (1997) The Trophic Ecology of Freshwater Gammarus Spp. (Crustacea: Amphipoda): Problems and Perspectives Concerning the Functional Feeding Group Concept. Biol Rev Camb Philos Soc 72:349–364. doi: 10.1017/S0006323196005038
40
Madsen JD, Chambers PA, James WF, et al. (2001) The interaction between water movement , sediment dynamics and submersed macrophytes. 71–84.
McCafferty WP (Editor), Covich AP (Editor) (1981) Aquatic Entomology - The Fishermen’s and Ecologists' Illustrated Guide to Insects and Their Relatives. 448.
Mesquita PS (2008) Effects of Retrogressive Permafrost Thaw Slumping on Benthic Macrophyte and Invertebrate Communities of Upland Tundra Lakes. University of Victoria
Mesquita PS, Wrona FJ, Prowse TD (2010) Effects of retrogressive permafrost thaw slumping on sediment chemistry and submerged macrophytes in Arctic tundra lakes. Freshw Biol 2347–2358. doi: 10.1111/j.1365-2427.2010.02450.x
Morin A, Stephenson J, Strike J, Solimini AG (2004) Sieve retention probabilities of stream benthic invertebrates. J North Am Benthol Soc 23:383–391.
Morrison H a., Gobas F a. PC, Lazar R, Haffner GD (1996) Development and Verification of a Bioaccumulation Model for Organic Contaminants in Benthic Invertebrates. Environ Sci Technol 30:3377–3384. doi: 10.1021/es960280b
Newman MC, Unger MA (2003) Fundamentals of ecotoxicology, Second Edi. 458.
Petchey OL, Belgrano A (2010) Body-size distributions and size-spectra: universal indicators of ecological status? Biol Lett 6:434–7. doi: 10.1098/rsbl.2010.0240
R Core Team (2013) R: A language and environment for statistical computing. doi: ISBN 3-900051-07-0
Rasmussen JB (1993) Patterns in the Size Structure of Littoral Macroinvertebrate Communities. Can. J. Fish. Aquat. Sci. 50:
Richardson ES, Reist JD, Minns CK (2001) Life History Characteristics of Freshwater Fishes Occurring in the Northwest Territories and Nunavut , With Major Emphasis on Lake Habitat Requirements. Can Manuscr Rep Fish Aquat Sci 2569 2569:146.
Roessink I, Moermond CT a, Gillissen F, Koelmans A a (2010) Impacts of manipulated regime shifts in shallow lake model ecosystems on the fate of hydrophobic organic compounds. Water Res 44:6153–63. doi: 10.1016/j.watres.2010.07.013
Ryan MJ, Stern G a, Diamond M, et al. (2005) Temporal trends of organochlorine contaminants in burbot and lake trout from three selected Yukon lakes. Sci Total Environ 351-352:501–522. doi: 10.1016/j.scitotenv.2004.08.022
41
Ryan MJ, Stern G a, Kidd K a, et al. (2013) Biotic interactions in temporal trends (1992-2010) of organochlorine contaminants in the aquatic food web of Lake Laberge, Yukon Territory. Sci Total Environ 443:80–92. doi: 10.1016/j.scitotenv.2012.10.055
Sheldon RW, Prakash A, Sutcliffe WH (1972) The Size Distribution of Particles in the Ocean. Limnol Oceanogr 17:327–340.
Sheldon RW, Sutcliffe WH, Prakash. A (1973) The Production of Particles in the Surface Waters of the Ocean with Particular Reference to the Sargasso Sea. Limnol Oceanogr 18:719–733.
Sijm DTHM, Selnen W, Opperhuizen A (1992) Life-Cycle Biomagnification Study in Fish. Environ Sci Technol 26:2162–2174.
Smith AJ, Delorme LD (2010) Ostracoda. Ecol. Classif. North Am. Freshw. Invertebr. Elsevier Inc., San Diego, California, pp 725–771
Smith IM, Cook DR, Smith BP (2010) Water Mites ( Hydrachnidiae ) and Other Arachnids. In: Thorp JH, Covich AP (Editor) (eds) Ecol. Classif. North Am. Freshw. Invertebr., Third Edit. Elsevier Ltd, pp 485–586
Sokal RR, Rohlf FJ (1995) Biometry, 3rd Edit. 850.
Sprules WG, Munawar M (1986) Plankton Size Spectra in Relation to Ecosystem Productivity , Size , and Perturbation. Can J Fish Aquat Sci 43:1789–1794.
Taylor P, Zhang T, Barry RG, et al. (1999) Statistics and characteristics of permafrost and ground ‐ ice distribution in the Northern Hemisphere. 37–41.
Taylor W, Carey J, Lean D, McQueen D (1991) Organochlorine Concentrations in the Plankton of Lakes in Southern Ontario and Their Relationship to Plankton Biomass. Can J Fish Aquat Sci 48:1960–1966.
Thompson MS, Kokelj S V., Prowse TD, Wrona FJ (2008) The Impact of Sediments Derived from Thawing Permafrost on Tundra Lake Water Chemistry: An Experimental Approach. In: D.L. Kane, K.M. Hinkel (eds) Proc. Ninth Int. Conf. Permafr. Institute of Northern Engineering, University of Alaska Fairbanks, Alaska., Fairbanks, Alaska, pp 1763–1767
Thompson MS, Wrona FJ, Prowse TD (2010) The effect of shoreline retrogressive thaw slumping on chlorophyll a, nutrient and light relationships in small tundra lakes. Abstr. H43H-04, Present. 2010 Fall Meet. 13-17 Dec.
Thorp JH, Covich AP (2010) Ecology and Classification of North American Freshwater Invertebrates, Third Edit. Academic Press
42
Tracey G, Hansen D (1996) Use of Biota-Sediment Accumulation Factors to Assess Similarity of Nonionic Organic Chemical Exposure to Benthically-Coupled Organisms of Differing Trophic Mode. Arch Environ Contam Toxicol 30:467–75.
Viganò L, Farkas A, Guzzella L, et al. (2007) The accumulation levels of PAHs, PCBs and DDTs are related in an inverse way to the size of a benthic amphipod (Echinogammarus stammeri Karaman) in the River Po. Sci Total Environ 373:131–45. doi: 10.1016/j.scitotenv.2006.11.006
Wania F, Mackay D (1996) Tracking the Distribution of Persistent Organic Pollutants. Environ Sci Technol 30:390–396.
Wetzel RG (2001) Limnology - Lake and River Ecosystems, Third. Limnol - Lake River Ecosyst 1006.
Yvon-Durocher G, Montoya JM, Trimmer M, Woodward G (2011) Warming alters the size spectrum and shifts the distribution of biomass in freshwater ecosystems. Glob Chang Biol 17:1681–1694. doi: 10.1111/j.1365-2486.2010.02321.x
(2008) Image-Pro ® Plus (Version 6.3 for windows).
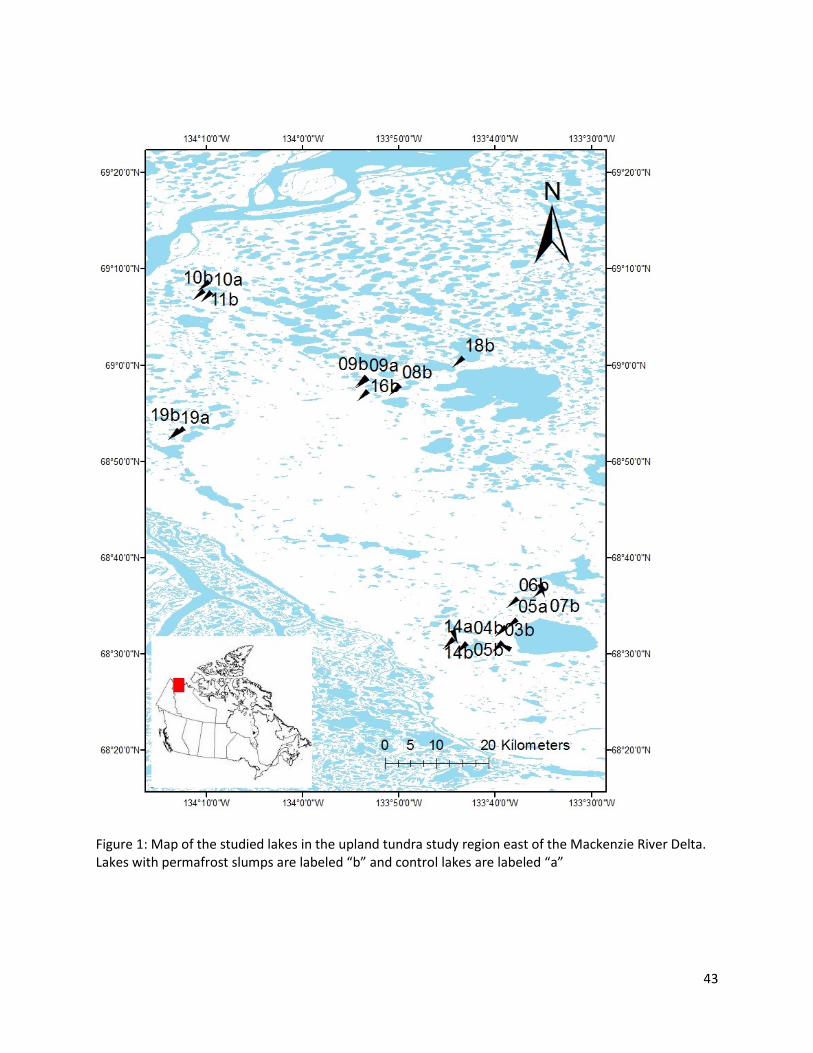
43
Figure 1: Map of the studied lakes in the upland tundra study region east of the Mackenzie River Delta. Lakes with permafrost slumps are labeled “b” and control lakes are labeled “a”
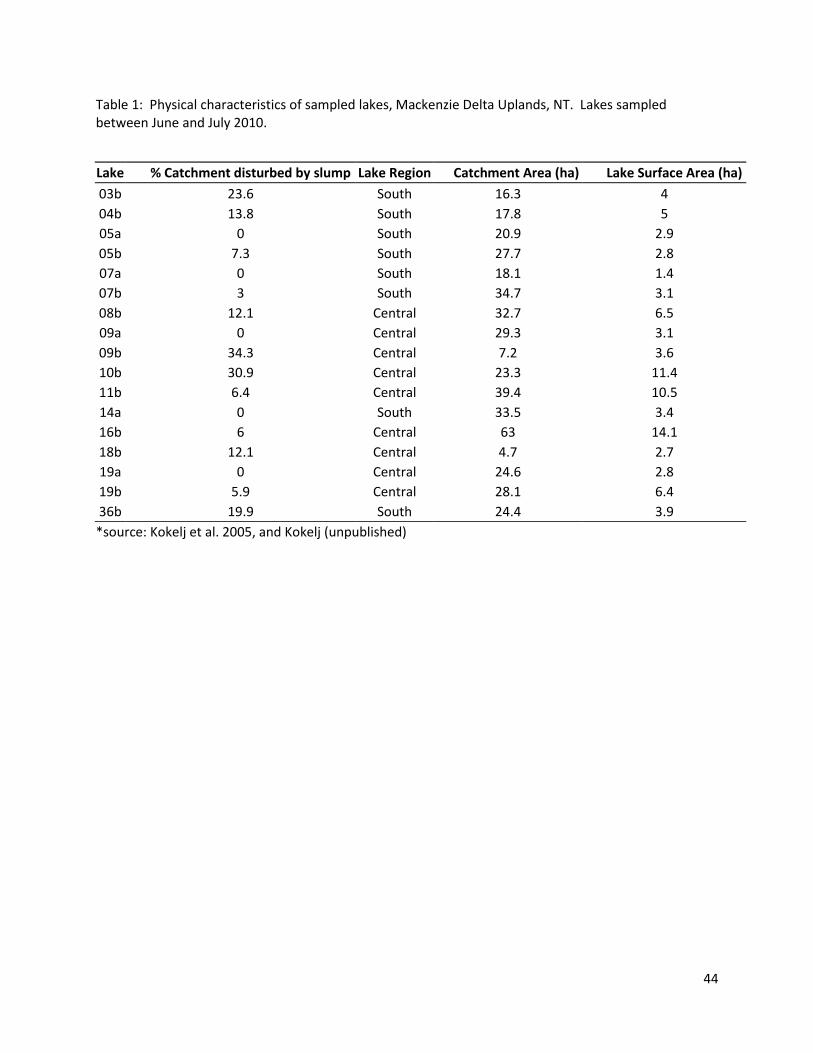
44
Table 1: Physical characteristics of sampled lakes, Mackenzie Delta Uplands, NT. Lakes sampled between June and July 2010.
*source: Kokelj et al. 2005, and Kokelj (unpublished)
Lake % Catchment disturbed by slump Lake Region Catchment Area (ha) Lake Surface Area (ha)
03b 23.6 South 16.3 4
04b 13.8 South 17.8 5
05a 0 South 20.9 2.9
05b 7.3 South 27.7 2.8
07a 0 South 18.1 1.4
07b 3 South 34.7 3.1
08b 12.1 Central 32.7 6.5
09a 0 Central 29.3 3.1
09b 34.3 Central 7.2 3.6
10b 30.9 Central 23.3 11.4
11b 6.4 Central 39.4 10.5
14a 0 South 33.5 3.4
16b 6 Central 63 14.1
18b 12.1 Central 4.7 2.7
19a 0 Central 24.6 2.8
19b 5.9 Central 28.1 6.4
36b 19.9 South 24.4 3.9
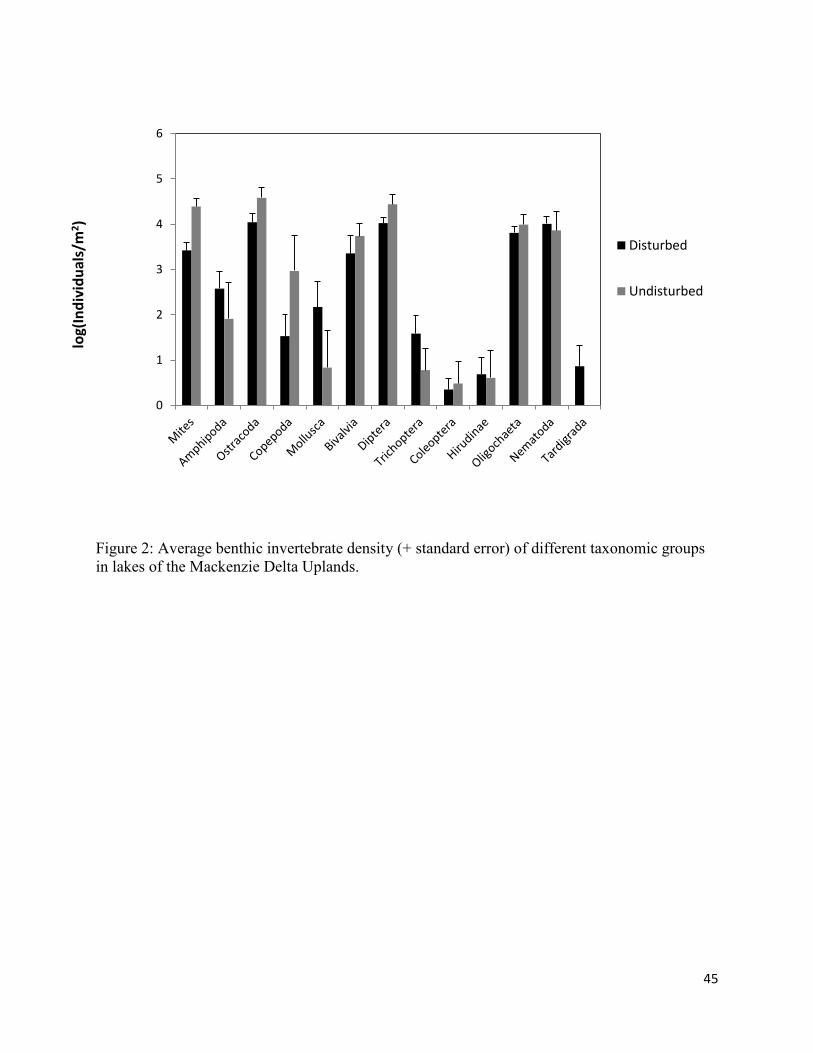
45
Figure 2: Average benthic invertebrate density (+ standard error) of different taxonomic groups
in lakes of the Mackenzie Delta Uplands.
0
1
2
3
4
5
6
log(
Ind
ivid
ual
s/m
2)
Disturbed
Undisturbed
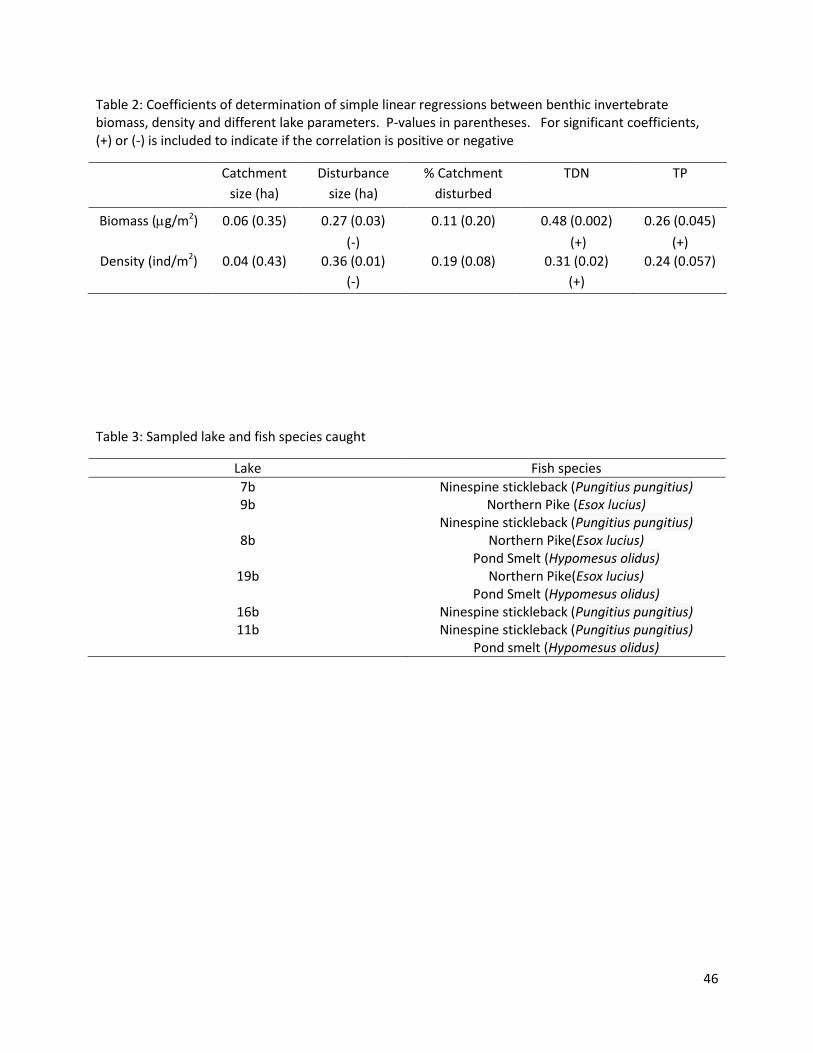
46
Table 2: Coefficients of determination of simple linear regressions between benthic invertebrate biomass, density and different lake parameters. P-values in parentheses. For significant coefficients, (+) or (-) is included to indicate if the correlation is positive or negative
Catchment
size (ha) Disturbance
size (ha) % Catchment
disturbed TDN TP
Biomass (g/m2) 0.06 (0.35) 0.27 (0.03)
(-) 0.11 (0.20) 0.48 (0.002)
(+) 0.26 (0.045)
(+)
Density (ind/m2) 0.04 (0.43) 0.36 (0.01)
(-) 0.19 (0.08) 0.31 (0.02)
(+) 0.24 (0.057)
Table 3: Sampled lake and fish species caught
Lake Fish species
7b Ninespine stickleback (Pungitius pungitius) 9b Northern Pike (Esox lucius)
Ninespine stickleback (Pungitius pungitius) 8b Northern Pike(Esox lucius)
Pond Smelt (Hypomesus olidus) 19b Northern Pike(Esox lucius)
Pond Smelt (Hypomesus olidus) 16b Ninespine stickleback (Pungitius pungitius) 11b Ninespine stickleback (Pungitius pungitius)
Pond smelt (Hypomesus olidus)
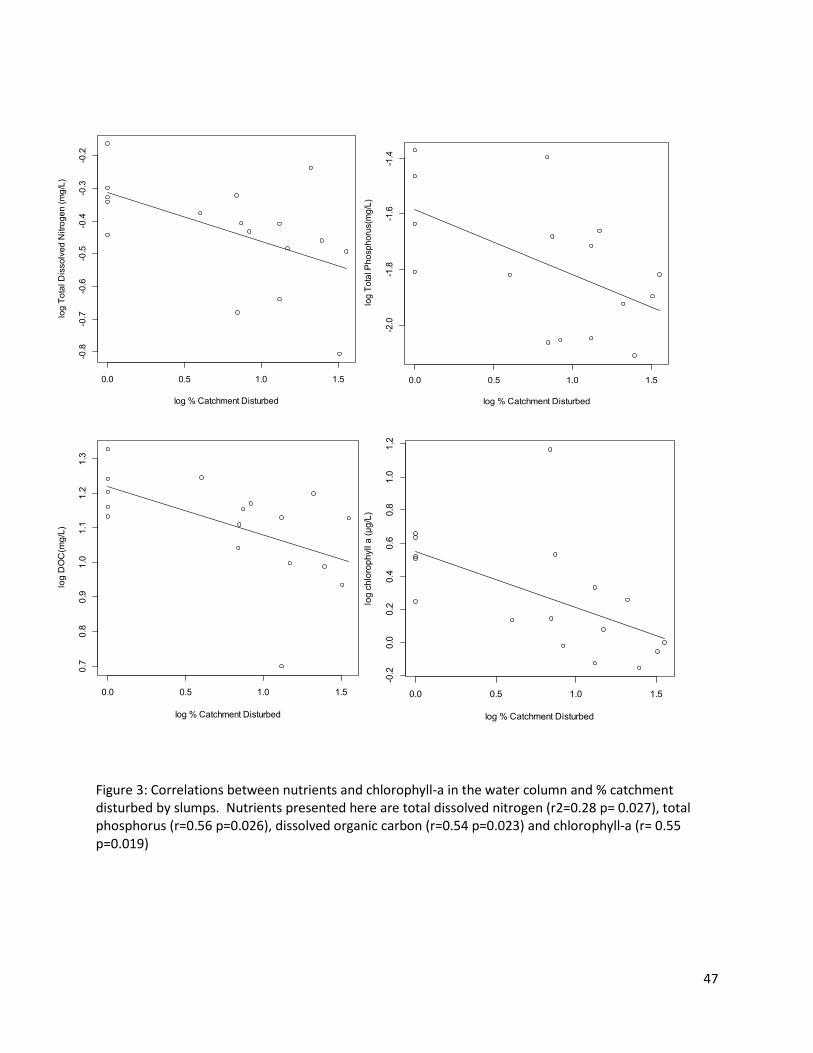
47
0.0 0.5 1.0 1.5-2
.0-1
.8-1
.6-1
.4
log % Catchment Disturbed
log
To
tal P
ho
sp
ho
rus(m
g/L
)
0.0 0.5 1.0 1.5
-0.8
-0.7
-0.6
-0.5
-0.4
-0.3
-0.2
log % Catchment Disturbed
log
To
tal D
isso
lve
d N
itro
ge
n (
mg
/L)
0.0 0.5 1.0 1.5
0.7
0.8
0.9
1.0
1.1
1.2
1.3
log % Catchment Disturbed
log
DO
C(m
g/L
)
0.0 0.5 1.0 1.5
-0.2
0.0
0.2
0.4
0.6
0.8
1.0
1.2
log % Catchment Disturbed
log
ch
loro
ph
yll a
(µ
g/L
)
Figure 3: Correlations between nutrients and chlorophyll-a in the water column and % catchment disturbed by slumps. Nutrients presented here are total dissolved nitrogen (r2=0.28 p= 0.027), total phosphorus (r=0.56 p=0.026), dissolved organic carbon (r=0.54 p=0.023) and chlorophyll-a (r= 0.55 p=0.019)
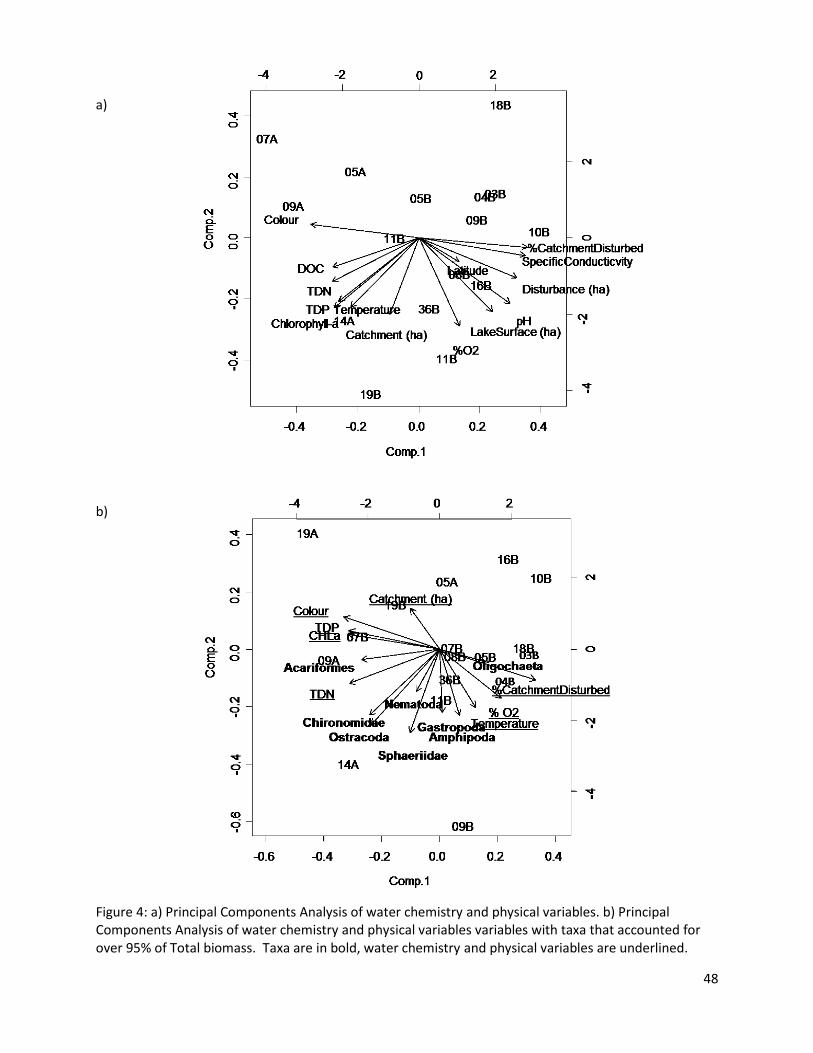
48
a)
b)
Figure 4: a) Principal Components Analysis of water chemistry and physical variables. b) Principal Components Analysis of water chemistry and physical variables variables with taxa that accounted for over 95% of Total biomass. Taxa are in bold, water chemistry and physical variables are underlined.
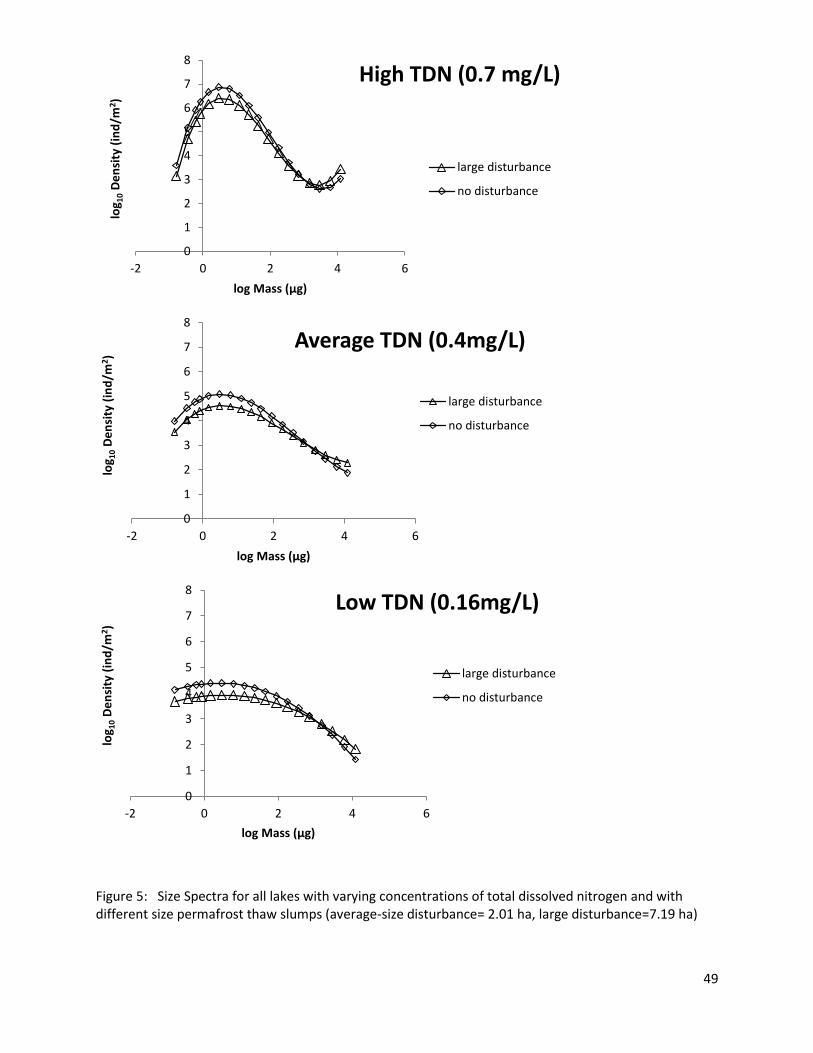
49
0
1
2
3
4
5
6
7
8
-2 0 2 4 6
log 1
0 D
en
sity
(in
d/m
2 )
log Mass (µg)
High TDN (0.7 mg/L)
large disturbance
no disturbance
0
1
2
3
4
5
6
7
8
-2 0 2 4 6
log 1
0 D
en
sity
(in
d/m
2)
log Mass (µg)
Average TDN (0.4mg/L)
large disturbance
no disturbance
0
1
2
3
4
5
6
7
8
-2 0 2 4 6
log 1
0 D
en
sity
(in
d/m
2 )
log Mass (µg)
Low TDN (0.16mg/L)
large disturbance
no disturbance
Figure 5: Size Spectra for all lakes with varying concentrations of total dissolved nitrogen and with different size permafrost thaw slumps (average-size disturbance= 2.01 ha, large disturbance=7.19 ha)
50
Chapter 2 – Impact of Permafrost Thaw Slumps on Contaminant
Concentrations in Amphipods and Fish of the Mackenzie Delta uplands,
NT
51
Abstract
Permafrost thaw slumps are large formations on lake banks that are a source of thawed material to
lakes. When present, they alter water chemistry parameters that may affect the way persistent organic
pollutants (POPs) behave in the environment. Polychlorinated biphenyls (PCBs) and organochlorine
pesticides (OCs) were measured in macroinvertebrates, fish, and sediments from a remote system of
lakes in the Northwest Territories to examine the effect of permafrost thaw slumps on contaminant
concentrations in biota. POPs in fish, the amphipod Gammarus and sediments were found in
comparable concentrations to other Arctic lakes. The concentrations were negatively correlated with
lake trophic status (total phosphorus) and positively correlated with the percentage of the catchment
affected by slumping. Benthic invertebrate biomass was also negatively correlated with concentrations
of contaminants in amphipods, supporting the biomass dilution hypothesis. Lakes with slumps generally
had 1.1 -1.7x higher concentrations of POPs in amphipods than lakes without slumps (ex. ΣPCBsDisturbed =
27.54 ng/g lipid, ΣPCBsUndisturbed = 16.97 ng/g lipid; ΣDDT Disturbed =18.47 ng/g lipid and ΣDDTUndisturbed
=10.86 ng/g lipid; ΣHexachlorohexanesDisturbed =7.16 ng/g lipids, ΣHexachlorohexanesUndisturbed =6.69 ng/g
lipids). These results suggest that permafrost thaw slumps have a large enough impact on the physico-
chemical characteristics of lakes that they alter contaminant concentrations in amphipods.
52
Introduction
Despite the fact that there are strict restrictions on production and use of persistent
contaminants and pesticides throughout North America and Europe, they are displacement via long
range transport of these contaminants allow their presence in air, water, animal and human populations
in the Arctic (Wania and Mackay 1996). While the presence of these chemicals has been known for
many years, the current changing Arctic climate and the expected widespread thawing of permafrost
raise new questions about contaminant dynamics in the Arctic. It is currently unclear how these
changes will affect the distribution and behaviour of persistent organic pollutants (POPs). Conflicting
trends for contaminant concentrations in Arctic freshwater biota have been reported, with some studies
indicating concentrations of some legacy contaminants may be rising (e.g. Carrie et al. 2010), while
others seem to indicate the opposite (Ryan et al. 2013).
The uplands east of the Mackenzie Delta, NWT, are underlain by ice-rich permafrost,
interspersed with thousands of small lakes (Burn and Kokelj 2009) that may be affected by warming. In
this region, the thawing of permafrost creates thermokarst topography and various thermokarst
formations. One example of these formations are permafrost thaw slumps, which are crater-like
formations created when permafrost with large quantities of ground ice thaws. Studies have shown
that climate warming is increasing the rate of permafrost thaw slump activity in the Mackenzie Delta
Uplands (Lantz and Kokelj 2008). Currently, almost one in ten of the lakes are directly impacted by
permafrost thaw slumps (Kokelj et al. 2009b). When a slump forms on a lake bank, the mud slurry
enters the water, leaving a large depression on the bank. Thaw slumping on lake banks has been shown
to alter water chemistry significantly (Kokelj et al. 2005; Thompson et al. 2010), as well as sediment
chemistry and lake productivity (Thompson et al. 2010; Mesquita et al. 2010; Deison et al. 2012).
Many of the water chemistry parameters altered by permafrost slumps have documented
effects on the uptake of POPs to lake biota (Larsson et al. 1992; Haitzer 1999; Berglund et al. 2001;
Holmqvist et al. 2005; Roessink et al. 2010). Dissolved organic carbon (DOC) flocculates out of the
water column when slump material is added to water (Thompson et al, 2008), and DOC has a negative
impact on the uptake of hydrophobic contaminants from water (Black and McCarthy 1988; Kukkonen
53
1991; Haitzer et al. 1998) due to contaminant sorption (absorbtion or adsorption) onto dissolved or
particulate organic matter in the water column. Slumps have also been shown to lower the nutrient
concentration of lakes and hence decrease algal productivity (Thompson et al. 2010), two parameters
which can alter contaminant concentration in biota due to reduced biomass dilution (Taylor et al. 1991;
Larsson et al. 1992; Berglund et al. 2001; Holmqvist et al. 2005; Carrie et al. 2010).
Because thaw slump activity alters the concentration of DOC in the water column so drastically,
and because the intensity of thaw slump activity varies spatially, there is a very wide range of DOC in
slump-affected lakes in the Mackenzie Delta Uplands. This location therefore presents the opportunity
to study the effect of dissolved organic carbon on the behavior of contaminants in lake-water. Likewise,
the significant change in lake productivity over the range of catchment slumping is of equal interest.
Because these changes reflect the effect of thawing permafrost on lakes, this study may also be
indicative of how wide-spread permafrost thaw will impact the arctic landscape over the coming years.
The objective of this study was to quantify the effect of permafrost thaw slumps on POPs in
amphipods and fish. Amphipods were chosen as study species because of their presence in most lakes
of the study area. Samples were taken from a set of small lakes that had varying degrees of thaw slump
activity on their banks. Because of the known impacts of thermokarst slumps on water chemistry
(especially the shifts in DOC), it is likely that there will be a variation in contaminant concentrations in
lakes depending on the degree of thaw slump activity. This study aims to relate contaminant levels
measured in biota to the magnitude of permafrost slumping and to physico-chemical parameters of the
water-column altered by slumps.
Methods
Study area
Fourteen small lakes were sampled in the tundra uplands east of the Mackenzie Delta between
June and July 2010. The area is underlain by continuous permafrost that is up to several hundred
metres thick (Mackay 1971). The permafrost in the area contains large amounts of ground ice that, if
54
exposed, is susceptible to thaw. The ice and surrounding sediments are also ion-rich (Mackay 1979;
Kokelj et al. 2002), with the near-surface permafrost becoming ion-rich due to entrapment of soluble
materials by a rising permafrost table and the downward migration of ions along thermally-induced
suction gradients (Kokelj and Burn 2005). Thawing of the permafrost along the banks of lakes leads to
the release of this material, significantly altering water chemistry once it enters the water column
(Kokelj et al. 2005).
Lakes were selected along a range of catchment slumped (up to 34% catchment slumped) that
included 4 reference lakes that were unaffected by slumps. To minimize the effect of latitude, distances
between lakes were kept to a minimum: all lakes were within 70km of each other.
Water was sampled twice during the sampling season, on June 12th 2010 and on July 6th 2010.
These values were averaged for all statistical analyses. All biota were sampled between these dates.
Water samples were sent to the National Centre for Environmental Testing (NLET, Burlington, ON) for
nutrient analysis and to the Taiga Environmental Laboratory (Yellowknife, NWT) for analysis of metals
and ions.
Sampling was conducted from one random location in the littoral zone along lake banks, in areas
free of macrophytes. Sediment samples were taken in each lake by scraping the top 1cm of sediment
from an Ekman dredge sample. For duplicates, a separate Ekman dredge was sampled. Sediment
samples were stored in Whirlpack bags and frozen until analysis. After sediment sampling, seining for
Gammarus and fish was conducted in the same area that was sampled for sediments until around 8
grams of biomass was collected. If fish were found, they were euthanized by a blow to the head and
pithing of the brain. Samples were stored in 50mL centrifuge tubes over ice until return to the
laboratory. Fish samples were then measured and weighed, rinsed with clean water and frozen until
analysis. Gammarus samples were allowed to sit in clean water in the fridge over-night to clear their
guts. After 24 hours, they were rinsed, blotted to remove excess water, and frozen until analysis. Only
amphipods over 2 mm in length were kept for analysis.
55
Sampling methodology
Biota and sediment samples were analysed for PCB and OC contaminant concentrations. Sub-
samples of sediments were analysed for inorganic, organic and total carbon by the GG Hatch Isotope lab
at the University of Ottawa. δ15N and δ13C were measured in biota by the GG Hatch Isotope Laboratory
at the University of Ottawa (measured by combustion on a VarioEL III Elemental Analyser followed by
"trap and purge" separation and on-line analysis by continuous-flow with a DeltaPlus Advantage isotope
ratio mass spectrometer coupled with a ConFlo II). These measurements were taken to approximate
the trophic level of biota.
Average benthic invertebrate biomass for 17 lakes was quantified (see chapter 2). 11 of these
17 also coincided with lakes that were sampled for POPs. Biomass was calculated from Ekman dredge
samples of the sediments. Three Ekman samples per lake, at similar depths (between 50cm and 90cm)
and in similar substrate types were chosen (sediments free of macrophytes and without clay substrates).
Invertebrates were identified using keys from McCafferty (1981) and Thorp & Covich (2010).
Inverterabrate biomass was estimated and a sieve retention model was applied (see Chapter 2 for
methods).
Analsysis of Persistent Organic Pollutants
Quality control
All glassware used for the extraction of organic pollutants was cleaned using established
protocols. Glass Pasteur pipettes were heated for 12 hours at 200°C. Any metallic tools used for sample
processing (such as blender blades and metal spatulas) were cleaned using the same procedures.
Method blanks were run with each round of sample extractions. To blank correct before
analysis, mean blank concentration was subtracted from the extract concentration. Concentrations of
biological samples were also corrected for the loss of analyte in the 10% aliquot used in lipid
56
determination (see below). Analysis of certified reference materials (SRM2974a organics in freeze-dried
mussel tissue, SRM1944 New York/New Jersey waterway sediment) were conducted with every 10-15
samples for quality assurance.
Method detection limits were calculated according to Loconto (2006). Detection limits for
individual congeners and metabolites can be found in Table 5 and 6.
Contaminant Extraction and Lipid Analysis
Sample Preparation
Biological samples were homogenized by freezing in liquid nitrogen and grinding to a fine
powder in a glass blender with metal blades. Six-eight grams of material were used per extraction for
both fish and Gammarus. For fish, whole bodies were used and several individuals were combined to
form one sample. Pond smelt (Hypomesus olidus) size averaged 5.26 cm and varied between 2.7 cm – 9
cm, while nine-spine stickleback (Pungitius pungitius)size averaged 3.78 cm and varied between 2.4 cm -
6.8 cm.
Sediment samples were homogenized by mixing thoroughly by hand. Any pebbles or
macrophytes were removed prior to analysis. Sediments were then centrifuged to remove excess
water, and weighed out to 12-15 grams for extractions.
Extraction
Samples were ground with pre-cleaned Hydromatrix. This mixture was packed into cells for
accelerated solvent extraction (ASE). Samples were spiked with an internal standard (composed of PCB
30 and 205, as well as 1,2,4,5 tetrabromobenzene, δ-hexachlorohexane and endrin ketone) to monitor
recovery. The internal standards are chosen to monitor the recovery over the entire chromatogram.
The samples were extracted with dichloromethane, hexane and acetone (Omnisolv, high-purity grade).
57
Methods for PCB and DDT analysis followed the National Center for environmental Testing (NLET)
protocol. Liquid-liquid extraction was then performed to remove excess water using DCM, a 3 % sodium
chloride solution and a saturated sodium sulphate solution, before being passed through sodium
sulphate.
Percent lipids for biota samples was determined by drying a small aliquot (10%) of the extracted
sample in pre-weighed aluminum weighing dishes for 24 hours. The dishes were allowed to dry and
were then re-weighed to determine the portion of the aliquot composed of lipid. The samples were
then filtered through a 0.2 µm PTFE filter before being cleaned further using Preparative Liquid
Chromatography (Prep-LC) through 19x150 mm and 19x300 mm Envirogel GPC clean-up columns
connected in series, using dichloromethane. Final cleanup and fractionation of samples was performed
by column chromatography. The final extract was passed through a column packed with activated silica
gel, evaporated to 500 l and spiked with the internal standard octachloronaphthalene (OCN). Samples
were analyzed on an HP6890 Series gas chromatography system with electron-capture detector, using
pulsed splitless injection. Chromatograms were analysed using Agilent ChemStation software.
Statistical Analysis
Statistical analyses were done using R 2.15.2 (R Core Team 2013) and Microsoft Excel. All data
were log-transformed prior to analysis to meet the assumptions of parametric testing.
BSAFs (biota-to-sediment accumulation factors) were calculated using the following formula:
Where CB is equal to the lipid-normalized concentration of the contaminant in biota, and Csed is the
organic carbon-normalized concentration of contaminant in sediments. BSAFs are used to evaluate the
bioavailability and absorption of chemicals from sediments (Gewurtz et al. 2000). BSAF > 1 indicate that
bioaccumulation may be playing a role in the transfer of organic contaminants in the benthic food web.
58
Principal Component Analysis (PCA) was used to summarize variation and correlation structure
among observations of physical variables and contaminant concentrations in biota and sediments.
Linear regressions were then used to test the relationship between variables. Independent variables
included were % catchment slumped, disturbance size (ha), disturbance size(ha)/lake size(ha), specific
conductivity, DOC (mg/L), chlorophyll-a (µg/L) , average biomass of invertebrates per lake and total
nitrogen (mg/L).
In certain cases, similar but insignificant trends were present for regressions of different
contaminants or congeners. Fisher’s method for combining probabilities was used in these cases to
combine p-values from several tests and determine an aggregate p-value (Sokal and Rohlf 1995).
Results
All lakes in this study except one are oligotrophic (4-10 µg/L of phosphorus; Wetzel 2001) but
nevertheless cover a gradient of water chemistry correlated with catchment slumping (Figure 2) similar
to what has been observed by others in this area (Kokelj et al. 2005; Thompson et al. 2008; Kokelj et al.
2009b). Total dissolved nitrogen varied from 0.687mg/L to 1.56mg/L and was negatively correlated
with % catchment slumped. Total phosphorus varied from 3.2 g/L to 20g/L, with one high outlying
value of 61g/L, and was also negatively correlated with % catchment slumped. Chlorophyll-a
concentrations varied from 0.7µg/L to 4.55µg/L in all lakes except one, which had a significantly higher
concentration of 14.6µg/L. Chlorophyll-a was negatively correlated with % catchment slumped (p=0.01),
and positively correlated with total nitrogen and total phosphorus. Slumping also correlated negatively
with DOC in the water column (p=0.0056), which varied tenfold from 2.6 mg/L to 26mg/L. Specific
conductivity varied from 42.4µS/cm to 925.5µS/cm, and correlated positively with % catchment
disturbed (p=0.0012).
59
Based on the comparison of δ15N values observed here with those from other studies, the sampled
biota likely occupied two trophic levels (Kidd et al. 1998b). Pond smelt (mean of 10.62 ‰, standard
error= 0.21) and ninespine stickleback (mean = 10.20 ‰, standard error= 0.47) are likely secondary
consumers and Gammarus (mean of 5.82‰) is likely a primary consumer. δ13C values for amphipods
and fish were very similar (averages of -32.63‰ and -32.16‰ respectively).
Results of POP extractions
Different contaminant groups were quantified by summing concentrations of isomers and
related compounds. ΣHCH was quantified as the sum of αHCH, βHCH and γHCH, with a log Kow s of 3.7-
3.8. ΣCHL was quantified as the sum of chlordane-related compounds (heptachlor, heptachlor epoxide,
cis-chlordane, trans-nonachlor, oxychlordane, γ-chlordane), with a log Kow of 6.0. ΣCBz was calculated
as the sum of pentachlorobenzene and hexachlorobenzene, with log Kows of 4.5-5.5. ΣDDT is the sum of
o-p’-DDT, o-p’-DDT, p-p’-DDD, o-p’-DDD, p-p’-DDE, o-p’-DDE, with log Kow s of 6.2-6.9. ΣAldrins was
calculated as the sum of Aldrins and Dieldrin, with log Kows ranging from 5.48-5.66. ΣPCB was the sum
of PCB congeners 18, 29, 31-28, 52, 49, 44, 99, 87, 110, 149, 118, 146, 153, 132, 105, 138, 163, 187,
183,128, 156, 201, 157, 180, 170, 195,194, 206 and 209, with a range of log Kows of 6.2-7.0. In general,
the lipophilicity of the contaminant groups in this study are as follows: ∑DDT ≈ ∑PCB >∑CHL >∑CBz ≈
Aldrins >∑HCH.
Among the PCB congener groups, the highest concentrations were detected in
hexachlorbyphenyls, pentachlorobiphenyls, tetrachlorobiphenyls and trichlorobiphenyls.
Heptachlorobiphenyls were also detected, but in much lower concentrations. Nonachlorobiphenyls and
decachlorobiphenyls, congeners with the highest degree of chlorination, were not detected.
Concentrations of ΣPCBs and of different OC pesticides in biota are listed in tables 2 and 3.
Table 2 shows lipid corrected concentrations (ng/g lipid), whereas table 3 shows concentrations in ng/g
wet weight. Concentrations in Gammarus were lower than in fish for all contaminants, which is
expected for bioaccumulating contaminants due to their lower trophic position. Pond smelt generally
60
had higher concentrations than ninespine stickleback. PCB congeners found in highest concentrations in
Gammarus were 153, 49 and 52. In fish, highest concentrations were found for PCB congeners 49, 44
and 153. ΣPCBs were the contaminant found in highest concentrations, followed by ΣDDTs, ΣCBz and
ΣAldrins. Duplicate samples of Gammarus were collected for lakes 7B (for sum PCBs, coefficient of
variation =6.2%) and 19B (for sum PCBs, coefficient of variation=9.4%).
For Gammarus, the concentrations of contaminants generally followed the pattern of
contaminant lipophilicity, though chlordanes were found in the lowest concentrations. In ninespine
stickleback, the concentrations of the different contaminant groups followed the same trends as for
Gammarus except for ΣDDT, which was the 3rd lowest concentration. In pond smelt, ΣPCBs, ΣAldrins and
ΣCHLs were in highest concentrations.
Sediment concentrations of POPs were comparable to other arctic lakes (Allen-Gil et al. 1997),
though were lower than values reported by Kidd (1998) from the Nunavut region (table 4). ΣPCB were
found in the highest concentrations followed by ΣHCH. ΣDDT and ΣCHL had very similar concentrations.
ΣAldrins and ΣCBz were detected, though in quite low concentrations.
BSAFs could only be calculated for lakes where concentrations in both Gammarus and surficial
sediments were known (10 of the 14 lakes). For ΣPCBs, the mean BSAFs value was 8.9 and ranged from
1.47 to 12.8 (with one very high value of 45.17). This range was similar for Hexachlorohexanes (mean=
2.4, range of 0.56 to 9.17), DDT (mean=11.75, range of 2.22 to 29.1) and Chlordanes (mean= 13.9, range
of 1.88 to 37, with one high value of 53.7). Other OC pesticide groups had higher BSAFs: Aldrins ranged
from 1.95 to 114.3 (mean of 36.9) and Chlorobenzenes from 3.25 to 127.7 (mean of 30.29).
Results of statistical analyses
In order to decide which metric (% catchment disturbed, disturbance size or disturbance size/lake
size) of permafrost slumping to use, linear regressions were run between different water chemistry
61
variables and these metrics. They were all found to correlate significantly with water chemistry
parameters. Percent catchment slumped was therefore chosen to remain consistent with the literature
(Kokelj et al. 2005; Deison et al. 2012).
The compounds in this study represent a range of lipophilicities, and generally more lipophilic,
higher chlorinated compounds bioaccumulate to a greater degree and have longer half-lives in biota
than the less chlorinated compounds. The log Kows, which represent the tendency of the chemical to
partition between the organic phase and the aqueous phase, were taken from Kidd (Kidd et al. 1998a),
Mackay (Mackay 1982) and Mackay (Mackay et al. 2006).
Concentrations of ΣPCBs in Gammarus , fish and sediments were comparable to levels measured
in other Canadian and American Arctic Lakes (Kidd et al. 1998; Kidd 1998, Schindler and Kidd from AMAP
2009). These values are similar to what has been observed by others. For example, Brunson (Brunson
et al. 1998) calculated a range of 2.5 to 26.6 for field collected oligocheates. Tracey and Hansen (1996)
found similar BSAFs for PCBs (mean= 43.65) and OC pesticides (mean=91.2) in benthic invertebrates of
several functional feeding groups, and Viganò et al. (2007) found a mean BSAF of 50.11 for PCBs.
The PCA conducted on water chemistry variables revealed a clear gradient in water chemistry
associated with increased % catchment slumped (Figure 3). Lakes with permafrost thaw slumps on their
banks tended to have higher specific conductivity, but low DOC, chlorophyll-a, invertebrate biomass and
total nitrogen. The first principal component explained 59% of the variance and the second principal
component explained an additional 18%. Over-all, parameters differed between disturbed and
undisturbed lakes with undisturbed lakes clustering mostly on the left of the figure and lakes with
slumps clustering on the right side of the figure (Figure 3, panel B). The first principal component mainly
reflected the gradients in % catchment disturbed, disturbance size, disturbance size/lake size and total
nitrogen. The second principal component mainly reflected the gradients in catchment and lake surface
area, and benthic invertebrate biomass.
62
A second PCA analysis run on environmental variables, concentrations of contaminants in
Gammarus, concentrations of contaminants in sediments, and BSAFs (Figure 4). The 1st principal
component explained 31% of the variance, and the 2nd principal component explained an additional
15%. The first principal component reflected mostly the gradients of BSAFs, concentrations in
sediments, % catchment slumping, invertebrate biomass and certain water chemistry parameters (DOC
and total nitrogen). The second principal component reflected mostly variations in total phosphorus,
chlorophyll-a, specific conductivity, and concentrations of POPs in Gammarus. Lakes falling on the right
of the figure tended to have higher concentrations of most contaminants in their sediments, whereas
lakes on the left had higher BSAF values. Lakes falling in the bottom portion of the PCA had higher
concentrations of POPs in Gammarus, and had higher portions of their catchments affected by slumps.
Lakes with high chlorphyll-a and total phosphorus tended to fall towards the top of the figure.
Following the PCA, linear regressions and t-tests were used to determine which parameters
were significantly correlated to POP concentrations in Gammarus. T-tests were performed, though the
dataset was highly uneven and contained only 3 lakes unaffected by thaw slumps. Parameters chosen
for these analyses were benthic invertebrate biomass, % catchment slumped, chlorophyll-a in the water
columns and DOC in the water column. Latitude and lake size were also parameters that were tested,
and neither had a significant correlation.
Total phosphorus and total nitrogen correlated negatively with concentrations of POPs in
Gammarus. The correlation between Total Phosphorus with ΣPCB (p=0.041), ΣDDT (p=0.0047) and
Aldrins (p=0.016) was significantly negative (Figure 6). Combining all p-values for POPs with Fisher’s
method was also significant (p=0.0257) over-all. Certain individual PCB congeners (PCB 49, 163 and 156)
were significantly negatively correlated with TP in the water column. Chlorophyll-a concentration in the
water column also had an over-all negative correlation with concentration of contaminants in biota,
though no significant trends were detected.
63
POP concentrations in Gammarus were negatively correlated with invertebrate biomass for only
certain contaminant groups (Figure 7). This correlation was significant for ΣAldrins (p=0.035) and
ΣChlordanes (p=0.039). The combined p-value with the Fisher method was not significant for the main
POP groups.
POP concentrations in Gammarus were inversely related to overall benthic biomass, suggesting
dilution of a relatively constant pool of contaminants in variable amount of biomass. If contaminants are
diluted in biomass, the concentration of contaminants in the biota should be proportional to the
reciprocal of biomass (Taylor et al. 1991), and therefore that the log of concentration declines with the
log of biomass with a slope of -1. Model 2 regressions (Ranged Major Axis) were used to calculate
slopes with biomass as the independent variable. RMA regressions were used because the variables on
both the independent and the dependent axes had error associated with them, and therefore Ordinary
Least Squares regressions were not appropriate. For regressions with invertebrate biomass as the
independent variable, the slopes Σ PCBs (-0.59), ΣDDT ( -0.89), ΣAldrins ( -1.06) and ΣChlordanes (-1.18)
were not significantly different than -1 (Table 7). The biomass dilution hypothesis has therefore not
been refuted.
Concentrations of POPs in surficial sediments (ng/g organic carbon) of shallow zones showed no
significant correlations with physical or chemical lake parameters (Table 8). All contaminant groups
tended to be negatively correlated with total nitrogen in the water column. Though this trend was only
significant for DDT (r=-0.54, p=0.04), the combined p-value using the Fisher’s method was significant
(p=0.023). There was also a general negative correlation between the concentrations of POPs in surficial
sediments and DOC in the water column, and POPs in surficial sediments and the % of the catchment
that was slumped, though none were significant. Concentrations of POPs in surficial sediments (ng/g dry
weight) of shallow zones showed no significant correlations with physical or chemical lake parameters
(Table 9).
64
Correlations were also computed for BSAFs and water chemistry parameters (Table 10). All
contaminant groups tended to be positively correlated with Total Nitrogen. This trend was significant
over-all when combining p-values with the Fisher’s method.
Discussion
Concentrations of POPs in biota in this study are similar but slightly lower than concentrations in
Arctic lakes from the late 1990s. Concentrations in invertebrates and fish were similar to those
measured in small Arctic lakes in the Yukon (Kidd et al. 1998a). Compared to a lake in the Keewan
region of Nunavut (Kidd et al. 1998b), concentrations were in the same order of magnitude but were
lower for all contaminants measured. This is consistent with long-term PCB and OC trends measured
from air in the Canadian arctic, which shows a slow decline over the same time period (Hung et al.
2005). Differences between concentrations in fish and Gammarus likely reflected the effect of trophic
level, such as has been observed in other lakes (Kidd et al. 1998b). Within the study region,
organochlorine pollutant levels were uncorrelated with latitude, supporting the assumption that lakes
received similar atmospheric fallout of contaminants.
The pattern of PCB congeners detected in amphipods is what would be expected given the log-
Kows of the different congener groups. PCBs with mid-range log-Kows were found in highest
concentrations. Log-Kow represents the partition coefficient of a compound between n-octanol and
water, and is used to reflect the hydrophobicity of a compound and to imply relative partitioning
between aqueous phases of the environment and lipids in an organism. Generally, congeners with a
higher degree of chlorination have higher log-KOWs (Newman and Unger 2003). For compounds with
very low log-KOWs, a larger portion stays dissolved in water and is not easily taken up by organisms or
bound to organic carbon in the water column. For compounds with log-KOW values of approximately 3-6,
uptake to organisms increases with Kow (Newman and Unger 2003). Above log-Kow values of 6-7, the
rate of uptake slows and begins to decrease (Kelly et al. 2004). Dietary uptake efficiency is therefore
generally highest for contaminant groups with mid log-Kows (Gobas et al. 1993). This pattern is
consistent with concentrations found here: none of the most highly chlorinated congeners (nona-
65
chlorobiphenyl or decachlorobiphenyl) were detected in amphipods, nor the least chlorinated congeners
(monochlorobiphenyl or dichlorobiphenyl).
The mean concentrations of contaminants in amphipods were generally higher in lakes with
permafrost thaw slumps. This was true for PCBs, Endosulfans, Aldrins, Chlordanes,
hexachlorocyclohexanes and DDTs, and t-tests showed that the difference was significant for PCBs,
Endosulfans, Chlordanes and Hexachlorocyclohexanes. Linear regressions confirmed that amphipods in
lakes with a larger portion of their catchments affected by slumps tended to have higher concentrations
of contaminants. Gammarus in lakes with slumps generally had 1.07 -1.7x higher concentrations of
POPs than lakes without slumps. Mean ΣPCB concentrations in Gammarus for undisturbed lakes was
16.97ng/g (±1.80), while the mean in disturbed lakes was 27.54 ng/g (±8.08). For aldrins, the mean for
disturbed lakes was 12.15 ng/g (±4.84), and 9.59 ng/g (±3.03) in undisturbed lakes. For ΣDDT, the mean
in disturbed lakes was 18.47 ng/g and 10.86 ng/g lipid in undisturbed lakes. For ΣHexachlorohexanes,
the mean in disturbed lakes was 7.16 ng/g lipids, and 6.69 ng/g lipids in undisturbed lakes. The presence
of thaw slumps therefore seems to coincide with higher concentrations of contaminants in Gammarus.
Slumps therefore appear to be altering the accumulation of contaminants in Gammarus.
The accumulation of contaminants by organisms is dependent on several factors related to
uptake and elimination. For aquatic organisms, the major routes of chemical uptake are dietary uptake
and gill uptake. The major routes of elimination are gill elimination, metabolic transformation and fecal
egestion and growth dilution (Arnot and Gobas 2004). If the changes to water chemistry brought about
by permafrost slumps alter these uptake and elimination routes, there should be measurable changes of
contaminant burdens in amphipods. Water chemistry variables altering these routes of uptake and
elimination should also be linked to how concentrations of Gammarus changed over the studied lakes.
The effect of decreasing contaminant burdens in biota due to biodilution in a system has been
observed in plankton (Taylor et al. 1991; Berglund et al. 2001), invertebrates (Holmqvist et al. 2005) and
fish (Taylor et al. 1991; Larsson et al. 1992; Sijm et al. 1992; Kidd et al. 1999; Holmqvist et al. 2005; Evans
et al. 2005; Ryan et al. 2013). The dilution hypothesis predicts that concentration of contaminants
66
should be proportional to the reciprocal of biomass (Taylor et al. 1991). The biomass dilution
hypothesis was not refuted here (the slopes of regressions between concentrations of POPs in
amphipods as dependent variables and benthic invertebrate biomass as independent variables were not
significantly different than -1).
Biodilution can occur when growth rates of biota exceed the uptake kinetics of POPs, or when a
finite amount of contaminant is diluted over a larger total biomass resulting in less contaminant per unit
biomass. If lake productivity shifts and results in changes to biomass, it may therefore alter
contaminants per unit biomass. Here, statistical analysis indicated that concentrations of POPs in biota
were negatively correlated with lake trophy (total phosphorus). Gammarus in more oligotrophic lakes
tended to have higher concentrations of POPs. This pattern was also visible for lakes with higher
benthic invertebrate biomass and for lakes with higher algal biomass (estimated by the concentration of
chlorophyll-a). Lakes with higher phosphorus, chlorophyll-a and invertebrate biomass also
corresponded to those without slumps. In this way, slumps may indirectly alter contaminant
concentrations in biota.
A major route of uptake of POPs to aquatic organisms, uptake through gills, is dependent on the
freely dissolved portion of contaminants in the water column. Hydrophobic contaminants dissolved in
the water become sorbed (absorbed or adsorbed) to dissolved or particulate organic carbon. DOC is
normally found to have a negative effect on the uptake of hydrophobic contaminants from water to
biota (Black and McCarthy 1988; Kukkonen 1991; Taylor et al. 1991; Haitzer et al. 1998). When large
quantities of DOC are present, the fraction of freely dissolved contaminant in the water column, the
fraction that can be taken up by the gills, is decreased. DOC is drawn out of the water column in lakes
with slumps, likely increasing the portion of freely dissolved contaminant in the water column. Lakes
with slumps also had higher concentrations of contaminants in Gammarus.
Another major uptake route is uptake through food. It may be altered by the presence of
slumps if Gammarus food sources are impacted. Gammarus are epi-benthic generalist feeders, and may
67
be shredders, grazers and predators (Macneil et al. 1997). Because they are epi-benthic, they spend
time in the water column and in sediments and may feed in either area. If concentrations of POPs in
plankton are biodiluted because of high plankton biomass, Gammarus may be accumulating smaller
concentrations of POPs from a planktonic diet.
Gammarus may also feed within the sediments. For this reason, concentrations of POPs in
sediments and biota-sediment accumulation factors were calculated to determine if accumulation from
the sediments was altered by the presence of thaw slumps. No significant correlations were apparent
for surficial sediment concentrations that were not carbon-corrected. For carbon-corrected
concentrations there was a very weak negative correlation between total nitrogen in the water column
and all contaminants in sediments (this trend was significant for ΣDDT only). Though this trend was very
weak over-all, it reoccurred for all contaminant groups. There was also a negative correlation between
DOC in the water column and carbon-corrected contaminants in sediments (significant when combining
p-values with the Fisher’s method). This indicates that, for each gram of surficial sediments, the total
amount of contaminants does not change as a function of lake nutrients. However, in lakes with higher
total nitrogen, there seems to be slightly less contaminant in the sediments per gram of carbon. Lakes
with higher total nitrogen were generally more productive (there was a significant correlation between
nitrogen in the water column and chlorophyll-a), with higher chlorophyll-a and likely higher algal
biomass. These also correspond to lakes with higher organic carbon in their sediments and with higher
algae settling rates (Deison et al. 2012). Since Gammarus may feed on organic particles in the
sediments, and if these particles have smaller concentrations of POPs, it’s possible that Gammarus are
accumulating less contaminant from a sedimentary diet in lakes with higher total nitrogen (more
productive lakes, without slumps) than in lakes with slumps. This would support the biodilution theory
since it would indicate that in more productive lakes with higher algal settling fluxes, the amount of
contaminant actually being drawn down into the sediments by algae is lower.
The lack of strong correlations between concentrations of POPs in sediments and any lake physico-
chemical parameters may be due to the fact that only shallow sediments were sampled. Shallow
sediments were selected to be near amphipod sampling sites, and therefore represent the conditions
amphipods were exposed to. However, shallow sediments are also unstable with higher resuspension
68
rates, impacting the transfer of organic pollutants to the benthic food chain (Charles et al. 2005). Depth,
lake morphometry and macrophyte biomass will also affect sediment deposition, stability and
resuspension (Kemp et al. 1974; Blom et al. 1992; Evans 1994; M.O.E. 1999; Madsen et al. 2001).
Because of these factors, it is possible that shallow sediments are simply too unstable to show
significant correlations, considering the relatively low POP concentrations detected in all sediments.
Biota-Sediment Accumulation Factors and Sediments
BSAFs are used to calculate the partitioning of a contaminant between an organism’s lipids and
the organic carbon fraction of the sediments (Kukkonen et al. 2004). The range found here indicates
that the majority of contaminants are being accumulated from sediment. BSAFs were not correlated
with slumping in the catchment, though showed slight positive trends with DOC and total nitrogen
(significant when combining p-values with the Fisher’s method). It therefore appears as though more
contaminants are being accumulated from lakes without slumps, even though these were also lakes
with lower concentrations of contaminants per gram organic carbon. It’s possible that in these lakes,
sediments make up a larger portion of the amphipod diet.
Gammarus may be exposed to varying amounts of contaminants from the overlying water which is
not accounted for in the BSAF calculation. Feeding behaviour will affect uptake of contaminants
(Leppänen 1995) but Gammarus feeding strategies are highly variable (Macneil et al. 1997; Kelly et al.
2002),and the amount of sediment being ingested as food may vary between communities in different
lakes depending on availability of different food sources (Morrison et al. 1996). If Gammarus feed
mostly from algae in the water column, they would not necessarily reflect concentrations in sediments.
Lastly, shallow sediments, such as those sampled here, are generally unstable and are easily
resuspended by wind and wave action.
Conclusion
As permafrost thaw rates continue to rise in the Canadian Arctic, predicting how these changes will
affect wildlife is increasingly important. Persistent organic pollutants are of particular interest because
69
they bioaccumulate through the food chain. This study has shown that a particular form of permafrost
thaw, permafrost thaw slumps on lake banks, has impacts on contaminant burdens in biota from Arctic
lakes.
Carrie et al. (2010) showed that concentrations of PCBs and mercury in burbot of the Mackenzie
River have increased in the last 25 years, despite declining or stable atmospheric concentrations. This
change correlates with warming temperatures and reduced ice cover in the area. This also correlates
with increased permafrost thaw in the Mackenzie Valley and along the Mackenzie River (Aylsworth and
Duk-Rodkin 1997). This study found that for lakes with higher degrees of slumping Gammarus tended to
have higher concentrations of POPs.
Changes to water chemistry that alter the main routes of uptake and elimination of contaminants
will necessarily alter contaminant concentrations in Gammarus. This study found that concentrations
of POPs in amphipods were negatively correlated with % catchment thawed. Contaminant
concentration in amphipods was also negatively correlated with benthic invertebrate biomass and with
lake trophy, which suggests that biomass dilution may be the main mechanism for the lower
contaminant levels in biota of slump lakes. Carbon-corrected sediment concentrations showed negative
trends with Total Nitrogen in the water columns, with BSAFs correlating positively and sediment
concentrations (carbon corrected) correlating negatively. Though weak, these trends may indicate that
the changes brought about by slumping are enough to alter sediments, and affect the way contaminants
are being taken up.
There are many other types of thaw formations that occur in the Arctic, and they may not all have
the same impacts on lakes as those seen here. However, because the rate and occurrence of
permafrost thaw slumps on lake banks on the open tundra is increasing, the effects seen here may
become more widespread as the arctic continues to warm. The decreased lake productivity of lakes as a
result of slumping may increase contaminant loads in biota. However, warming temperatures in the
Arctic over this time period are also expected, potentially counter-acting this trend. Warmer
temperatures will lead to longer ice-free seasons, lengthening the growing season for aquatic
70
invertebrates and phytoplankton. This will potentially create more productive lakes, which in turn may
decrease concentrations in biota through biodilution. However, this study indicates that lake
productivity may play a key role in determining how arctic lakes respond to permafrost thaw and
changing climate.

71
References
Ahrens MA, Peters RH (1991) Patterns and Limitations in Limnop ankton Size Spectra. Can J Fish Aquat Sci 48:1967–1978.
Allen-Gil SM, Gubala CP, Wilson R, et al. (1997) Organochlorine Pesticides and Polychlorinated Biphenyls ( PCBs ) in Sediments and Biota from Four US Arctic Lakes. Arch Environ Contam Toxicol 33:378–387.
AMAP 2009 (2009) Arctic Pollution 2009. Arct Monit Assess Program 83.
Arctic Monitoring and Assessment Report (AMAP) (2011) Snow, Water, Ice and Permafrost in the Arctic (SWIPA): Climate Change and the Cryosphere. Oslo
Arnot JA, Gobas FAPC (2004) A Food Web Bioaccumulation Model for Organic Chemicals in Aquatic Ecosystems. Environ Toxicol Chem 23:2343–2355.
Aylsworth JM, Duk-Rodkin A (1997) Landslides and Permafrost in the Mackenzie Valley. In: Cohen SJ (ed) Final Rep. Mackenzie Basin Impact Study. pp 117–121
Benke AC, Huryn AD, Smock LA, Wallace JB (1999) Length-Mass Relationships for Freshwater Macroinvertebrates in North America with Particular Reference to the Southeastern United States for freshwater in North macroinvertebrates relationships America with particular reference to the southeastern United. Society 18:
Berglund O, Larsson P, Ewald G, Okla L (2001) The effect of Lake Trophy on Lipid Content and PCB concentrations in Planktonic Food Webs. Ecology 82:1078–1088.
Black MC, McCarthy JF (1988) Dissolved Organic Macromolecules Reduce the Uptake of Hydrophobic Organic Contaminants by the Gills of Rainbow Trout. Environ Toxicol Chem 7:593–600.
Blom G, Duin EHS Van, Aalderink RH, et al. (1992) Modelling sediment transport in shallow lakes - interactions between sediment transport and sediment composition. 153–166.
Boudreau PR, Dickie LM (1989) Biological model of Fisheries production based on physiological and ecological scalings of body size. Can. J. Fish. Aquat. Sci. 44:
Boudreau PR, Dickie LM, Kerr SR (1991) Body-size spectra of production and biomass as system-level indicators of ecological dynamics. J Theor Biol 152:329–339. doi: 10.1016/S0022-5193(05)80198-5
Bourassa N, Morin A (1995) Relationships between Size Structure of Invertebrate Assemblages and Trophy and Substrate Composition in Streams. J North Am Benthol Soc 14:393–403.
Brown KM, Lydeard C (2010) Mollusca : Gastropoda. In: Thorp JH, Covich AP (Editor) (eds) Ecol. Classif. North Am. Freshw. Invertebr., Third Edit. Elsevier Ltd, pp 277–306

72
Brunson EL, Canfield TJ, Dwyer FJ, et al. (1998) Assessing the Bioaccumulation of Contaminants from Sediments of the Upper Mississippi River Using Field-Collected Oligochaetes and Laboratory-Exposed Lumbriculus variegatus. 201:191–201.
Burn CR, Kokelj S V (2009) The Environment and Permafrost of the Mackenzie Delta Area. Permafr Periglac Process 105:83–105. doi: 10.1002/ppp
Burn CR, Lewkowicz AG (1990) Retrogressive Thaw Slumps. Can Geogr G 34:273–276. doi: 10.1111/j.1541-0064.2000.tb00712.x
Carrie J, Wang F, Sanei H, et al. (2010) Increasing contaminant burdens in an arctic fish, Burbot ( Lota lota ), in a warming climate. Environ Sci Technol 44:316–22. doi: 10.1021/es902582y
Charles F, Lopez-Legentil S, Grémare A, et al. (2005) Does sediment resuspension by storms affect the fate of polychlorobiphenyls (PCBs) in the benthic food chain? Interactions between changes in POM characteristics, adsorption and absorption by the mussel Mytilus galloprovincialis. Cont Shelf Res 25:2533–2553. doi: 10.1016/j.csr.2005.08.004
Deison R, Smol JP, Kokelj S V, et al. (2012) Spatial and temporal assessment of mercury and organic matter in thermokarst affected lakes of the Mackenzie Delta uplands, NT, Canada. Environ Sci Technol 46:8748–55. doi: 10.1021/es300798w
Evans MS, Muir D, Lockhart WL, et al. (2005) Persistent organic pollutants and metals in the freshwater biota of the Canadian Subarctic and Arctic: an overview. Sci Total Environ 351-352:94–147. doi: 10.1016/j.scitotenv.2005.01.052
Evans RD (1994) Empirical evidence of the importance of sediment resuspension in lakes. Hydrobiologia 284:5–12. doi: 10.1007/BF00005727
Gamble AE, Lloyd R, Aiken J, et al. (2006) Using zooplankton biomass size spectra to assess ecological change in a well-studied freshwater lake ecosystem : Oneida Lake , New York. Can J Fish Aquat Sci 63:2687–2699. doi: 10.1139/F06-153
Gewurtz SB, Lazar R, Haffner GD (2000) Comparison of polyclic aromatic hydrocarbon and polychlorinated biphenyl dynamics in benthic invertebrates of Lake Erie, USA. Environ Toxicol Chem 19:2943–2950.
Gilinsky E (1984) The Role of Fish Predation and Spatial Heterogeneity in Determining Benthic Community Structure Author ( s ): Ellen Gilinsky Reviewed work ( s ): Published by : Ecological Society of America Stable URL : http://www.jstor.org/stable/1941408 . THE ROLE OF F. Ecology 65:455–468.
Gobas FAPC, McCorquodale JR, Haffner GD (1993) Intestinal Absorption and Biomagnification of Organochlorines. Environ Toxicol Chem 12:567–576.

73
Haitzer M (1999) Relationship between concentration of dissolved organic matter (DOM) and the effect of DOM on the bioconcentration of benzo[a]pyrene. Aquat Toxicol 45:147–158. doi: 10.1016/S0166-445X(98)00097-6
Haitzer M, Höss S, Traunspurger W, Steinberg C (1998) Effects of Dissolved Organic Matter (DOM) on the Bioconcentration of Organic Chemicals in Aquatic Organisms - A Review. Chemosphere 37:1335–1362.
Hanson JM (1990) Macroinvertebrate size-distributions of two contrasting freshwater macrophyte communities. Freshw Biol 481–491.
Harner T, Bidleman T, Jantunen L, et al. (2003) Northern Contaminants Program Canadian: Arctic Contaminants Assessment Report II - Sources, Occurence, Trends and Pathways in the Physical environment. Indan and Northern Affairs Canada
Holmqvist N, Stenroth P, Berglund O, et al. (2005) Lake trophic status and bioaccumulation of polychlorinated biphenyls in benthic organisms : a comparison between littoral and profundal invertebrates. Can J Fish Aquat Sci 62:1201–1209. doi: 10.1139/F05-018
Hung H, Blanchard P, Halsall CJ, et al. (2005) Temporal and spatial variabilities of atmospheric polychlorinated biphenyls (PCBs), organochlorine (OC) pesticides and polycyclic aromatic hydrocarbons (PAHs) in the Canadian Arctic: results from a decade of monitoring. Sci Total Environ 342:119–44. doi: 10.1016/j.scitotenv.2004.12.058
Hung H, Kallenborn R, Breivik K, et al. (2009) Atmospheric monitoring of organic pollutants in the Arctic under the Arctic Monitoring and Assessment Programme (AMAP): 1993-2006. Sci Total Environ 408:2854–73. doi: 10.1016/j.scitotenv.2009.10.044
Jorgenson JK (1992) Response of Amphipoda and Trichoptera to Lake Fertilization in the Canadian Arctic. Can J Fish Aquat Sci 49:2354–2362. doi: 10.1139/f92-259
Kelly BC, Gobas FAPC, Machlan MS (2004) INTESTINAL ABSORPTION AND BIOMAGNIFICATION OF ORGANIC CONTAMINANTS IN FISH , WILDLIFE , AND HUMANS. Environ Toxicol Chem 23:2324–2336.
Kelly DW, Dick JTA, Montgomery WI (2002) The functional role of Gammarus ( Crustacea , Amphipoda ): shredders , predators , or both ? Hydrobiologia 485:199–203.
Kemp ALW, Anderson TW, Thomas RL, Mudrochova A (1974) Sedimentation rates and recent sediment history of lakes Ontario, Erie and Huron. J Sediment Petrol 44:207–218.
Kerr SR, Dickie LM (2001) The Biomass Spectrum: A Predator-prey Theory of Aquatic Production. Kerr, Stephen R., and Lloyd Merlin Dickie. The biomass spectrum: a predator-prey theory of aquatic production. Columbia University Press, 2001.

74
Kidd K a, Schindler DW, Hesslein RH, Muir DC (1998a) Effects of trophic position and lipid on organochlorine concentrations in fishes from subarctic lakes in Yukon Territory. Can J Fish Aquat Sci 55:869–881. doi: 10.1139/f97-307
Kidd K, Hesslein RH, Ross BJ, et al. (1998b) Bioaccumulation of organochlorines through a remote freshwater food web in the Canadian Arctic. Environ Pollut 102:91–103. doi: 10.1016/S0269-7491(98)00068-2
Kidd KA, Paterson MJ, Hesslein RH, et al. (1999) Effects of northern pike (Esox lucius) additions on pollutant accumulation and food web structure, as determined by δ13 C and δ15 N , in a eutrophic and an oligotrophic lake. Can J Fish Aquat Sci 56:2193–2202. doi: 10.1139/cjfas-56-11-2193
Kokelj S V, Burn CR (2003) Ground Ice and Soluble Cations in Near-Surface Permafrost, Inuvik, Northwest Territories, Canada. Permafr Periglac Process 14:275–289. doi: 10.1002/ppp.458
Kokelj S V, Burn CR (2005) Geochemistry of the active layer and near-surface permafrost , Mackenzie delta region , Northwest Territories , Canada 1. Earth 48:37–48. doi: 10.1139/E04-089
Kokelj S V, Lantz TC, Kanigan J, et al. (2009a) Origin and Polycyclic Behaviour of Tundra Thaw Slumps , Mackenzie Delta Region , Northwest Territories , Canada. Permafr Periglac Process 184:173–184. doi: 10.1002/ppp
Kokelj S V, Smith CAS, Burn CR (2002) Physical and Chemical Characteristics of the Active Layer and Permafrost , Herschel Island , Western Arctic Coast , Canada. Permafr Periglac Process 185:171–185. doi: 10.1002/ppp.417
Kokelj S V, Zajdlik B, Thompson MS (2009b) The Impacts of Thawing Permafrost on the Chemistry of Lakes across the Subarctic Boreal-Tundra Transition , Mackenzie Delta Region ,. Permafr Periglac Process 199:185–199. doi: 10.1002/ppp
Kokelj S V., Jenkins RE, Milburn D, et al. (2005) The influence of thermokarst disturbance on the water quality of small upland lakes, Mackenzie Delta region, Northwest Territories, Canada. Permafr Periglac Process 16:343–353. doi: 10.1002/ppp.536
Kukkonen J (1991) Bioavailability of Organic Pollutants in Boreal Waters With Varying Levels of Dissolved Organic Material. Water Res 25:455–463.
Kukkonen JVK, Landrum PF, Mitra S, et al. (2004) The role of desorption for describing the bioavailability of select polycyclic aromatic hydrocarbon and polychlorinated biphenyl congeners for seven laboratory-spiked sediments. Environ Toxicol Chem 23:1842–51.
Lantz TC, Kokelj S V. (2008) Increasing rates of retrogressive thaw slump activity in the Mackenzie Delta region, N.W.T., Canada. Geophys Res Lett 35:1–5. doi: 10.1029/2007GL032433
Larsson P, Collvin L, Okla L, Meyers G (1992) Lake Productivity and Water Chemistry as Governors of the Uptake of Persistent Pollutants in Fish. Environ Sci Technol 26:346–352.

75
Lemke P, Ren J, Alley RB, et al. (2007) Observations: Changes in Snow, Ice and Frozen Ground. Clim. Chang. 2007 Phys. Sci. Basis. Contrib. Work. Gr. 1 to Fourth Assess. Rep. Intergov. Panel Clim. Chang.
Loconto PR (2006) Trace Environmental Qualitative Analysis: principles, techniques and application, 2nd editio. 44.
M.O.E. (Ontario Ministry of the Environment) (1999) Lake Ontario Nearshore Sediment Quality Monitoring. Surf. Water Monit. Assess. 1997 Lake Ontario Rep. Featur. a Summ. Tribut. Nearshore Cond. Trends Lake Ontario Basin. Ontario Ministry of the Environment, pp 36–43
Macdonald RW, Barrie L a, Bidleman TF, et al. (2000) Contaminants in the Canadian Arctic: 5 years of progress in understanding sources, occurrence and pathways. Sci Total Environ 254:93–234.
Mackay D (1982) Correlation of bioconcentration factors. Environ Sci Technol 16:274–8. doi: 10.1021/es00099a008
Mackay D, Shiu WY, Ma K, Lee SC (2006) HANDBOOK OF Physical-Chemical Properties and Environmental Fate for Organic Chemicals: Second Edition, Volume II.
Mackay JR (1971) The Origin of Massive Icy Beds in Permafrost, Western Arctic Coast, Canada. Can J Earth Sci 8:397–422.
Mackay JR (1979) Pingos of the Tuktoyaktuk Peninsula Area, Northwest Territories. Géographie Phys Quat 33:3–61. doi: 10.7202/1000322ar
Macneil C, Dick JT a., Elwood RW (1997) The Trophic Ecology of Freshwater Gammarus Spp. (Crustacea: Amphipoda): Problems and Perspectives Concerning the Functional Feeding Group Concept. Biol Rev Camb Philos Soc 72:349–364. doi: 10.1017/S0006323196005038
Madsen JD, Chambers PA, James WF, et al. (2001) The interaction between water movement , sediment dynamics and submersed macrophytes. 71–84.
McCafferty WP (Editor), Covich AP (Editor) (1981) Aquatic Entomology - The Fishermen’s and Ecologists' Illustrated Guide to Insects and Their Relatives. 448.
Mesquita PS (2008) Effects of Retrogressive Permafrost Thaw Slumping on Benthic Macrophyte and Invertebrate Communities of Upland Tundra Lakes. University of Victoria
Mesquita PS, Wrona FJ, Prowse TD (2010) Effects of retrogressive permafrost thaw slumping on sediment chemistry and submerged macrophytes in Arctic tundra lakes. Freshw Biol 2347–2358. doi: 10.1111/j.1365-2427.2010.02450.x
Morin A, Stephenson J, Strike J, Solimini AG (2004) Sieve retention probabilities of stream benthic invertebrates. J North Am Benthol Soc 23:383–391.
76
Morrison H a., Gobas F a. PC, Lazar R, Haffner GD (1996) Development and Verification of a Bioaccumulation Model for Organic Contaminants in Benthic Invertebrates. Environ Sci Technol 30:3377–3384. doi: 10.1021/es960280b
Newman MC, Unger MA (2003) Fundamentals of ecotoxicology, Second Edi. 458.
Petchey OL, Belgrano A (2010) Body-size distributions and size-spectra: universal indicators of ecological status? Biol Lett 6:434–7. doi: 10.1098/rsbl.2010.0240
R Core Team (2013) R: A language and environment for statistical computing. doi: ISBN 3-900051-07-0
Rasmussen JB (1993) Patterns in the Size Structure of Littoral Macroinvertebrate Communities. Can. J. Fish. Aquat. Sci. 50:
Richardson ES, Reist JD, Minns CK (2001) Life History Characteristics of Freshwater Fishes Occurring in the Northwest Territories and Nunavut , With Major Emphasis on Lake Habitat Requirements. Can Manuscr Rep Fish Aquat Sci 2569 2569:146.
Roessink I, Moermond CT a, Gillissen F, Koelmans A a (2010) Impacts of manipulated regime shifts in shallow lake model ecosystems on the fate of hydrophobic organic compounds. Water Res 44:6153–63. doi: 10.1016/j.watres.2010.07.013
Ryan MJ, Stern G a, Diamond M, et al. (2005) Temporal trends of organochlorine contaminants in burbot and lake trout from three selected Yukon lakes. Sci Total Environ 351-352:501–522. doi: 10.1016/j.scitotenv.2004.08.022
Ryan MJ, Stern G a, Kidd K a, et al. (2013) Biotic interactions in temporal trends (1992-2010) of organochlorine contaminants in the aquatic food web of Lake Laberge, Yukon Territory. Sci Total Environ 443:80–92. doi: 10.1016/j.scitotenv.2012.10.055
Sheldon RW, Prakash A, Sutcliffe WH (1972) The Size Distribution of Particles in the Ocean. Limnol Oceanogr 17:327–340.
Sheldon RW, Sutcliffe WH, Prakash. A (1973) The Production of Particles in the Surface Waters of the Ocean with Particular Reference to the Sargasso Sea. Limnol Oceanogr 18:719–733.
Sijm DTHM, Selnen W, Opperhuizen A (1992) Life-Cycle Biomagnification Study in Fish. Environ Sci Technol 26:2162–2174.
Smith AJ, Delorme LD (2010) Ostracoda. Ecol. Classif. North Am. Freshw. Invertebr. Elsevier Inc., San Diego, California, pp 725–771
Smith IM, Cook DR, Smith BP (2010) Water Mites ( Hydrachnidiae ) and Other Arachnids. In: Thorp JH, Covich AP (Editor) (eds) Ecol. Classif. North Am. Freshw. Invertebr., Third Edit. Elsevier Ltd, pp 485–586
Sokal RR, Rohlf FJ (1995) Biometry, 3rd Edit. 850.

77
Sprules WG, Munawar M (1986) Plankton Size Spectra in Relation to Ecosystem Productivity , Size , and Perturbation. Can J Fish Aquat Sci 43:1789–1794.
Taylor P, Zhang T, Barry RG, et al. (1999) Statistics and characteristics of permafrost and ground ‐ ice distribution in the Northern Hemisphere. 37–41.
Taylor W, Carey J, Lean D, McQueen D (1991) Organochlorine Concentrations in the Plankton of Lakes in Southern Ontario and Their Relationship to Plankton Biomass. Can J Fish Aquat Sci 48:1960–1966.
Thompson MS, Kokelj S V., Prowse TD, Wrona FJ (2008) The Impact of Sediments Derived from Thawing Permafrost on Tundra Lake Water Chemistry: An Experimental Approach. In: D.L. Kane, K.M. Hinkel (eds) Proc. Ninth Int. Conf. Permafr. Institute of Northern Engineering, University of Alaska Fairbanks, Alaska., Fairbanks, Alaska, pp 1763–1767
Thompson MS, Wrona FJ, Prowse TD (2010) The effect of shoreline retrogressive thaw slumping on chlorophyll a, nutrient and light relationships in small tundra lakes. Abstr. H43H-04, Present. 2010 Fall Meet. 13-17 Dec.
Thorp JH, Covich AP (2010) Ecology and Classification of North American Freshwater Invertebrates, Third Edit. Academic Press
Tracey G, Hansen D (1996) Use of Biota-Sediment Accumulation Factors to Assess Similarity of Nonionic Organic Chemical Exposure to Benthically-Coupled Organisms of Differing Trophic Mode. Arch Environ Contam Toxicol 30:467–75.
Viganò L, Farkas A, Guzzella L, et al. (2007) The accumulation levels of PAHs, PCBs and DDTs are related in an inverse way to the size of a benthic amphipod (Echinogammarus stammeri Karaman) in the River Po. Sci Total Environ 373:131–45. doi: 10.1016/j.scitotenv.2006.11.006
Wania F, Mackay D (1996) Tracking the Distribution of Persistent Organic Pollutants. Environ Sci Technol 30:390–396.
Wetzel RG (2001) Limnology - Lake and River Ecosystems, Third. Limnol - Lake River Ecosyst 1006.
Yvon-Durocher G, Montoya JM, Trimmer M, Woodward G (2011) Warming alters the size spectrum and shifts the distribution of biomass in freshwater ecosystems. Glob Chang Biol 17:1681–1694. doi: 10.1111/j.1365-2486.2010.02321.x
(2008) Image-Pro ® Plus (Version 6.3 for windows).
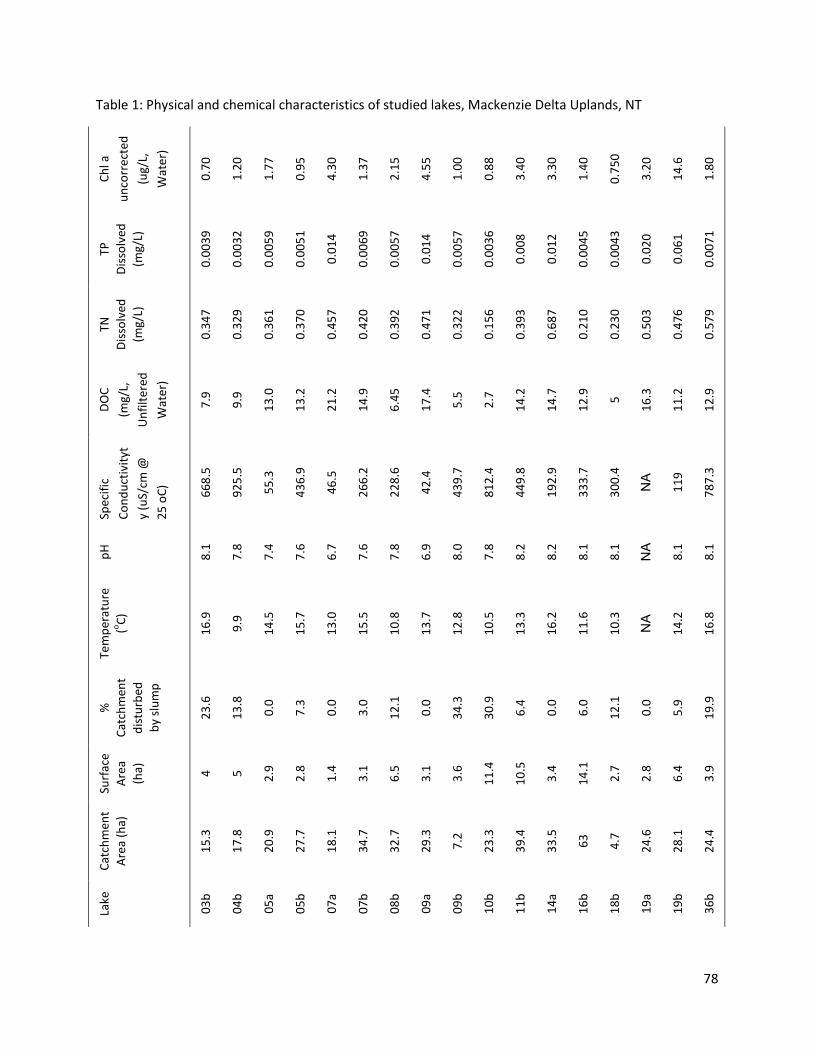
78
Table 1: Physical and chemical characteristics of studied lakes, Mackenzie Delta Uplands, NT C
hl a
un
corr
ecte
d
(ug/
L,
Wat
er)
0.7
0
1.2
0
1.7
7
0.9
5
4.3
0
1.3
7
2.1
5
4.5
5
1.0
0
0.8
8
3.4
0
3.3
0
1.4
0
0.7
50
3.2
0
14
.6
1.8
0
TP
Dis
solv
ed
(mg/
L)
0.0
03
9
0.0
03
2
0.0
05
9
0.0
05
1
0.0
14
0.0
06
9
0.0
05
7
0.0
14
0.0
05
7
0.0
03
6
0.0
08
0.0
12
0.0
04
5
0.0
04
3
0.0
20
0.0
61
0.0
07
1
TN
Dis
solv
ed
(mg/
L)
0.3
47
0.3
29
0.3
61
0.3
70
0.4
57
0.4
20
0.3
92
0.4
71
0.3
22
0.1
56
0.3
93
0.6
87
0.2
10
0.2
30
0.5
03
0.4
76
0.5
79
DO
C
(mg/
L,
Un
filt
ered
Wat
er)
7.9
9.9
13
.0
13
.2
21
.2
14
.9
6.4
5
17
.4
5.5
2.7
14
.2
14
.7
12
.9
5
16
.3
11
.2
12
.9
Spec
ific
Co
nd
uct
ivit
yt
y (u
S/cm
@
25
oC
)
66
8.5
92
5.5
55
.3
43
6.9
46
.5
26
6.2
22
8.6
42
.4
43
9.7
81
2.4
44
9.8
19
2.9
33
3.7
30
0.4
NA
11
9
78
7.3
pH
8.1
7.8
7.4
7.6
6.7
7.6
7.8
6.9
8.0
7.8
8.2
8.2
8.1
8.1
NA
8.1
8.1
Tem
per
atu
re
(oC
)
16
.9
9.9
14
.5
15
.7
13
.0
15
.5
10
.8
13
.7
12
.8
10
.5
13
.3
16
.2
11
.6
10
.3
NA
14
.2
16
.8
%
Cat
chm
ent
dis
turb
ed
by
slu
mp
23
.6
13
.8
0.0
7.3
0.0
3.0
12
.1
0.0
34
.3
30
.9
6.4
0.0
6.0
12
.1
0.0
5.9
19
.9
Surf
ace
Are
a
(ha)
4
5
2.9
2.8
1.4
3.1
6.5
3.1
3.6
11
.4
10
.5
3.4
14
.1
2.7
2.8
6.4
3.9
Cat
chm
ent
Are
a (h
a)
15
.3
17
.8
20
.9
27
.7
18
.1
34
.7
32
.7
29
.3
7.2
23
.3
39
.4
33
.5
63
4.7
24
.6
28
.1
24
.4
Lake
03
b
04
b
05
a
05
b
07
a
07
b
08
b
09
a
09
b
10
b
11
b
14
a
16
b
18
b
19
a
19
b
36
b
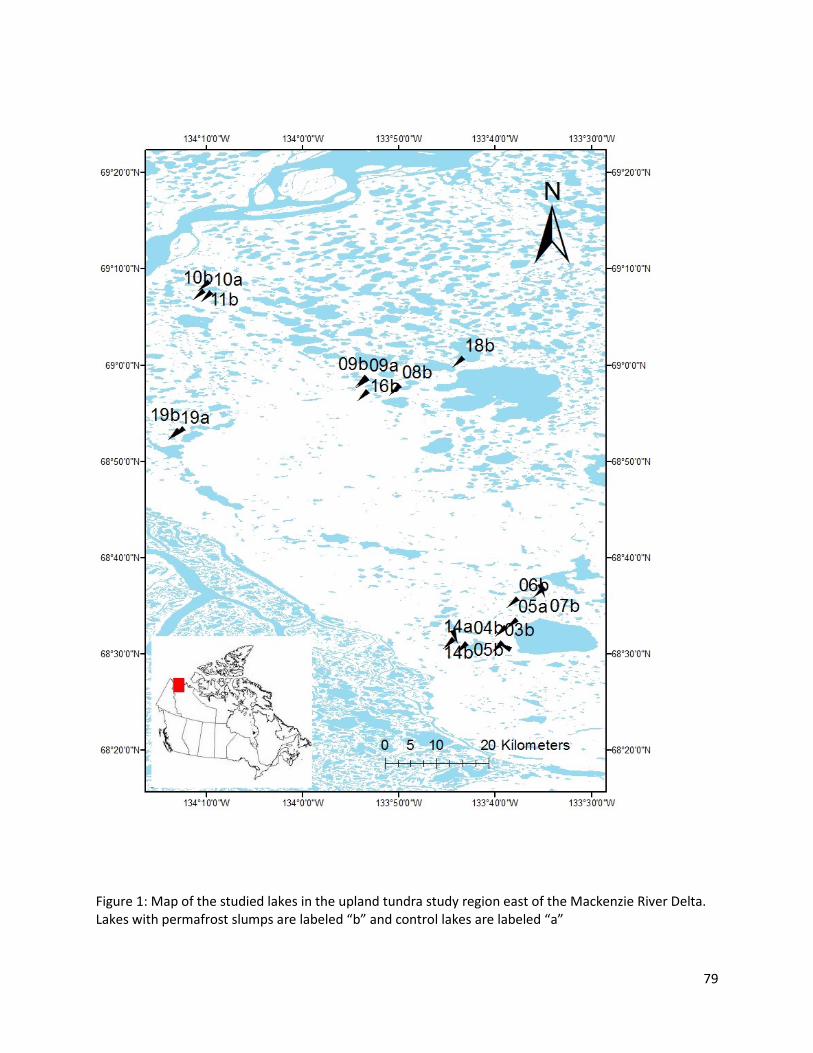
79
Figure 1: Map of the studied lakes in the upland tundra study region east of the Mackenzie River Delta. Lakes with permafrost slumps are labeled “b” and control lakes are labeled “a”
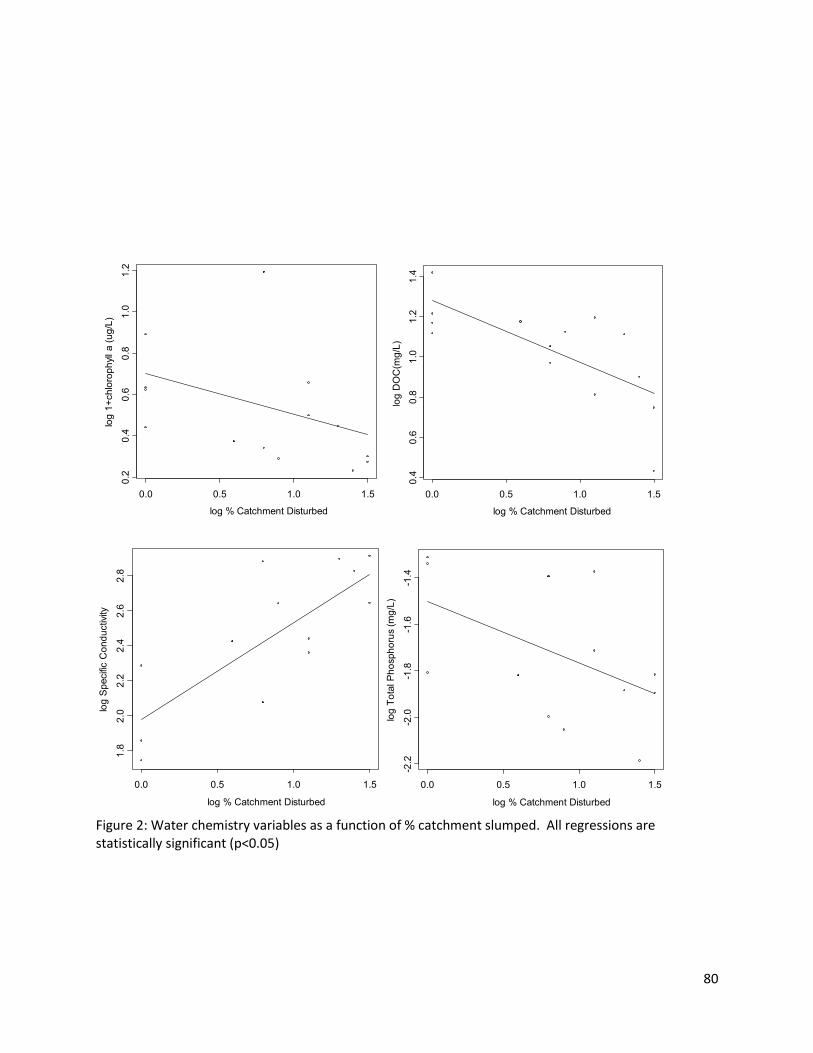
80
Figure 2: Water chemistry variables as a function of % catchment slumped. All regressions are statistically significant (p<0.05)
0.0 0.5 1.0 1.5
0.2
0.4
0.6
0.8
1.0
1.2
log % Catchment Disturbed
log
1+
ch
loro
ph
yll a (
ug
/L)
0.0 0.5 1.0 1.5
0.4
0.6
0.8
1.0
1.2
1.4
log % Catchment Disturbed
log
DO
C(m
g/L
)
0.0 0.5 1.0 1.5
1.8
2.0
2.2
2.4
2.6
2.8
log % Catchment Disturbed
log
Sp
ecifi
c C
on
du
ctiv
ity
0.0 0.5 1.0 1.5
-2.2
-2.0
-1.8
-1.6
-1.4
log % Catchment Disturbed
log
To
tal P
ho
sp
ho
rus (
mg
/L)
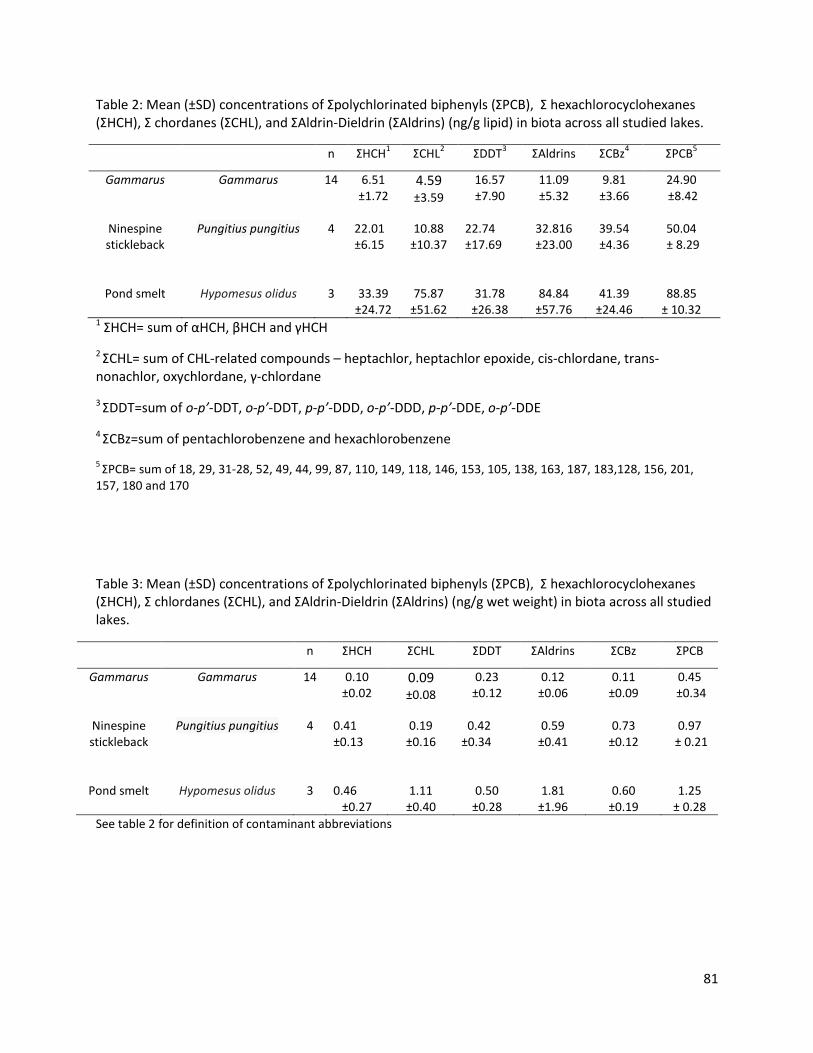
81
Table 2: Mean (±SD) concentrations of Σpolychlorinated biphenyls (ΣPCB), Σ hexachlorocyclohexanes (ΣHCH), Σ chordanes (ΣCHL), and ΣAldrin-Dieldrin (ΣAldrins) (ng/g lipid) in biota across all studied lakes.
n ΣHCH1
ΣCHL2
ΣDDT3
ΣAldrins
ΣCBz4
ΣPCB5
Gammarus Gammarus 14 6.51 ±1.72
4.59 ±3.59
16.57 ±7.90
11.09 ±5.32
9.81 ±3.66
24.90 ±8.42
Ninespine stickleback
Pungitius pungitius 4 22.01 ±6.15
10.88 ±10.37
22.74 ±17.69
32.816 ±23.00
39.54 ±4.36
50.04 ± 8.29
Pond smelt Hypomesus olidus 3 33.39 ±24.72
75.87 ±51.62
31.78 ±26.38
84.84 ±57.76
41.39 ±24.46
88.85 ± 10.32
1 ΣHCH= sum of αHCH, βHCH and γHCH
2 ΣCHL= sum of CHL-related compounds – heptachlor, heptachlor epoxide, cis-chlordane, trans-nonachlor, oxychlordane, γ-chlordane
3 ΣDDT=sum of o-p’-DDT, o-p’-DDT, p-p’-DDD, o-p’-DDD, p-p’-DDE, o-p’-DDE
4 ΣCBz=sum of pentachlorobenzene and hexachlorobenzene
5 ΣPCB= sum of 18, 29, 31-28, 52, 49, 44, 99, 87, 110, 149, 118, 146, 153, 105, 138, 163, 187, 183,128, 156, 201,
157, 180 and 170
Table 3: Mean (±SD) concentrations of Σpolychlorinated biphenyls (ΣPCB), Σ hexachlorocyclohexanes (ΣHCH), Σ chlordanes (ΣCHL), and ΣAldrin-Dieldrin (ΣAldrins) (ng/g wet weight) in biota across all studied lakes.
n ΣHCH ΣCHL ΣDDT ΣAldrins ΣCBz ΣPCB
Gammarus Gammarus 14 0.10 ±0.02
0.09 ±0.08
0.23 ±0.12
0.12 ±0.06
0.11 ±0.09
0.45 ±0.34
Ninespine stickleback
Pungitius pungitius 4 0.41 ±0.13
0.19 ±0.16
0.42 ±0.34
0.59 ±0.41
0.73 ±0.12
0.97 ± 0.21
Pond smelt Hypomesus olidus 3 0.46 ±0.27
1.11 ±0.40
0.50 ±0.28
1.81 ±1.96
0.60 ±0.19
1.25 ± 0.28
See table 2 for definition of contaminant abbreviations
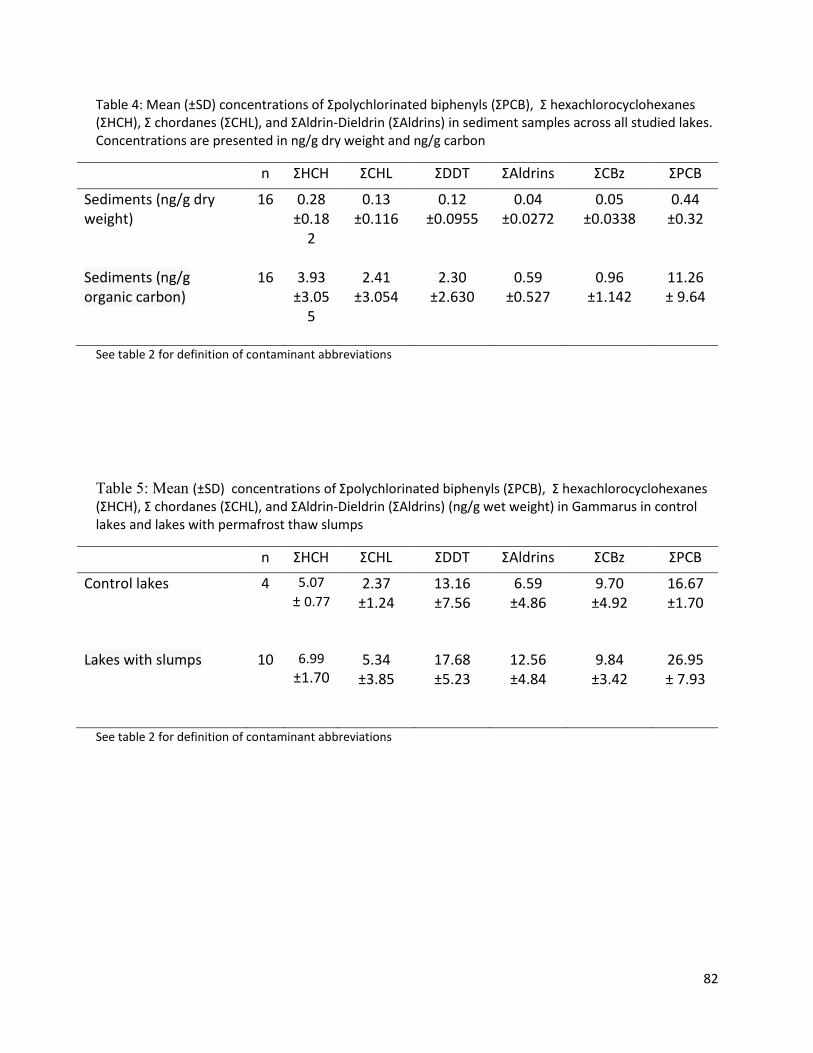
82
Table 4: Mean (±SD) concentrations of Σpolychlorinated biphenyls (ΣPCB), Σ hexachlorocyclohexanes (ΣHCH), Σ chordanes (ΣCHL), and ΣAldrin-Dieldrin (ΣAldrins) in sediment samples across all studied lakes. Concentrations are presented in ng/g dry weight and ng/g carbon
n ΣHCH ΣCHL ΣDDT ΣAldrins ΣCBz ΣPCB
Sediments (ng/g dry weight)
16 0.28 ±0.18
2
0.13 ±0.116
0.12 ±0.0955
0.04 ±0.0272
0.05 ±0.0338
0.44 ±0.32
Sediments (ng/g organic carbon)
16 3.93 ±3.05
5
2.41 ±3.054
2.30 ±2.630
0.59 ±0.527
0.96 ±1.142
11.26 ± 9.64
See table 2 for definition of contaminant abbreviations
Table 5: Mean (±SD) concentrations of Σpolychlorinated biphenyls (ΣPCB), Σ hexachlorocyclohexanes (ΣHCH), Σ chordanes (ΣCHL), and ΣAldrin-Dieldrin (ΣAldrins) (ng/g wet weight) in Gammarus in control lakes and lakes with permafrost thaw slumps
n ΣHCH ΣCHL ΣDDT ΣAldrins ΣCBz ΣPCB
Control lakes 4 5.07
± 0.77
2.37 ±1.24
13.16 ±7.56
6.59 ±4.86
9.70 ±4.92
16.67 ±1.70
Lakes with slumps 10 6.99
±1.70 5.34
±3.85
17.68 ±5.23
12.56 ±4.84
9.84 ±3.42
26.95 ± 7.93
See table 2 for definition of contaminant abbreviations
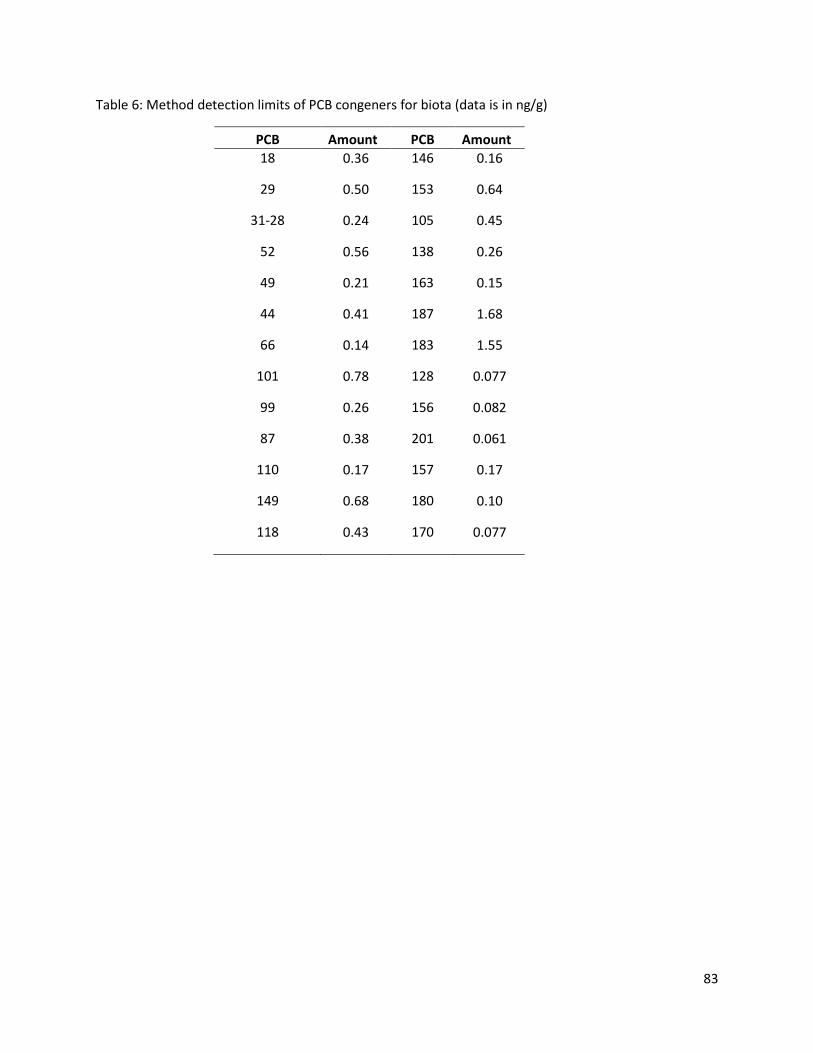
83
Table 6: Method detection limits of PCB congeners for biota (data is in ng/g)
PCB Amount PCB Amount
18 0.36 146 0.16
29 0.50 153 0.64
31-28 0.24 105 0.45
52 0.56 138 0.26
49 0.21 163 0.15
44 0.41 187 1.68
66 0.14 183 1.55
101 0.78 128 0.077
99 0.26 156 0.082
87 0.38 201 0.061
110 0.17 157 0.17
149 0.68 180 0.10
118 0.43 170 0.077
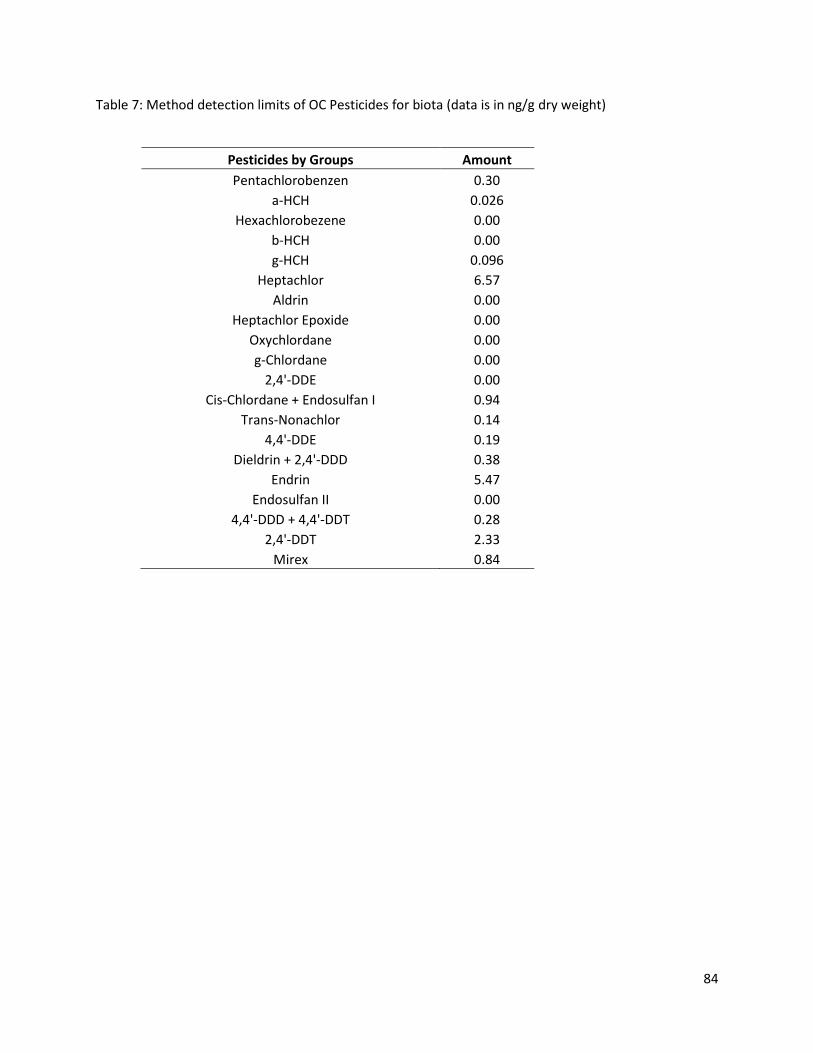
84
Table 7: Method detection limits of OC Pesticides for biota (data is in ng/g dry weight)
Pesticides by Groups Amount
Pentachlorobenzen 0.30
a-HCH 0.026
Hexachlorobezene 0.00
b-HCH 0.00
g-HCH 0.096
Heptachlor 6.57
Aldrin 0.00
Heptachlor Epoxide 0.00
Oxychlordane 0.00
g-Chlordane 0.00
2,4'-DDE 0.00
Cis-Chlordane + Endosulfan I 0.94
Trans-Nonachlor 0.14
4,4'-DDE 0.19
Dieldrin + 2,4'-DDD 0.38
Endrin 5.47
Endosulfan II 0.00
4,4'-DDD + 4,4'-DDT 0.28
2,4'-DDT 2.33
Mirex 0.84
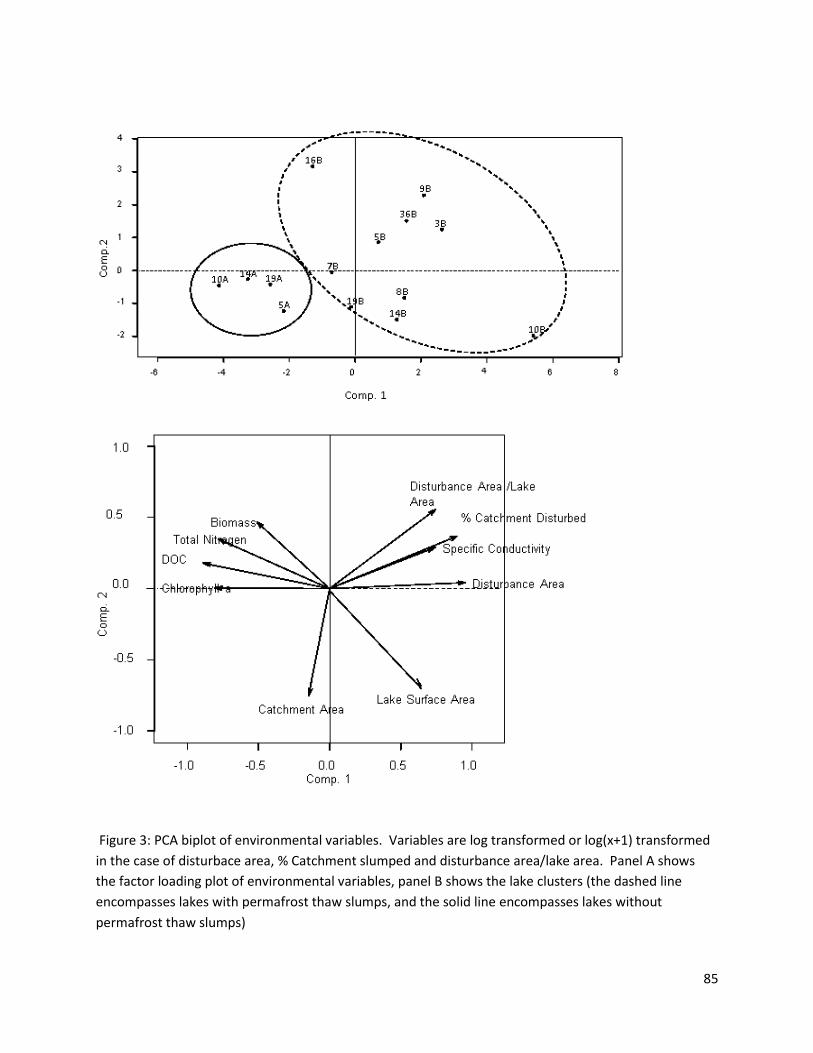
85
Figure 3: PCA biplot of environmental variables. Variables are log transformed or log(x+1) transformed
in the case of disturbace area, % Catchment slumped and disturbance area/lake area. Panel A shows
the factor loading plot of environmental variables, panel B shows the lake clusters (the dashed line
encompasses lakes with permafrost thaw slumps, and the solid line encompasses lakes without
permafrost thaw slumps)
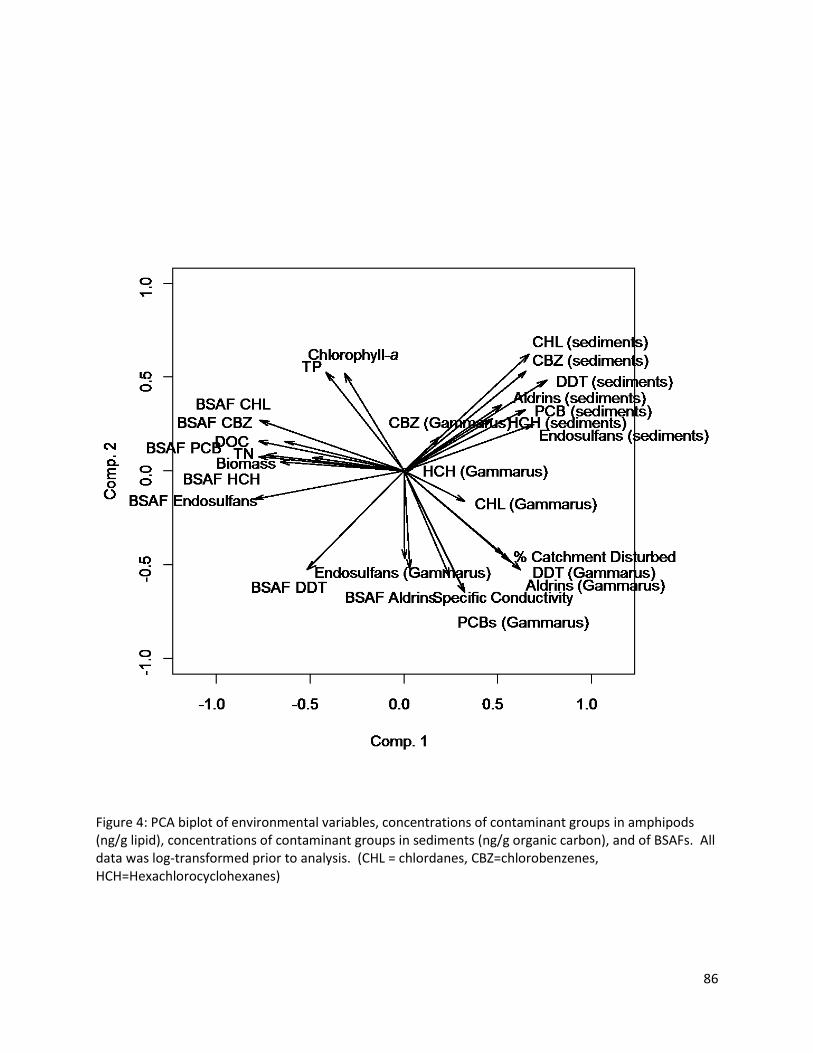
86
Figure 4: PCA biplot of environmental variables, concentrations of contaminant groups in amphipods (ng/g lipid), concentrations of contaminant groups in sediments (ng/g organic carbon), and of BSAFs. All data was log-transformed prior to analysis. (CHL = chlordanes, CBZ=chlorobenzenes, HCH=Hexachlorocyclohexanes)
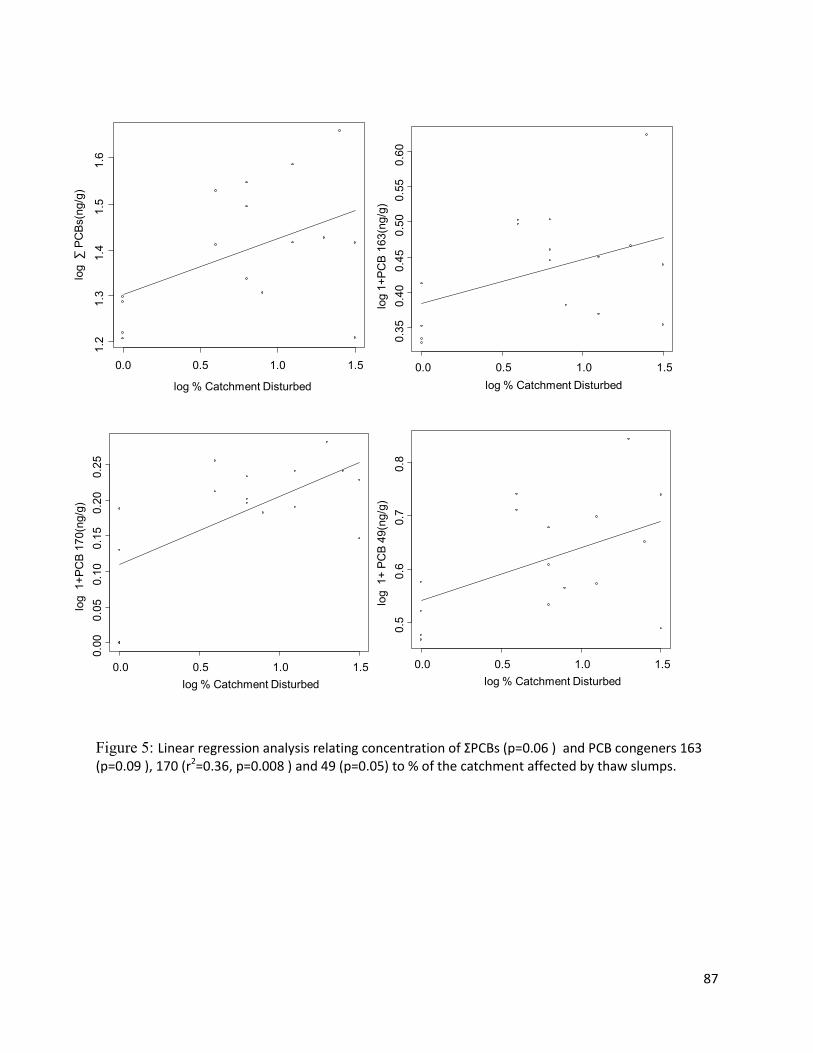
87
Figure 5: Linear regression analysis relating concentration of ΣPCBs (p=0.06 ) and PCB congeners 163 (p=0.09 ), 170 (r2=0.36, p=0.008 ) and 49 (p=0.05) to % of the catchment affected by thaw slumps.
0.0 0.5 1.0 1.5
1.2
1.3
1.4
1.5
1.6
log % Catchment Disturbed
log ∑
PC
Bs(n
g/g
)
0.0 0.5 1.0 1.5
0.3
50.4
00.4
50.5
00.5
50.6
0
log % Catchment Disturbedlo
g 1
+P
CB
163(n
g/g
)
0.0 0.5 1.0 1.5
0.0
00.0
50.1
00.1
50.2
00.2
5
log % Catchment Disturbed
log 1+
PC
B 1
70(n
g/g
)
0.0 0.5 1.0 1.5
0.5
0.6
0.7
0.8
log % Catchment Disturbed
log 1+
PC
B 4
9(n
g/g
)
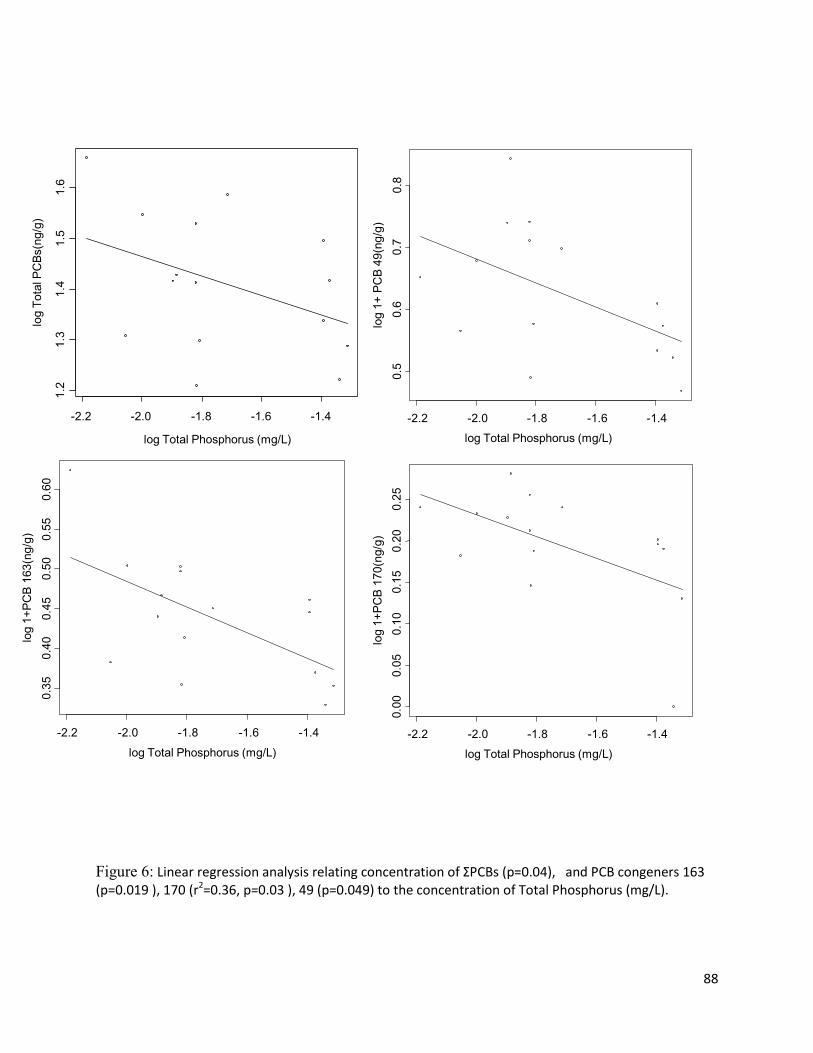
88
Figure 6: Linear regression analysis relating concentration of ΣPCBs (p=0.04), and PCB congeners 163 (p=0.019 ), 170 (r2=0.36, p=0.03 ), 49 (p=0.049) to the concentration of Total Phosphorus (mg/L).
-2.2 -2.0 -1.8 -1.6 -1.4
0.3
50.4
00.4
50.5
00.5
50.6
0
log Total Phosphorus (mg/L)
log 1
+P
CB
163(n
g/g
)
-2.2 -2.0 -1.8 -1.6 -1.4
0.0
00.0
50.1
00.1
50.2
00.2
5
log Total Phosphorus (mg/L)
log 1
+P
CB
170(n
g/g
)
-2.2 -2.0 -1.8 -1.6 -1.4
0.5
0.6
0.7
0.8
log Total Phosphorus (mg/L)
log 1
+ P
CB
49(n
g/g
)
-2.2 -2.0 -1.8 -1.6 -1.4
1.2
1.3
1.4
1.5
1.6
log Total Phosphorus (mg/L)
log T
ota
l P
CB
s(n
g/g
)
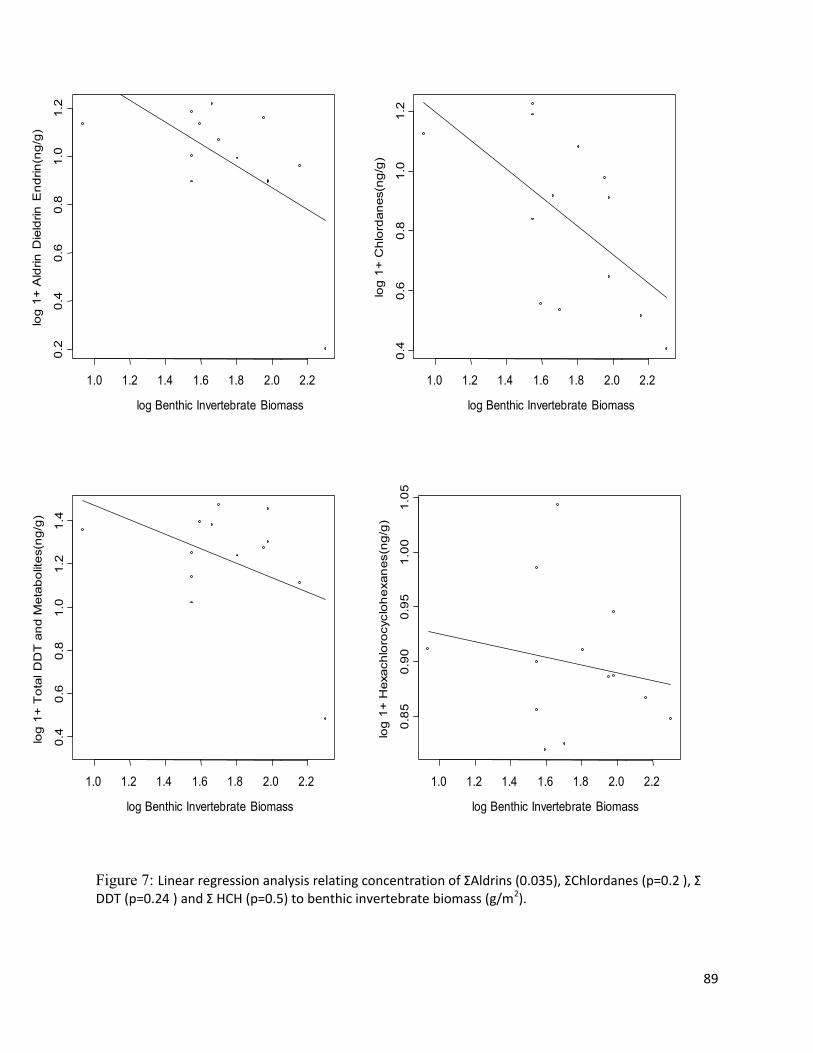
89
Figure 7: Linear regression analysis relating concentration of ΣAldrins (0.035), ΣChlordanes (p=0.2 ), Σ DDT (p=0.24 ) and Σ HCH (p=0.5) to benthic invertebrate biomass (g/m2).
1.0 1.2 1.4 1.6 1.8 2.0 2.2
0.2
0.4
0.6
0.8
1.0
1.2
log Benthic Invertebrate Biomass
log
1+
Ald
rin
Die
ldrin
En
drin
(ng
/g)
1.0 1.2 1.4 1.6 1.8 2.0 2.2
0.4
0.6
0.8
1.0
1.2
log Benthic Invertebrate Biomass
log
1+
Ch
lord
an
es(n
g/g
)
1.0 1.2 1.4 1.6 1.8 2.0 2.2
0.8
50
.90
0.9
51
.00
1.0
5
log Benthic Invertebrate Biomass
log
1+
Hexach
loro
cyclo
he
xan
es(n
g/g
)
1.0 1.2 1.4 1.6 1.8 2.0 2.2
0.4
0.6
0.8
1.0
1.2
1.4
log Benthic Invertebrate Biomass
log
1+
To
tal D
DT
an
d M
eta
bo
lite
s(n
g/g
)
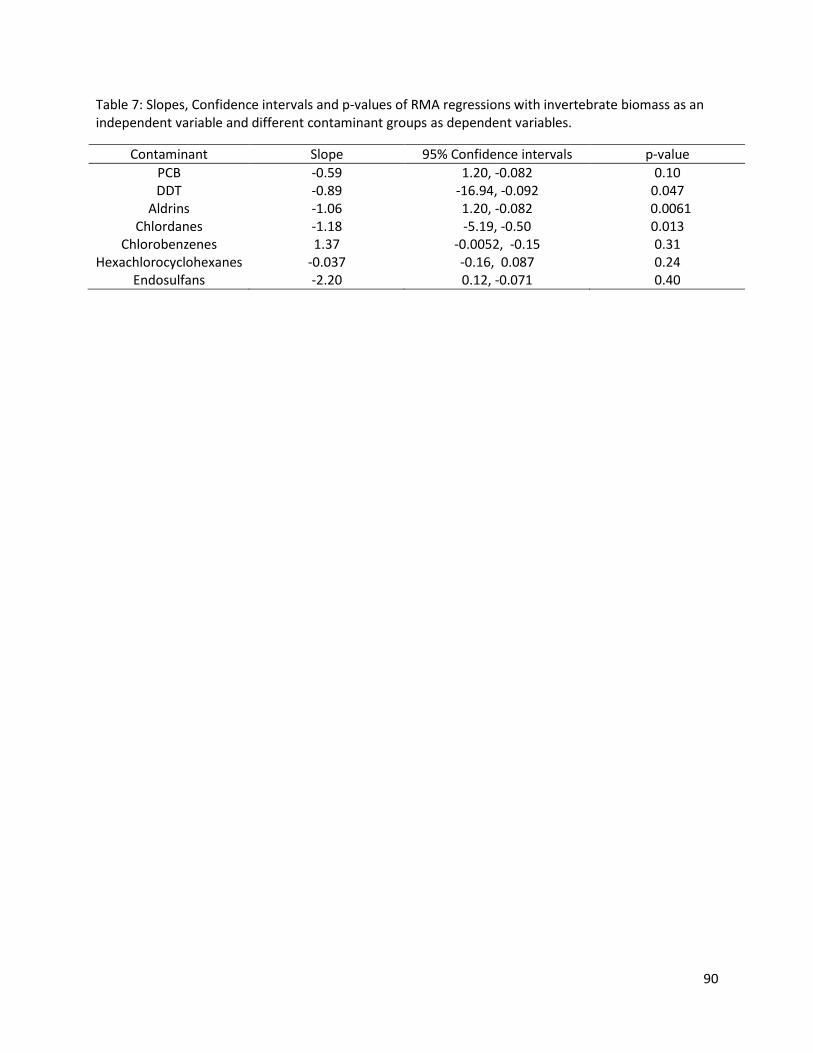
90
Table 7: Slopes, Confidence intervals and p-values of RMA regressions with invertebrate biomass as an independent variable and different contaminant groups as dependent variables.
Contaminant Slope 95% Confidence intervals p-value
PCB -0.59 1.20, -0.082 0.10 DDT -0.89 -16.94, -0.092 0.047
Aldrins -1.06 1.20, -0.082 0.0061 Chlordanes -1.18 -5.19, -0.50 0.013
Chlorobenzenes 1.37 -0.0052, -0.15 0.31 Hexachlorocyclohexanes -0.037 -0.16, 0.087 0.24
Endosulfans -2.20 0.12, -0.071 0.40
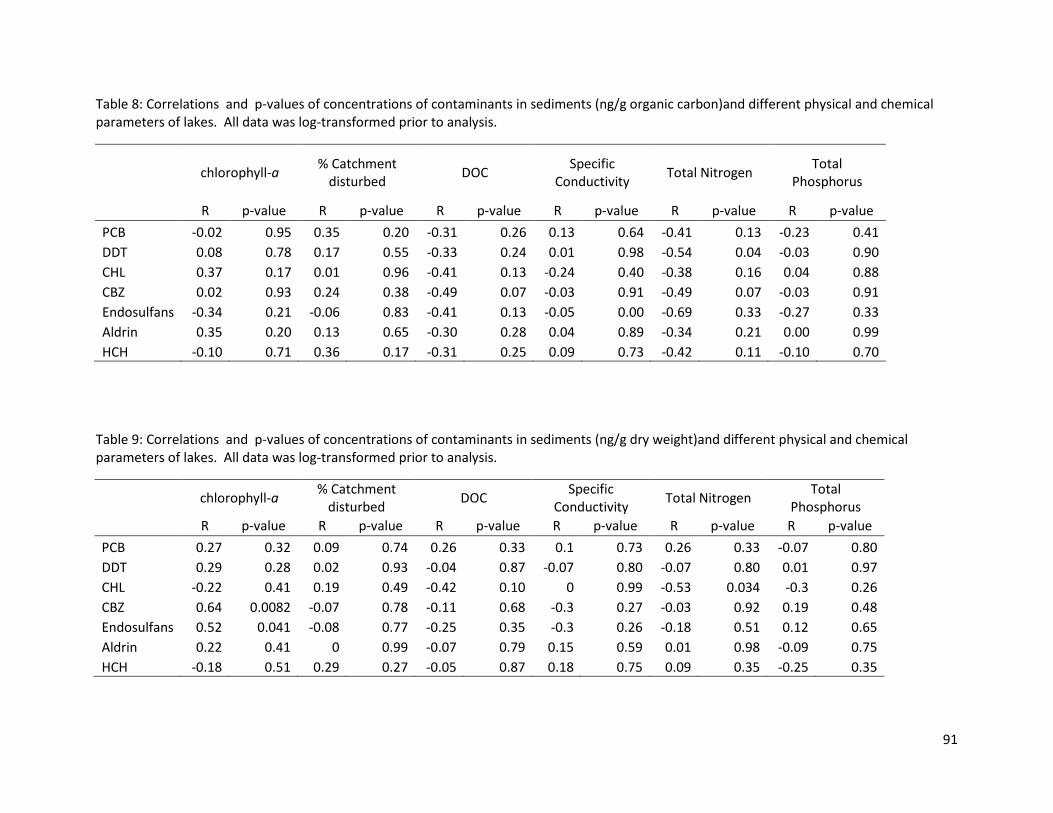
91
Table 8: Correlations and p-values of concentrations of contaminants in sediments (ng/g organic carbon)and different physical and chemical parameters of lakes. All data was log-transformed prior to analysis.
chlorophyll-a % Catchment
disturbed DOC
Specific Conductivity
Total Nitrogen Total
Phosphorus
R p-value R p-value R p-value R p-value R p-value R p-value
PCB -0.02 0.95 0.35 0.20 -0.31 0.26 0.13 0.64 -0.41 0.13 -0.23 0.41
DDT 0.08 0.78 0.17 0.55 -0.33 0.24 0.01 0.98 -0.54 0.04 -0.03 0.90
CHL 0.37 0.17 0.01 0.96 -0.41 0.13 -0.24 0.40 -0.38 0.16 0.04 0.88
CBZ 0.02 0.93 0.24 0.38 -0.49 0.07 -0.03 0.91 -0.49 0.07 -0.03 0.91
Endosulfans -0.34 0.21 -0.06 0.83 -0.41 0.13 -0.05 0.00 -0.69 0.33 -0.27 0.33
Aldrin 0.35 0.20 0.13 0.65 -0.30 0.28 0.04 0.89 -0.34 0.21 0.00 0.99
HCH -0.10 0.71 0.36 0.17 -0.31 0.25 0.09 0.73 -0.42 0.11 -0.10 0.70
Table 9: Correlations and p-values of concentrations of contaminants in sediments (ng/g dry weight)and different physical and chemical parameters of lakes. All data was log-transformed prior to analysis.
chlorophyll-a
% Catchment disturbed
DOC Specific
Conductivity Total Nitrogen
Total Phosphorus
R p-value R p-value R p-value R p-value R p-value R p-value
PCB 0.27 0.32 0.09 0.74 0.26 0.33 0.1 0.73 0.26 0.33 -0.07 0.80
DDT 0.29 0.28 0.02 0.93 -0.04 0.87 -0.07 0.80 -0.07 0.80 0.01 0.97
CHL -0.22 0.41 0.19 0.49 -0.42 0.10 0 0.99 -0.53 0.034 -0.3 0.26
CBZ 0.64 0.0082 -0.07 0.78 -0.11 0.68 -0.3 0.27 -0.03 0.92 0.19 0.48
Endosulfans 0.52 0.041 -0.08 0.77 -0.25 0.35 -0.3 0.26 -0.18 0.51 0.12 0.65
Aldrin 0.22 0.41 0 0.99 -0.07 0.79 0.15 0.59 0.01 0.98 -0.09 0.75
HCH -0.18 0.51 0.29 0.27 -0.05 0.87 0.18 0.75 0.09 0.35 -0.25 0.35
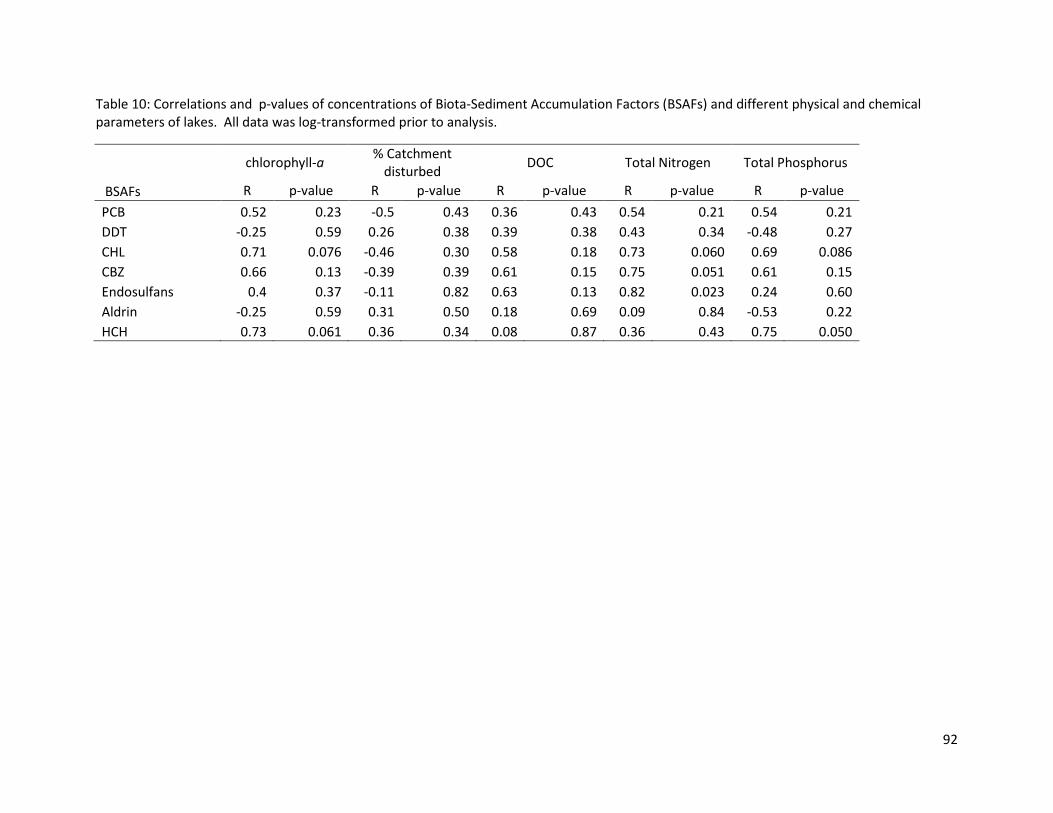
92
Table 10: Correlations and p-values of concentrations of Biota-Sediment Accumulation Factors (BSAFs) and different physical and chemical parameters of lakes. All data was log-transformed prior to analysis.
chlorophyll-a
% Catchment disturbed
DOC Total Nitrogen Total Phosphorus
BSAFs R p-value R p-value R p-value R p-value R p-value
PCB 0.52 0.23 -0.5 0.43 0.36 0.43 0.54 0.21 0.54 0.21
DDT -0.25 0.59 0.26 0.38 0.39 0.38 0.43 0.34 -0.48 0.27
CHL 0.71 0.076 -0.46 0.30 0.58 0.18 0.73 0.060 0.69 0.086
CBZ 0.66 0.13 -0.39 0.39 0.61 0.15 0.75 0.051 0.61 0.15
Endosulfans 0.4 0.37 -0.11 0.82 0.63 0.13 0.82 0.023 0.24 0.60
Aldrin -0.25 0.59 0.31 0.50 0.18 0.69 0.09 0.84 -0.53 0.22
HCH 0.73 0.061 0.36 0.34 0.08 0.87 0.36 0.43 0.75 0.050
93
General Conclusions
There is evidence of permafrost warming and degradation throughout high latitudes of North America (Lemke et al. 2007). The results
of such wide-spread permafrost degradation are likely to affect the flora and fauna in all arctic habitats, along with human infrastructure and
communities. The study of the effect of permafrost thaw slumps on aquatic communities allows researchers to examine how thawed
permafrost material affects lakes, while simultaneously allowing for comparison with lakes that are not affected by thaw. Results presented in
chapters one and two allow to better quantify and understand ecological impacts associated with permafrost thaw slumping.
Retrogressive permafrost thaw slumps, which are increasing in frequency in the Arctic in a warmer climate, have an indirect effect on
benthic invertebrate assemblages in small lakes, and on the concentrations of contaminants in the amphipod Gammarus. Most changes are
related to the impact of permafrost thaw slumps on nutrients in the water column, which in turn lead to altered productivity. Water chemistry
concetration presented here corroborates past research. Total nitrogen, total phosphorus and chlorophyll-a were lowered by thaw slump
material entering lake water. In contrast, specific conductivity and certain major ions (Ca, Mg, Na, K, SO42-, CO3
2-, and HCO3-) increased in lakes
with permafrost thaw slumps influenced by the input of ion-rich clays from slump material. DOC and humic substances in the water column are
lower in lakes with slumps, which was likely a result of increased specific conductivity and ionic content of water, causing these substances to
flocculate out to the sediments (Thompson et al. 2008). These changes lead do decreased algal productivity and lower chlorophyll-a in lake
water. The effects of thaw slumps on lakes were also found to impact the benthic communities of lakes.
I showed how benthic invertebrate density and biomasses, and the size-structure of benthic communities, are changed following thaw
slump formation (Chapter 1). Average density and average biomass per lake tended to decrease with decreased nutrient level of lakes, and
lakes which had higher levels of chlorophyll-a, total dissolved nitrogen and total phosphorus generally had higher average benthic invertebrate
94
density and biomass. Average density and average biomass per lake were not directly correlated with % catchment disturbed, but were
significantly related to the size of the permafrost thaw slump. Analysis of the constructed size spectrum suggests that the concentration of
nitrogen in the water column has an over-all positive effect on the biomass of invertebrates in most size classes, though the increase was less
significant for the biomass of larger size classes.
The size-spectrum also suggests that slumping has an over-all negative effect on the invertebrate community size structure, though
different size classes responded differently to the presence of slumps: the density of small invertebrates is reduced in lakes with large
disturbances, but this reduction is less important for large invertebrates. This differential response by small and large invertebrates to slumping
and nitrogen concentrations could be due to increased macrophyte biomass in slumped lakes. Nitrogen tends to increase invertebrate density
and biomass of invertebrates in smaller size classes. For medium –large size classes, nitrogen had a negative effect on invertebrate density,
whereas slump size had a positive effect on invertebrate density. The positive effect due to slumping on larger size classes is possibly linked to
the higher biomass of macrophytes in lakes with thaw slumps (Mesquita et al. 2010). The largest invertebrates collected (snails and amphipods)
are also those that tend to prefer macrophyte habitats. The spill-over of these larger invertebrates from macrophytes onto open sediments
might therefore account for the higher abundance of large size classes in lakes with slumps and low total nitrogen. There might also be
migration from the open sediments to macrophytes of some of the smaller invertebrates, potentially explaining the negative impact of thaw
slumps on benthic invertebrate biomass of small invertebrates.
In Chapter 2, I showed that the presence of permafrost thaw slumps on lake banks is linked to increased contaminant burdens in
Gammarus. Lakes with slumps tended to have higher chlorophyll a and invertebrate biomass (as established in Chapter 2). Here, I found that
lakes without slumps (those with higher productivity and invertebrate biomass) tended to have lower concentrations of contaminants in the
amphipod Gammarus (1.07 – 1.7x higher concentrations in lakes without thaw slumps). This is likely due to biomass dilution, as contaminant
burdens per unit biomass are decreased when higher biomass is present. There were no such trends for fish, though very few lakes contained
fish and no definitive conclusions could be drawn.
95
Concentrations of carbon corrected contaminants in surficial sediments along lake banks were negatively correlated to Nitrogen in lake
water when combining p-values with Fisher’s method. Though it was already known that sediments in lakes affected by thaw slumps are
physically altered by slump material (Deison et al. 2012), this study may serve as confirmation that slumps alter lakes sufficiently to impact
contaminant uptake and elimination in amphipods. Likewise, Biota-sediment accumulation factors showed positive trends with slumping,
possibly indicating that the composition of sediments is being altered by thaw slumps, and decreasing the uptake of contaminants from
sediments.
Further research is also needed to assess the impact of permafrost thaw slumps on biota. Benthic invertebrates should be sampled from
different habitat types in lakes. Because macrophytes may be more abundant in lakes with slumps, sampling benthic invertebrates from
macrophytes may give a more complete picture of how benthic communities are changing in the entire lake. If macrophytes are increasing in
abundance in lakes with permafrost thaw slumps, it would also be interesting to measure contaminant loads in macrophytes. This would allow
us to assess if the increasing macrophyte biomass in lakes with slumps is taking a significant amount of contaminant from the water column. If
possible, it would also be interesting to widen the data set and sample a larger selection of lakes. While 16 lakes can indicate some trends,
having more would increase the power of the analysis and likely allow us to detect stronger correlations.
Results of this thesis used in conjunction with other work being done currently on lakes affected by permafrost thaw slumping will no
doubt be a useful tool for assessing how aquatic communities will change with a warming Arctic, and how contaminant uptake and
concentrations in biota are likely to change. Other research currently being conducted on these lakes will help give a clearer picture of how
permafrost thaw slumps are affecting different components of the system. Sediment cores from these lakes are currently being analyzed and
are indicating that algal scavenging is not increasing contaminant loads in lakes because over-all fluxes of contaminants into slumped and control
96
lakes were not significantly different even though algal productivity was higher in lakes without slumps (Eickmeyer, unpublished). This work also
indicates that over-all, concentrations of TOC normalized contaminants were higher in sediments of lakes with slumps, though this is likely
because there is simply less organic carbon in sediments of lakes with slumps. Studies are also being conducted on concentrations of
contaminants in lake water (Houben, unpublished). Once we have data for all different components of the system, further analysis and
modelling of these lakes will be possible.
Though this thesis studied only a specific kind of permafrost thaw, the results of this thesis demonstrate how changing arctic climate has
the potential to significantly alter different aspects of freshwater systems in the Arctic. Not all permafrost thaw will occur in the same type of
permafrost terrain, and therefore may have different impacts on lake chemistry and biota. However, these results shed light on the potential
wide-spread impact of permafrost thaw on freshwater systems.
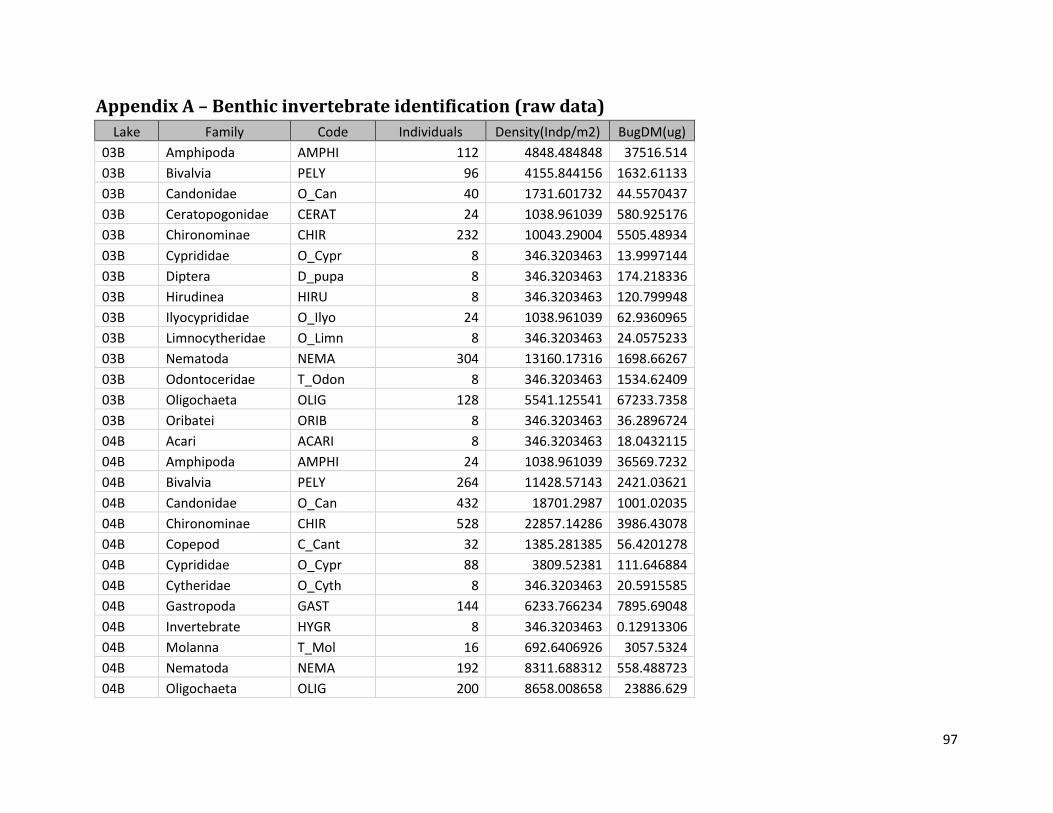
97
Appendix A – Benthic invertebrate identification (raw data)
Lake Family Code Individuals Density(Indp/m2) BugDM(ug)
03B Amphipoda AMPHI 112 4848.484848 37516.514
03B Bivalvia PELY 96 4155.844156 1632.61133
03B Candonidae O_Can 40 1731.601732 44.5570437
03B Ceratopogonidae CERAT 24 1038.961039 580.925176
03B Chironominae CHIR 232 10043.29004 5505.48934
03B Cyprididae O_Cypr 8 346.3203463 13.9997144
03B Diptera D_pupa 8 346.3203463 174.218336
03B Hirudinea HIRU 8 346.3203463 120.799948
03B Ilyocyprididae O_Ilyo 24 1038.961039 62.9360965
03B Limnocytheridae O_Limn 8 346.3203463 24.0575233
03B Nematoda NEMA 304 13160.17316 1698.66267
03B Odontoceridae T_Odon 8 346.3203463 1534.62409
03B Oligochaeta OLIG 128 5541.125541 67233.7358
03B Oribatei ORIB 8 346.3203463 36.2896724
04B Acari ACARI 8 346.3203463 18.0432115
04B Amphipoda AMPHI 24 1038.961039 36569.7232
04B Bivalvia PELY 264 11428.57143 2421.03621
04B Candonidae O_Can 432 18701.2987 1001.02035
04B Chironominae CHIR 528 22857.14286 3986.43078
04B Copepod C_Cant 32 1385.281385 56.4201278
04B Cyprididae O_Cypr 88 3809.52381 111.646884
04B Cytheridae O_Cyth 8 346.3203463 20.5915585
04B Gastropoda GAST 144 6233.766234 7895.69048
04B Invertebrate HYGR 8 346.3203463 0.12913306
04B Molanna T_Mol 16 692.6406926 3057.5324
04B Nematoda NEMA 192 8311.688312 558.488723
04B Oligochaeta OLIG 200 8658.008658 23886.629
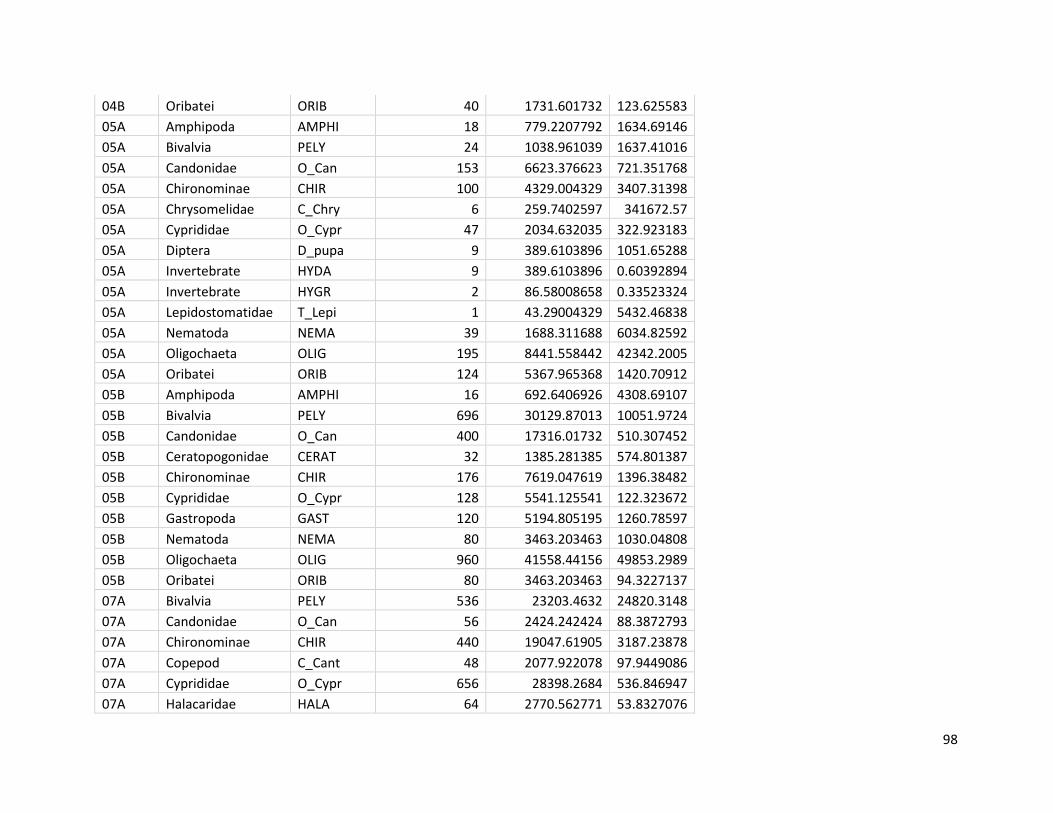
98
04B Oribatei ORIB 40 1731.601732 123.625583
05A Amphipoda AMPHI 18 779.2207792 1634.69146
05A Bivalvia PELY 24 1038.961039 1637.41016
05A Candonidae O_Can 153 6623.376623 721.351768
05A Chironominae CHIR 100 4329.004329 3407.31398
05A Chrysomelidae C_Chry 6 259.7402597 341672.57
05A Cyprididae O_Cypr 47 2034.632035 322.923183
05A Diptera D_pupa 9 389.6103896 1051.65288
05A Invertebrate HYDA 9 389.6103896 0.60392894
05A Invertebrate HYGR 2 86.58008658 0.33523324
05A Lepidostomatidae T_Lepi 1 43.29004329 5432.46838
05A Nematoda NEMA 39 1688.311688 6034.82592
05A Oligochaeta OLIG 195 8441.558442 42342.2005
05A Oribatei ORIB 124 5367.965368 1420.70912
05B Amphipoda AMPHI 16 692.6406926 4308.69107
05B Bivalvia PELY 696 30129.87013 10051.9724
05B Candonidae O_Can 400 17316.01732 510.307452
05B Ceratopogonidae CERAT 32 1385.281385 574.801387
05B Chironominae CHIR 176 7619.047619 1396.38482
05B Cyprididae O_Cypr 128 5541.125541 122.323672
05B Gastropoda GAST 120 5194.805195 1260.78597
05B Nematoda NEMA 80 3463.203463 1030.04808
05B Oligochaeta OLIG 960 41558.44156 49853.2989
05B Oribatei ORIB 80 3463.203463 94.3227137
07A Bivalvia PELY 536 23203.4632 24820.3148
07A Candonidae O_Can 56 2424.242424 88.3872793
07A Chironominae CHIR 440 19047.61905 3187.23878
07A Copepod C_Cant 48 2077.922078 97.9449086
07A Cyprididae O_Cypr 656 28398.2684 536.846947
07A Halacaridae HALA 64 2770.562771 53.8327076
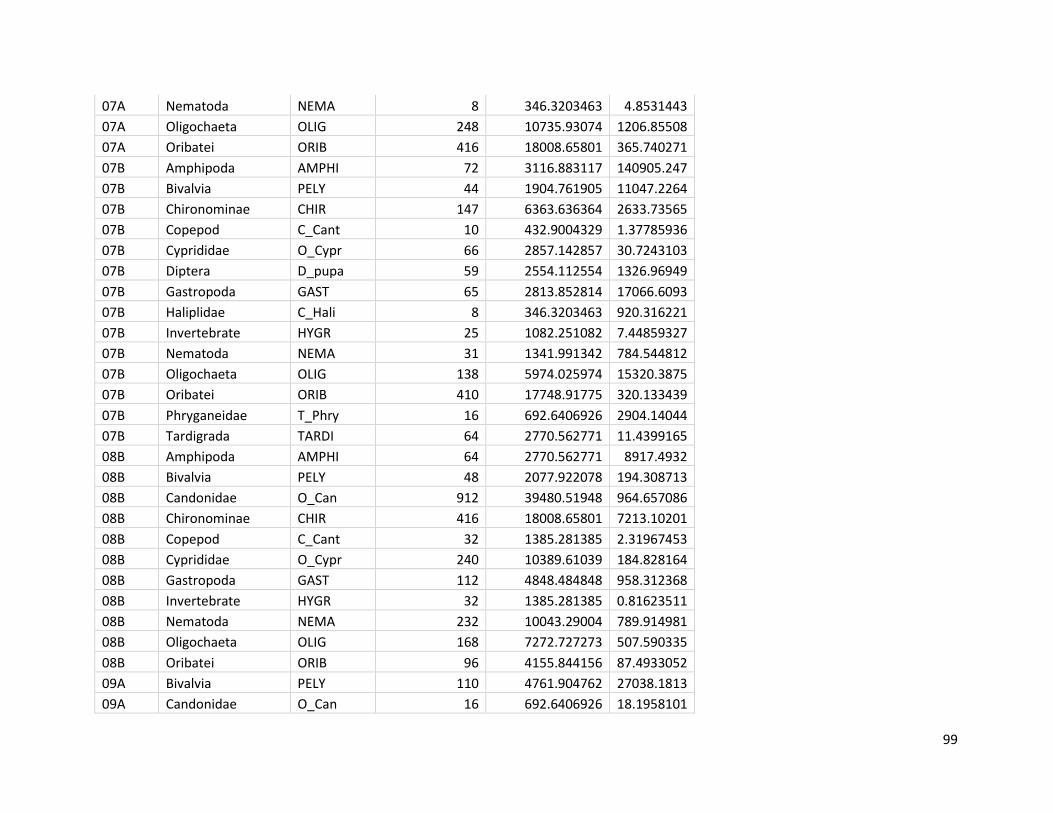
99
07A Nematoda NEMA 8 346.3203463 4.8531443
07A Oligochaeta OLIG 248 10735.93074 1206.85508
07A Oribatei ORIB 416 18008.65801 365.740271
07B Amphipoda AMPHI 72 3116.883117 140905.247
07B Bivalvia PELY 44 1904.761905 11047.2264
07B Chironominae CHIR 147 6363.636364 2633.73565
07B Copepod C_Cant 10 432.9004329 1.37785936
07B Cyprididae O_Cypr 66 2857.142857 30.7243103
07B Diptera D_pupa 59 2554.112554 1326.96949
07B Gastropoda GAST 65 2813.852814 17066.6093
07B Haliplidae C_Hali 8 346.3203463 920.316221
07B Invertebrate HYGR 25 1082.251082 7.44859327
07B Nematoda NEMA 31 1341.991342 784.544812
07B Oligochaeta OLIG 138 5974.025974 15320.3875
07B Oribatei ORIB 410 17748.91775 320.133439
07B Phryganeidae T_Phry 16 692.6406926 2904.14044
07B Tardigrada TARDI 64 2770.562771 11.4399165
08B Amphipoda AMPHI 64 2770.562771 8917.4932
08B Bivalvia PELY 48 2077.922078 194.308713
08B Candonidae O_Can 912 39480.51948 964.657086
08B Chironominae CHIR 416 18008.65801 7213.10201
08B Copepod C_Cant 32 1385.281385 2.31967453
08B Cyprididae O_Cypr 240 10389.61039 184.828164
08B Gastropoda GAST 112 4848.484848 958.312368
08B Invertebrate HYGR 32 1385.281385 0.81623511
08B Nematoda NEMA 232 10043.29004 789.914981
08B Oligochaeta OLIG 168 7272.727273 507.590335
08B Oribatei ORIB 96 4155.844156 87.4933052
09A Bivalvia PELY 110 4761.904762 27038.1813
09A Candonidae O_Can 16 692.6406926 18.1958101
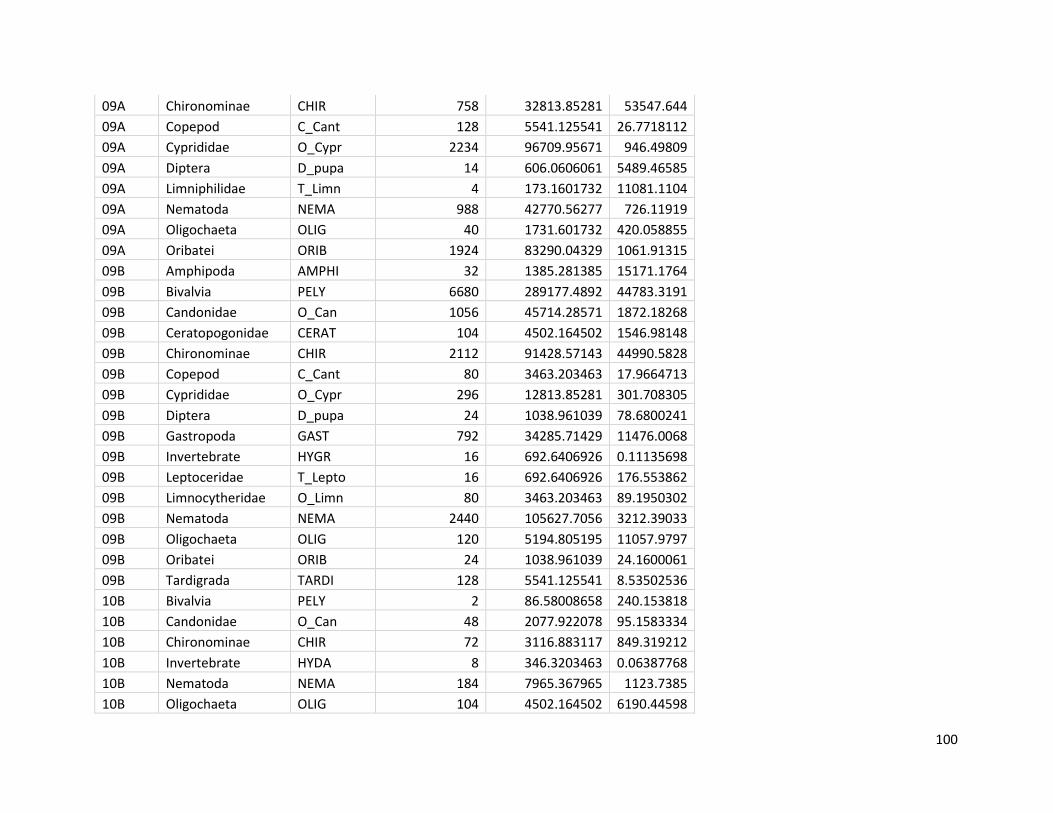
100
09A Chironominae CHIR 758 32813.85281 53547.644
09A Copepod C_Cant 128 5541.125541 26.7718112
09A Cyprididae O_Cypr 2234 96709.95671 946.49809
09A Diptera D_pupa 14 606.0606061 5489.46585
09A Limniphilidae T_Limn 4 173.1601732 11081.1104
09A Nematoda NEMA 988 42770.56277 726.11919
09A Oligochaeta OLIG 40 1731.601732 420.058855
09A Oribatei ORIB 1924 83290.04329 1061.91315
09B Amphipoda AMPHI 32 1385.281385 15171.1764
09B Bivalvia PELY 6680 289177.4892 44783.3191
09B Candonidae O_Can 1056 45714.28571 1872.18268
09B Ceratopogonidae CERAT 104 4502.164502 1546.98148
09B Chironominae CHIR 2112 91428.57143 44990.5828
09B Copepod C_Cant 80 3463.203463 17.9664713
09B Cyprididae O_Cypr 296 12813.85281 301.708305
09B Diptera D_pupa 24 1038.961039 78.6800241
09B Gastropoda GAST 792 34285.71429 11476.0068
09B Invertebrate HYGR 16 692.6406926 0.11135698
09B Leptoceridae T_Lepto 16 692.6406926 176.553862
09B Limnocytheridae O_Limn 80 3463.203463 89.1950302
09B Nematoda NEMA 2440 105627.7056 3212.39033
09B Oligochaeta OLIG 120 5194.805195 11057.9797
09B Oribatei ORIB 24 1038.961039 24.1600061
09B Tardigrada TARDI 128 5541.125541 8.53502536
10B Bivalvia PELY 2 86.58008658 240.153818
10B Candonidae O_Can 48 2077.922078 95.1583334
10B Chironominae CHIR 72 3116.883117 849.319212
10B Invertebrate HYDA 8 346.3203463 0.06387768
10B Nematoda NEMA 184 7965.367965 1123.7385
10B Oligochaeta OLIG 104 4502.164502 6190.44598
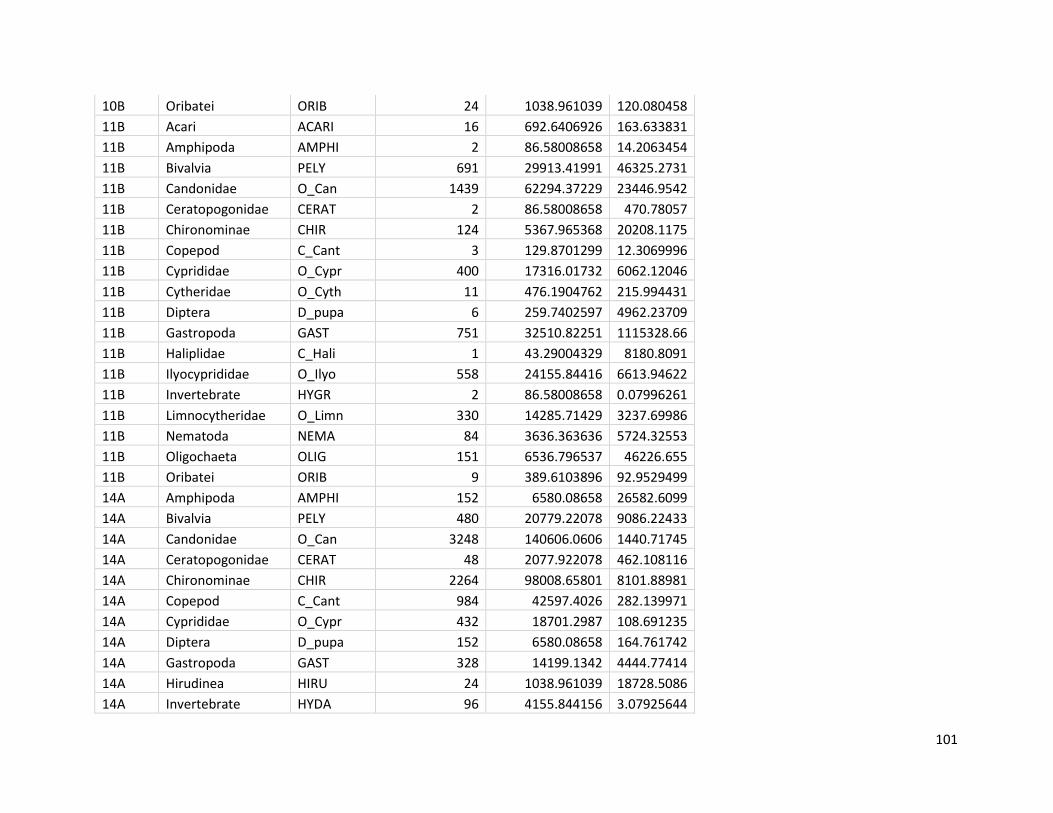
101
10B Oribatei ORIB 24 1038.961039 120.080458
11B Acari ACARI 16 692.6406926 163.633831
11B Amphipoda AMPHI 2 86.58008658 14.2063454
11B Bivalvia PELY 691 29913.41991 46325.2731
11B Candonidae O_Can 1439 62294.37229 23446.9542
11B Ceratopogonidae CERAT 2 86.58008658 470.78057
11B Chironominae CHIR 124 5367.965368 20208.1175
11B Copepod C_Cant 3 129.8701299 12.3069996
11B Cyprididae O_Cypr 400 17316.01732 6062.12046
11B Cytheridae O_Cyth 11 476.1904762 215.994431
11B Diptera D_pupa 6 259.7402597 4962.23709
11B Gastropoda GAST 751 32510.82251 1115328.66
11B Haliplidae C_Hali 1 43.29004329 8180.8091
11B Ilyocyprididae O_Ilyo 558 24155.84416 6613.94622
11B Invertebrate HYGR 2 86.58008658 0.07996261
11B Limnocytheridae O_Limn 330 14285.71429 3237.69986
11B Nematoda NEMA 84 3636.363636 5724.32553
11B Oligochaeta OLIG 151 6536.796537 46226.655
11B Oribatei ORIB 9 389.6103896 92.9529499
14A Amphipoda AMPHI 152 6580.08658 26582.6099
14A Bivalvia PELY 480 20779.22078 9086.22433
14A Candonidae O_Can 3248 140606.0606 1440.71745
14A Ceratopogonidae CERAT 48 2077.922078 462.108116
14A Chironominae CHIR 2264 98008.65801 8101.88981
14A Copepod C_Cant 984 42597.4026 282.139971
14A Cyprididae O_Cypr 432 18701.2987 108.691235
14A Diptera D_pupa 152 6580.08658 164.761742
14A Gastropoda GAST 328 14199.1342 4444.77414
14A Hirudinea HIRU 24 1038.961039 18728.5086
14A Invertebrate HYDA 96 4155.844156 3.07925644
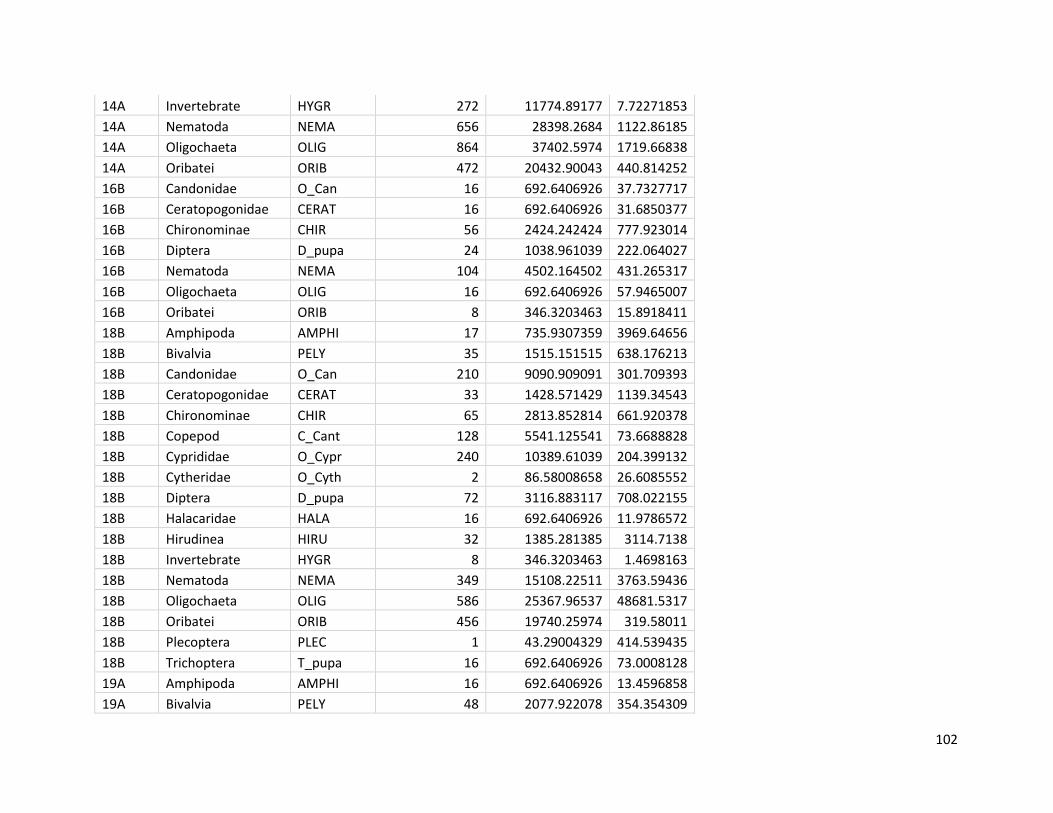
102
14A Invertebrate HYGR 272 11774.89177 7.72271853
14A Nematoda NEMA 656 28398.2684 1122.86185
14A Oligochaeta OLIG 864 37402.5974 1719.66838
14A Oribatei ORIB 472 20432.90043 440.814252
16B Candonidae O_Can 16 692.6406926 37.7327717
16B Ceratopogonidae CERAT 16 692.6406926 31.6850377
16B Chironominae CHIR 56 2424.242424 777.923014
16B Diptera D_pupa 24 1038.961039 222.064027
16B Nematoda NEMA 104 4502.164502 431.265317
16B Oligochaeta OLIG 16 692.6406926 57.9465007
16B Oribatei ORIB 8 346.3203463 15.8918411
18B Amphipoda AMPHI 17 735.9307359 3969.64656
18B Bivalvia PELY 35 1515.151515 638.176213
18B Candonidae O_Can 210 9090.909091 301.709393
18B Ceratopogonidae CERAT 33 1428.571429 1139.34543
18B Chironominae CHIR 65 2813.852814 661.920378
18B Copepod C_Cant 128 5541.125541 73.6688828
18B Cyprididae O_Cypr 240 10389.61039 204.399132
18B Cytheridae O_Cyth 2 86.58008658 26.6085552
18B Diptera D_pupa 72 3116.883117 708.022155
18B Halacaridae HALA 16 692.6406926 11.9786572
18B Hirudinea HIRU 32 1385.281385 3114.7138
18B Invertebrate HYGR 8 346.3203463 1.4698163
18B Nematoda NEMA 349 15108.22511 3763.59436
18B Oligochaeta OLIG 586 25367.96537 48681.5317
18B Oribatei ORIB 456 19740.25974 319.58011
18B Plecoptera PLEC 1 43.29004329 414.539435
18B Trichoptera T_pupa 16 692.6406926 73.0008128
19A Amphipoda AMPHI 16 692.6406926 13.4596858
19A Bivalvia PELY 48 2077.922078 354.354309
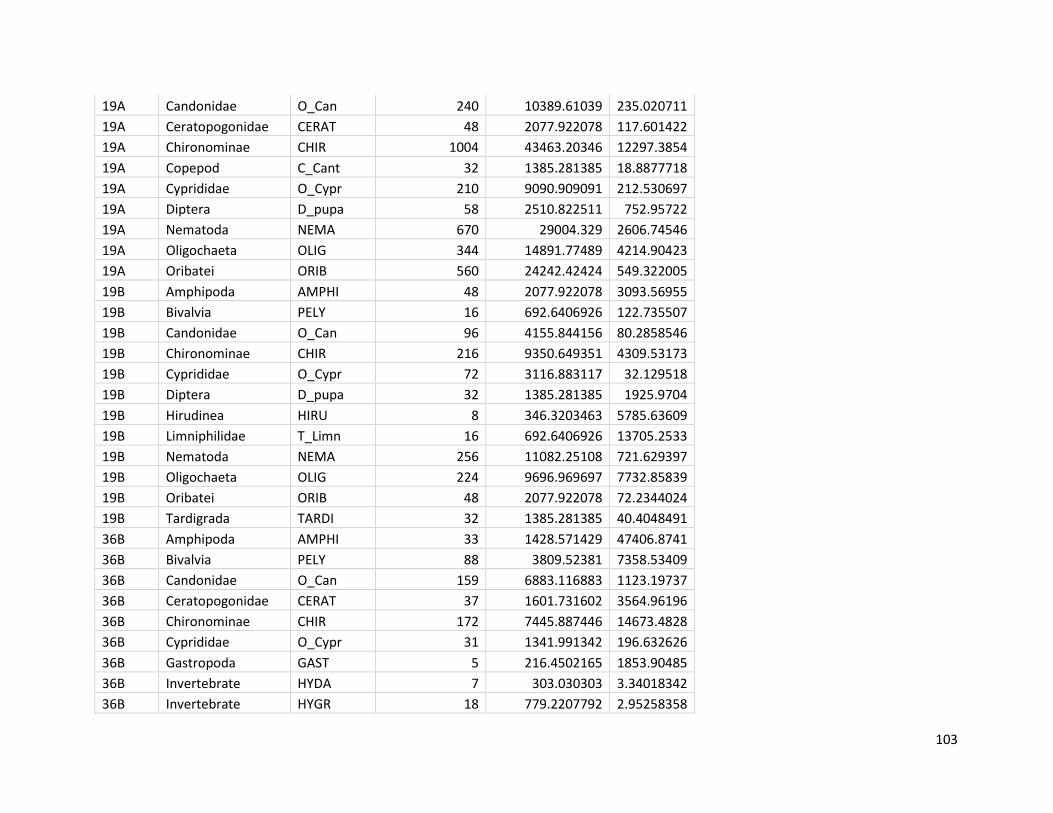
103
19A Candonidae O_Can 240 10389.61039 235.020711
19A Ceratopogonidae CERAT 48 2077.922078 117.601422
19A Chironominae CHIR 1004 43463.20346 12297.3854
19A Copepod C_Cant 32 1385.281385 18.8877718
19A Cyprididae O_Cypr 210 9090.909091 212.530697
19A Diptera D_pupa 58 2510.822511 752.95722
19A Nematoda NEMA 670 29004.329 2606.74546
19A Oligochaeta OLIG 344 14891.77489 4214.90423
19A Oribatei ORIB 560 24242.42424 549.322005
19B Amphipoda AMPHI 48 2077.922078 3093.56955
19B Bivalvia PELY 16 692.6406926 122.735507
19B Candonidae O_Can 96 4155.844156 80.2858546
19B Chironominae CHIR 216 9350.649351 4309.53173
19B Cyprididae O_Cypr 72 3116.883117 32.129518
19B Diptera D_pupa 32 1385.281385 1925.9704
19B Hirudinea HIRU 8 346.3203463 5785.63609
19B Limniphilidae T_Limn 16 692.6406926 13705.2533
19B Nematoda NEMA 256 11082.25108 721.629397
19B Oligochaeta OLIG 224 9696.969697 7732.85839
19B Oribatei ORIB 48 2077.922078 72.2344024
19B Tardigrada TARDI 32 1385.281385 40.4048491
36B Amphipoda AMPHI 33 1428.571429 47406.8741
36B Bivalvia PELY 88 3809.52381 7358.53409
36B Candonidae O_Can 159 6883.116883 1123.19737
36B Ceratopogonidae CERAT 37 1601.731602 3564.96196
36B Chironominae CHIR 172 7445.887446 14673.4828
36B Cyprididae O_Cypr 31 1341.991342 196.632626
36B Gastropoda GAST 5 216.4502165 1853.90485
36B Invertebrate HYDA 7 303.030303 3.34018342
36B Invertebrate HYGR 18 779.2207792 2.95258358
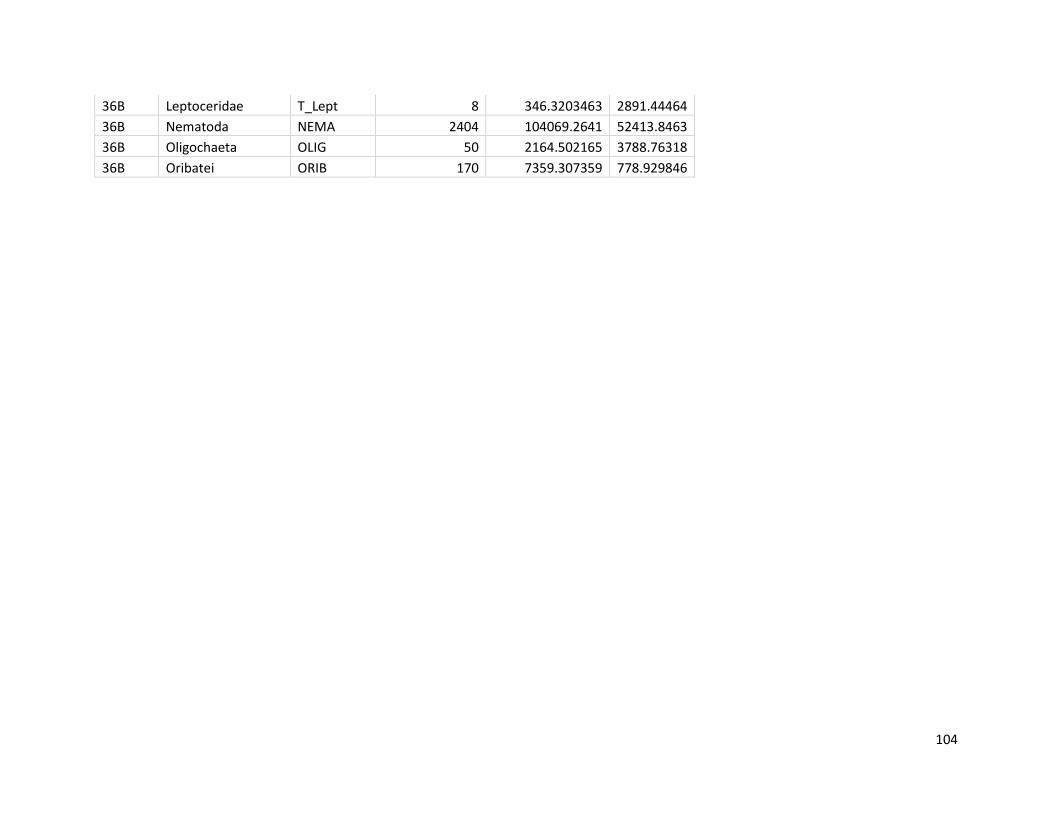
104
36B Leptoceridae T_Lept 8 346.3203463 2891.44464
36B Nematoda NEMA 2404 104069.2641 52413.8463
36B Oligochaeta OLIG 50 2164.502165 3788.76318
36B Oribatei ORIB 170 7359.307359 778.929846
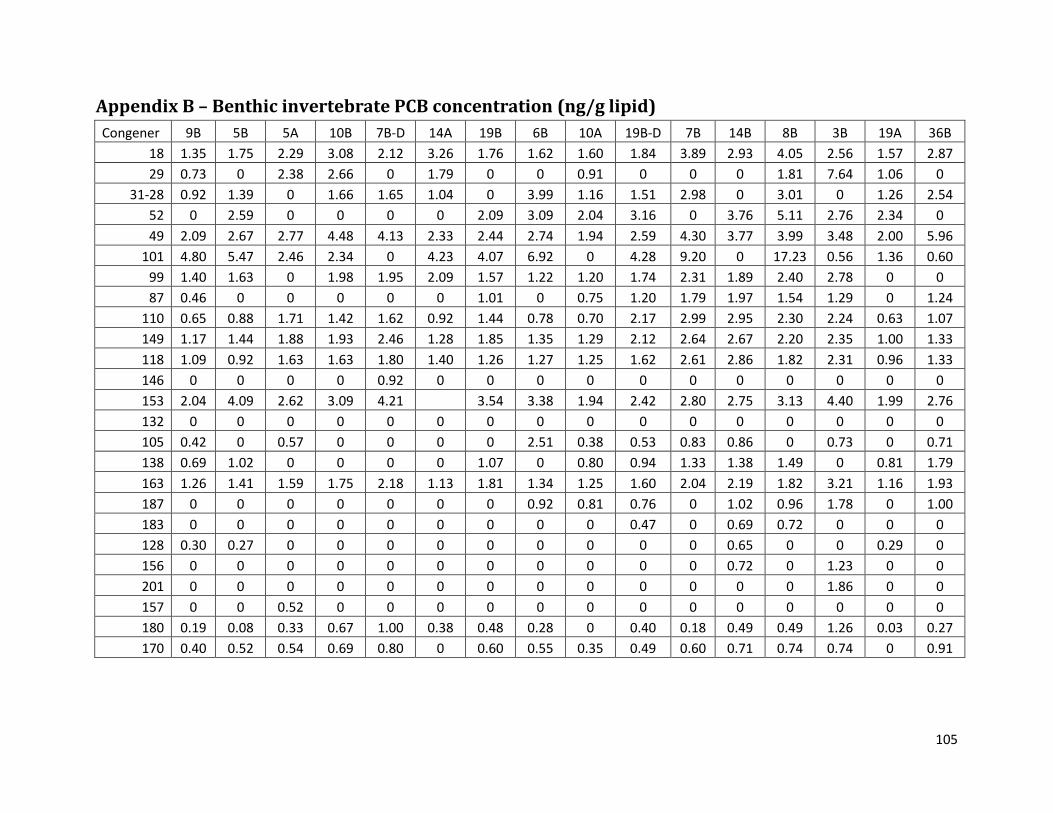
105
Appendix B – Benthic invertebrate PCB concentration (ng/g lipid)
Congener 9B 5B 5A 10B 7B-D 14A 19B 6B 10A 19B-D 7B 14B 8B 3B 19A 36B
18 1.35 1.75 2.29 3.08 2.12 3.26 1.76 1.62 1.60 1.84 3.89 2.93 4.05 2.56 1.57 2.87
29 0.73 0 2.38 2.66 0 1.79 0 0 0.91 0 0 0 1.81 7.64 1.06 0
31-28 0.92 1.39 0 1.66 1.65 1.04 0 3.99 1.16 1.51 2.98 0 3.01 0 1.26 2.54
52 0 2.59 0 0 0 0 2.09 3.09 2.04 3.16 0 3.76 5.11 2.76 2.34 0
49 2.09 2.67 2.77 4.48 4.13 2.33 2.44 2.74 1.94 2.59 4.30 3.77 3.99 3.48 2.00 5.96
101 4.80 5.47 2.46 2.34 0 4.23 4.07 6.92 0 4.28 9.20 0 17.23 0.56 1.36 0.60
99 1.40 1.63 0 1.98 1.95 2.09 1.57 1.22 1.20 1.74 2.31 1.89 2.40 2.78 0 0
87 0.46 0 0 0 0 0 1.01 0 0.75 1.20 1.79 1.97 1.54 1.29 0 1.24
110 0.65 0.88 1.71 1.42 1.62 0.92 1.44 0.78 0.70 2.17 2.99 2.95 2.30 2.24 0.63 1.07
149 1.17 1.44 1.88 1.93 2.46 1.28 1.85 1.35 1.29 2.12 2.64 2.67 2.20 2.35 1.00 1.33
118 1.09 0.92 1.63 1.63 1.80 1.40 1.26 1.27 1.25 1.62 2.61 2.86 1.82 2.31 0.96 1.33
146 0 0 0 0 0.92 0 0 0 0 0 0 0 0 0 0 0
153 2.04 4.09 2.62 3.09 4.21 3.54 3.38 1.94 2.42 2.80 2.75 3.13 4.40 1.99 2.76
132 0 0 0 0 0 0 0 0 0 0 0 0 0 0 0 0
105 0.42 0 0.57 0 0 0 0 2.51 0.38 0.53 0.83 0.86 0 0.73 0 0.71
138 0.69 1.02 0 0 0 0 1.07 0 0.80 0.94 1.33 1.38 1.49 0 0.81 1.79
163 1.26 1.41 1.59 1.75 2.18 1.13 1.81 1.34 1.25 1.60 2.04 2.19 1.82 3.21 1.16 1.93
187 0 0 0 0 0 0 0 0.92 0.81 0.76 0 1.02 0.96 1.78 0 1.00
183 0 0 0 0 0 0 0 0 0 0.47 0 0.69 0.72 0 0 0
128 0.30 0.27 0 0 0 0 0 0 0 0 0 0.65 0 0 0.29 0
156 0 0 0 0 0 0 0 0 0 0 0 0.72 0 1.23 0 0
201 0 0 0 0 0 0 0 0 0 0 0 0 0 1.86 0 0
157 0 0 0.52 0 0 0 0 0 0 0 0 0 0 0 0 0
180 0.19 0.08 0.33 0.67 1.00 0.38 0.48 0.28 0 0.40 0.18 0.49 0.49 1.26 0.03 0.27
170 0.40 0.52 0.54 0.69 0.80 0 0.60 0.55 0.35 0.49 0.60 0.71 0.74 0.74 0 0.91
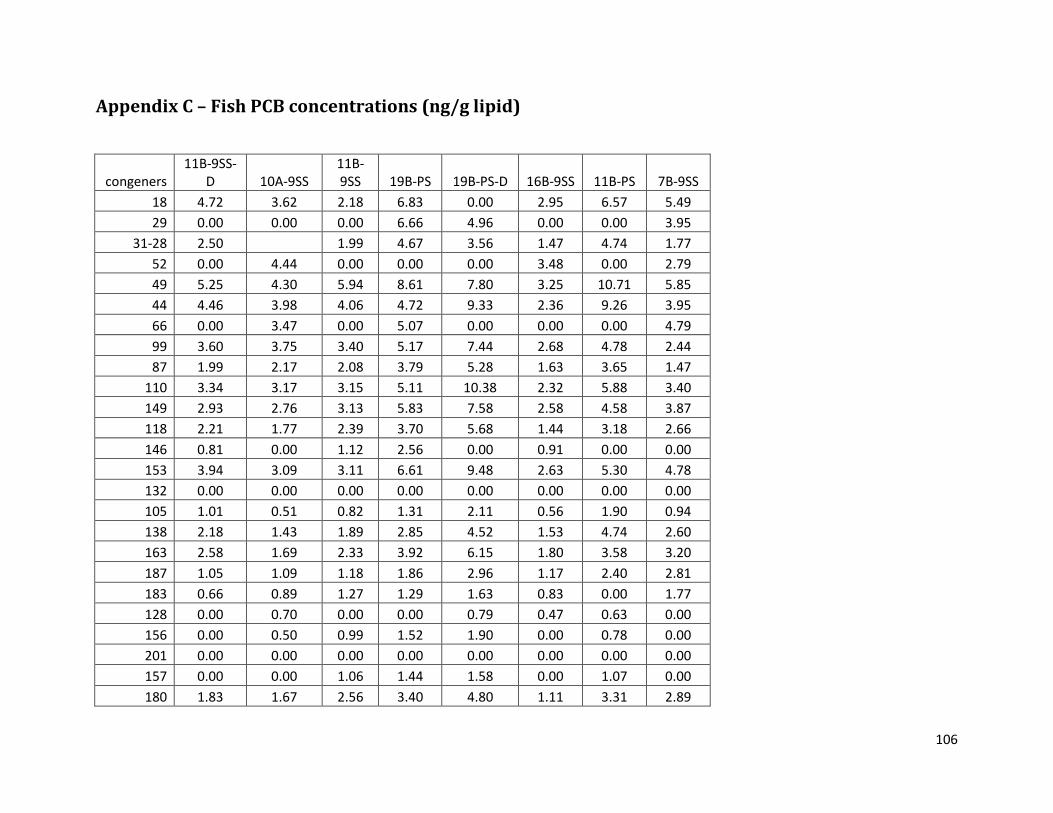
106
Appendix C – Fish PCB concentrations (ng/g lipid)
congeners 11B-9SS-
D 10A-9SS 11B-9SS 19B-PS 19B-PS-D 16B-9SS 11B-PS 7B-9SS
18 4.72 3.62 2.18 6.83 0.00 2.95 6.57 5.49
29 0.00 0.00 0.00 6.66 4.96 0.00 0.00 3.95
31-28 2.50 1.99 4.67 3.56 1.47 4.74 1.77
52 0.00 4.44 0.00 0.00 0.00 3.48 0.00 2.79
49 5.25 4.30 5.94 8.61 7.80 3.25 10.71 5.85
44 4.46 3.98 4.06 4.72 9.33 2.36 9.26 3.95
66 0.00 3.47 0.00 5.07 0.00 0.00 0.00 4.79
99 3.60 3.75 3.40 5.17 7.44 2.68 4.78 2.44
87 1.99 2.17 2.08 3.79 5.28 1.63 3.65 1.47
110 3.34 3.17 3.15 5.11 10.38 2.32 5.88 3.40
149 2.93 2.76 3.13 5.83 7.58 2.58 4.58 3.87
118 2.21 1.77 2.39 3.70 5.68 1.44 3.18 2.66
146 0.81 0.00 1.12 2.56 0.00 0.91 0.00 0.00
153 3.94 3.09 3.11 6.61 9.48 2.63 5.30 4.78
132 0.00 0.00 0.00 0.00 0.00 0.00 0.00 0.00
105 1.01 0.51 0.82 1.31 2.11 0.56 1.90 0.94
138 2.18 1.43 1.89 2.85 4.52 1.53 4.74 2.60
163 2.58 1.69 2.33 3.92 6.15 1.80 3.58 3.20
187 1.05 1.09 1.18 1.86 2.96 1.17 2.40 2.81
183 0.66 0.89 1.27 1.29 1.63 0.83 0.00 1.77
128 0.00 0.70 0.00 0.00 0.79 0.47 0.63 0.00
156 0.00 0.50 0.99 1.52 1.90 0.00 0.78 0.00
201 0.00 0.00 0.00 0.00 0.00 0.00 0.00 0.00
157 0.00 0.00 1.06 1.44 1.58 0.00 1.07 0.00
180 1.83 1.67 2.56 3.40 4.80 1.11 3.31 2.89
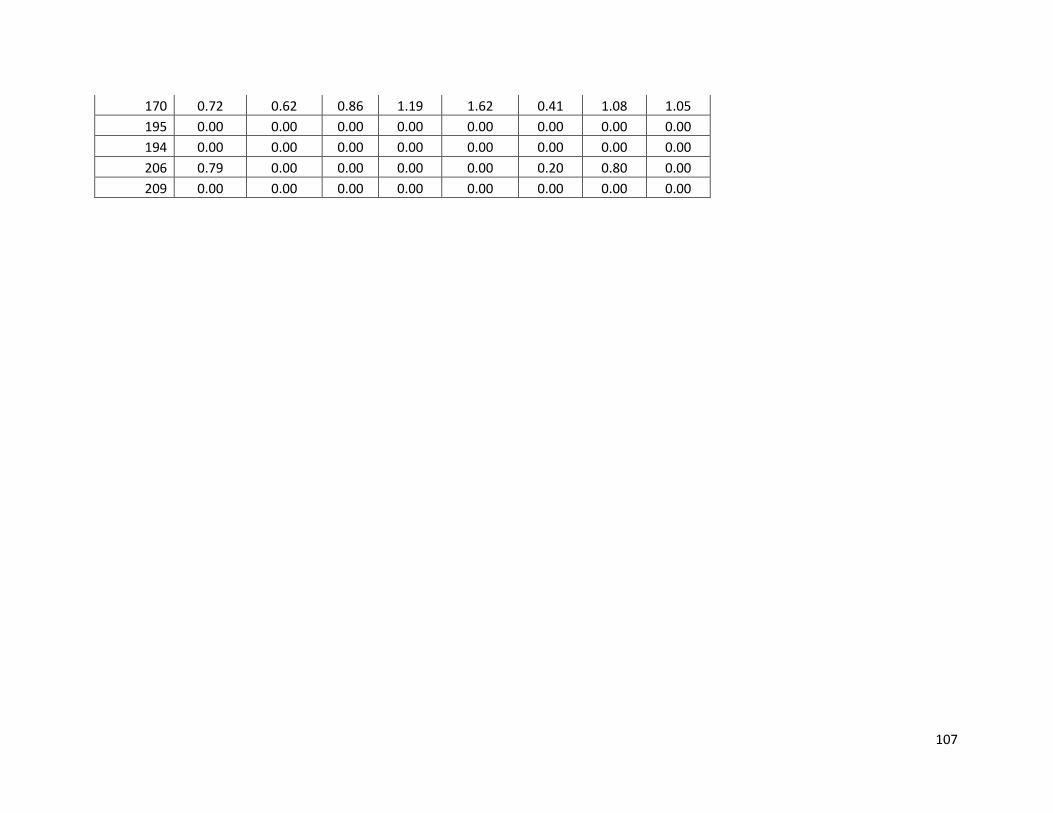
107
170 0.72 0.62 0.86 1.19 1.62 0.41 1.08 1.05
195 0.00 0.00 0.00 0.00 0.00 0.00 0.00 0.00
194 0.00 0.00 0.00 0.00 0.00 0.00 0.00 0.00
206 0.79 0.00 0.00 0.00 0.00 0.20 0.80 0.00
209 0.00 0.00 0.00 0.00 0.00 0.00 0.00 0.00
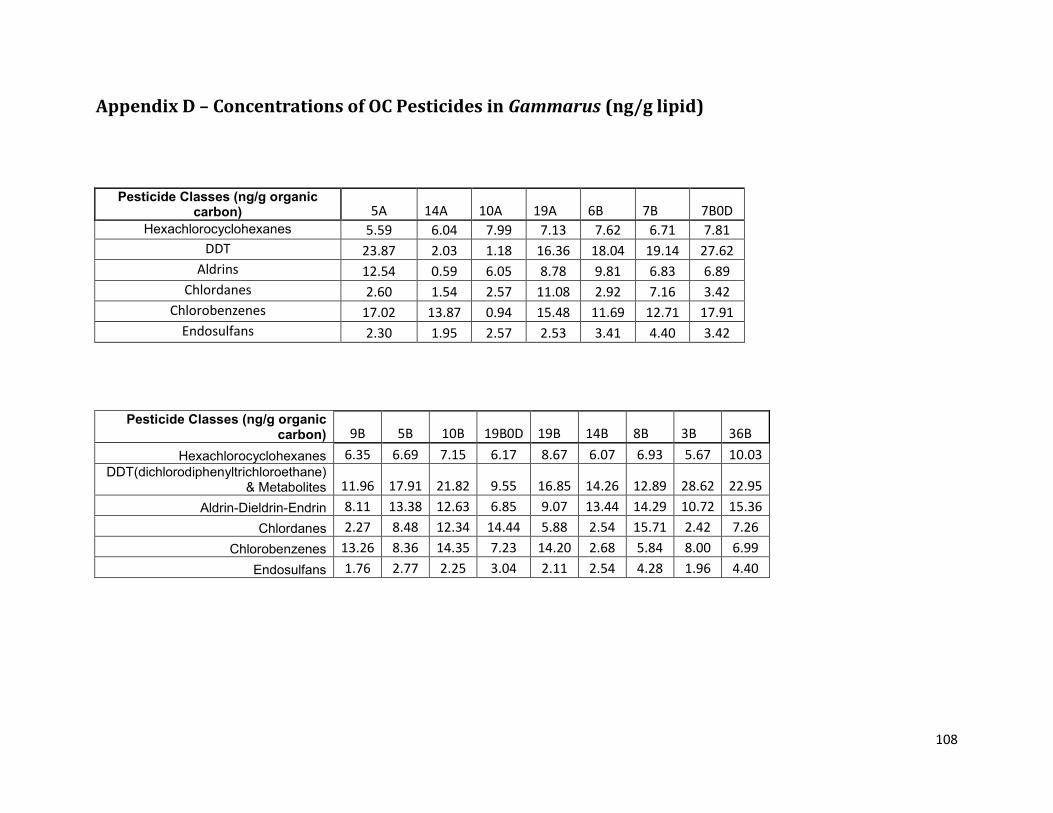
108
Appendix D – Concentrations of OC Pesticides in Gammarus (ng/g lipid)
Pesticide Classes (ng/g organic carbon) 5A 14A 10A 19A 6B 7B 7B0D
Hexachlorocyclohexanes 5.59 6.04 7.99 7.13 7.62 6.71 7.81
DDT 23.87 2.03 1.18 16.36 18.04 19.14 27.62
Aldrins 12.54 0.59 6.05 8.78 9.81 6.83 6.89
Chlordanes 2.60 1.54 2.57 11.08 2.92 7.16 3.42
Chlorobenzenes 17.02 13.87 0.94 15.48 11.69 12.71 17.91
Endosulfans 2.30 1.95 2.57 2.53 3.41 4.40 3.42
Pesticide Classes (ng/g organic carbon) 9B 5B 10B 19B0D 19B 14B 8B 3B 36B
Hexachlorocyclohexanes 6.35 6.69 7.15 6.17 8.67 6.07 6.93 5.67 10.03 DDT(dichlorodiphenyltrichloroethane)
& Metabolites 11.96 17.91 21.82 9.55 16.85 14.26 12.89 28.62 22.95
Aldrin-Dieldrin-Endrin 8.11 13.38 12.63 6.85 9.07 13.44 14.29 10.72 15.36
Chlordanes 2.27 8.48 12.34 14.44 5.88 2.54 15.71 2.42 7.26
Chlorobenzenes 13.26 8.36 14.35 7.23 14.20 2.68 5.84 8.00 6.99
Endosulfans 1.76 2.77 2.25 3.04 2.11 2.54 4.28 1.96 4.40
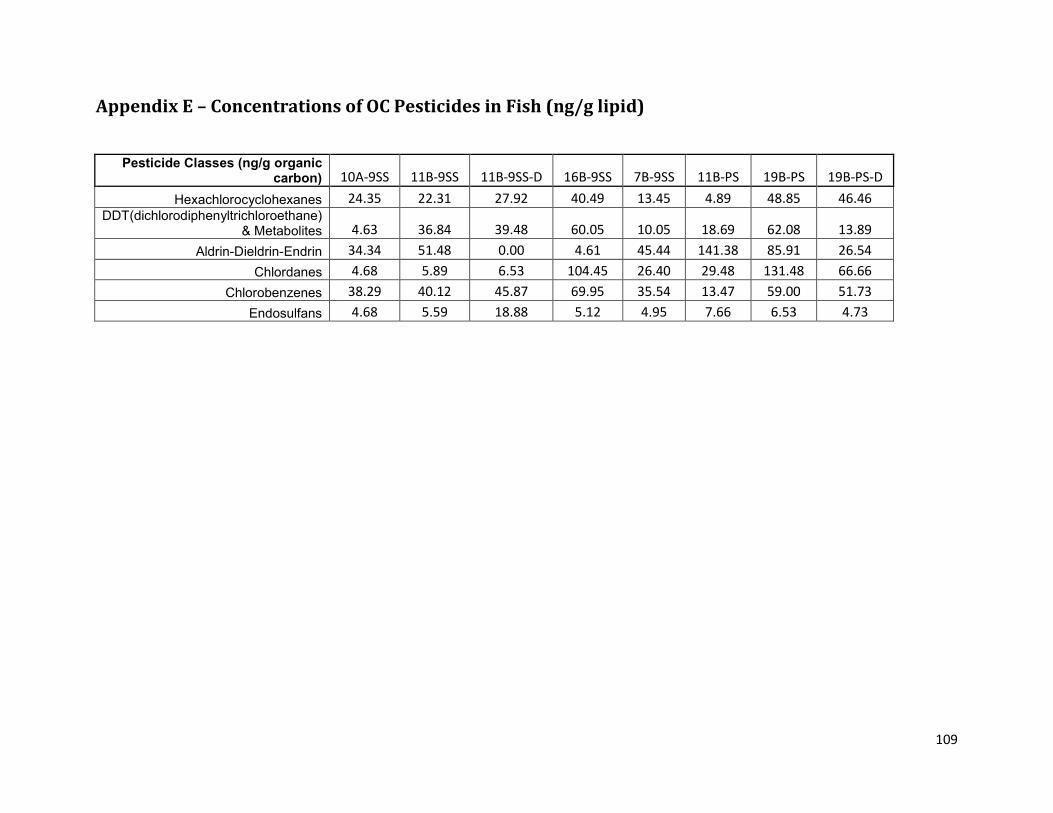
109
Appendix E – Concentrations of OC Pesticides in Fish (ng/g lipid)
Pesticide Classes (ng/g organic carbon) 10A-9SS 11B-9SS 11B-9SS-D 16B-9SS 7B-9SS 11B-PS 19B-PS 19B-PS-D
Hexachlorocyclohexanes 24.35 22.31 27.92 40.49 13.45 4.89 48.85 46.46 DDT(dichlorodiphenyltrichloroethane)
& Metabolites 4.63 36.84 39.48 60.05 10.05 18.69 62.08 13.89
Aldrin-Dieldrin-Endrin 34.34 51.48 0.00 4.61 45.44 141.38 85.91 26.54
Chlordanes 4.68 5.89 6.53 104.45 26.40 29.48 131.48 66.66
Chlorobenzenes 38.29 40.12 45.87 69.95 35.54 13.47 59.00 51.73
Endosulfans 4.68 5.59 18.88 5.12 4.95 7.66 6.53 4.73
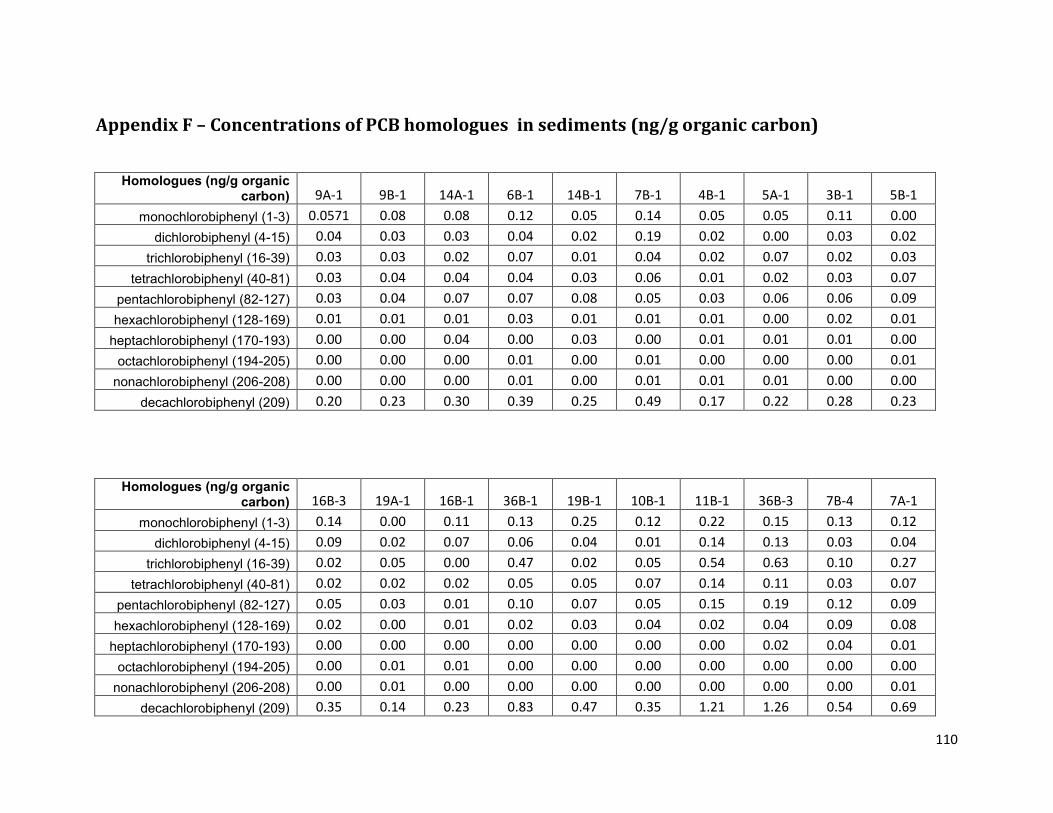
110
Appendix F – Concentrations of PCB homologues in sediments (ng/g organic carbon)
Homologues (ng/g organic carbon) 9A-1 9B-1 14A-1 6B-1 14B-1 7B-1 4B-1 5A-1 3B-1 5B-1
monochlorobiphenyl (1-3) 0.0571 0.08 0.08 0.12 0.05 0.14 0.05 0.05 0.11 0.00
dichlorobiphenyl (4-15) 0.04 0.03 0.03 0.04 0.02 0.19 0.02 0.00 0.03 0.02
trichlorobiphenyl (16-39) 0.03 0.03 0.02 0.07 0.01 0.04 0.02 0.07 0.02 0.03
tetrachlorobiphenyl (40-81) 0.03 0.04 0.04 0.04 0.03 0.06 0.01 0.02 0.03 0.07
pentachlorobiphenyl (82-127) 0.03 0.04 0.07 0.07 0.08 0.05 0.03 0.06 0.06 0.09
hexachlorobiphenyl (128-169) 0.01 0.01 0.01 0.03 0.01 0.01 0.01 0.00 0.02 0.01
heptachlorobiphenyl (170-193) 0.00 0.00 0.04 0.00 0.03 0.00 0.01 0.01 0.01 0.00
octachlorobiphenyl (194-205) 0.00 0.00 0.00 0.01 0.00 0.01 0.00 0.00 0.00 0.01
nonachlorobiphenyl (206-208) 0.00 0.00 0.00 0.01 0.00 0.01 0.01 0.01 0.00 0.00
decachlorobiphenyl (209) 0.20 0.23 0.30 0.39 0.25 0.49 0.17 0.22 0.28 0.23
Homologues (ng/g organic carbon) 16B-3 19A-1 16B-1 36B-1 19B-1 10B-1 11B-1 36B-3 7B-4 7A-1
monochlorobiphenyl (1-3) 0.14 0.00 0.11 0.13 0.25 0.12 0.22 0.15 0.13 0.12
dichlorobiphenyl (4-15) 0.09 0.02 0.07 0.06 0.04 0.01 0.14 0.13 0.03 0.04
trichlorobiphenyl (16-39) 0.02 0.05 0.00 0.47 0.02 0.05 0.54 0.63 0.10 0.27
tetrachlorobiphenyl (40-81) 0.02 0.02 0.02 0.05 0.05 0.07 0.14 0.11 0.03 0.07
pentachlorobiphenyl (82-127) 0.05 0.03 0.01 0.10 0.07 0.05 0.15 0.19 0.12 0.09
hexachlorobiphenyl (128-169) 0.02 0.00 0.01 0.02 0.03 0.04 0.02 0.04 0.09 0.08
heptachlorobiphenyl (170-193) 0.00 0.00 0.00 0.00 0.00 0.00 0.00 0.02 0.04 0.01
octachlorobiphenyl (194-205) 0.00 0.01 0.01 0.00 0.00 0.00 0.00 0.00 0.00 0.00
nonachlorobiphenyl (206-208) 0.00 0.01 0.00 0.00 0.00 0.00 0.00 0.00 0.00 0.01
decachlorobiphenyl (209) 0.35 0.14 0.23 0.83 0.47 0.35 1.21 1.26 0.54 0.69
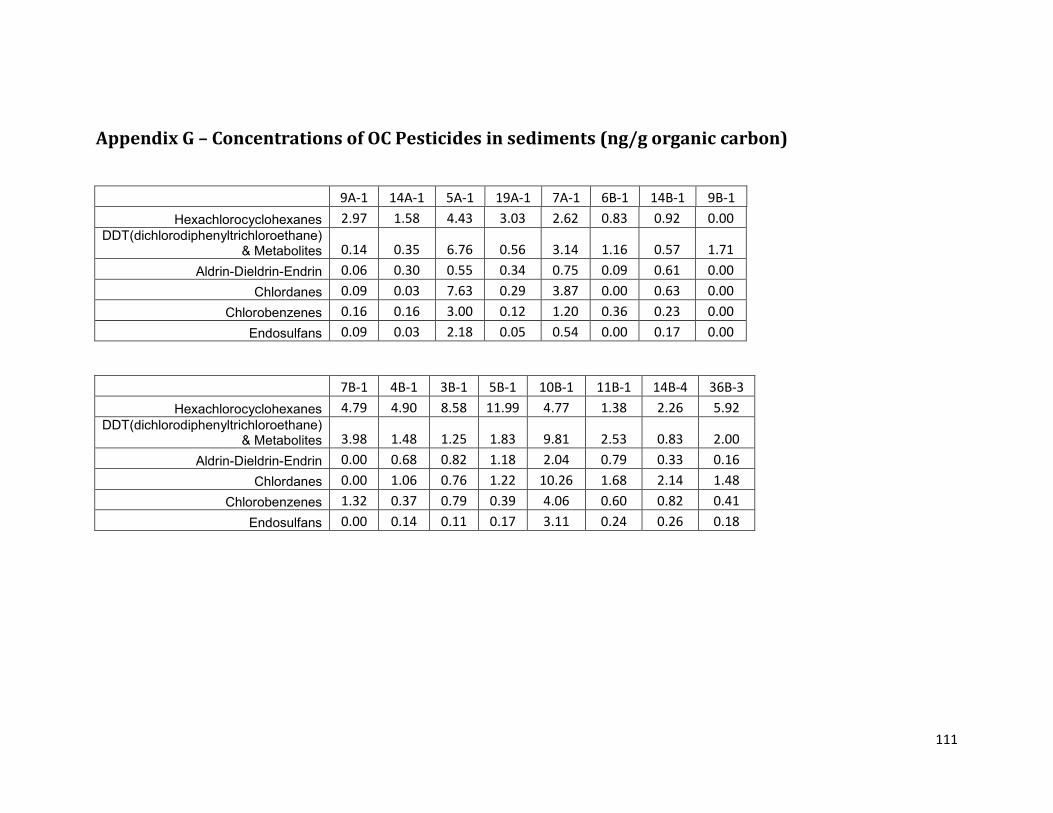
111
Appendix G – Concentrations of OC Pesticides in sediments (ng/g organic carbon)
9A-1 14A-1 5A-1 19A-1 7A-1 6B-1 14B-1 9B-1
Hexachlorocyclohexanes 2.97 1.58 4.43 3.03 2.62 0.83 0.92 0.00 DDT(dichlorodiphenyltrichloroethane)
& Metabolites 0.14 0.35 6.76 0.56 3.14 1.16 0.57 1.71
Aldrin-Dieldrin-Endrin 0.06 0.30 0.55 0.34 0.75 0.09 0.61 0.00
Chlordanes 0.09 0.03 7.63 0.29 3.87 0.00 0.63 0.00
Chlorobenzenes 0.16 0.16 3.00 0.12 1.20 0.36 0.23 0.00
Endosulfans 0.09 0.03 2.18 0.05 0.54 0.00 0.17 0.00
7B-1 4B-1 3B-1 5B-1 10B-1 11B-1 14B-4 36B-3
Hexachlorocyclohexanes 4.79 4.90 8.58 11.99 4.77 1.38 2.26 5.92 DDT(dichlorodiphenyltrichloroethane)
& Metabolites 3.98 1.48 1.25 1.83 9.81 2.53 0.83 2.00
Aldrin-Dieldrin-Endrin 0.00 0.68 0.82 1.18 2.04 0.79 0.33 0.16
Chlordanes 0.00 1.06 0.76 1.22 10.26 1.68 2.14 1.48
Chlorobenzenes 1.32 0.37 0.79 0.39 4.06 0.60 0.82 0.41
Endosulfans 0.00 0.14 0.11 0.17 3.11 0.24 0.26 0.18