Embed Size (px)
Citation preview

Assessment of Growth Performance, Hemato-BiochemicalParameters, Immunological and Histopathological
Alterations Associated with New Bacterial MultistrainProbiotic (Gro-2-Max®) Supplementation on Broiler
Chicken
Abeer A. Abd El-Baky1*, Nagwa A. Shalaby2, Sherein S.A. Elgayed3
1Department of Clinical Pathology, Faculty of Veterinary Medicine, Cairo University,Giza, Egypt.
2Department of Poultry Diseases, Animal Health Research Institute, ProvincialLaboratory Tanta, Egypt.
3Department of Pathology, Faculty of Veterinary Medicine, Cairo University, Giza,Egypt.
Abstract : Long time ago, attempts for enhancing the poultry health status, are concentrating onways for modulating the indigenous intestinal flora by live microbial adjuncts, now called“probiotics”. In the present study 126, one-day old commercial broiler chicks were used toevaluate the effect of supplementation with new bacterial multistrain probiotic (Gro-2-Max®)and were equally divided into 6 groups. Group 1 (control), were fed and drank without anytreatment. Supplementation in ration was done at a rate of 500 g/ton starting from 1st day till theend of experiment (42 days) in group 2, from 15th to 42nd day in group 3, and from 1st to 10th
and from 30th to 42nd day in group 4. Supplementation in drinking water was carried out at arate of 1g/liter for 24 hours starting from 1st to 5th, 16th to 20th and from 30th to 35th day ingroup 5, and for 3 successive days/week till 42nd day in group 6. Evaluation includedmonitoring chicken performance (feed intake, body weight gain, feed conversion rate, immuneindex and cecal bacterial enumeration), clinicopathological alterations (hemogram and serumbiochemistry), immune responses (humeral and cellular), and histopathological examinations(liver, kidney, spleen, bursa of Fabricious, thymus and ileum). Results concluded to, thepositive effect of Gro-2-Max® on chicken performance especially groups 2 and 6, decreasingeffect on lipogram especially total cholesterol, total triglycerides and low density lipoproteincholesterol, nonspecific humeral and cellular immune responses, and improving effect onintestinal function through increasing the height of ileal villi.Key words: Probiotics, Chicken performance, Clinical pathology, Immunology,Histopathology.
Introduction
Newly hatched chicks have little chance to be contacted with their mothers and consequentlytheir normal microflora is slowly colonized to the intestine. During this early period, chicks are moresusceptible for various stresses which poorly affect their growth performance, immunity and digestion because
International Journal of ChemTech Research CODEN (USA): IJCRGG, ISSN: 0974-4290, ISSN(Online):2455-9555
Vol.9, No.12 pp 996-1016, 2016
Abeer A. Abd El-Baky et al /International Journal of ChemTech Research, 2016,9(12): 996-1016. 997
of the incomplete development of their different physiological body functions1. Many researchers usedprobiotics as growth promoting agents2. Probiotics exhibit several ways of action including antagonistic actiontowards pathogenic bacteria, competition for locations to intestinal mucous membranes and competition fornutrients3. Probiotics, when fed, influence the intestinal morphology and function4, promote feed conversionrate, progress immune system function and reduce chicken susceptibility to diseases2. Gro-2-Max® is a newbacterial multistrain probiotic used in poultry field. It contains naturally occurring four different species ofbeneficial bacteria (Pedicoccus acidilactici, Pedicoccus pentosaceus, Acetabacter aceti and Bacillusamyloliquafaciens) which are generally regarded as safe by American food and drug administration5. Thepresent study aimed to evaluate supplementation of chicken with Gro-2-Max® in their ration and drinkingwater at different ages and to find the best way for its application in poultry field. This evaluation was donethrough studying its effect on chicken performance, hemato-biochemical parameters, immune responses, andhistopathological alterations.
Materials and Methods
Chicks and Experimental Design
One hundred and twenty-six, one-day old commercial broiler chicks (Arbor Acres) were obtained andfed on basal ration from Cairo Poultry Corporate Egypt. All chicks were fed and watered ad libitum and werereared on a floor housing system at Animal Health Research Institute, Provincial Laboratory, Tanta. Chickswere divided equally into 6 groups each contains 21 chicks in 3 replicates. Group 1 was fed on a basal rationand drank water without any treatment and considered as control. Supplementation of Gro-2-Max® in rationwas done at a rate of 500 g/ton starting from 1st day of age till the end of experiment (42 days) in group 2, from15th to 42nd day in group 3, and from 1st to 10th and from 30th to 42nd day in group 4. Supplementation in drinkingwater was carried out at a rate of 1g/liter for 24 hours starting from 1st to 5th, 16th to 20th and from 30th to 35th
day in group 5 and for 3 successive days/week till the end of experiment in group 6. All samples were collectedat the 21st and 42nd day except those for chicken performance were collected weekly.
VaccinationChicks at hatchery were vaccinated via spray against Newcastle disease (ND) and by S/C injection
against infectious bursal disease (IBD) and Avian influenza using Vitaberon L, Vaxxitic and Egyptian H9N1vaccines, respectively. Booster doses against ND using MA5+Clone 30 vaccine at the 10th day and Aveinewvaccine at the 30th day via drinking water were administered.
Probiotic
Gro-2-Max® was manufactured by Bio-National American Institute and contains Pedicoccusacidilactici (3×10⁵ cfu/g), Pedicoccus pentosaceus (4×10³ cfu/g), Acetabacter aceti (2×10⁵ cfu/g) and Bacillusamyloliquafaciens (4×10⁴ cfu/g).
Chicken performance
Feed intake (FI), body weight gain (BWG), feed conversion rate (FCR) and mortality rate for eachgroup was determined.
Immune index and Cecal Bacterial Enumeration
Three chickens from each group were weighed and scarified. Lymphoid organs including thymus,spleen and bursa of Fabricious were collected and weighed. Both organ weight and organ weight to bodyweight ratio, and immune index were calculated according to Lucio and Hitchner6. One gram of cecal digestawas used for enumerating total coliform, E. coli and Lactobacillus spp. using MacConkey, Eosin methyleneblue (EMB) and Rogosa agars, respectively, according to Tuohy et al.7.
Blood Samples for Clinicopathological and Immunological Examinations
Blood samples from 10 chickens of each group were collected (wing vein). Each blood sample wasdivided into two parts. First part was anticoagulated using EDTA for evaluating hemogram and cellularimmunity. Second part was collected in clean plain centrifuge tube for serum separation to evaluate bloodbiochemistry and humeral immunity.

Abeer A. Abd El-Baky et al /International Journal of ChemTech Research, 2016,9(12): 996-1016. 998
Clinicopathological Examinations
Hematological Examination
According to Campbell8, the following hematological parameters were measured; red blood cells(RBCs) count, packed cell volume (PCV), hemoglobin (Hb) concentration, total leukocytic count (TLC), anddifferential leukocytic count (DLC).
Biochemical Examination
According to Warnick et al.9, the following biochemical examinations were assayed; protein profile[total proteins, albumin (A), globulins (G) and A/G ratio], activity of hepatic enzymes [aspartateaminotransferase (AST), alanine aminotransferase (ALT) and alkaline phosphatase (ALP)], lipogram [totalcholesterol, high density lipoprotein cholesterol (HDL-c), low density lipoprotein cholesterol (LDL-c), very lowdensity lipoprotein cholesterol (VLDL-c) and total triglycerides] and concentrations of blood glucose, uric acid,creatinine, calcium and inorganic phosphorus. All the before mentioned parameters were assayed using reagentkits supplied by StanBio Laboratories incorporation, USA.
Immunological Examinations
Humeral Immunity
Measurement of antibody titers against ND using hemagglutination inhibition (HI) test and against IBDusing enzyme-linked immunosorbent assay (ELISA) were carried out according to Snyder et al.10.
Cellular Immunity
Phagocytic activity (PA), phagocytic index (PI) and lymphocyte transformation test (LTT) wereassayed according to Nariuchi11.
Histopathological Examination
Liver, kidney, spleen, bursa of Fabricious, thymus and ileum were collected and prepared formicroscopic examination using hematoxylin and eosin stain (H &E).
Statistica Analysis
Results of the experiment were analyzed using ANOVA procedure using the mean ± SD by SPSS V.14.(2000).
Results
Chicken Performance
To accurately assess the chicken performance, weekly changes in patterns of FI, BWG and FCR duringthe whole experimental period (42 days) were recorded as shown in Table 1. At the beginning of theexperiment, the initial average body weight of newly hatched broiler chicks in all groups was 46.4±4.2 g. Bycomparing the obtained results with those of the control group 1, fluctuated results were reported but the resultstook regular pattern at 21st and 42nd day as follow; at 21st day, FI showed significant increases in groups 2, 4, 5and 6 with no significate change in group 3. BWG was significantly increased in groups 2, 3, 5 and 6 with nosignificate change in group 4. Significant decreases in FCR were recorded in groups 2, 3, 5 and 6 with nosignificate change in group 4. At 42nd day, FI showed significant decreases in all groups, BWG wassignificantly increased in groups 2, 3 and 6, significant decrease in group 4 with no significate change in group5. FCR was significantly decreased in groups 2, 3 and 6, significant increases in group 4 and no significatechange in group 5.

Abeer A. Abd El-Baky et al /International Journal of ChemTech Research, 2016,9(12): 996-1016. 999
Table (1): Effect of probiotic (Gro-2-Max®) on FI, BWG, FCR and mortality on different experimental groupsGroup
Age/Day Parameters1 2 3 4 5 6
FI 24.00±2.68b
20.60±2.29c
24.00±2.68b
20.60±2.29c
27.00±3.03a
27.00±2.96a
BWG 16.00±1.66b
14.00±1.84 c
16.00±3.82 b
14.00±1.86c
17.00±1.44b
19.00±1.55a
FCR 1.50±0.17b
1.40±0.16c
1.50±0.17b
1.40±0.16c
1.60±0.18a
1.40±0.16c
Mortality 2.00 2.00 0 0 1.00 0
7th
% 9.52 9.52 0 0 4.76 0
FI 51.00±5.70b
57.00±6.34a
51.00±5.72b
54.00±6.05b
59.00±6.53a
57.00±6.32a
BWG 34.00±5.85b
34.60±3.96b
34.60±4.52b
35.60±4.53b
34.30±7.69b
49.00±3.61a
FCR 1.50±0.17c
1.60±0.18b
1.50±0.17c
1.50±0.17c
1.70±0.19a
1.60±0.18b
Mortality 1.00 0 0 0 0 0
14th
% 4.76 0 0 0 0 0
FI 88.00±9.80b
96.00±11.00a
87.00±10.00b
99.00±11.00a
95.00±11.00a
90.00 ±10.00a
BWG 47.00±1.97c
59.00±4.68b
68.00±3.53a
49.00±6.46c
53.00±6.53b
60.00±3.32a
FCR 1.90±0.21a
1.60±0.18b
1.30±0.16c
2.00±0.22a
1.80±0.19b
1.50±0.17b
Mortality 0 0 0 0 0 0
21st
% 0 0 0 0 0 0
FI 146.00±16.00c
163.00±18.00a
155.00±17.00b
142.00±15.00c
137.00±15.00d
141.60±13.00c
BWG 88.00±13.07b
93.00±9.53a
91.00±11.79a
74.00±4.48b
67.00±9.73c
83.00±7.92b
FCR 1.60±0.18b
1.70±0.20b
1.70±0.19b
1.90±0.21a
2.00±0.22a
1.50±0.17b
Mortality 0 0 0 0 0 0
28th
% 0 0 0 0 0 0
FI 177.00±16.00b
180.00±20.00a
167.00±18.00c
167.00±18.00c
163.00±18.00c
166.00±18.00c
BWG 91.50±31.00a
75.00±26.00c
75.00±6.00c
86.00±21.00b
93.00±9.70a
91.00±7.90a
FCR 1.93±0.19c
2.40±0.27a
2.20±0.25b
1.90±0.21c
1.75±0.20d
1.80±0.20d
Mortality 0 0 0 0 0 0
35th
% 0 0 0 0 0 0
FI 230.00±26.00a
217.00±24.00c
216.00±24.00c
221.00±25.00b
220.00±24.00b
221.00±25.00b
BWG 81.00±13c
112.00±14.00a
85.00±20.00b
57.00±20.00d
81.00±11.00c
91.00± 23.00b
FCR 2.86±0.30b
1.90±0.19d
2.50±0.28c
3.90±0.43a
2.70±0.30b
2.43±0.28c
Mortality 0 0 0 0 0 0
42nd
% 0 0 0 0 0 0
FI 119.00±13.40b
122.00±13.60a
118.00±13.14b
117.00±13.00b
117.00±13.00b
114.00±12.80c
BWG 60.00±6.02b
68.00±9.55a
60.40±9.90b
53.00±10.76c
58.50±1.90c
65.00±11.50a
FCR 2.00±0.20a
1.80±0.20b
1.90±0.21a
2.2±0.25a
2.00±0.22a
1.80±0.20b
Mortality 3.00 2.00 0 0 1.00 0
Totalmeans
(from 1st -42nd day)
% 14.29 9.52 0 0 4.76 0Means with different superscripts (a,b,c,d) within a raw are significantly different.
Group (1): Control group was fed on a basal ration and drank water without any treatment.Group (2): Supplemented with Gro-2-Max® in ration at a rate of rate of 500 g/ton starting from 1st to 42nd day.Group (3): Supplemented with Gro-2-Max® in ration at a rate of rate of 500 g/ton starting from 15th to 42nd day.Group (4): Supplemented with Gro-2-Max® in ration at a rate of rate of 500 g/ton starting from 1st to 10th and from 30th to 42nd day.Group (5): Supplemented with Gro-2-Max® in drinking water at a rate of 1g/liter for 24 hours starting from 1st to 5th, 16th to 20th and from30th to 35th day.Group (6): Supplemented with Gro-2-Max® in drinking water at a rate of 1g/liter for 24 hours for 3 successive days/week till the end ofexperiment.

Abeer A. Abd El-Baky et al /International Journal of ChemTech Research, 2016,9(12): 996-1016. 1000
Mortality rate was lower in groups 2 and 5 than control group [9.52% and 4.76% via 14.29%],respectively and was absent in groups 3, 4 and 6.
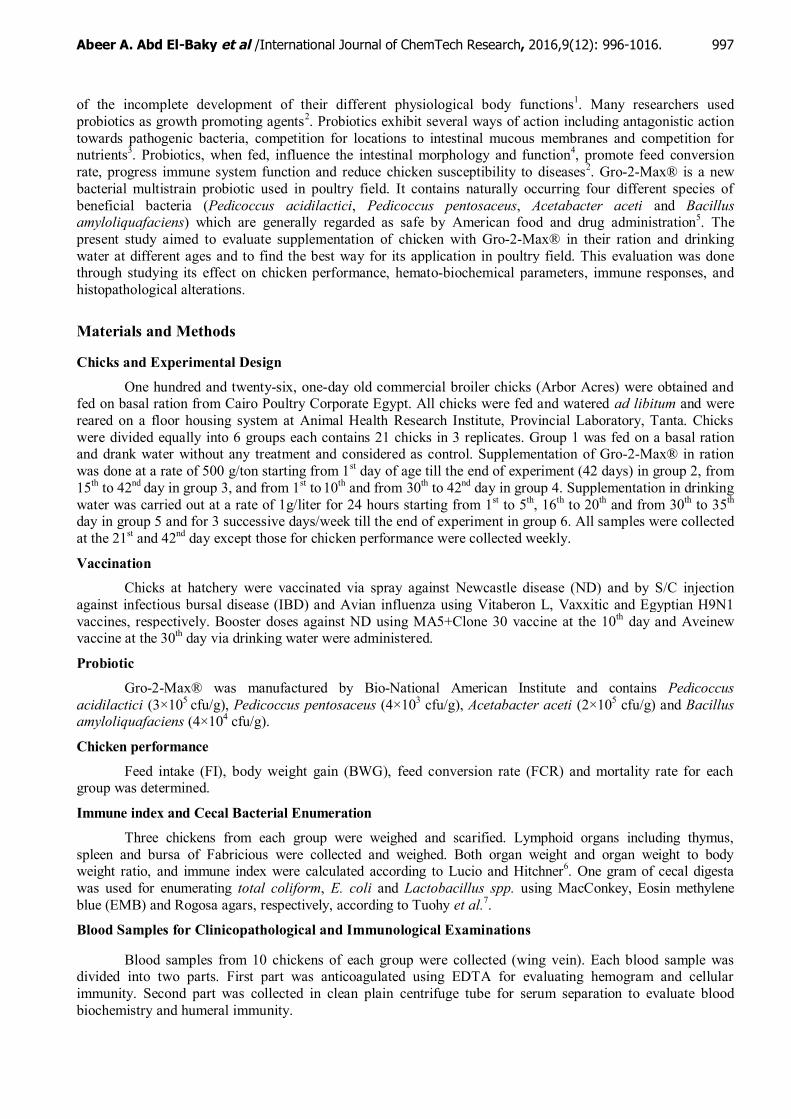
Results of carcass yield in Table 2 clearly demonstrate the significant increased dressing values ingroups 2 and 6, significant decreased values in groups 4 and 5, and insignificant changes in group 3.Insignificant changes of goblet weights and percentages of pancreas, fat, intestine and cecum in addition to thelength of intestine and cecum of different experimental groups were recorded. Liver weight revealed significantincrease in groups 2, 4, 5 and 6 while, heart weight revealed significant increase in groups 2 and 4 andsignificant decrease in group 6 in both weight and percentage. Groups 2, 3, 4 and 5 showed significant increasein gizzard weight while, group 6 showed significant decrease in weight and percentage, and group 2 showedsignificant decrease in percentage.
Immune Index
At 21st day all groups showed insignificant changes in weights and immune indices of thymus, spleenand bursa of Fabricious. At 42nd day significant increase in bursa weight of groups 2, 3, 4 and 5 and significantdecrease in group 6 were recorded while, bursa immune index was insignificantly changed. Moreover, weightsand immune indices of thymus and spleen at 42nd day were insignificantly changed in all groups (Table 3).
Cecal Bacterial Enumeration
At 21st day, total coliform count showed significant increase in groups 2 and 4, and significant decreasein groups 3, 5 and 6, E. coli count revealed significant decrease in groups 2, 3 and 6 and significant increase ingroups 4 and 5 while, cecal lactobacillus count in all groups showed significant increase. At 42nd day,significant increases in total coliform and lactobacillus counts with significant decrease in E. coil count ingroups 2, 5 and 6 were observed. Group 3 recorded insignificant change in total coliform and significantdecrease in E. coli and lactobacillus counts. Significant increase in total coliform and E. coli counts withsignificant decrease in lactobacillus count was recorded in group 4 (Table 4).
Clinicopathological Results
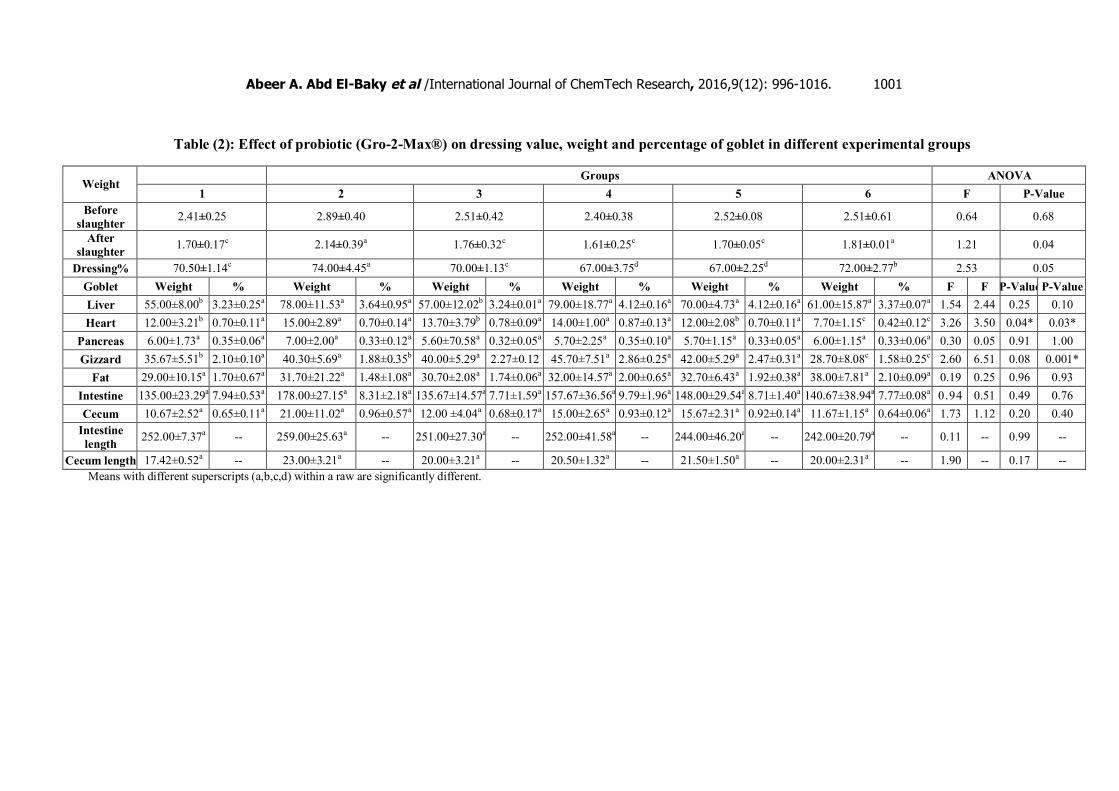
Hematology
Insignificant increase in erythrogram parameters and significant lymphocytic leukocytosis wereobserved in all groups. These hematological changes were more pronounced in group 2 than other groups (Table5).
Serum Biochemistry
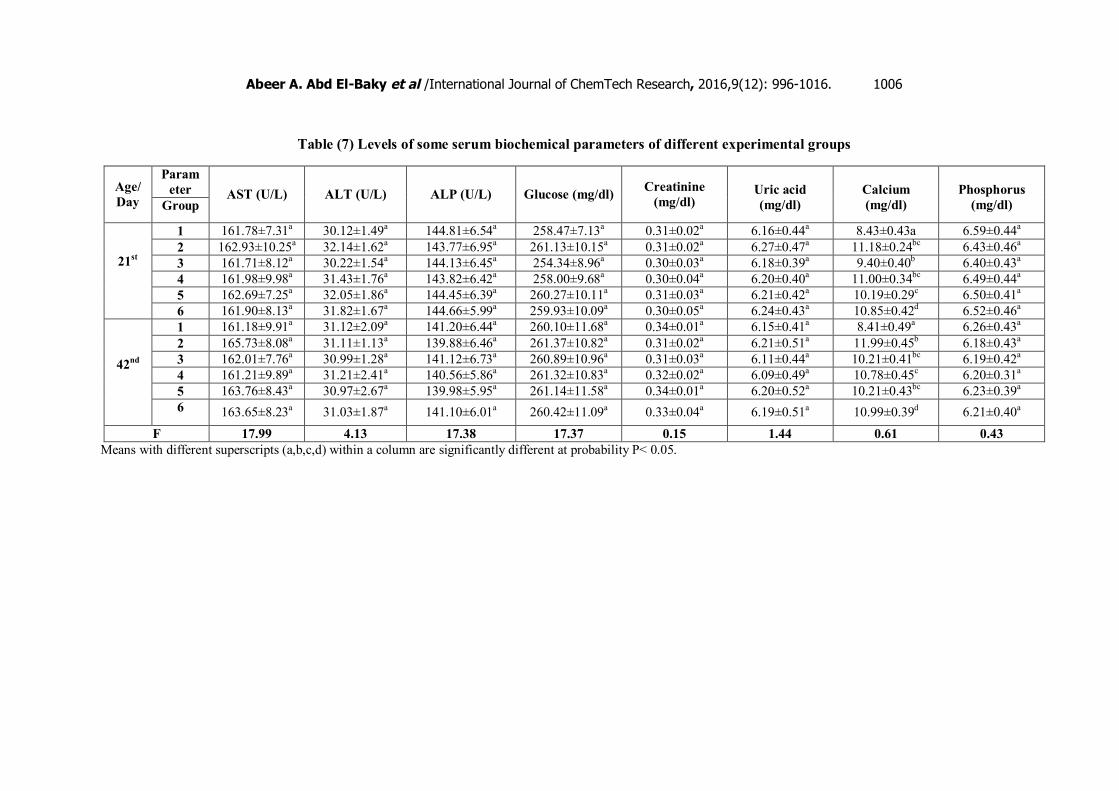
Protein profile showed insignificant changes in albumin concentration, significant hyperproteinemiaresulted from hyperglobulinemia and significant decrease in A/G ratio. Lipogram revealed insignificant changein HDL-c with significant decrease in total cholesterol, total triglycerides and LDL-c concentrations. Activitiesof AST, ALT and ALP, and concentrations of blood glucose, serum creatinine and uric acid showedinsignificant changes. Insignificant changes in phosphorus concentration with significant hypercalcaemia werereported. These biochemical changes were more pronounced in group 2 than other groups (Tables 6 and 7).
Immunological Results
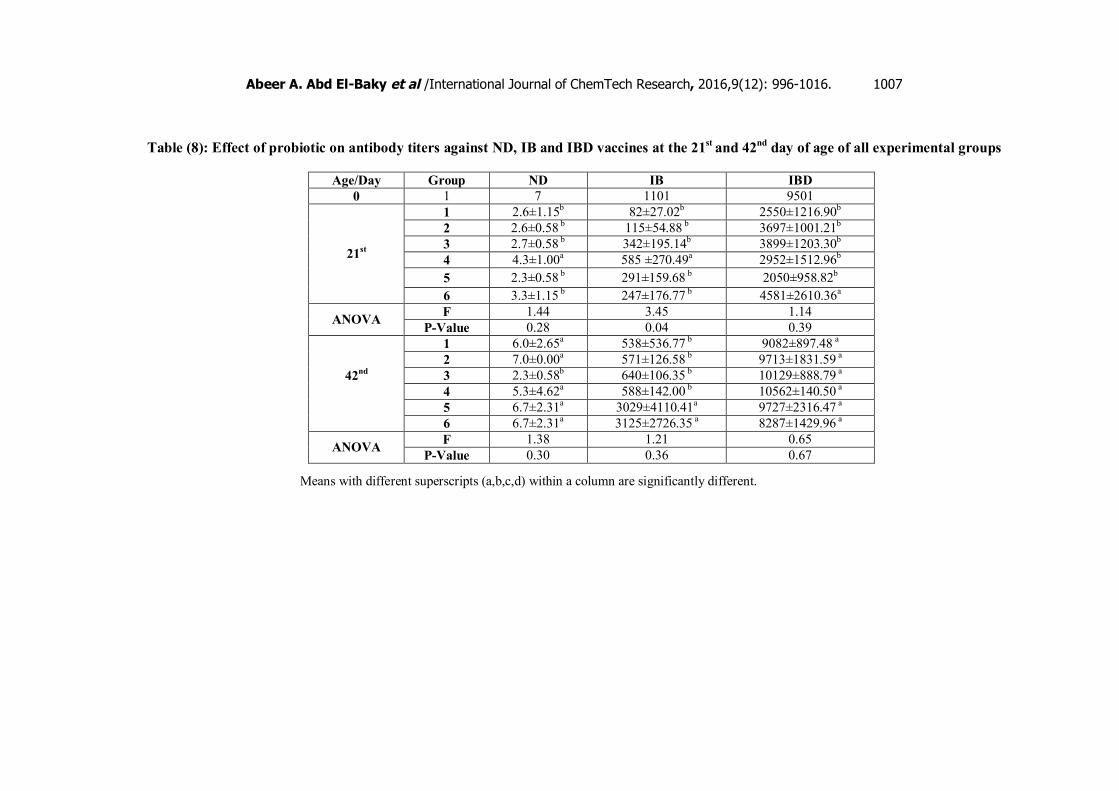
Humeral immunity at 21st day showed insignificant changes in antibody titers against ND and IBDvaccines except groups 4 and 6 showed significant increases against ND and IBD vaccines, respectively. At42nd day insignificant changes were recorded except group 3 showed significant decrease against ND vaccine(Table 8).
Abeer A. Abd El-Baky et al /International Journal of ChemTech Research, 2016,9(12): 996-1016. 1001
Table (2): Effect of probiotic (Gro-2-Max®) on dressing value, weight and percentage of goblet in different experimental groups
Groups ANOVAWeight
1 2 3 4 5 6 F P-ValueBefore
slaughter 2.41±0.25 2.89±0.40 2.51±0.42 2.40±0.38 2.52±0.08 2.51±0.61 0.64 0.68
Afterslaughter 1.70±0.17c 2.14±0.39a 1.76±0.32c 1.61±0.25c 1.70±0.05c 1.81±0.01a 1.21 0.04
Dressing% 70.50±1.14c 74.00±4.45a 70.00±1.13c 67.00±3.75d 67.00±2.25d 72.00±2.77b 2.53 0.05Goblet Weight % Weight % Weight % Weight % Weight % Weight % F F P-ValueP-ValueLiver 55.00±8.00b 3.23±0.25a 78.00±11.53a 3.64±0.95a 57.00±12.02b 3.24±0.01a 79.00±18.77a 4.12±0.16a 70.00±4.73a 4.12±0.16a 61.00±15.87a 3.37±0.07a 1.54 2.44 0.25 0.10Heart 12.00±3.21b 0.70±0.11a 15.00±2.89a 0.70±0.14a 13.70±3.79b 0.78±0.09a 14.00±1.00a 0.87±0.13a 12.00±2.08b 0.70±0.11a 7.70±1.15c 0.42±0.12c 3.26 3.50 0.04* 0.03*
Pancreas 6.00±1.73a 0.35±0.06a 7.00±2.00a 0.33±0.12a 5.60±70.58a 0.32±0.05a 5.70±2.25a 0.35±0.10a 5.70±1.15a 0.33±0.05a 6.00±1.15a 0.33±0.06a 0.30 0.05 0.91 1.00Gizzard 35.67±5.51b 2.10±0.10a 40.30±5.69a 1.88±0.35b 40.00±5.29a 2.27±0.12 45.70±7.51a 2.86±0.25a 42.00±5.29a 2.47±0.31a 28.70±8.08c 1.58±0.25c 2.60 6.51 0.08 0.001*
Fat 29.00±10.15a 1.70±0.67a 31.70±21.22a 1.48±1.08a 30.70±2.08a 1.74±0.06a 32.00±14.57a 2.00±0.65a 32.70±6.43a 1.92±0.38a 38.00±7.81a 2.10±0.09a 0.19 0.25 0.96 0.93Intestine 135.00±23.29a 7.94±0.53a 178.00±27.15a 8.31±2.18a 135.67±14.57a 7.71±1.59a 157.67±36.56a 9.79±1.96a 148.00±29.54a 8.71±1.40a 140.67±38.94a 7.77±0.08a 0.94 0.51 0.49 0.76Cecum 10.67±2.52a 0.65±0.11a 21.00±11.02a 0.96±0.57a 12.00 ±4.04a 0.68±0.17a 15.00±2.65a 0.93±0.12a 15.67±2.31a 0.92±0.14a 11.67±1.15a 0.64±0.06a 1.73 1.12 0.20 0.40
Intestinelength 252.00±7.37a -- 259.00±25.63a -- 251.00±27.30a -- 252.00±41.58a -- 244.00±46.20a -- 242.00±20.79a -- 0.11 -- 0.99 --
Cecum length 17.42±0.52a -- 23.00±3.21a -- 20.00±3.21a -- 20.50±1.32a -- 21.50±1.50a -- 20.00±2.31a -- 1.90 -- 0.17 -- Means with different superscripts (a,b,c,d) within a raw are significantly different.

Abeer A. Abd El-Baky et al /International Journal of ChemTech Research, 2016,9(12): 996-1016. 1002
Table (3): Immune index of thymus, spleen and bursa of Fabricious at the 21st and 42nd day of age of all experimental groups
Items Groups ANOVAAge/Day Groups 1 2 3 4 5 6 F P-Value
Body weight 720±95.39 623±.33.15 731.67±25.66 713±75.88 720±112.69 601.67±85.78 0.99 0.46
Thymus weight 0.88±0.26 1.33±0.47 1.17±0.37 1.02±0.25 0.87±0.11 0.92±0.14 0.66 0.66
Spleen weight 0.78±0.23 1.00±0.53 0.78±0.19 0.66±0.18 0.75±0.13 0.80±0.22 0.49 0.78
Weight
Bursa weight 1.18±0.44 0.83±0.23 1.20±0.40 0.97±0.45 1.38±0.25 1.47±0.04 2.07 0.14Thymus Index 1.20±0.21 1.87±0.58 1.59±0.44 1.45±0.49 1.24±0.28 1.54±0.22 1.17 0.38Spleen Index 1.07±0.22 1.53±0.49 1.08±0.28 0.91±0.15 1.07±0.30 1.38±0.59 1.19 0.37
21st
ImmuneIndex Bursa Index 1.63±0.58 1.35±0.22 1.65±0.58 1.36±0.66 1.93±0.12 2.48±0.37 2.46 0.09
Body weight 2413±252.91 2894±401.05 2514±15.55 2309±451.87 2522±78.51 2514±605.38 1.10 0.41Thymus weight 5.50±1.80 4.30±0.40 4.03±0.95 3.70±1.15 3.58±0.33 3.63±0.75 1.51 0.26Spleen weight 3.65±0.82 3.63±1.33 3.03±0.64 3.42±0.52 3.50±1.32 2.97±0.46 0.31 0.90Weight
Bursa weight 3.78±0.63b 4.62±0.78a 4.60±0.88a 4.67±0.58a 4.87±0.81a 2.97±0.35c 3.34 0.04*Thymus Index 2.35±0.94 1.49±0.07 1.63±0.47 1.58±0.21 1.40±1.38 1.33±0.59 1.36 0.30Spleen Index 1.51±0.26 1.28±0.55 1.20±0.21 1.53±0.44 1.38±0.48 1.19±0.11 0.46 0.80
42nd
ImmuneIndex Bursa Index 1.59±0.37 1.59±0.09 1.83±0.16 2.05±0.31 1.93±0.36 1.23±0.36 2.95 0.06
Means with different superscripts (a,b,c,d) within a raw are significantly different.

Abeer A. Abd El-Baky et al /International Journal of ChemTech Research, 2016,9(12): 996-1016. 1003
Table (4): Effect of probiotic (Gro-2-Max®) on total coliform, E. coli and lactobacillus counts (log 1010) in non-treated and treated groups at the 21st
and 42nd day of ageGroups ANOVAAge/
Day Intestine Media1 2 3 4 5 6 F P
MacConkey 10.02±1.12c 14.13±1.57b 1.20±0.01d 38.90±42.40a 1.50±0.02d 0.04±0.01d 236.08 0.001EMB 74.17±8.25b 3.51±0.39c 5.01±0.56c 107.20±11.90a 170.40±19.00a 3.01±0.30c 151.97 0.00121st Caecum
Ragusa 10.02±1.12c 18.04±0.01b 28.07±3.12a 16.04±1.78b 14.03±1.56b 20.80±0.10a 70.92 0.001MacConkey 0.10±0.02c 1.60±0.02a 0.10±0.01c 1.24±0.14b 1.403±0.16a 1.34±0.10a 134.63 0.001
EMB 9.00±2.30b 0.01±0.01d 0.01±0.02d 20.05±2.23a 0.04±0.01d 1.76±0.20c 233.68 0.00142nd CaecumRagusa 6.01±0.67c 12.13±1.35b 0.90±0.10d 4.53±0.50c 14.03±1.56b 18.20±2.00a 84.70 0.001
Means with different superscripts (a,b,c,d) within a raw are significantly different.
Abeer A. Abd El-Baky et al /International Journal of ChemTech Research, 2016,9(12): 996-1016. 1004
Table (5) Hematological parameters of different experimental groups
ParameterAge/Day Group RBCs (×106/μl) PCV (%) Hb (g/dl) TLC (×103/µl) Heterophil count
(×103/µl)Lymphocyte
count (×103/µl)Monocyte count
(×103/µl)
1 2.3±0.58a 28.6±2.29a 11.96±2.42a 19.27±2.13a 4.27±1.04a 13.71±1.32a 1.29±0.11a
2 2.5±0.33a 31.4±2.58a 13.20±1.03a 22.23±3.58b 4.42±1.48a 16.64±1.25b 1.17±0.13a
3 2.4±0.55a 29.5±2.11a 12.29±1.32a 21.12±2.11b 4.39±1.09a 15.59±1.22b 1.14±0.12a
4 2.3±0.34a 28.8±2.23a 11.97±2.11a 19.34±3.49bc 4.22±1.18a 14.07±1.32bc 1.06±0.11a
5 2.3±0.46a 28.7±2.40a 12.00±1.92a 19.40±3.42bc 4.26±1.22a 13.98±1.26bc 1.16±0.14a
21st
6 2.4±0.33a 30.0±2.19a 12.93±2.06a 21.05±2.23b 4.30±1.30a 15.65±1.34b 1.10±0.10a
1 2.8±0.65a 31.4±2.01a 13.59±1.80a 20.64±2.15a 5.31±0.80a 14.03±1.21a 1.30±0.10a
2 3.0±0.60a 34.3±2.52a 15.21±2.64a 23.80±1.99b 4.98±1.19a 17.58±1.24b 1.24±0.10a
3 2.7±0.58a 32.1±2.09a 13.62±1.62a 21.00±2.01bc 4.84±0.67a 15.02±1.22b 1.14±0.09a
4 2.8±0.61a 31.6±1.90a 13.88±2.79a 21.20±2.32bc 4.86±0.81a 15.14±1.19b 1.20±0.08a
5 2.9±0.59a 32.3±1.92a 14.01±2.60a 21.09±1.89bc 4.77±1.01a 15.17±1.23b 1.15±0.11a
42nd
6 2.9±0.63a 33.4±2.48a 14.54±1.79a 22.99±1.90b 4.92±1.21a 16.84±1.27b 1.23±0.09a
F 0.34 4.03 2.04 2.01 1.04 2.28 0.24
Means with different superscripts (a,b,c,d) within a column are significantly different at probability P< 0.05.

Abeer A. Abd El-Baky et al /International Journal of ChemTech Research, 2016,9(12): 996-1016. 1005
Table (6) Levels of some serum biochemical parameters of different experimental groups
Means with different superscripts (a,b,c,d) within a column are significantly different at probability P< 0.05.
ParameterAge/
Day GroupTotal proteins
(g/dl) Albumin (g/dl) Globulins (g/dl) A/G ratio T. cholesterol(mg/dl)
T. triglycerides(mg/dl)
HDL-cholesterol
(mg/dl)
LDL-cholesterol
(mg/dl)1 2.71±0.11a 1.54±0.11a 1.24±0.03a 1.23±0.07a 168.58±8.72a 183.69±11.24a 76.28±0.65a 54.46±1.24a
2 3.27±0.20b 1.56±0.12a 1.73±0.08c 0.92±0.05b 135.48±6.13b 134.08±3.09b 71.17±1.08a 36.39±1.27b
3 3.07±0.10bc 1.50±0.10a 1.53±0.05bc 0.98±0.06b 153.76±8.66c 162.87±10.33c 78.24±0.87a 41.85±1.22b
4 2.92±0.13c 1.47±0.09a 1.55±0.03bc 0.95±0.04b 152.88±7.54c 163.34±11.01c 80.12±1.03a 38.99±1.30b
5 2.97±0.15c 1.43±0.12a 1.52±0.07bc 0.96±0.04b 148.64±7.31bc 156.92±9.93c 76.32±0.74a 39.84±1.28b
21st
6 3.20±0.16b 1.57±0.13a 1.68±0.06c 0.93±0.07b 140.09±6.44bc 138.26±4.88b 73.91±0.98a 37.43±1.24b
1 2.88±0.05a 1.58±0.04a 1.35±0.02a 1.21±0.02a 177.76±8.58a 170.10±7.23a 78.02±1.25a 64.62±2.44a
2 3.54±0.13b 1.55±0.09a 2.09±0.09b 0.89±0.05b 124.67±7.37b 114.92±5.70b 76.67±1.22a 23.92±3.24b
3 3.27±0.05bc 1.43±0.08a 1.59±0.01bc 0.97±0.03b 146.73±8.45c 134.61±7.21c 78.89±1.12a 39.82±2.56c
4 3.24±0.09bc 1.52±0.07a 1.61±0.06bc 0.96±0.01b 158.35±7.76c 145.47±5.11c 81.46±1.23a 46.70±2.82d
5 3.21±0.12bc 1.48±0.03a 1.73±0.08c 0.95±0.04b 140.67±7.80cb 132.19±6.99c 79.34±0.99a 33.79±3.14c
42nd
6 3.52±0.11b 1.56±0.09a 1.98±0.07b 0.91±0.03b 131.44±7.91cb 119.93±6.87b 80.62±1.24a 25.73±3.30b
F 0.19 0.16 0.12 0.14 13.62 16.19 5.96 6.55
Abeer A. Abd El-Baky et al /International Journal of ChemTech Research, 2016,9(12): 996-1016. 1006
Table (7) Levels of some serum biochemical parameters of different experimental groups
ParameterAge/
Day GroupAST (U/L) ALT (U/L) ALP (U/L) Glucose (mg/dl) Creatinine
(mg/dl)Uric acid(mg/dl)
Calcium(mg/dl)
Phosphorus(mg/dl)
1 161.78±7.31a 30.12±1.49a 144.81±6.54a 258.47±7.13a 0.31±0.02a 6.16±0.44a 8.43±0.43a 6.59±0.44a
2 162.93±10.25a 32.14±1.62a 143.77±6.95a 261.13±10.15a 0.31±0.02a 6.27±0.47a 11.18±0.24bc 6.43±0.46a
3 161.71±8.12a 30.22±1.54a 144.13±6.45a 254.34±8.96a 0.30±0.03a 6.18±0.39a 9.40±0.40b 6.40±0.43a
4 161.98±9.98a 31.43±1.76a 143.82±6.42a 258.00±9.68a 0.30±0.04a 6.20±0.40a 11.00±0.34bc 6.49±0.44a
5 162.69±7.25a 32.05±1.86a 144.45±6.39a 260.27±10.11a 0.31±0.03a 6.21±0.42a 10.19±0.29c 6.50±0.41a
21st
6 161.90±8.13a 31.82±1.67a 144.66±5.99a 259.93±10.09a 0.30±0.05a 6.24±0.43a 10.85±0.42d 6.52±0.46a
1 161.18±9.91a 31.12±2.09a 141.20±6.44a 260.10±11.68a 0.34±0.01a 6.15±0.41a 8.41±0.49a 6.26±0.43a
2 165.73±8.08a 31.11±1.13a 139.88±6.46a 261.37±10.82a 0.31±0.02a 6.21±0.51a 11.99±0.45b 6.18±0.43a
3 162.01±7.76a 30.99±1.28a 141.12±6.73a 260.89±10.96a 0.31±0.03a 6.11±0.44a 10.21±0.41bc 6.19±0.42a
4 161.21±9.89a 31.21±2.41a 140.56±5.86a 261.32±10.83a 0.32±0.02a 6.09±0.49a 10.78±0.45c 6.20±0.31a
5 163.76±8.43a 30.97±2.67a 139.98±5.95a 261.14±11.58a 0.34±0.01a 6.20±0.52a 10.21±0.43bc 6.23±0.39a
42nd
6 163.65±8.23a 31.03±1.87a 141.10±6.01a 260.42±11.09a 0.33±0.04a 6.19±0.51a 10.99±0.39d 6.21±0.40a
F 17.99 4.13 17.38 17.37 0.15 1.44 0.61 0.43 Means with different superscripts (a,b,c,d) within a column are significantly different at probability P< 0.05.
Abeer A. Abd El-Baky et al /International Journal of ChemTech Research, 2016,9(12): 996-1016. 1007
Table (8): Effect of probiotic on antibody titers against ND, IB and IBD vaccines at the 21st and 42nd day of age of all experimental groups
Means with different superscripts (a,b,c,d) within a column are significantly different.
Age/Day Group ND IB IBD0 1 7 1101 9501
1 2.6±1.15b 82±27.02b 2550±1216.90b
2 2.6±0.58 b 115±54.88 b 3697±1001.21b
3 2.7±0.58 b 342±195.14b 3899±1203.30b
4 4.3±1.00a 585 ±270.49a 2952±1512.96b
5 2.3±0.58 b 291±159.68 b 2050±958.82b
21st
6 3.3±1.15 b 247±176.77 b 4581±2610.36a
F 1.44 3.45 1.14ANOVA P-Value 0.28 0.04 0.391 6.0±2.65a 538±536.77 b 9082±897.48 a
2 7.0±0.00a 571±126.58 b 9713±1831.59 a
3 2.3±0.58b 640±106.35 b 10129±888.79 a
4 5.3±4.62a 588±142.00 b 10562±140.50 a
5 6.7±2.31a 3029±4110.41a 9727±2316.47 a
42nd
6 6.7±2.31a 3125±2726.35 a 8287±1429.96 a
F 1.38 1.21 0.65ANOVA P-Value 0.30 0.36 0.67

Abeer A. Abd El-Baky et al /International Journal of ChemTech Research, 2016,9(12): 996-1016. 1008
Table (9): Effects of probiotic on PA, PI and LTT at the 21st and 42nd day of age of all experimentalgroups
GroupAge/Day Test 1 2 3 4 5 6
PA 44.68±2.33a
45.63±4.37a
45.68±2.01a
39.80±4.89a
42.10±3.87a
39.88±3.98a
PI 4.41±0.50ab
4.28±0.30ab
4.30±0.08ab
3.55±1.09b
4.97±0.33a
4.31±0.43ab21st
LTT 26.95±2.66b
33.33±1.59a
31.35±6.70a
26.40±4.01b
30.35±2.91a
26.63±4.92ab
PA 46.17±3.09a
46.17±7.91a
48.83±1.88a
45.63±2.11a
48.23±8.01a
45.20±2.35a
PI 3.44±0.29a
3.12±0.15a
3.21±0.45a
3.73±0.47a
3.65±0.43a
3.48±0.47a42nd
LTT 29.23±1.92a
29.83±7.60a
33.17±1.38a
33.40±5.82a
30.93±6.39a
32.53±5.98a
Means with different superscripts (a,b,c,d) within a raw are significantly different.
Cellular immunity at 21st and 42nd days cleared insignificant changes in PA and PI except at 21st day,group 5 showed significant increase in PI. Significant increase in LTT at 21st day in groups 2, 3 and 5, andinsignificant changes in groups 4 and 6 were observed while, insignificant changes in all groups at 42nd daywere recorded (Table 9).
Histopathological Findings
Liver
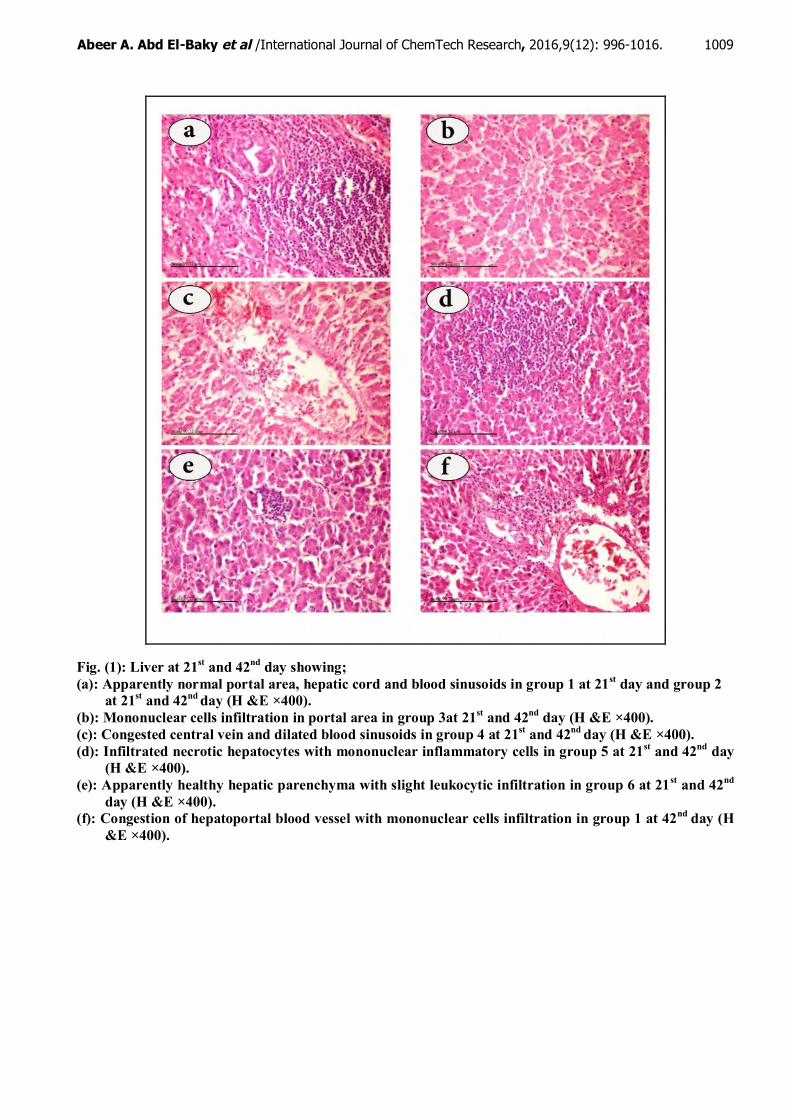
Examination at 21st day, showed normal hepatic parenchyma including hepatic cords, blood sinusoidsand portal tract in groups 1 and 2 (Fig. 1, a). Different pathological alterations include mononuclear cellsinfiltration in portal tract of group 3 (Fig. 1, b), congested central vein and dilated blood sinusoids in group 4(Fig. 1, c), and infiltrated necrotic hepatocytes with mononuclear inflammatory cells in group 5 (Fig. 1, d) weredemonstrated. Apparently healthy hepatic parenchyma with slight leukocytic infiltration was noticed in group 6(Fig. 1, e). At 42nd day, group 1 showed congested hepatoportal blood vessel (Fig. 1, f) while, other groupsshowed the same findings to those at 21st day.
Abeer A. Abd El-Baky et al /International Journal of ChemTech Research, 2016,9(12): 996-1016. 1009
Fig. (1): Liver at 21st and 42nd day showing;(a): Apparently normal portal area, hepatic cord and blood sinusoids in group 1 at 21st day and group 2
at 21st and 42nd day (H &E ×400).(b): Mononuclear cells infiltration in portal area in group 3at 21st and 42nd day (H &E ×400).(c): Congested central vein and dilated blood sinusoids in group 4 at 21st and 42nd day (H &E ×400).(d): Infiltrated necrotic hepatocytes with mononuclear inflammatory cells in group 5 at 21st and 42nd day
(H &E ×400).(e): Apparently healthy hepatic parenchyma with slight leukocytic infiltration in group 6 at 21st and 42nd
day (H &E ×400).(f): Congestion of hepatoportal blood vessel with mononuclear cells infiltration in group 1 at 42nd day (H
&E ×400).
Abeer A. Abd El-Baky et al /International Journal of ChemTech Research, 2016,9(12): 996-1016. 1010
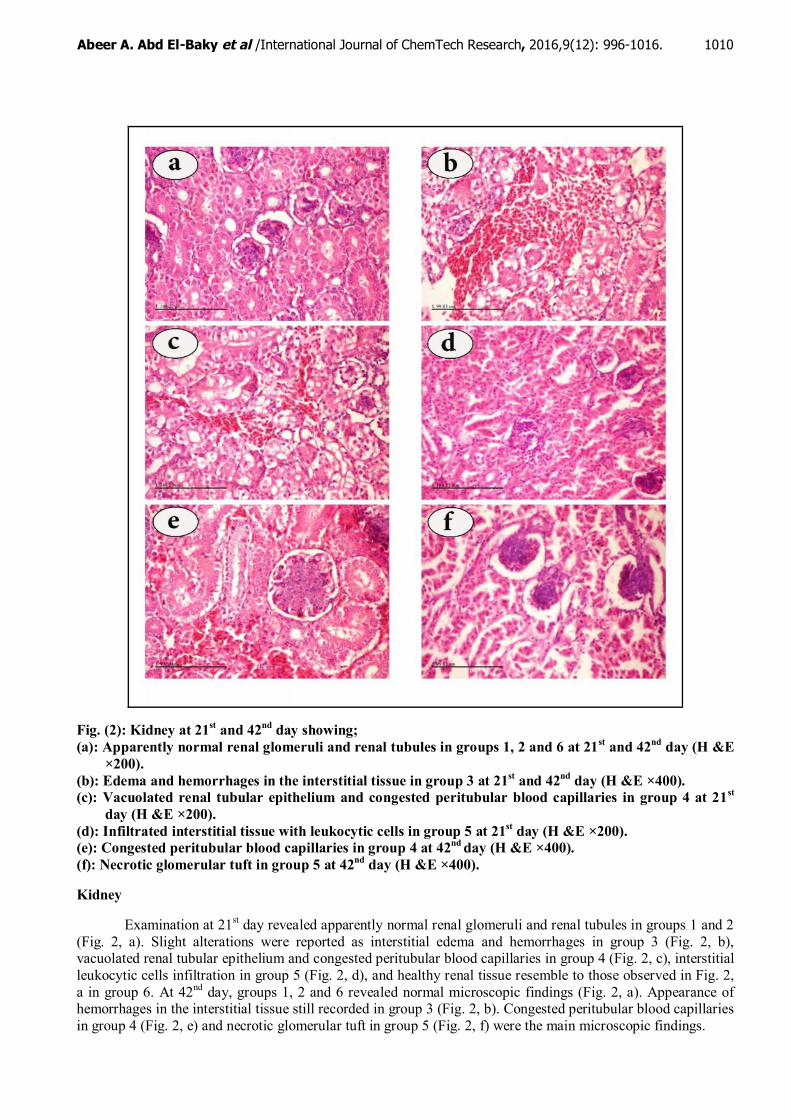
Fig. (2): Kidney at 21st and 42nd day showing;(a): Apparently normal renal glomeruli and renal tubules in groups 1, 2 and 6 at 21st and 42nd day (H &E
×200).(b): Edema and hemorrhages in the interstitial tissue in group 3 at 21st and 42nd day (H &E ×400).(c): Vacuolated renal tubular epithelium and congested peritubular blood capillaries in group 4 at 21st
day (H &E ×200).(d): Infiltrated interstitial tissue with leukocytic cells in group 5 at 21st day (H &E ×200).(e): Congested peritubular blood capillaries in group 4 at 42nd day (H &E ×400).(f): Necrotic glomerular tuft in group 5 at 42nd day (H &E ×400).
Kidney
Examination at 21st day revealed apparently normal renal glomeruli and renal tubules in groups 1 and 2(Fig. 2, a). Slight alterations were reported as interstitial edema and hemorrhages in group 3 (Fig. 2, b),vacuolated renal tubular epithelium and congested peritubular blood capillaries in group 4 (Fig. 2, c), interstitialleukocytic cells infiltration in group 5 (Fig. 2, d), and healthy renal tissue resemble to those observed in Fig. 2,a in group 6. At 42nd day, groups 1, 2 and 6 revealed normal microscopic findings (Fig. 2, a). Appearance ofhemorrhages in the interstitial tissue still recorded in group 3 (Fig. 2, b). Congested peritubular blood capillariesin group 4 (Fig. 2, e) and necrotic glomerular tuft in group 5 (Fig. 2, f) were the main microscopic findings.

Abeer A. Abd El-Baky et al /International Journal of ChemTech Research, 2016,9(12): 996-1016. 1011
Ileum
Examination at 21st day revealed apparently normal mucosa and submucosa in group 1 (Fig. 3, a) while,groups 2 and 6 showed a lot of crypts which their lining was columnar epithelium giving increase in ileal villusheight to crypts depth (Fig. 3, b). Microscopic findings of the rest groups including infiltrated mucosa withleukocytic cells in group 3 (Fig. 3, c), necrotic glands in group 4 (Fig. 3, d), and congested submucosal bloodvessel in group 5 (Fig. 3, e) were recorded. At 42nd day, the same findings to those at 21st day were noticed in allgroups.
Fig. (3): Intestine (ileum) at 21st and 42nd day showing;(a): Apparently normal mucosa and submucosa in group 1 (H &E ×100).(b): Normal mucosa appeared with many crypts which lined with columnar epithelium and normal
submucosa is in groups 2 and 6 (H &E ×200).(c): Infiltrated mucosa with leukocytic cells in group 3 (H &E ×200).(d): Necrotic glands in group 4 (H &E ×200).(e): Congested submucosal blood vessels in group 5 (H &E ×400).

Abeer A. Abd El-Baky et al /International Journal of ChemTech Research, 2016,9(12): 996-1016. 1012
Fig. (4): Spleen at 21st and 42nd day showing;(a): Apparently normal splenic follicles in groups 1, 2 and 6 (H &E ×400).(b): Scanty splenic follicles in group 3 (H &E ×400).(c): Congested splenic follicles in group 4 (H &E ×400).(d): Atrophied follicles and thick walled blood vessels in group 5 (H &E ×400).
Spleen
Examination at 21st day, showed apparently normal white and red pulps in groups 1, 2 and 6 (Fig. 4, a).Main finding in group 3 was scanty splenic follicle (Fig. 4, b). Group 4, revealed the presence of congestedsplenic follicle (Fig. 4, c). Atrophied follicles and thicken wall blood vessel were detected in group 5 (Fig. 4, d).At 42nd day, same findings to those at 21st day were observed in all groups.
Bursa of Fabricious
Examination at 21st day, revealed apparently normal lymphoid follicles in groups 1 and 2 (Fig. 5, a).Atrophied follicles due to inbetween edematous pressure in group 3 (Fig. 5, b), thickening of interfollicularblood vessel wall in group 4 (Fig. 5, c), perifollicular fibrosis in group 5 (Fig. 5, d) and scanty follicles in group6 (Fig. 5, e) were noticed. At 42nd day, the same findings were recorded in groups 1, 2 and 3. Microscopicfindings in group 4 progressed into congestion of interfollicular blood vessel with interfollicular fibrosis (Fig. 5,f). Scanty follicles were observed in group 5 (Fig. 5, e). Group 6 showed healthy renal tissue as showed in Fig.5, a.

Abeer A. Abd El-Baky et al /International Journal of ChemTech Research, 2016,9(12): 996-1016. 1013
Fig. (5): Bursa at 21st and 42nd day showing;(a): Apparently normal lymphoid follicles in groups 1 and 2 at 21st day and in group 6 at 42nd day (H &E
×400).(b): Atrophied follicles due to edematous pressure in-between the follicles in group 3 at 21st and 42nd day
(H &E ×400).(c): Thickening of the interfollicular blood vessels wall in group 4 at 21st day (H &E ×400).(d): Perifollicular fibrosis in group 5 at 21st day (H &E ×400).(e): Scanty follicles in group 6 at 21st day and in group 5 at 42nd day (H &E ×400).(f): Congestion of the interfollicular blood vessels with interfollicular fibrosis in group 4 at 42nd day (H
&E ×400).
Thymus
Examination at 21st day, showed apparently normal thymic cortex and medulla in groups 1 and 2 (Fig.6, a and b), respectively. Congestion inbetween the cortical lymphoid cells was the main recorded alteration ingroup 3 (Fig. 6, c). Scanty cortical lymphoid cells were seen in group 4 (Fig. 6, d). Scanty medullary lymphoidcells were observed in group 5 (Fig. 6, e). Congestion inbetween the medullary lymphoid cells were detected ingroup 6 (Fig. 6, f). At 42nd day, the same findings to those at 21st day were reported in all groups.

Abeer A. Abd El-Baky et al /International Journal of ChemTech Research, 2016,9(12): 996-1016. 1014
Fig. (6): Thymus at 21st and 42nd day showing;(a), (b): Apparently normal thymic cortex and medulla in groups 1 and 2 (H &E ×400).(c): Congestion in-between the cortical lymphoid cells in group 3 (H &E ×400).(d): Scanty cortical lymphoid cells in group 4 (H &E ×400).(e): Necrosed medullary lymphoid cells in group 5 (H &E ×400).(f): Congestion in-between the medullary lymphoid cells in group 6 (H &E ×400).
Discussion
It could be seen from the present study that, administration of Gro-2-Max® had positive effect onbroiler growth performance especially groups 2 and 6. This finding agrees with several reports that demonstrateprobiotic supplemented to chickens remodel their performance12 as a result of elaborating nutrient and energyutilization13 or changing the intestinal bacterial structure which assist the growth of beneficial bacteria resultingin healthier intestinal system for superior nutrients absorption14.
Increases in BWG and improvement in FCR associated with Gro-2-Max® may be resulted from theincreases in villi height and the hyperplasia of their epithelial which observed during microscopic examinationof ileal sections. These changes connected with increasing of intestinal absorptive surface area reverts thepositive effect of Gro-2-Max® on digestive and absorptive functions15.

Abeer A. Abd El-Baky et al /International Journal of ChemTech Research, 2016,9(12): 996-1016. 1015
Insignificant increase in erythrogram parameters could be attributed to production of more RBCs frombone marrow which evoked by erythropoietic factors released from activated hepatocytes by cause of probioticused16.
Significant lymphocytic leukocytosis may be resulted from the immuno-modulatory effect ofprobiotic17. The present lymphocytosis is suggestive of immunogenic stimulatory effect of the used probiotic asthe lymphocytes represent the majority of leukocytes in the peripheral blood of normal chickens and play aprinciple role in chicken immunity18.
Protein profile findings agree with Dimcho et al.19 who found probiotic supplementation did not changealbumin concentration of chicken. Significant decrease in lipogram including total cholesterol, totaltriglycerides and LDL-c concentrations may be related to the uses of probiotic which can digest cholesterolpresent in chicken gastro-intestinal tract for its own cellular metabolism thus downsizing the absorbedamount20. Another explanation is that, as Gro-2-Max® contains Pedicoccus acidilactici which is acidophilic,lowers the pH of the environment it occupies coupled with its high bile salt hydrolytic activity producedeconjugation of bile salts in intestine making it less soluble and less absorbable, thus preventing its action ascholesterol precursors result in reducing the amount of cholesterol present 21. Similar lipogram results werereported by Arun et al.22. Hypercalcaemia recorded may be directly follow the uses of probiotic which increasecalcium concentration23 or may indirectly from the present hyperproteinemia as there is a linear relationshipbetween total proteins and calcium concentration.
Results of our study concluded that, Gro-2-Max® has positive effect on chicken growth performanceand it is recommended to supplement chicken with Gro-2-Max® in ration especially from the 1st day of age andin drinking water every 3 days per week till the end growing phases (42 days). Gro-2-Max® has reducing effecton lipogram especially total cholesterol, total triglycerides and LDL-c concentrations, and has improving effecton intestinal function through increases of ileal villi height. Nonspecific immune responses were recordedthrough studying its effect on humeral and cellular immunity.
Author’s contribution:
AA and NS designed and executed the experiment. NS followed up the experiment. AA, NS and SA alldid their work according to their specification. AA and NS analysed the data. AA wrote the manuscript. Allauthors interpreted the data, revised and approved the manuscript.
References
1. Sultan, A., I. Uddin, S. Khan, R. Ullah, H. Khan, N.A. Khan, and R.U. Khan, 2015. Effect of YeastDerived Carbohydrate Fraction on Growth Performance, Apparent Metabolizable Energy, MineralRetention and Gut Histomorphology of Broilers during Starter Phase. Pak. Vet. J., 35(4): 409–413.
2. Ivkovc, M., L. Peric, D. Zikic, D. Cvetkovic, D. Glamocic, and P. Spring, 2012. Effects of a novelcarbohydrate fraction on broiler performance and intestinal function. S. Afr. J. Anim. Sci., 42: 131–138.
3. Patterson, J.A. and K.M. Burkholder, 2003. Application of prebiotics and probiotics in poultryproduction. Poult. Sci., 82: 627–631.
4. Yang, Y., P.A. Iji, and M. Choct., 2009. Dietary modulation of gut microflora in broiler chickens: areview of the role of six kinds of alternatives to in-feed antibiotics. Worlds. Poult. Sci. J., 65: 97–114.
5. Fuller, R. 1989. Probiotics in man and animals. J. Appl. Bacteriol., 66: 365–378.6. Lucio, B. and S.B. Hitchner. 1979. Infectious bursal disease emulsified vaccine: effect upon
neutralizing-antibody levels in the dam and subsequent protection of the progeny. Avian Dis., 23:466–478.
7. Tuohy, K.M., C.J. Ziemer, A. Klinder, Y. Knöbel, B.L. Pool-Zobel, and G.R. Gibson, 2002. A HumanVolunteer Study to Determine the Prebiotic Effects of Lactulose Powder on Human ColonicMicrobiota. Microb. Ecol. Health Dis., 14: 165–173.
8. Campbell TW, 2004. Hematology of birds. In: Veterinary Hematology and Clinical chemistry. Chapter17. (eds. Thrall MA, DC Baker DC, TW Campbell, D De Nicola, MJ) Lippincott Williams andWillkins, A Wolters Kluwer Company, Philadelphia, USA, pp 238–276.

Abeer A. Abd El-Baky et al /International Journal of ChemTech Research, 2016,9(12): 996-1016. 1016
9. Warnick, G.R., J. Benderson, J.J. Albers, and G.R. Cooper, 1983. Selected methods of clinicalchemistry. Amer. Assoc. Clin. Chem., 10: 91–99.
10. Snyder, D.B., W.W. Marquardt, E.T. Mallinson, P.K. Savage, and D.C. Allen, 1984. Rapid serologicalprofiling by enzyme-linked immunosorbent assay. III. Simultaneous measurements of antibody titers toinfectious bronchitis, infectious bursal disease, and Newcastle disease viruses in a single serumdilution. Avian Dis., 28(1):12–24.
11. Nariuchi H, 1989. New biochemical practise (12-I). in Jpn. Soc. Biochem., (ed.) Tokyo Kagaku doujinTokyo, Japan, pp151-152.
12. Yang, C.M., G.T. Cao, P.R. Ferket, T.T. Liu, L. Zhou, L. Zhang, Y.P. Xiao, and A.G. Chen, 2012.Effects of probiotic, Clostridium butyricum, on growth performance, immune function, and cecalmicroflora in broiler chickens. Poult. Sci., 91: 2121–2129.
13. Mahmood, K., S.U. Rahman, I. Hussain, R.Z. Abbas, T.Khaliq, J. Arif, and F. Mahmood, 2014. Non-antibiotic strategies for the control of necrotic enteritis in poultry. Worlds. Poult. Sci. J., 70: 865–879.
14. Liu, X., H. Yan, L. Lv, Q. Xu, C. Yin, K. Zhang, P. Wang and J. Hu, 2012. Growth performance andmeat quality of broiler chickens supplemented with Bacillus licheniformis in drinking water. Asian-Australasian J. Anim. Sci., 25(5): 682–689.
15. Hassan, H.M.A., A.W. Youssef, E.F. El-Daly, N.A. Abd-El-Azeem, E.R. Hassan and M.A. Mohamed,2014. Performance, Caecum Bacterial Count and Ileum Histology of Broilers Fed Different Direct-FedMicrobials. Asian J. Poult. Sci., 8(4): 106–114.
16. Sarma, M., D. Sapcota, S. Sarma, and A.K. Gohain, 2003. Herbal growth promoters on haemato-biochemical constituents in broilers. Indian Vet. J., 80: 946–948.
17. Abeer A. Abd El-Baky, 2013. Clinicopathological and immunological effects of multistrain probioticon broiler chicken vaccinated against Avian Influenza virus. Global Veterinaria, 10(5): 534-541.
18. Thrall, M.A., G. Weiser, R. Allison, and T.W. Campbell, 2012. Veterinary hematology and clinicalchemistry. Ed. Lippincott Williams and Wilkins, Maryland, USA.
19. Djouvinov, D., S. Boicheva, T. Simeonova, and T. Vlaikova, 2005. Effect of feeding lactina probioticon performance, some blood parameters and caecal microflora of mule ducklings. Trakia J. Sci., 3: 22–28.
20. Liong, M.T. and N.P. Shah, 2005. Acid and bile tolerance and cholesterol removal ability of lactobacillistrains. J. Dairy Sci., 88: 55–66.
21. Surono, I.S., 2003. In vitro probiotic properties of indigenous dadih lactic acid bacteria. AsianAustralas. J. Anim. Sci., 16: 726–731.
22. Panda, A.K., S.V.R. Rao, M.V.L.N. Raju, and S.R. Sharma, 2006. Dietary supplementation ofLactobacillus sporogenes on performance and serum biochemico-lipid profile of broiler chickens. J.Poult. Sci., 43: 235–240.
23. Panda, A.K., M.R. Reddy, S.V.R. Rao, and N.K. Praharaj, 2003. Production performance, serum/yolkcholesterol and immune competence of white leghorn layers as influenced by dietary supplementationwith probiotic. Trop. Anim. Health Prod., 35: 85–94.
*****