Embed Size (px)
Citation preview

Assessment of Educational Impact of
Rruga Sesam and Ulica Sezam in Kosovo
REPORT OF FINDINGS
PREPARED FOR
Sesame Workshop
J A N U A R Y 2 0 0 8 | N E W Y O R K , N Y
In Collaboration with SMMRI, Kosovo

2
Table of Contents
Introduction 3
Program and research objectives 5
Methodology 7
Sample description 15
Research Findings 18
General TV Behaviors and Opinions 18
Educational Impact 21
Mutual Respect and Understanding 21
Numeracy 33
Socio-Emotional Lessons 36
Appreciation of Human Diversity
Conclusions 45
Appendix A: Map of Kosovo 49
Appendix B: Data Analysis 50
Appendix C: Explanation of Odds, Odds Ratios, and Relative Probabilities 53
Appendix D: Pre- and Post-Test T-Scores by Ethnicity, Age, and Gender 55

3
Introduction
Kosovo confronts a range of social and political challenges that have real impact on the
development, socialization, and education of its young children. The region has suffered long-
term economic stagnation, and bitter ethnic conflict between the majority K-Albanian and
minority K-Serbian populations. Its political future is still uncertain and it exists in a sort of
political limbo which severely hinders foreign investment and long-term planning for civil and
economic development. Kosovo has been administered by the UN since 1999 and many parts of
the region are still patrolled by NATO forces. In spite of eight years of peace and rebuilding,
Kosovo still has the lowest per capita income of any European nation.1
Kosovo also happens to have one of the highest per capita populations of young children. Yet
access to early childhood education in Kosovo is limited.2 Development of basic cognitive and
socio-emotional skills for young children is badly needed, but of equal importance for the region
is the engendering of mutual respect between its Serbian-speaking population (K-Serbians) and its
Albanian-speaking population (K-Albanians.) Interestingly, both K-Serbians and K-Albanians
share a common culture, but harbor animosities rooted largely in history and religion.
Sesame Workshop took the initiative to develop a children’s program with wide-ranging
educational content to try to benefit children living in Kosovo who lack access to formal preschool
education. Sesame Workshop developed a unique program for the region in 2004, targeting both
the K-Albanian and K-Serbian populations, and entitled Rruga Sesam in Albanian and Ulica Sezam
in Serbian. The program incorporated material from Open Sesame (a version of the American
“Sesame Street” which has been adapted for international audiences) and combined it with live
action segments filmed in Kosovo. The show and its associated community-outreach program are
designed to help 3-7 year-old children with basic cognitive skills such as numeracy and literacy,
but also to help them learn about and appreciate the traditions and values of their own cultures, as
well as the cultures of their neighbors. In this regard, the program’s central themes include
teaching understanding, mutual respect, and appreciation of diversity. Rruga Sesam/Ulica Sezam
entered its second season on Radio Television Kosovo (RTK) in late 2006 – a multiethnic public
broadcaster with coverage of about 75% of the region. It also aired on three Serbian-language
1 Europe Newshttp://news.monstersandcritics.com/europe/news/article_1373467.php/BACKGROUNDER_Kosovo_- _Europes_highest_birth_rate_smallest_GDP UN Mission in Kosovohttp://www.unmikonline.org/pub/news/fact_sheet.pdf UN Statisticshttp://unstats.un.org/unsd/snaama/resultsCountry.asp?Country=412&SLevel=99&Year=0&x=33&y=12&Select ion=country UN Population Fundhttp://www.unfpa.org/focus/kosovo/background.htm2 Statistics on Education in Kosovo, 2001Statistical Office of Kosovo (SOK), UNICEF, and the Transitional Administrative Department of Education,
Science, and Technology (TA-DEST)

4
stations with reach limited to their respective local municipalities: TV Puls, TV Most, and TV
Herc.
In the summer of 2007, Sesame Workshop retained Fluent, a New York-based research and
consulting firm with extensive experience in international and children’s research, to develop and
conduct a formal assessment of the educational impact of Rruga Sesam and Ulica Sezam. Fluent
subcontracted the sample recruit, translation of instruments and protocols, and respondent
interviewing to Strategic Marketing Research, SMMRI Group, a firm based in Belgrade, with
offices in Kosovo and throughout the former Yugoslav republics.
The following report describes the methodology employed and the findings and conclusions from
that study.

5
Program and Research Objectives
The specific educational objectives of Rruga Sesam/Ulica Sezam are wide-ranging and include the
following:
Human Diversity:
! Appreciating similarities and differences
! Ethnic or cultural diversity
! Respect for other gender
! Children with special needs
! Language appreciation
Emotions:
! Recognizing and expressing emotions
! Self-control and appropriate emotional expression
! Self-esteem
Social groups and Institutions:
! Family and home
! Neighborhood
! Culture, sports, and the arts
! The natural and human-made environments
Health and Safety:
! Visiting the doctor
! Prevention
! Safety practices
Numeracy:
! Counting
! Numeral recognition
Literacy:
! Vocabulary development
! Letter recognition

6
Research Objectives
The program’s educational objectives were too extensive for an exhaustive and simultaneous
evaluation within the present study. The study was thus designed to assess the educational
impact of Rruga Sesam/Ulica Sezam programming on K-Albanian and K-Serbian children
with regard to a limited set of educational goals: specifically, numeracy, socio-emotional
lessons, and lessons related to the appreciation for human diversity. The process whereby this
particular set of objectives was selected is described in the following section on methodology.

7
Methodology
The study was designed as a randomized controlled trial (RCT) incorporating a “natural
exposure” style of intervention. Participants were randomly assigned to receive, or not receive, the
designated intervention.
TOTAL GROUP OF CHILDREN RECRUITED
CONTROL EXPERIMENTAL
PRE-TEST PRE-TEST
STIMULUS PROTOCOL(viewing Rruga Sesam/Ulica Sezam)
POST-TEST POST-TEST

8
The study consisted of the following steps:
1. Children with written parental/guardian consent to participate were randomly assigned to
either control or intervention conditions.
2. A pre-intervention questionnaire was administered to children in both the control and
intervention groups. The test was administered in the respective native languages of both K-
Serbian and K-Albanian children. Pre-tests were administered July 20-27, 2007.
3. The intervention for the experimental group consisted of a natural viewing of the show over
the course of six weeks at home.
4. A post-intervention questionnaire was administered to children in both control and
intervention groups. Post-tests were administered September 10-21, 2007.
5. Data was analyzed, assessing the pretest to posttest movement of the experimental group in
comparison with that of the control group.
Experimental design allows us to isolate the effects of a single variable (in this case, viewing Rruga
Sesam/Ulica Sezam), on the knowledge, attitudes and behaviors measured in the pre-intervention
and post-intervention tests. Pre-testing establishes a baseline from which to compare the control
and experimental groups. After post-testing is complete, control and experimental groups’
movement from pre-test to post-test is compared. This is a more powerful design than a simple
comparison of pre- and post-test scores for the intervention sample, because other factors in the
world may influence absolute scores. By comparing differences in movement between the
intervention and the control groups we can isolate impact attributable solely to the intervention.
It is this design that allows us to truly talk about causality, i.e. to be able to say that watching Rruga
Sesam/Ulica Sezam causes some specific outcome.
Sampling
We focused this study on 5-6 year olds. The decision to limit the age group to 5 and 6 year olds
was based on two considerations: one, the pilot test revealed that younger children had difficulty
comprehending some of the questions, particularly those related to socio-emotional and human
diversity questions, and they also fatigued easily. Secondly, by limiting the sample to a narrow age
range, we maximized statistical power to detect intervention effects.
The sample was split equally between K-Albanian and K-Serbian children. They were recruited
from multiple geographic locations representing both urban and rural K-Albanian and K-Serbian
populations. Participants in the control and experimental groups were matched on multiple
dimensions, including age, gender, ethnicity, and location. They were then randomly assigned to
either the intervention or the control groups.

9
Based on the sample size for the control and intervention groups, we had 91% statistical power to
assess potential effects of the program (i.e., a 91% probability of detecting any statistically
significant difference that might exist).
Impact assessments are not typically designed to produce results projectionable to the national or
regional populations. That is generally not their intent. The crucial factor in an impact study is
that the sample selected for the experimental group in no way differs in its make-up from the
sample selected for the control group. The recruiting parameters for an impact study differ
substantially from those for a nationally or regionally representative survey. For example, a truly
representative sample would be representative of the total population with respect to all major
demographic variables: ethnicity, socio-economic status, gender, age, geographic regions, religion,
etc.
Recruitment for impact studies is deliberately and necessarily clustered within a few sites in order
to facilitate testing. Also, while the best effort is made to recruit the sample randomly within those
sites, respondents’ willingness to participate in an extended study is also a prerequisite for their
recruitment. Thus, while the respondents in the study are certainly typical of the K-Albanian and
K-Serbian target-age children, the sample cannot be strictly held to be representative of the entire
population of children in the region.
Evaluation Instrument
Prior to the controlled viewing, an age-appropriate instrument tied to the educational curriculum
of Rruga Sesam /Ulica Sezam was administered one-on-one to children in both the intervention
and control groups.
The instrument was designed to assess the following, through a combination of standardized
measures and scenario-based questioning:
! Social cognition regarding concepts of fairness, cooperation, and conflict resolution
! Cognition regarding specific behaviors (water conservation and safely crossing streets)
! Intergroup attitudes (social inclusion and exclusion)
! Respect for others
! Social inclusion of others
! Social behaviors (in terms of interaction with others of diverse type)
! Awareness of cultural indicators within the child’s own and neighboring cultures
! Attitudes toward socializing/friendship with ethnically, linguistically, and culturally diverse
individuals
! Basic numeracy skills: numeral recognition and counting

10
The same instrument was re-administered to all children (in both control and experimental
groups) after the six-week period of viewing.
Development of the instrument was informed by the following:
1. Review of the specific episodes of the program that would be airing during the period of the
intervention;
2. Pilot-testing with children;
3. Prioritization of educational goals by Sesame Workshop.
The research team reviewed all of the Rruga Sesam/Ulica Sezam episodes that were due to air in
Kosovo during the intervention period. The object of this review was to evaluate the specific
content and determine the most salient educational objectives addressed in the set of intervention
episodes. While many other educational objectives are addressed in the series as a whole, the
intervention episodes were found to show particular strengths with regard to counting and
numeral recognition, the demonstration of a particular set of socio-emotional lessons (water
conservation, for example), and the illustration and appreciation of human diversity. Other areas
addressed in the set of episodes, though less consistently or overtly, included emotion recognition
and labeling, and the illustration of vocabulary – specifically, concept pairs such as up and down,
over and under, loud and quiet.
The full list of educational objectives addressed in the episode set scheduled to air during the
intervention was extensive. There were too many areas for all to be adequately assessed for impact
within the time limits necessarily imposed when testing young children. The Sesame Workshop
team was thus asked to prioritize the many educational goals of the program and indicate which
ones held the greatest importance in terms of the overall goals and vision for the program.
Based on the review of episodes and the specific priorities articulated by Sesame Workshop a draft
assessment instrument was developed. The second phase of instrument refinement involved the
pilot-testing of this draft instrument with children ages 4, 5, and 6 in Kosovo. When evaluating
impact with young children, pilot testing serves three essential functions:
1) Determining the appropriate length of the instrument;
2) Assessing the comprehensibility and age-appropriateness of the questions;
3) Determining if there is room for movement between the pre-test and post-test.
Based on findings from these three processes, the evaluation instrument was finalized to include
the areas of questioning described above, then translated into Albanian and Serbian.
A researcher from Fluent conducted training sessions with Albanian- and Serbian-language
speaking interviewers in order to insure adherence to the protocol of instrument administration.

11
The Intervention Protocol
Children in the intervention condition were instructed to view the show naturally, that is, as they
normally would at home, no less than two times a week for six consecutive weeks. Co-viewing
with friends or family was allowed. Children in the control condition were instructed not to view
the show.
Parents of the participating children were incentivized to follow the intervention protocol.
Parents were also asked to keep a diary of their child’s viewing behavior. This task was not
intended for informational purposes, but rather to enhance compliance with the viewing protocol.
In addition, researchers from SMMRI periodically contacted parents of children in the
intervention condition to insure compliance and to register if there have been any interruptions or
unforeseen problems. Aside from a few instances of power failure during airing of the show, no
major interruptions have been reported.
The program (both Serbian and Albanian language versions) aired on channel RTK four times a
week during the six-week intervention period.
The Intervention Period
The intervention period for studies of media impact can vary a great deal, depending on the
nature of the stimulus, the age of the target population, the nature of the anticipated impact (be it
cognitive, behavioral, or attitudinal, for example), the available budget, and how practicable the
assignment is for participants. Typically, the longer the intervention period, the greater the
opportunity for most stimuli to have effects and thus the greater the likelihood that those effects
can be detected. Longer interventions are particularly important when assessing behavioral
impact, as it often takes time for behavioral impact to be manifested and thus be measurable.
The length of the intervention period is also determined in conjunction with the intensity of the
intervention – that is, the frequency with which participants are exposed to the stimulus. If
participants are only able to view the stimulus infrequently, a longer intervention period is clearly
needed. If exposure to a stimulus can be intensified to multiple exposures per week, then the
intervention period can be much reduced.
Certain forms of impact will be manifest within a relatively short period of time; other forms
might require months or years. For example, impact with regard to a rooted prejudice or
stereotype might take much longer than impact with regard to a basic socio-emotional lesson such
as water conservation. A change in attitude, such as deciding math is not as scary as one might
have thought, can occur relatively quickly; yet behaviors reflective of that change in attitude might
not be evident for some time. Deciding that it is OK to be friends with someone with a foreign
accent can occur relatively quickly, but seeing a change in the actual number of friends with
foreign accents will realistically take time.
When assessing factual acquisition, such as numeral recognition, a shorter intervention period can
actually be essential. Too long an intervention might dilute the effects of the stimuli. For
12
example, young children in an intervention may learn to recognize numerals more quickly than
those in a control group, but if we wait too long in assessing this, children in the control are more
likely to have learned the numerals too, from some other source.
With regard to socio-emotional lessons, repetition naturally serves to reinforce them, so a longer
intervention allows time for certain cumulative effects to occur.
The challenge is in determining a length of intervention sufficient to allow a detectable level of
learning to occur, yet not so long as to be onerous for the participants. Longer intervention
periods also present greater budgetary and compliance challenges. In short, there is probably no
“typical” intervention period for assessment of impact of children’s media; each must be tailored
to the particulars of the situation and the content of the media in question.
Data Analysis
As described earlier, children who participated in the study were randomly assigned to a control or
intervention condition to ensure that any observed differences in the criterion variables could be
attributed to the intervention received by the experimental group, as opposed to differences that
existed between the two groups before the treatment was administered.
The effects of the intervention (exposure to Rruga Sesam/Ulica Sezam) on post-test outcomes were
tested using two different types of data analysis: ANCOVA, or analysis of covariance, and logistic
regression, or odds ratio analysis. The results of both types of analysis are presented in this report.
ANCOVA
The first step in this data analysis process was to create summary outcome scores for each of the
specific educational objectives tested in this study (Please see Appendix B for more details). Each
summary score was converted to an equivalent standardized T-score (expressed in units of
standard deviation) with a mean of 50 and standard deviation of 10. The T-score indicates a
child’s score, based on an average pre-test score of 50 and standard deviation of 10.
An inspection of the distributions of outcome scores indicated they were close enough to normal
to be amenable to conventional statistical analysis -- analysis of covariance. These analyses used a
2 x 2 design, crossing treatment condition (intervention vs. control) and ethnicity (K-Serbs vs. K-
Albanians), with pre-test scores controlled as a covariate. This model enables us to test both the
main effect of the intervention condition and potential interactions of the intervention with
ethnicity (i.e. whether the effects of viewing Rruga Sesam/Ulica Sezam differed significantly across
different ethnic groups). Secondary analyses of covariance crossed the effect of intervention
condition and age, intervention condition and gender, and intervention condition and settlement
type to test whether the effects of viewing Rruga Sesam/Ulica Sezam varied across age groups,
gender, and settlement types, respectively. ANCOVA allows us to isolate the effect of the
intervention (i.e., exposure to Rruga Sesam/Ulica Sezam) by controlling for differences between
the control and intervention groups in the pre-test.

13
In reporting the results of our analysis, we have included the following statistical measures to
provide a quantifiable measure of the magnitude of the intervention effect.
Cohen’s d: Cohen's d is the effect size measure used in our analysis. d is defined as the
difference between the post-test means of the intervention and the control group divided by
the standard deviation of the pre-test score of the total sample. A widely accepted
interpretation of the resultant effect size is that 0.2 is indicative of a small effect, 0.5 a medium
effect, and 0.8 a large effect size.
F Statistic: The F statistic basically tells us whether the observable variance is due to the
intervention rather than chance. The more variation caused by experimental factors the larger
the F ratio.
p-value: Probability values indicate the level of statistical significance.
Logistic Regression
Logistic regression is used to predict the probability of an outcome when the dependent variable is
dichotomous. The first block of the logistic regression tested main effects of condition
(intervention vs. control groups) while controlling for effects of pre-tests and ethnicity. This
allowed us to determine if exposure to Rruga Sesam/Ulica Sezam had a significant impact on
children, while controlling for differences between the intervention and control groups in the pre-
tests and for differences between K-Albanian and K-Serbian children. The second block of the
logistic regression added the ethnicity x condition interaction term to the model. This allowed us
to determine whether the effects of the intervention were greater for one of the ethnicities. To
further examine effects within ethnic groups, we ran two logistic regressions for K-Albanian and
K-Serbian samples, predicting post-test outcomes from pre-test scores and viewing condition.
The results of this analysis are reported in odds ratios (including 95% confidence interval and p-
values) and risk ratios (or relative probabilities of an outcome). For more explanation of odds,
odds ratios, and relative probabilities see Appendix C.
In analyzing the data from this study, we have applied a rigorous standard for determining the
statistical significance of evidence for positive impact of the intervention. Statistical significance is
indicated throughout this report, and p-values (probability values) reported, using the following
parameters:
Strong Statistical Significance: P-values of .05 or lower, indicating with 95%+ confidence
that the observed difference between two groups (here, experimental and control groups) are
“real differences”. This is the standard used throughout most of the academic community.
Borderline Statistical Significance: P-values of .05 to .10, indicating with 90% confidence
that the observed differences between two groups are “real” differences. This is a strong
suggestion of significance, but is less definitive.
Non-Significance: P-values of greater than .10 are not considered statistically significant.
However, the findings may be worth noting and indicate potential impact when we either see

14
‘almost significant values’ (those just past our threshold) or trends across multiple measures.
In a larger-scale study such findings could potentially be significant.
A Note on Data Reporting
All findings presented in the report are based on the data that meet statistical significance levels
described above. We specify which educational objectives didn’t result in significant impact on
the experimental group. All significant interaction effects of ethnicity, gender, and age are also
noted in the report. The absence of any reference to the differences between ethnic, gender, or age
groups means that there were no significant interaction effects. The T-scores for pre- and post-
test scales by ethnicity, gender, and age – both significant and non-significant – are included in
Appendix D.
As mentioned above, some results are presented in two ways, using both continuous scores
(assessed with analysis of covariance) and dichotomous scores (assessed with logistic regression).
Results from these two approaches may sometimes differ. Analyses of continuous variables are
generally (but now always) more sensitive and more likely to show significant main effects and
interactions. Dichotomized results are often less sensitive but are more understandable for a lay
audience.

15
Sample Description
The total sample of 5 and 6 year-old children participating in the study was 536.
! 253 were in the experimental group;
! 283 were in the control group.
The proposed goal was to recruit a total of 480 children (240 for the experimental group and 240
for the control group). We ended up with a substantially larger number due to the fact that
attrition between pretest and posttest was less than anticipated. Just 44 participants in the pretest
failed to take the posttest. The additional numbers of respondents served to provide us with
added analytical power to detect impact.
Children’s Sample
ETHNIC GROUP
Intervention Control TOTAL
K-Albanian 134 138 272
K-Serbian 119 145 264
TOTAL 253 283 536
GENDER
Intervention Control TOTAL
Boys 129 156 285
Girls 124 127 251
TOTAL 253 283 536
AGE
Intervention Control TOTAL
5 years old 134 139 273
6 years old 119 144 263
TOTAL 253 283 536

16
VIEWERSHIP OF RRUGA SESAM/ULICA SEZAM
Intervention Control TOTAL
Viewers 47 48 95
Non-viewers 197 231 428
TOTAL 244 279 523 *
* 13 respondents did not know
SETTLEMENT TYPE
Intervention Control TOTAL
Urban 112 158 270
Rural 141 125 266
TOTAL 253 283 536

17
Parental Demographics
The average parent in the study was between the ages of 30-39, had completed some level of
secondary education, and had average or slightly below average income.
Age: Control
27%
57%
12%
2%
1%
1%
18-29 30-39 40-49 50 -59 60 or over RefusedAge: Intervention
22%
60%
15%
2%
1%
18-29 30-39 40-49 50 -59 Refused
Education Level: Intervention
21% 23%
56%
Elementary Secondary College
Education Level: Control
28%
57%
15%
Elementary Secondary College
Household Income: Intervention
15%
21%
47%
12%
5%
A lot under the average income A little under the average income About average
A little over average income A lot above average income
Household Income: Control
17%
22%
34%
18%
7% 2%
A lot under the average income A little under the average income About average
A little over average income A lot above average income Don`t know/Refused

18
Research Findings
General TV Behaviors and Opinions
Viewership
The level of viewership as determined from the sample of children in this impact study vary
somewhat with those found in the viewership study, which was conducted independently. The
viewership study reported the reach of the show among 23% K-Albanian children and 2% K-
Serbian children, as reported by their parents3. In the impact study, we asked children directly in
the pre-test whether they watch the program or not.
17% percent of children in the total pretest sample (N=580) reported that they watch Rruga
Sesam/Ulica Sezam. Another 7% said they don’t watch now, but used to; 73% said they had never
seen it. 97% of those who watch the show were K-Albanian; only 3% were K-Serbian.
This means that 33% of K-Albanian children indicated that they watch the show and 3% of K-
Serbian children. (While the noted levels of viewership from the two studies was roughly the same
for the K-Serbian children, it was about 10% higher in this study for the K-Albanian children).
Do you watch Rruga Sesam/Ulica Sezam? K-Albanian
children
K-Serbian
children
Total
sample
Currently watch 33% 3% 17%
Used to watch it 5% 10% 7%
Never seen it 62% 87% 73%
TOTAL 100% 100% 97%
The variance with the viewership study is most likely attributable to the fact that the sample
populations differed: the viewership study was based on the random samples of K-Albanian and
K-Serbian parents of children ages 3 to 7; whereas the samples recruited for the impact study were
not randomly recruited and included children ages 5 and 6 only. Thus, the level of reach reported
in the viewership study is more accurate, despite the fact that parents are probably less reliable in
reporting their child’s viewing behavior than children themselves.
3 Viewership and Reach of Rruga Sesam and Ulica Sezam in Kosovo . Report of Research Findings. Fluent. October 2007.

19
Rruga Sesam/Ulica Sezam viewership variations by gender and by age
Male Female
Five Years Six Years Five Years Six Years
Currently watch 9% 11% 7% 11%
Used to watch it 4% 2% 2% 4%
Never seen it 41% 33% 40% 36%
TOTAL 100% 100%
Opinions of the Show
Children in the experimental group were asked what they liked about the program after viewing
for six weeks. Many were seeing the show for the first time. The most common responses were as
follow:
! 17% mentioned the muppets (or “dolls”, as they called them)
! 13% said “everything”
! 12% mentioned the children
! 6% said Big Bird
! 4% said “the animals”
! 6% did not know
The remainder cited reasons unique to just one or two children.
When asked, in the pre-test, to name their favorite show, less than one percent mentioned Rruga
Sesam/Ulica Sezam. There was a good deal of difference between the favorite TV shows of K-
Albanian children and the favorites of K-Serbian children, as shown in the following charts:

20
When asked again in the post-test, 9% of K-Albanian respondents and 5% of K-Serbian respondents now said
Rruga Sesam/Ulica Sezam was their favorite show.
Top Albanian Favorites
13.2%
6.0% 6.0%
4.2%
2.8%2.3% 2.3%
Tom I
Dzzeri
Bang Bang Cartoons Teletabisi Barbi Top Hop
Hiti
Snezzana
Top Serb Favorites
10.70%
2.60% 2.30% 2.10% 1.90% 1.60% 1.40%
Cartoons Pokemoni Jagodica
Bobica
Nindzza
Kornjache
Sundjer
Bob
Kockalone
Teletabisi Tom I
Dzzaeri

21
Educational Impact
Mutual Respect and Understanding
We measured the impact of the intervention on five lessons in the category of appreciation of
human diversity: recognition of similarities, receptiveness to a foreign child, receptiveness to a
child who speaks different language, receptiveness to a child of different ethnicity, and
receptiveness to a Roma child. There is evidence of positive impact on children’s attitudes
towards children from different ethnic backgrounds, in particular among K-Serbian children.
Recognition of Similarities
Children were presented with a photograph of an African-American child (of the same gender as
the respondent) and asked a series of questions about the child.
! Do you think this child likes to play and have fun like you do?
! Do you think this child likes to eat [a food typical for the ethnicity of the respondent]?
! Do you think this child loves to spend time with his/her family and friends like you do?
! Do you think this child tries to be good and do the right thing like you do?
Movement was assessed based on an index of this set of questions.
There was significant impact with regard to identifying similarities that children share with other
children of distinct race/ethnicity (d = 0.25, F1, 531 = 6.836, p < .01). The standardized means for
the intervention group increased from 49.3 at pre test to 51.2 at post-test. For the control group,
the standardized means actually slightly declined from 50.6 at pre-test to 49.1 at post-test.
49.3
51.2
50.6
49.1
47.5
48.0
48.5
49.0
49.5
50.0
50.5
51.0
51.5
Recognition of Similarities
Intervention Pre Intervention Post Control Pre Control Post

22
Receptiveness to Foreign Child
Receptiveness to a foreign child was tested with a scenario-based question. Children were shown a
photograph of a Chinese child dressed in traditional attire. The child in the picture was of the
same sex as the respondent in order to control for possible aversion based on gender. They were
then asked a series of questions about their willingness to interact with the pictured child. These
questions addressed the respondent’s openness to gradually increasing degrees of social inclusion.
An index of responses to this set of questions was then created for the purposes of analysis.
! Would you want to meet this child?
! Would you want to play with this child? If yes, how much?
! Would you want to be friends with this child? If yes, how much?
! Do you think he/she would want to be friends with you?
! Would you want this child to come to your house? If yes, how much?
! Would you want to go to his/her house?
There was significant positive impact in terms of receptiveness to a foreign child. Post-test scores
on receptiveness to a foreign child were significantly higher among children in the intervention
group than in the control group (d = 0.25, F 1, 531 = 13.934, p < .00). The standardized scores for
the intervention group increased from 51.2 to 53.5 and that for the control group increased from
48.9 to 50.3.
51.2
53.5
48.9
50.3
46.0
47.0
48.0
49.0
50.0
51.0
52.0
53.0
54.0
Receptiveness: Foreign child
Intervention Pre Intervention Post Control Pre Control Post

23
There was also significant interaction by ethnicity: impact was greater among K-Serbian children
(d = 0.46) than among K-Albanian children (d = 0.08). This enhanced impact among K-Serbians
was repeated for several areas of assessment related to mutual respect and understanding.
Receptiveness to Roma child
Roma are a minority ethnic group of Kosovo. To test receptiveness of children to a child of this
ethnicity we used a scenario-based question. Children were shown a photograph of a Roma child
(of the same gender as the respondent in order to control for possible gender aversion). They
were then asked a series of questions about their willingness to interact with the pictured child.
These questions addressed the respondent’s openness to gradually increasing degrees of social
inclusion. An index of responses to these questions was then created for analytical purposes.
Post-test scores on receptiveness to a Roma child were significantly higher among children in the
intervention group than in the control group (d= 0.23, F1, 531, p < .001). For the intervention
group, the standardized means increased from 50.5 to 53.5 and for the control group increased
from 49.5 to 51.1.
49.27
51.58
48.30
50.43
53.35
55.62
49.54
50.17
44.00
46.00
48.00
50.00
52.00
54.00
56.00
58.00
Receptiveness: Foreign Child
Pre-Albanian Intervention
Post-Albanian Intervention
Pre-Albanian Control
Post-Albanian Control
Pre-Serbian Intervention
Post-Serbian Intervention
Pre-Serbian Control
Post-Serbian Control

24
Further analysis revealed interaction effects by location (F 1, 531 = 7.992, p < 0.005). There was
greater impact among children from rural areas (d = 0. 35) than among children from urban areas
(d = -0.05).
50.5
53.5
49.5
51.1
47.0
48.0
49.0
50.0
51.0
52.0
53.0
54.0
Receptiveness: Roma child
Intervention Pre Intervention Post Control Pre Control Post
48.5348.97
48.65
49.52
52.12
57.07
50.62
53.01
44.00
46.00
48.00
50.00
52.00
54.00
56.00
58.00
Receptiveness: Roma Child
Pre Urban
InterventionPost Urban
Intervention
Pre Urban Control
Post Urban Control
Pre Rural
InterventionPost Rural
Intervention
Pre Rural Control
Post Rural Control

25
Receptiveness to child who does not speak same language
Children were provided a scenario in which a group of children are playing when they are
approached by another child. The new child does not speak their language but wants to join the
game. It was not specified what language the new child spoke. A series of questions follow, asking
what they think they children would do and what they should do.
! Do you think the kids would play with [the child in the picture]?
! Would some of them play with the child or all of them?
! Do you think the kids should play with the child?
! Do you think all of the kids should play with the child or only those who want to?
! Why is it OK/not OK to play with the child? (Open-ended).
Analysis of impact was based on an index of these questions.
Children in the intervention group scored significantly higher on receptiveness to child who does
not speak the same language at post-test than did children in the control group (d= 0.21, F1, 527 =
8.572, p < .004). For the intervention group, the standardized means increased from 50.6 to 53.6
and from 49.5 to 51.3 for the control group.
50.6
53.6
49.5
51.3
47.0
48.0
49.0
50.0
51.0
52.0
53.0
54.0
Receptiveness: Child speaks different language
Intervention Pre Intervention Post Control Pre Control Post

26
Further analyses revealed that the effects of viewing the show are moderated by ethnicity (F1, 527
= 6.402, p < 0.01). The effects of viewing Rruga Sesam/Ulica Sezam are significantly greater on
Serbian children (d = 0.42) than on Albanian children (d = 0.03).
49.42
51.84
50.03
51.7451.96
55.69
48.91
50.89
44.00
46.00
48.00
50.00
52.00
54.00
56.00
58.00
Receptiveness: Child Speaks Different Language
Pre-Albanian Intervention
Post-Albanian Intervention
Pre-Albanian Control
Post-Albanian Control
Pre-Serbian Intervention
Post-Serbian Intervention
Pre-Serbian Control
Post-Serbian Control

27
Sample responses of children who indicated in the post-test that it is OK to play with the child:
All children should play, so he should also play with us
Because he does not have friends and it is good to offer friendship to someone
Because he is miserable and does not have anyone to play with
We should all play together, because that’s what our teacher in school tells us
It is a sin, he doesn’t have any friends and his home is faraway
To play because the poor devil does not have friends, he is alone
If we do not play with him he will tell our fathers to go to jail
Because everyone wants to have friends
To teach him to speak Albanian
To have more friends for playing
To avoid being alone, to learn language
So that he wouldn’t envy us
He is not guilty for not speaking Serbian
In order to socialize and play football together
I do not have a friend whose name is Viktor
He will teach me to speak another language
Because you must accept children who speak other language as well
Sample responses of children who indicated that it is OK to not play with the child:
Because she is going to cry and she is poor, since she does not speak Albanian
Because we cannot communicate
The child does not speak our language and he should play alone
Because they have their friends, he also has his friends
Because he is no good since he does not speak Albanian
If a child does not speak Serbian, how can they play
Because they do not understand each other
Because he is maybe an Albanian
I do not like him

28
Receptiveness to child who speaks Serbian (for K-Albanians) or Albanian (forK-Serbians)
Significant positive impact with regard to mutual respect and understanding is again evidenced
based on another index of scenario-based questions. Children were provided scenarios that varied
by the ethnicity of the respondent. K-Serbian children were presented a scenario in which a group
of Serbian-speaking children are approached by an Albanian-speaking child and asked for help.
K-Albanian children were presented a scenario in which a group of K-Albanian-speaking children
are approached by a Serbian-speaking child and asked for help. A series of questions followed
each scenario, asking respondents what they thought the children would do and what the children
should do. An index of the responses to this group of questions was created as the basis for
analysis.
Children in the interaction group scored significantly higher at post-test than children in the
control group (d = 0.2, F1, 528 = 7.27, p < 0.01). Standardized means for the experimental group
increased 51.1 to 53.3 and that for the control group increased from 49 to 50.8 from pre-test to
post-test.
51.1
53.3
49.0
50.8
46.0
47.0
48.0
49.0
50.0
51.0
52.0
53.0
54.0
Receptivness: Kosovar of different ethnic background
Intervention Pre Intervention Post Control Pre Control Post

29
Again, the effects of viewing Rruga Sesam/Ulica Sezam are significantly moderated by ethnicity (F
1, 528 = 7.486, p < 0.01). K-Serbian children showed a substantial gain (d = 0.42) compared to K-
Albanian children (d = -0.05).
Sample responses of children who indicated in the post-test that it is OK to help the child:
Because a car might hit him, he is completely lost, somebody from the street might take him away, somewhere very far
Because a child does not know the surrounding and he can lose his way, he does not speak Albanian
Because a child is an Albanian in a Serbian Village and in order to protect him from being beaten by somebody
One should help everybody who needs help
So that a child could find his house, because he has his father, mother, sister there
Because some highway men may take the child away
A child should be helped because he does not speak Albanian and he can lose his way
Because he does not have anything, he is without any bread, poor little boy, he is going to die and he is crying
He should be given help because he is alone and he has lost his way
I feel sorry for such a child, it is pity and for such reasons, I would help him
Regardless of everything one should help a child
Because some dogs might eat him during the night
51.88
52.83
50.05
52.45
50.15
53.85
48.09
49.25
45.00
46.00
47.00
48.00
49.00
50.00
51.00
52.00
53.00
54.00
55.00
Receptiveness: Kosovar of Different Ethnic Background
Pre-Albanian Intervention
Post-Albanian Intervention
Pre-Albanian Control
Post-Albanian Control
Pre-Serbian Intervention
Post-Serbian Intervention
Pre-Serbian Control
Post-Serbian Control

30
Sample responses of children who indicated that it is OK to not help the child:
A child does not understand when you tell him something in Albanian
I would become a child of the streets and be alone
Because she is an Albanian and we do not talk to Albanians
Because I do not want to
It is not acceptable to help an Albanian, because he kills Serbian people
Because he is a Roma Child
I do not have such a wish
It is not acceptable
Just because
They do not speak the same language
Mutual Respect and Understanding: Logistic Regression Results
Children’s responses regarding their receptiveness to a foreign child, to a Roma child, to a child
who speaks a different language, and to a child of a different ethnic background (Serbian for K-
Albanian respondents and Albanian for K-Serbian respondents) were all related (alpha = .67) and
were therefore combined into a single index. Children’s scores on this index ranged from 0 (no
appreciation of mutual respect and understanding) to 100 (full appreciation of mutual respect and
understanding). We categorized children who scored 80 or higher on this index as having “mutual
respect and understanding” attitudes.
At pre-test, 28% of children scored in the mutual respect range. There was no significant
difference between the intervention (30%) and the control (27%) groups at pretest (chi-square (1)
= 0.5, not significant).
At post-test, the proportion of children with the mutual respect attitudes increased from 30% to
49% in the intervention group; whereas it was almost unchanged (from 27% to 30%) in the
control group.
Statistically controlling for children’s ethnicity and pre-test scores, more children had mutual
respect and understanding attitudes at post-test in the intervention group than in the control
group (odds ratio = 2.5, odds ratio 95% confidence interval = 1.7 to 3.7, p < .001). This means
that controlling for pre-test scores and ethnicity, children in the intervention condition were 74%
more likely than children in the control condition to demonstrate positive attitudes towards
children from different ethnic backgrounds.

31
We further examined whether Sesame Street had similar effects among K-Serbian and K-Albanian
children. Viewing Sesame Street produced particularly strong changes among K-Serbian children
(experimental condition x ethnicity odds ratio = 1.5, 95% confidence interval 1.01 to 2.17, p <
.05).
Mutual respect attitudes rose sharply (from 37% at pre-test to 68% at post-test) among K-Serbian
children who viewed Sesame Street; mutual respect attitudes among K-Serbian control children
rose only slightly from 30% to 37%. Logistic regression modeling confirmed that the effect of
Sesame Street viewing on K-Serbian children was strong and statistically significant (odds ratio =
3.6, 95% confidence interval = 2.1 to 6.1, p < .001). K-Serbian children who viewed Ulica Sezam
were 83% more likely than children who didn’t view the show to demonstrate positive attitudes
towards children from different ethnic backgrounds.
Mutual respect attitudes increased more modestly (from 23% to 33%) among Albanian children
who viewed Sesame Street, whereas Albanian control children were unchanged (23% at both pre-
test and post-test). The effect of Sesame Street on Albanian children approached statistical
significance (odds ratio = 1.7, 95% confidence interval = .97 to 3.0, p < .07).
Percent of children demonstrating Mutual Respect and Understanding attitudes
30%
49%
27%
30%
0%
10%
20%
30%
40%
50%
60%
Intervention Pre Intervention Post Control Pre Control Post
Percent of children demonstrating Mutual Respect and Understanding attitudes by ethnicity
23%
33%
23%
30%
37%
68%
30%
37%
0%
10%
20%
30%
40%
50%
60%
70%
80%
Pre-Albanian Intervention
Post-Albanian Intervention
Pre-Albanian Control
Post-Albanian Control
Pre-Serbian Intervention
Post-Serbian Intervention
Pre-Serbian Control
Post-Serbian Control

32
Interest in and knowledge of other languages
There is no significant impact on knowledge of foreign words by condition (d = 0.04, F1, 531 =
0.116, p < 0.7). However, effects of viewing Sesame were significantly moderated by age (F 1, 531
= 5.495, p< .02). 5-year-olds in the intervention condition showed a significant gain as compared
to 5-year-olds in the control condition (d = 0.15), whereas 6-year-olds in the intervention
condition showed a decline relative to the 6-year-olds in the control condition (d = - 0.11).
Further, when asked to tell us some of the words they knew in other languages, the mean number
of words that 5-year olds in the experimental group knew rose from 1.8 to 3.7 between pre-test
and post-test. The mean number of words that 5-year-olds in the control group knew rose from
1.8 to just 3.0.
There is no evidence of impact on foreign language interest based on ethnicity.

33
Numeracy
Numeral Recognition
Children were asked to identify 18 different numerals from 0 to 20. Potential impact was assessed
by calculating the average number of correct answers provided in the pretest, then comparing this
with the average number of correct answers provided in the posttest to determine the extent of
positive or negative movement.
Children in the intervention group scored significantly higher on numeral recognition at post-test
than did children in the control group (d=0.11, F 1, 531 = 3.85, p < .05). The bar chart below
presents details of the impact of Rruga Sesam/Ulica Sezam on numeral recognition. For the
intervention group the standardized means moved from 50.6 at pre-test to 53.3 at post-test, and
the control group moved from 49.5 at pre-test to 51.6 at post test. While the effect size is small for
this measure, it is statistically significant at the 95% confidence level.
50.6
53.3
49.5
51.6
47.0
48.0
49.0
50.0
51.0
52.0
53.0
54.0
Numeral recognition
Intervention Pre Intervention Post Control Pre Control Post

34
The interaction between ethnicity and condition is not statistically significant; that is, there was
positive movement in numeral recognition within both the K-Albanian and the K-Serbian sub-
samples of the experimental group. Thus, the intervention had a positive impact for both ethnic
groups.
Counting
Counting ability was assessed through a series of four exercises in which each child was shown a
picture of an assortment of objects or animals and asked to count them out loud in front of the
moderator. The moderator noted any mistakes in counting (skipping, misordering, guessing, long
pauses between numbers, etc.). The lowest number of objects in the pictures was 5, the highest
was 17. Movement was calculated by comparing the number of correct responses given in the
four exercises in the pre-test with the number given in the post-test.
There is borderline significant positive movement in the experimental group relative to the control
group with respect to counting. Children in the intervention group scored higher on counting at
post-test than did children in the control group (d=0.12, F 1, 531 = 3.3, p < .07). The bar chart
below shows the standardized T-scores for counting. For the intervention group the standardized
means moved from 50.3 at pre-test to 51.8 at post-test, and the control group moved from 49.7 at
pre-test to 50.4 at post-test.
The interaction between ethnicity and condition is not statistically significant; that is, there was
positive movement in counting within both the K-Albanian and the K-Serbian sub-samples of the
experimental group.
50.3
51.8
49.7
50.4
48.5
49.0
49.5
50.0
50.5
51.0
51.5
52.0
Counting
Intervention Pre Intervention Post Control Pre Control Post

35
Combined Numeracy Scores: Logistic Regression Results
For logistic regression, we combined numeral recognition and counting into an index of
numeracy. Children’s scores on this index ranged from 0 (no numeracy skills) to 100 (perfect
numeracy skills). We categorized children who scored 90 or higher on this index as having
high numeracy skills.
At pre-test, 45% of children in the control group and 55% of children in the intervention
group scored high on numeracy skills.
At post-test, the proportion of children with high numeracy skills increased from 55% to 68%
in the intervention group, and from 45% to 56% in the control group.
Statistically controlling for children’s ethnicity and pre-test scores, more children improved
their numeracy skills at post-test in the intervention group than in the control group (odds
ratio = 1.58, odds ratio 95% confidence interval = 1.03 to 2.45, p < .05).
Children in the intervention group were 19% more likely than children in the control group
to give correct responses at post-test.
There were no significant interaction effects by ethnicity. However, there were significant
interaction effects by age and borderline significant interaction effects by gender:
! 5 year olds in the intervention group were 35% more likely than 5 year olds in the
control group to improve their numeracy skills at post-test as a result of their
exposure to intervention (odds ratio = 1.85, 95% confidence interval = 1.05 to 3.25, p
<.05).
! Boys in the intervention group were 35% more likely than boys in the control group
to improve their numeracy skills at post-test (odds ratio = 2.16, 95% confidence
interval = 1.20 to 3.88, p <.01).
Numeracy
55%
68%
45%
56%
0%
10%
20%
30%
40%
50%
60%
70%
80%
Intervention Pre Intervention Post Control Pre Control Post

36
Socio-Emotional Lessons
We have tested five socio-emotional lessons: cooperation, acceptance of different opinions, water
conservation, sharing, and road safety. There was evidence of positive impact with respect to two
socio-emotional lessons presented in the program during the intervention period: helping others
and conservation of water.
Helping
Children were provided a scenario in which they were shown a picture of a child carrying a large
stack of books and struggling to hold them. They were then asked what they would do if they
encountered this child as they were walking past. The answer options included:
! Offer to help with her books
! Keep walking without stopping
! Tease or laugh at her
Movement was assessed from less cooperative to more cooperative options between the pre-test
and post-test.
There is significant positive movement in the experimental group relative to the control group
with respect to helping. Post-test scores on helping were significantly higher among children in
the intervention group than in the control group (d= 0.13, F 1, 519 = 4.71, p < .03). The
standardized means for the intervention group moved from 50.6 at pre-test to 52.4 at post-test,
while that of the control group increased from 49.3 to 50.9. While the magnitude of the effect is
relatively small, it is statistically significant.
50.6
52.4
49.3
50.9
47.5
48.0
48.5
49.0
49.5
50.0
50.5
51.0
51.5
52.0
52.5
53.0
Helping (books)
Intervention Pre Intervention Post Control Pre Control Post

37
Logistic analysis indicates that there is borderline significant impact on cooperation: 5%
probability of higher cooperation skills (odds ratio 1.99, 95% confidence interval 0.98-4.03,
p<.10)
There is significant interaction effect of ethnicity. Serbian children are 9% significantly more
likely to have higher cooperation skills as a result of their exposure to Ulica Sesam (odds ratio
= 11.54, 95% confidence interval 1.48-89.8, p<.02).
Sample responses of children when asked why they
would not stop to help or would laugh at her:
Sample responses of children who said they would
offer to help:
Because I can’t carry them.
I can’t carry the books because I am little too.
She dropped them, she can pick them up.
She should pick them up because she took too many in
the first place.
Those are her books not mine.
Because she is a girl.
She can do it by herself.
She doesn’t ask for help.
Because she is ugly.
She is not my friend
I don’t know her
Because you should offer help to children.
Because she will drop them, lose them, and will have no
books to study from.
Because she is tired.
Everyone who needs help should be helped.
Mother tells me to help others.
So that the books don’t get dirty.
You should help others.
Because the poor girl has a lot of books.
Because she can’t do it herself.
Because she is pretty.

38
Water conservation
To assess the potential impact around the lesson of water conservation, children were again
presented with a scenario and shown a picture illustrating the situation. The illustration showed a
boy brushing his teeth in a bathroom while water clearly runs from a faucet in front of him and a
shower behind him. Children were then asked a series of four questions about the scenario.
! Should the boy do anything differently – yes or no?
! Is it a good thing to let the water run when not using it? An OK thing? A bad thing?
! When you brush your teeth do you let the water run or turn it on only when needed?
The children were then asked why they did or didn’t let the water run to see if they specifically
mentioned saving water or not. We created an index of measures from this set of questions.
Children in the intervention group scored significantly higher on the socio-emotional lesson of
water conservation than did the control group (d = 0.19, F1, 531 = 7.019, p < .01). This particular
lesson was explicitly and repeatedly addressed in one of the program’s episodes. For the
intervention group, standardized means increased from 50.8 to 53.3, and the control group moved
from 49.3 to 51.4.
50.8
53.3
49.3
51.4
47.0
48.0
49.0
50.0
51.0
52.0
53.0
54.0
Water conservation
Intervention Pre Intervention Post Control Pre Control Post

39
The effects of viewing Rruga Sesam/Ulica Sezam were significantly moderated by age (F1, 531 =
7.294, p < .06). While there was a positive movement for this measure among both 5-year-olds
and 6-year-olds, 5-year-olds showed a substantially greater gain (d = 0.33) compared to 6-year-
olds (d = 0.06).
There is virtually no interactions of condition by ethnicity. That is to say, the program works
equally well in this regard for both K-Albanian and K-Serbian children.
Results of the logistic regression confirmed that the impact of Rruga Sesam/Ulica Sezam was
significant. Children in the intervention group were 20% more likely than children in the control
group to have learned the water conservation lesson (odds ratio = 2.22, 95% confidence interval
1.41-3.51, p<.01).
50.40
54.11
48.39
50.9251.25
52.43
50.16
51.88
45.00
46.00
47.00
48.00
49.00
50.00
51.00
52.00
53.00
54.00
55.00
Water Conservation
Pre 5-year old Intervention
Post 5-Year old Intervention
Pre 5-year old Control
Post 5-year old Control
Pre 6 -year olds Intervention
Post 6 year old Intervention
Pre 6 year old Control
Post 6 year old Control

40
Sample responses of children when asked in the post-
test what the boy should do differently:
Sample responses of children when asked in the post-test
why it is a bad thing to let water run when not using it:
He should turn off the faucet and the shower, so he does
not waste water
Not to turn on the water unless you are using it
Stop the water while brushing your teeth
Turn on the water only when you need to wash your
toothbrush and clean your mouth
Turn off the water because the faucet can break
Turn it off because it is a sin to waste water
He should first wash his teeth, then turn on the water
Turn off the water because it can run out and then there
will be no more water
Stop the water because the house will be flooded, and he
will not be able to sleep
The boy needs to turn off the water because he is
wasting it
Turn off the water immediately, so that mother does
not beat me
It is used and we will not have it anymore; water is running
and we will pay a lot for this
Since my dad yells at me when I turn on water
Water is used up and then we will have to go to the well to
take water
Water should be saved
It’s a pity to use it without any need
Lest we use up water and then we will not have drinking
water and water for washing
Because it is no good to use water all day
Because mother may yell afterwards and pay a lot
Because water is used and then others don’t have any of it
Because we do not have enough water and we have to save it
House will be full of water and burst

41
Accepting different opinions
The assessment of the socio-emotional lesson of accepting different opinions is also based on a
scenario. Children were shown a picture of two children watching TV. They were told that one
child likes the show they are watching and the other disagrees and says the show is boring. They
were then asked a series of questions based on the scenario:
! What should the children do now?
o Should they argue until one of them wins?
o Should the child who doesn’t like the show leave?
o Should they find another show they both like?
! Can the kids still be friends even if they do not like the same show? Yes or no, and why?
With regard to accepting different opinions, there was no evidence of significant positive impact
by intervention condition.
49.6
52.1
50.3
52.2
48.0
48.5
49.0
49.5
50.0
50.5
51.0
51.5
52.0
52.5
Accept different opinions
Intervention Pre Intervention Post Control Pre Control Post

42
However, there were interaction effects by ethnicity (F1, 520 = 5.169, p < .02). Albanian children
showed a larger gain (d = 0.15), whereas Serbian children saw a decline (d= -0.17).
Further analysis revealed that the effect of viewing Sesame was also significantly moderated by
gender (F1, 520 = 3.859, p < .05). Boys showed a significant gain (d = 0.13), whereas girls showed
a decline of similar magnitude (d = -0.14).
Sample responses of children who indicated in the post-test that they should find another show they both like:
Because the one who doesn’t like it can get angry and upset
It’s not nice to fight, you should find something in common
Leave the TV and go out and play together
So that they wouldn’t argue
We should all watch the same and not argue, that is what father always says
Because I do not want to be mad at my friend
Because I wanted to watch the cartoon together with my friend and not by myself
Friends should not be mad at each other because of TV
Because he is his good friend
Because I do not want to argue with my friend, it is not nice to argue
Because I want to watch the show that we both like
Because it is nicer to watch it with someone
Because it is nice not to argue, you should be friends and watch the show everyone likes
50.83
51.43
50.65
52.82
48.42
52.76
50.08
51.65
46.00
47.00
48.00
49.00
50.00
51.00
52.00
53.00
54.00
Accept Different Opinions
Pre Girls
InterventionPost Girls
Intervention
Pre Girls Control
Post Girls Control
Pre Boys
InterventionPost Boys
Intervention
Pre Boys Control
Post Boys Control

43
Sample responses of children who indicated that the child who does not like the show should leave:
Because I like the show I was watching
He should watch it on his own, and those who don’t like it should let him watch
If he doesn’t like the show he doesn’t have to watch it
One of them will watch and the other time the other one
So that one of them can watch the show
So they wouldn’t argue
At my house, I decide what we are going to watch on TV
Because my friend cannot tell me what I am going to watch
Because it is not their house
She will watch it at home so that they wouldn’t argue
Because they would fight each other instead of watching
He shouldn’t disturb the other one from watching
Because they are not friends
Sample responses of children who indicated that they should argue until someone wins:
Boys always argue and fight
Because they do not know which one should watch TV
They should argue till the strongest one wins
To fight and beat like Spiderman
Because it is nice
Because they are not friends
Because you should fight and argue
It is ok to argue, because they do not like it
You should argue if you are stronger

44
Other socio-emotional goals
There was no evidence of significant impact of the program on the following socio-emotional
lessons:
! Sharing (d = .09, F1, 525 = 1.997, p < 0.2)
! Road Safety (Crossing the street with an adult, specifically) (d = 0.05, F 1, 531 = 0.22, p < 0.7)
This does not conclusively mean that the show has no impact in these regards, only that impact
was not detected within the methodological parameters of this study.
49.8
51.4
50.1
50.6
49.0
49.5
50.0
50.5
51.0
51.5
52.0
Sharing
Intervention Pre Intervention Post Control Pre Control Post
50.3
51.6
49.7
50.9
48.5
49.0
49.5
50.0
50.5
51.0
51.5
52.0
Road Safety
Intervention Pre Intervention Post Control Pre Control Post

45
Conclusions
Significant Educational Impact of Kosovo Co-Productions
These findings indicate that Rruga Sesam/Ulica Sezam is capable of having significant educational
impact on the children of Kosovo – within both the K-Albanian and K-Serbian communities --
and that the program has succeeded in meeting several of its core educational objectives,
including:
• Building mutual respect and understanding;
• Delivering specific socio-emotional lessons;
• Building the core foundations of numeracy.
Furthermore, the study indicates that children comprehend and retain specific social and
behavioral lessons from the program.
While the size of the impact on some areas is generally modest, it meets rigorous scientific criteria.
Impact, however small, implies that children are attentive to the show and comprehend the
content, and that they are viewing at an age when much of that content is still educationally
relevant.
This study does not allow us to comment on the full range of educational objectives of the show,
since only a select few educational objectives could be assessed within the parameters of the
research.
While there was no evidence of impact with regard to certain socio-emotional lessons (sharing and
road safety, specifically), this does not necessarily mean there was no effect, merely that it was not
strong enough to be detected within the methodological constraints of this study.
Given the relatively modest period of the intervention (six weeks) it can also be inferred that a
more extensive exposure to the programming could produce even greater impact.
Higher Receptivity of K-Serbian Children to Lessons on Mutual Respect andUnderstanding
The impact with regard to mutual respect and understanding was sizable and most clearly seen
among K-Serbian children. While this finding could potentially be reflective of cultural and
educational differences between the two populations, it is more likely explained by the fact that
Serbian-speaking children had much less exposure to the show prior to the intervention. Having
stated that, it is important to note that one of the limitations of an impact study is its inability to
explain why the intervention did or didn’t have an intended effect – it can only determine whether
the effect has taken place, and whether it can be attributed to the intervention. In other words, we

46
know that a six-week exposure to Ulica Sezam has resulted in a significant impact on K-Serbian
children’s attitudes toward human diversity, but we do not know why, and we do not know why it
didn’t have a similar effect on K-Albanian children. However, having the benefit of the contextual
information that the viewership study provided, we can make an informed assumption.
A study of the levels of viewership among the target populations of K-Albanian and K-Serbians
was conducted independently of the impact study. That study revealed that viewership levels
among K-Serbian children were quite low: only 2% of children ages 3-7. Viewership among K-
Albanian children was much higher: 23% of children ages 3-7. The reason for the disparity in
viewership seems to derive from the fact that the primary vehicle for delivery of Rruga Sesam/Ulica
Sezam is RTK – a channel that broadcasts mostly in Albanian and which very few K-Serbian
children watch. The program did air on several Serbian language channels, but only sporadically.
Furthermore, these Serbian-language channels had only limited reach within the region; none
were accessible region-wide.
This was reflected in the sample of children recruited to take part in the impact study. 38% of the
K-Albanian children in the study had watched the program prior to being tested for impact. Just
13% of K-Serbian children reported having seen the show, and most of these said they had
watched the show in the past, but no longer did so. As a result, the impact on K-Serbian children
was more readily detectable than that on K-Albanian children because there was less interfering
noise from previous exposure. For many K-Albanian children, some educational impact may well
have taken place prior to the study, making it more difficult to detect at the time of testing. In
short, the fact that the show was not reaching K-Serbian children served to provide ideal
experimental conditions for detecting the educational potential of the show.
Having stated the above hypothesis, it is also conceivable that the difference in the effect of the
intervention on K-Albanian and K-Serbian children’s attitudes towards mutual respect and
understanding is rooted in the unique experiences of their respective communities.
The Challenges of Assessing the Impact of Sesame Co-Productions
It is our experience that the educational impact of children’s media, in general, is extremely
difficult to assess with young children, for a variety of reasons. Foremost among them is that
children are exposed to such an array of stimuli and are typically learning so much so quickly that
isolating the effects of a single input requires extreme methodological rigor and precision.
Secondly, young children are at a developmental stage which limits their ability to fully articulate
their thoughts and which also limits the effectiveness of direct or prolonged questioning. Thus,
indirect approaches must frequently be used to derive useful information about their knowledge,
attitudes, and beliefs. In addition, it can be tricky predicting which educational goals to assess for
impact, since assessing all of them is rarely feasible within the typical time and budgetary limits.
There are three key components to a sound impact study:
o Appropriate design and sample size

47
o Instruments that measure the precise areas of impact in question
o Effective stimuli – stimuli that actually deliver on what they are intended to
accomplish.
Rruga Sesam/Ulica Sezam presents a unique challenge for assessment in that the educational goals
of the program are so extensive and the program content so varied. Any single episode of the
program touches briefly on a wide variety of educational objectives: different socio-emotional
lessons, numeracy, literacy, segments designed to build appreciation for different cultures and
different art forms, etc.
In contrast, many children’s programs focus on a select few educational objectives, which are
reinforced with every episode. Other programs employ a model in which a particular lesson serves
as the theme of a given episode, typically being built into the narrative of an episode and serving as
the source of the narrative drive or as the resolution of the narrative conflict. We might call this
“the lesson of the day” approach.
For Rruga Sesam/Ulica Sezam, selecting which of the myriad educational objectives to assess
required considerable deliberation (as described in the “Evaluation Instrument” section). But the
content pertaining to the selected educational objectives was still slight and often fleeting. One
reason the impact detected was often minimal is likely due to the fact that, even over the course of
viewing 12 episodes over six weeks, exposure to any particular content area was rarely intensive or
sustained, with two exceptions: numeral recognition and counting were displayed in every episode
that aired during the intervention period, as was exposure to different ethnicities and cultures. In
light of this, it made sense that we detected impact in areas that were more salient in the episodes
children viewed (numeracy and ethnic diversity). It also made sense that areas such as traffic safety
and sharing were not significant because this content was comparatively “thin” in the intervention
episodes.
We would anticipate that the show’s impact -- being spread comparatively thinly over so many
educational objectives – would necessarily be small with respect to any one of those objectives. In
other words, the ambitious nature of the show educationally serves to make any one specific area
of impact less pronounced and thus more difficult to detect.
The fact that the impact revealed in the study is modest is not surprising. The fact that there is
detectable impact at all, after six weeks of exposure to the program, is noteworthy and
encouraging.
In order to assess educational impact with young children, it is typically necessary to cast as wide a
net as possible in hopes of finding some single impact with respect to some intended goal. We
point this out merely to emphasize how rare it is to find evidence of significant educational impact
with regard to not just one, but several diverse educational objectives. In sum, achieving such
impact is no small accomplishment.
48
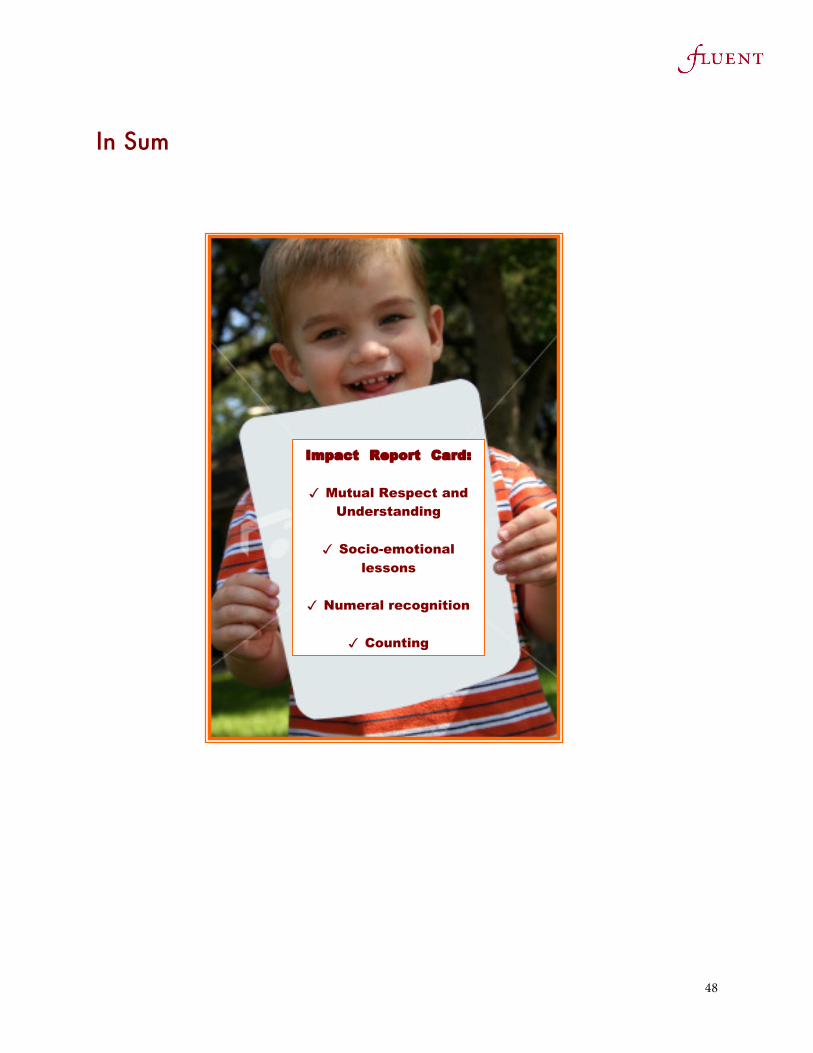
In Sum
Impact Report Card:
! Mutual Respect and
Understanding
! Socio-emotional
lessons
! Numeral recognition
! Counting

49
Appendix A

50
Appendix B: Data Analysis
For each educational area tested in the study, the intervention protocol contained several
questions often phrased slightly differently or with varying levels of difficulty, resulting in a large
number of variables.
To ensure that the data and results of the study were easily digestible we assembled the data in a
way that presents fewer variables. We grouped the variables into the following categories,
comprising of the key educations concepts being tested.
1. Numeral Recognition.
Children were asked to identify random numbers ranging from 0 to 20. Their responses from this
question were coded as 0=incorrect, 1=correct, and 9=no response. We recoded the variables so
that all “no response” answers were treated as “incorrect.” Here the assumption was made that
silence or refusal to respond on the part of the child was indication of their inability to recognize
the number shown to them.
We conducted a reliability tests on both the pre-test scores and the posttest scores to ensure that
the decision to group the responses in this category was statistically consistent. The Cronbach
Alpha was 0.966. As the alpha was greater than 0.7, we proceeded with creating a summary score
for numeral recognition.
The summary score for both the pre-test and post-test score was calculated by computing the
average of correct responses. The summary score for numeral recognition was on a scale of 0 to 1,
so that if a child was able to identify all 18 numbers, then they had a summary score of 1 and 10
numbers a score of 0.53, etc.
2. Counting
The counting summary score was calculated from a summary score of four exercises that the
children were asked to complete. Each child was shown a picture of an assortment of objects and
asked to count out loud in front of the moderator. Again, as with the numeral recognition the
variables were recoded so that no response answers were treated as incorrect.
We conducted a reliability tests using the four questions that tested counting. The Cronbach
Alpha was 0.750. The summary score is the average score of the four responses, so that if a child
had correct responses for all four counting questions then the child had a score of 1, 2 out of 4
correct responses, a score of .5 and 0 out of 4 scores, a score of 0.

51
3. Socio-Emotional Lessons
The socio-emotional lessons sections comprised of five sub-categories: cooperation, accepting
different opinions, water conservation, sharing, and road safety. In this section most of the
concepts being tested were on a scale of 0 to 2 as the goal of the testing instrument was to tease out
a range of behavioral options (less desirable to more desirable actions).
a. Cooperation: A summary score was not created for this testing concept: we reported
an individual score, as this category comprised of only one question. The variable was recorded on
a scale of 0 to 2, so that 0= “tease or laugh at her,” 1= “Keep walking without stopping to help,”
and 2 = “Offer to help with her books.”
b. Accepting Different Opinions: A summary score was not created for this concept.
Two out of the three questions in this test (Q704 and Q705) were removed from the summary
score after conducting a reliability test.
c. Water Conservation: A summary score comprising of three questions was created to
test this concept. Two of the three questions were recorded on a scale of 0 to 2 and one on a binary
scale. To create an evenly weighted scale the two questions that were coded on a scale of 0 to 2
were weighted down to a scale of 0 to 1 by dividing the scale by 3. The summary score was then
calculated by computing the average score of the three questions.
d. Sharing: A summary score was not created for this testing concept. The variable was
however recorded so that it followed the same progression as the other variables in the study. The
scale used was 0 to 2, 0 being the least desirable action and 2 the most desirable action.
e. Road Safety: The summary score was computed from all five questions in this
category. Each question was recoded on a scale of 0 to 1; 0=not following road safety guidelines,
1= following road safety rules. This summary score was conducted after conducting a reliability
test that yielded an Alpha of 0.508. The summary score was computed as an average score of the
five questions.

52
Mutual Respect and Understanding
a. Interest in and Knowledge of other Languages: Summary Scores were not created for the language.
However, one question (Q806. “Do you want to know any words in other languages?”) was
eliminated from the analysis, as there appeared to be a statistically significant invalid relation
between the pre-test and post-test scores. This could have been caused by erroneous data entry or
unclear phrasing of the question. We, therefore, were unable to report on children’s interest in
learning new words in other languages. However, we did get data on children’s current knowledge
of foreign words and languages.
b. Recognition of Similarities: A summary score was created from four questions all referencing the
picture of African-American child of the same gender as the child being interviewed. The variables
for each of the four questions were recorded on a scale of 0 to 1 with Don’t Know/Not Sure and
Refusals treated as No and coded as 0. The summary score was then computed as the average score
of the four measures.
c. Receptiveness to Foreign Child: A summary score was created from six questions in this category.
The score was created after a reliability test of the six questions yielded a Cronbach alpha of 0.957.
Some of the questions were coded on a binary scale and some on a scale of 0 to 2. As in previous
cases, the questions coded on a scale of 0 to 2 attempt to get at the degree to which children were
receptive to the foreign child. The questions on a 0 to 2 scale were weighted down to a binary scale
and the summary score was computed as the average of the six questions.
d. Receptiveness to Child who speaks Serbian (for Albanians) or Albanian (for Serbs): A summary
score was created from the two questions asked in this test. The two questions were asked such
that one could determine the degree to which children would be receptive. The questions were
recoded on a scale of 0 to 2, 0 = No, 1 = yes, some, 2 = yes, all. A reliability test on the two
questions yielded a Cronbach alpha of 0.852. The summary score was the average score of the two
questions.
e. Receptiveness to child who does not speak same language: Two questions, each on a scale of 0 to 2
were combined to compute the summary score. The summary score was computed as the average
of the two questions. A reliability test of the two questions yielded a Cronbach alpha of 0.847.
f. Receptiveness to Roma Child: A summary score was created from six questions in this category.
The score was created after a reliability test of the six questions yielded a Cronbach alpha of 0.969.
Some of the questions were coded on a binary scale and some on a scale of 0 to 2. As in previous
cases, the questions were coded on a scale of 0 to 2 attempts to get at the degree to which children
were receptive to the foreign child. The questions on a 0 to 2 scale were weighted down to a binary
scale and the summary score was computed as the average of the six questions.

53
Appendix C: Explanation of Odds, Odds Ratios, and Relative Probabilities
Logistic regression, used for significance testing with dichotomous outcomes, is based on “odds
ratios” rather than more readily understood probabilities. This example may make these concepts
clearer.
Probabilities. Probabilities are the chance of a good outcome divided by the total (good and bad
outcomes), yielding a number between 0% and 100%. At post-test, 67.6% of intervention subjects
and 56.2% of control subjects got a high score for numeracy skills (numeral recognition and
counting combined). These percentages can be understood as children’s probabilities of scoring
high on numeracy.
Odds. Each of these probabilities can be transformed into odds. Odds are the chance of a good
outcome divided by the odds of a bad outcome. For intervention subjects, the odds of a high
numeracy score at post-test were .676 /(1- .676) = .676 / .323 = 2.09. The control subjects, the
odds of a high numeracy score at post-test were somewhat lower: .562 / (1- .562) = .562 / .438 =
1.28.
Odds ratios. An odds ratio is the odds for one group divided by the odds for the other group. In
this example, the odds ratio for intervention vs. control subjects’ getting high numeracy scores was
2.09 / 1.28 = 1.63. But this odds ratio of 1.63 doesn’t control for any other variables. Our logistic
regression model adjusted this odds ratio to 1.58 after controlling for the effects of children’s
pretest scores and ethnicity.
Confidence intervals for odds ratios. The results we observe in any given sample may include
some random error, and might not replicate exactly the same way in a different sample. A
confidence interval is an estimate of the “true” values we would expect to see if we had included
the entire relevant population in our study. A 95% confidence interval means we are 95% sure that
the “true” value of a given variable would fall somewhere in this range. In the case of the
numeracy odds ratio above, we estimate that it is around 1,58; we are 95% sure that it falls
between 1.03 and 2.41.
Having an odds ratio of 1 means the odds in both groups are equal, i.e., there is no difference
between them. So if the 95% confidence interval straddles “1.0”, we cannot be 95% sure that there
is really a significant difference between the intervention and control groups. In the case
numeracy, the lowest end of our confidence interval is 1.03, still bigger than 1.0, so we can be 95%
confident that the intervention group had significantly better numeracy outcomes than the
control group.
Relative probability. Odds ratios are useful for conducting statistical tests, but are not intuitive
to non-statisticians. People more readily understand probabilities and relative probabilities. The
relative probability is the probability for one group divided by the probability for the other group.
If we go back to our numeracy example, the children’s probability of having a high numeracy
score at post-test was 67.6% in the intervention group and 56.2% in the control group. If we

54
divided those probabilities (.676 / .562 = 1.20), we find that the intervention children had a 20%
higher probability of getting high numeracy scores than did children in the control group.
However, this does not control for pretest scores or other variables. The logistic regression, which
controlled for pretest scores and ethnicity, more accurately estimated the relative probability as
1.19. This means intervention children had a 19% higher probability than control children of
achieving high numeracy scores at post-test.

55
Appendix D: Pre- and Post-Test T-Scores by Ethnicity, Gender, and Age4
Pre- and Post-Test T-Scores by EthnicityPre-Test Scores Post Test Scores
Albanian Albanian Serbian Serbian Albanian Albanian Serbian Serbian
Interven. Control Interven. Control Interven. Control Interven. Control
NumeralRecognition
47.39 48.50 54.15 50.43 50.93 50.31 55.86 52.74
Counting 47.55 47.26 53.46 52.02 49.48 48.54 54.47 52.09
Cooperation 50.02 49.41 51.18 49.28 51.47 50.62 53.36 51.17
Accepts DifferentOpinions
47.93 47.33 51.49 53.11 52.34 50.85 51.85 53.44
WaterConservation
50.54 50.32 51.10 48.30 54.59 53.66 51.88 49.27
Sharing 47.61 48.01 52.22 52.10 50.12 48.62 52.84 52.44
Road Safety 51.62 49.26 48.80 50.20 53.97 52.99 48.85 48.99
Knows words inother languages
49.69 49.20 48.42 52.12 49.69 49.36 51.57 52.12
Wants to knowwords in other
languages
49.22 48.41 51.70 51.00 50.60 49.92 52.29 51.96
Have friends whospeak other
languages
50.68 49.44 50.90 49.13 49.21 50.99 50.48 46.96
Knowledge offoreign words
49.69 49.81 47.97 52.13 50.73 49.83 50.97 51.20
Recognition ofSimilarities
52.68 52.40 45.58 48.87 52.14 50.08 50.09 48.09
Receptiveness:Foreign Child
49.27 48.30 53.35 49.54 51.58 50.43 55.62 50.17
Receptiveness:Child Speaks
DifferentLanguage
49.42 50.03 51.96 48.91 51.84 51.74 55.69 50.89
Receptiveness:Kosovar of
Different EthnicBackground
51.88 50.05 50.15 48.09 52.83 52.45 53.85 49.25
Receptiveness:Roma Child
47.06 47.18 54.45 51.75 49.00 47.42 58.54 54.53
4 Note: Highlighted rows indicate statistically significant interaction of condition by ethnicity, gender, or age.

56
Pre- and Post-Test T-Scores by Age
Pre-Test Scores Post-Test Scores5 yearold
5 yearold
6 yearold
6 yearold
5 yearold
5 yearold
6 yearold
6 yearold
Interven. Control Interven. Control Interven. Control Interven. Control
NumeralRecognition 48.00 46.53 53.46 52.35 51.70 49.31 55.00 53.72
Counting 48.03 47.59 52.92 51.74 50.03 48.79 53.85 51.87
Cooperation 50.29 48.23 50.87 50.40 52.06 50.24 52.71 51.55Accepts
DifferentOpinions 49.27 50.00 49.96 50.67 51.79 51.94 52.47 52.40
WaterConservation 50.40 48.39 51.25 50.16 54.11 50.92 52.43 51.88
Sharing 49.56 48.98 50.08 51.22 51.42 50.97 51.39 50.20Road Safety 50.19 49.26 50.41 50.21 52.07 50.39 51.00 51.48
Knows wordsin other
languages 49.03 50.59 49.16 50.80 50.68 49.00 50.46 52.49Wants to knowwords in other
languages 49.40 49.46 51.51 50.00 51.12 49.63 51.70 52.25Have friends
who speakother
languages 51.67 47.86 49.79 50.63 50.19 48.32 49.38 49.56Knowledge offoreign words 48.97 50.64 48.77 51.34 51.09 48.95 50.57 52.05
Recognition ofSimilarities 48.98 51.24 49.75 49.97 51.45 50.35 50.87 47.82
Receptiveness:Foreign Child 50.42 48.97 52.06 48.90 52.86 49.86 54.18 50.73Receptiveness:
Child SpeaksDifferentLanguage 50.14 49.83 51.15 49.08 53.49 51.60 53.83 51.01
Receptiveness:Kosovar of
DifferentEthnic
Background 50.60 48.88 51.59 49.20 53.33 50.70 53.28 50.91Receptiveness:
Roma Child 50.10 50.46 51.02 48.62 52.93 51.85 54.11 50.30

57
Pre- and Post-Test T-Scores by Gender
Pre-Test Scores Post-Test Scores
Boys Boys Girls Girls Boys Boys Girls Girls
Interven. Control Interven. Control Interven. Control Interven. Control
NumeralRecognition 50.22 48.65 50.93 50.53 53.36 51.00 53.13 52.23
Counting 49.30 49.11 51.41 50.43 52.59 50.00 51.04 50.79
Cooperation 49.39 48.18 51.78 50.75 51.69 50.24 53.06 51.75Accepts
DifferentOpinions 48.42 50.08 50.83 50.65 52.76 51.65 51.43 52.82
WaterConservation 49.98 49.08 51.65 49.54 53.36 52.15 53.28 50.50
Sharing 49.18 48.99 50.45 51.50 51.34 50.29 51.47 50.93Road Safety 50.06 49.87 50.54 49.59 52.32 51.27 50.78 50.55
Knows wordsin other
languages 49.76 50.11 48.40 51.42 50.61 50.82 50.54 50.72Wants to
know wordsin other
languages 49.87 49.55 50.93 49.95 51.30 49.85 51.49 52.32Have friends
who speakother
languages 50.23 49.88 51.37 48.52 49.55 48.94 50.08 48.96Knowledge offoreign words 49.19 50.52 48.55 51.58 50.29 50.30 51.42 50.82
Recognitionof Similarities 48.63 51.03 50.08 50.06 50.47 47.98 51.92 50.38
Receptiveness:Foreign Child 50.32 48.89 52.10 48.98 53.91 50.09 53.03 50.56Receptiveness:
Child SpeaksDifferentLanguage 48.98 49.64 52.32 49.23 52.77 50.64 54.56 52.10
Receptiveness:Kosovar of
DifferentEthnic
Background 50.64 49.51 51.51 48.46 53.12 51.27 53.50 50.23Receptiveness:
Roma Child 50.01 49.08 51.08 50.07 52.84 50.84 54.15 51.33
![ULICA 1 ULICA 8 ULICA 5 166 - veles.gov.mkveles.gov.mk/downloads/2014/UE2UB12/3006 Predlog Plan planska - AVGUST... · 0.1 a1 d2 e2 soobra]ajna infrastruktura e1 4.8517.0 g- proizvodstvo](https://img.pdfslide.us/doc/110x75/5e172928c7b5491bb35b4559/ulica-1-ulica-8-ulica-5-166-velesgov-predlog-plan-planska-avgust-01.jpg)