Embed Size (px)
Citation preview

sustainability
Article
Assessing the Vulnerability of Agriculture Systems toClimate Change in Coastal Areas: A Novel Index
Komali Kantamaneni 1,*, Louis Rice 2, Komali Yenneti 3,4 and Luiza C. Campos 5
1 Warsash School of Maritime Science and Engineering, Solent University, East Park Terrace,Southampton SO14 OYN, UK
2 Centre for Architecture and Built Environment Research, University of the West of England,Bristol BS16 1QY, UK; [email protected]
3 Australia India Institute, University of Melbourne, 149 Barry Street, Parkville, VIC 3053, Australia;[email protected]
4 School of Architecture and Built Environment, Faculty of Science and Engineering, University ofWolverhampton, Wulfruna St, Wolverhampton WV1 1LY, UK
5 Department of Civil, Environment & Geomatic Engineering, University College London (UCL),Gower Street, London WC1E 6BT, UK; [email protected]
* Correspondence: [email protected]
Received: 25 March 2020; Accepted: 9 June 2020; Published: 11 June 2020�����������������
Abstract: This study proposes a novel index to evaluate agricultural vulnerability to climate changein coastal areas, using the case of Andhra Pradesh, the state with the second longest coastline in India.Field data was collected from more than 1000 farmers (involved in over 50 varieties of crops) in22 riverine and coastal case study areas. Data was collected through site visits, surveys and fiveworkshops conducted between November 2018 and June 2019. Based on the collected data sets,a new Agricultural Coastal Vulnerability Index (AGCVI) was developed and applied to the 22 siteslocated in two districts (Krishna and Guntur) of Coastal Andhra Pradesh. The analysis revealed thatthe areas with three crop seasons (Kharif, Rabi and Zaid) per year are highly vulnerable to climatechange. On the other hand, sites with one crop season (Kharif) per annum are the least vulnerable toclimate change. Moreover, grains (particularly rice), flowers and fruit crops are more susceptible toclimate change and its induced impacts. Rice is no longer a profitable crop in the case study areaspartly as a result of unfavourable weather conditions, inadequate insurance provision and lack ofgovernment support for farmers. Cumulatively, all these circumstances impact farmers’ incomes andsocio-cultural practices: this is leading to a marriage crisis, with a reduction in the desirability ofmatrimony to farmers. These findings provide valuable information that can support climate andagriculture policies, as well as sustainable cropping patterns among farmers’ communities in coastalareas of India in the future.
Keywords: agriculture; coastal areas; new index; vulnerability; farmers; crops; CoastalAndhra Pradesh
1. Introduction
Agriculture contributes to economic development via fiscal activities, as a supplier of food andrural services, and as a distinctive mechanism for growth. In low and middle income countries,nearly 3 billion people live in rural areas and of those, 2.5 billion people depend on agriculture forlivelihood [1]. Currently, 1.5 billion hectares (11 percent) of the global land surface is under agriculture,and this is predicted to increase over the next thirty years [2]. The largest farmlands are located inAsia, which represent 33.8 percent of the global value [3].
Sustainability 2020, 12, 4771; doi:10.3390/su12114771 www.mdpi.com/journal/sustainability

Sustainability 2020, 12, 4771 2 of 24
Global warming is a serious threat to agriculture and crop yield. There has been growingconcern regarding the effects of climate change on crop productivity, food security and hydrologicalimbalances [4–6]. According to the United Nations [7], the current amount of warming can decreasegrain production up to 70 percent in low and middle income countries. In South Asia and Africa,the overall mean yield of all crops will suffer an eight percent decrease by 2050, particularly affectingwheat, maize and sorghum grain production [8].
Multifaceted climate change impacts on agriculture vary in different parts of the world and theoverall picture is very complex in coastal areas. The global coastal zones comprise only two percent ofthe earth’s surface, but contain over 10 percent of the total population (600 million people), and thedensity of coastal populations is higher than in non-coastal regions [9]. To cater for the needs of thispopulation, many of the coastal environments across the world have been altered for agriculturalpurposes [10]. Therefore, low-lying agricultural land is highly vulnerable to severe soil salinity,storm surge, coastal erosion and stagnant flood water problems [11–14]. Simultaneously, the rapidand overwhelming changes to the climatic environment and associated factors have intensified thevulnerability of agricultural production in coastal areas [15–18].
Agriculture in India faces even more complex challenges, due to diverse factors such as theshrinking amount of agricultural land, depletion of water and irrigation sources and increased labourcosts [19]. As about 60 percent of the cultivated area is rain-fed [20], climate change would not onlyaffect the overall production of food crops and the food security of millions of people, but also threatentheir livelihoods. A study reveals that variations in climate change and other climate induced factors,particularly monsoons, led to a four percent reduction in rice yield in India between 1966 and 2002 [21].Further, according to Cline [22], global warming is expected to reduce crop production in India between10–40 percent by the end of the 21st century.
India has 7516.6 km of coastline [23] and contains several river deltas along the coastal stretches,which are very fertile and favourable for farming and cultivation of a wide variety of crops. However,it is predicted that climate change will affect crop yields in these areas through impact on agriculturalinputs (e.g., water for irrigation), growth of plants (due to increased temperatures) and limiting thetypes of crops that can be grown in certain areas (e.g., coastal areas). Farmers depending on rainfallwill be particularly susceptible to the impacts of climate change and severely affected if they don’tadjust to the climate variabilities [24]. The abovementioned issues reveal the interconnection betweenthe impacts of climate change, agriculture and the susceptibility of people depending on agriculture inIndia’s coastal areas.
The main objective of this research is to assess and interpret the vulnerability of agriculture in ruralcoastal areas in India. We attempt to: (a) develop a new composite index to measure the vulnerabilityof agriculture in coastal areas; (b) develop a sub-regional level agricultural vulnerability profile fromthe perspectives of both crop productivity and farmers lives; and (c) provide some interpretationof the applicability of the developed index. The spatial scale of this study is 22 selected case studysites in two districts of Coastal Andhra Pradesh (CAP), India. The vast coastline, heterogeneity inagriculture patterns and socio-economic conditions, and the increase in climatic variability makes itan excellent case study. This study takes forward the literature on coastal agricultural vulnerabilityby operationalising this framework in one of the world’s largest agriculture-based economies [13,25].The research results will be helpful to farmers and decision makers involved in the improvement ofcoastal agricultural policies.
2. Theory and Analytical Framework
2.1. Literature Review
Vulnerability to climate change, influenced by disasters [26,27], natural hazards [28,29] and foodinsecurity [30,31] research, has drawn serious attention from researchers and policy-makers alikein the past two decades, leading to a large literature on the topic [32]. According to this literature,
Sustainability 2020, 12, 4771 3 of 24
vulnerability conveys the degree of susceptibility of a natural ecosystem or socio-economic system tothe impacts of climate change [33].
Agricultural vulnerability is generally defined as the latent probability of loss and damage of anagricultural system associated with climatic variabilities and the occurrence of an extreme climaticevent, and the susceptibility of any individual or social group to its impacts [34,35]. The concept ofagricultural vulnerability, therefore, focuses on the level of physiological impact on crops triggered byvariabilities in various climatic elements and the socio-economic impacts on farmers [36,37].
Over recent years a large body of literature has emerged on the analysis of agriculturalvulnerability [37–39]. According to this literature, climate change could affect agriculture systems inthree interconnected ways: first, changes in temperature and rainfall pattern may alter the spatialdistribution of agro-ecological zones and upset the timing and duration of crop growing seasons.These effects are strongest for crops such as wheat and rice. Second, variabilities in rainfall patternsimpact water availability during crop growing season, and thereby decrease agricultural productivity.Finally, agricultural losses, due to the increased frequency of extreme climatic events, can affect farmingpractices and livelihoods. In general, agricultural vulnerability provides a useful theoretical framework,as it evaluates the possible susceptibility of crop yields, and assists in the appraisal of the trade-offsbetween climate-induced vulnerability of crop yields and farmer livelihoods [40,41]. Such an analysisaids the development of relevant adaptation strategies [42].
Different scholars identified a multitude of factors that influence agricultural vulnerability.In general, agricultural vulnerability is a variable condition generated by multiple environmental andsocial processes, and would depend and differ on diverse contexts and circumstances [41]. A largebody of literature is, however, based on climatic parameters (e.g., temperature, rainfall, precipitation),crops and agriculture production [43–46], while a smaller body of scholarship is based on othersocio-economic factors, such as economic development, agricultural production, human culture [47],budget and investments [43], national and local economies, market prices, farmers welfare [48],cultural settings: cumulatively all these elements affect the agricultural vulnerability, particularly indeveloping countries [38,49].
Reflecting on the above discussion, it is clear that there is a large body of literature on agriculturalvulnerability and adaptation both in India and other countries. This study aims to fill these three keyresearch gaps in the current research. First, while a considerable amount of literature on agriculturalvulnerability [49–51] and coastal vulnerability [52–54], emerged over the years, there is relativelylittle work on the coastal agricultural vulnerability, particularly in India [55]. The majority of theexisting studies on coastal agricultural vulnerability focus on other parts of the world [13,25,56].Further, the limited existing work on coastal agricultural vulnerability both in India [14,15] andglobally [18,25] seldom uses primary data and a combination of qualitative, quantitative and spatialmethods. Second, much of the existing literature on both agricultural vulnerability [36,41,42] andcoastal vulnerability [52,57] tend to neglect to analyse a combination of climatic and social perspectives.More specifically, there is a lacuna for in-depth and rigorous studies on assessment based on acombination of factors, such as weather information, size of the farm, leased land, cropping varieties,farming income and impacts on personal lives. Finally, most of the existing studies on agriculturalvulnerability assessment in India have relied on the predicted impacts of climate change in the studyregion [55,58]. There is a scarcity of literature that utilises real and historical climatic (rainfall andtemperature patterns) and disasters data at regional and/or local levels.
Building on Smit et al. [59], in this study, coastal agricultural vulnerability to climate change isdefined as the degree to which an agricultural system (i.e., food crops directly and farmers indirectly)is susceptible, or unable to cope with adverse effects of climate change in coastal areas, in this milieu,from extreme temperatures, erosion, cyclones, flooding, storm surge and other climate extremes.

Sustainability 2020, 12, 4771 4 of 24
2.2. Conceptual Framework
The diverse variety of indicator approaches developed across the world over the years indicatethat there is no fixed method to measure agriculture vulnerability in coastal areas to climate variability(Table 1). Even a cursory review of these existing work show that, while there is an extensivebody of literature on either coastal vulnerability or agriculture vulnerability, little literature focuseson the synthesis of both of them and, to the best of our knowledge, none at the sub-region levelin India. Each method was developed in the context of specific research and geographic areas.Furthermore, most of the little existing global studies on coastal agricultural vulnerability are overlyor exclusively quantitative or descriptive, while others are too complicated to adapt to differentsub-regional geographical regions.
Table 1. An overview of global Coastal Vulnerability Index (CVI) assessments to different factors(chronological order).
Reference CVI- Vulnerability Method Geographical Area
Gornitz and Kanciruk (1989) Developed the first coastal hazarddatabase/vulnerability index Global
Hareau, A., Hofstadter, R. &Saizar, A. (1999)
Vulnerability to climate change. Considered coastalresources as well Uruguay
Cutter et al. (2003) Social vulnerability index USA
Kaly and Commission (1999) Environmental vulnerability index Global
Pethick and Crooks 2000; CVI- Geographical perspective Conceptual paper
Nelson et al. (2005) CVI for broad acre agriculture Australia
Gbetibouo and Ringler (2009) Mapped the farmers vulnerability to climate change Africa
McLaughlin and Cooper 2010 Multi-scale CVI for assessing erosion impacts UK
Kumar and Kunte (2012) CVI -South India India
Balica et al. (2012) Flood vulnerability index Global
Wiréhn et al. (2015) Appraisal of composite index methods foragricultural vulnerability Sweden
Huq et al. (2015) Assessed impacts of climate change and associatefactors on coastal agricultural communities Bangladesh
Shukla et al. (2016) Established Inherent vulnerability of agriculturalcommunities at village level India
Teshome (2016) Apprised farmers’ agricultural land vulnerability toclimate change Africa
Panda (2017) Generated an index to evaluate farmers vulnerabilityto drought India
Jose et al. (2017) Established agricultural vulnerability index to floods Philippines
Kantamaneni et al. (2018) Established combined coastal vulnerability index UK
Ng et al. (2019) Established CVI to evaluate smallislands vulnerability Portugal
Ducusin et al. (2019) Assessed agricultural vulnerability to climate change Philippines
Sneessens et al. (2019) A framework has been established to measure thefiscal vulnerability of farming systems France
Mahmood et al. (2020) Coastal vulnerability assessment of Meghna estuaryof Bangladesh Bangladesh
Sekovski et al. (2020) Established CVI for Ravenna province Italy
Mohamed (2020) Established CVI for Nile delta. Egypt

Sustainability 2020, 12, 4771 5 of 24
Considering the differentiated vulnerability among the different states in India, we use the‘Agricultural Coastal Vulnerability Index’ (AGCVI), developed for the purpose of our study (based onKantamaneni et al. [60]). A new holistic and integrated indicator approach is needed to evaluate theagricultural vulnerability in CAP, because of its differentiated landscape, social, physical and economicgeographic characteristics. Our approach is useful to evaluate the agriculture vulnerability in 22 casestudy sites of CAP because it uses different methods (quantitative, fieldwork and spatial analysis) andcovers a full range of socioeconomic and cultural parameters in the current scenarios.
3. Study Area
3.1. Case Study Sites
The first step towards the development of a vulnerability index is to identify suitable case studysites. The case study area and sites are selected by using two-stage sampling technique. First, the studyarea, namely CAP, was selected purposively as it has the second largest coastline (more than 900 kms)in India (after Gujarat). Second, based on existing published work [53,61], recent events and multiplesite visits, twenty-two suitable sites (Table 2) located in Krishna and Guntur districts of CAP (Figure 1)were selected for this study. While there are many agricultural vulnerability hotspots across the CAP,these selected case study locations are in need of immediate attention, and therefore those sites wereselected for this study.
Table 2. Case study sites in Guntur and Krishna districts, Coastal Andhra Pradesh (CAP), India.
No. Guntur District
1. Nutakki2. Vadlapudi3. Pedapalem4. Nidamarru5. Aatmakuru6. Revendrapadu7. Namburu8. Kaza9. Kunchanapalli10. Vaddeswaram11. Kotha Palem12. Ippatam13. Nizampatnam14. Penumaka15. Paturu16. Tadepalli17. Bommivani palem18. Chirravuru19. Tulluru20 Mangalagiri
Krishna District
21. Madalavarigudem22. Vijayawada rural

Sustainability 2020, 12, 4771 6 of 24Sustainability 2020, 12, x FOR PEER REVIEW 6 of 26
Figure 1. Study area with country and state boundaries.
3.2. Physical Geography
3.2.1. Coastal Andhra Pradesh (CAP)
CAP is located along the Eastern Indian coastline towards the Bay of Bengal, at a latitude 13°24′ N to 19°54′ N and longitude 80°02′ E to 86°46′ E. Krishna and Guntur districts are the part of CAP, with diverse physical, economic and geographical characteristics. The Krishna district is located in between 150−43′ and 170−10′ of the Northern latitude and 800 and 810−33′ of the Eastern longitude. The CAP region consists of 966 kms of coastline, out of which the case study district has a total coastline of 188 kms [62]. It is bounded by the Bay of Bengal and West Godavari district on the East, Bay of Bengal on the South, Guntur district on the West and Nalgonda districts and Khammam district on the North.
3.2.2. Krishna District
The Krishna district (Figure 1) has population of 4.5 million, and is divided into 50 mandals (equal to small group of village councils), six towns and 1005 villages [63]. The length of the River Krishna is 1280 kms, and it is a major river in this district [64]. Krishna river is the main source for irrigation, domestic and industrial use. The climate is moderate; considered tropical rainy, with extreme hot summers and annual rainfall of 1011.2 mm. In Krishna district, 535,029 hectares were used for agriculture in 2004 [62]. The main crops are cereals, pulses, oilseeds and other crops. The Krishna district stands at fourth largest for population in the state and 60 percent of that population lives in rural areas; the population growth rate is 7.9 percent [63].
3.2.3. Guntur District
Guntur district (Figure 1) is located between North Latitudes 15°18′ and 16°50′, and East Longitude 79°10′ and 80°55′. The area is 11,328.23 km2, the population is 4.8 million and it is divided by 57 mandals, 10 municipalities and 729 villages [65]. Krishna, Nagulleru and Chandravanka are the main rivers, and key crops are rice (38 percent), cotton (17 percent), maize (9 percent) and chilli (7.4 percent); the average annual rainfall is 864 mm [65]. Farmable land and yield declined considerably
Figure 1. Study area with country and state boundaries.
3.2. Physical Geography
3.2.1. Coastal Andhra Pradesh (CAP)
CAP is located along the Eastern Indian coastline towards the Bay of Bengal, at a latitude 13◦24′
N to 19◦54′ N and longitude 80◦02′ E to 86◦46′ E. Krishna and Guntur districts are the part of CAP,with diverse physical, economic and geographical characteristics. The Krishna district is located inbetween 150−43′ and 170−10′ of the Northern latitude and 800 and 810−33′ of the Eastern longitude.The CAP region consists of 966 kms of coastline, out of which the case study district has a total coastlineof 188 kms [62]. It is bounded by the Bay of Bengal and West Godavari district on the East, Bay ofBengal on the South, Guntur district on the West and Nalgonda districts and Khammam district onthe North.
3.2.2. Krishna District
The Krishna district (Figure 1) has population of 4.5 million, and is divided into 50 mandals (equalto small group of village councils), six towns and 1005 villages [63]. The length of the River Krishna is1280 kms, and it is a major river in this district [64]. Krishna river is the main source for irrigation,domestic and industrial use. The climate is moderate; considered tropical rainy, with extreme hotsummers and annual rainfall of 1011.2 mm. In Krishna district, 535,029 hectares were used foragriculture in 2004 [62]. The main crops are cereals, pulses, oilseeds and other crops. The Krishnadistrict stands at fourth largest for population in the state and 60 percent of that population lives inrural areas; the population growth rate is 7.9 percent [63].
3.2.3. Guntur District
Guntur district (Figure 1) is located between North Latitudes 15◦18′ and 16◦50′, and East Longitude79◦10′ and 80◦55′. The area is 11,328.23 km2, the population is 4.8 million and it is divided by 57 mandals,10 municipalities and 729 villages [65]. Krishna, Nagulleru and Chandravanka are the main rivers,and key crops are rice (38 percent), cotton (17 percent), maize (9 percent) and chilli (7.4 percent);the average annual rainfall is 864 mm [65]. Farmable land and yield declined considerably in 2018,compared with 2017, in both Krishna and Guntur districts, due to rapid urbanisation. The climate has

Sustainability 2020, 12, 4771 7 of 24
a combination of milder winter and extreme hot summers. This year records showed that extremesummer temperatures extended for another month, due the climatic changes.
3.3. Key Agriculture Issues
Agriculture in CAP has been facing a multitude of problems deriving from both natural andanthropogenic hazards, such as sea level rise, cyclones, saltwater intrusions, increasing population anda lack of strong agricultural policy and procedures [53,61]. Increased salinity from saltwater intrusionis a huge threat to the population and public health, through its impacts on farming, infrastructure,coastal ecosystems and water used for both domestic and commercial purposes [66–68].
Agriculture is the main and/or only source of income for a majority of the farmers in CAPespecially in rural areas. Frequent and intense cyclones generate huge impacts on the farmlands andreduces agriculture production [68,69], particularly rice yields [70]. Due to the geographical locationand low-lying topology, several coastal areas are frequently inundated by flood waters; subsequently,several varieties of crops often result in lower quality grains/crops in lower quantities [71]. These issuesare becoming a substantial challenge in this region, as it impacts the local and sub local economies.Land-use changes due to rapid migration to coastal areas, monoculture farming, redevelopment andunauthorised fish farms have caused low and unstable food production in several parts of CAP [72,73].Even though the CAP has been recognised as one of the most highly productive and fertile riverine andcoastal areas for agriculture by the AP government, it often suffers from low grain production, due toclimate vulnerability and natural disasters [74]. The construction of new bridges on Krishna River,tourism development around the rivers and poor infrastructure has severely damaged the ecologicalsystem of this coastal agricultural region, making it even more vulnerable. Various technologicalinnovations have enabled the farming sector to become more efficient and productive in rural India,though the amount of agricultural land and number of farmers has been dwindling year by year inCAP. All these issues warrant in-depth research on agricultural vulnerability in the CAP region.
4. Methodology
4.1. Data and Methods
Drawing lessons from previous studies highlighted in the previous section, we argue that asagriculture and cropping patterns are exposed to differential climate-led hazards, their vulnerabilityis determined by the broader dimensions of people, their characteristics, and socioeconomic ornon-climatic factors. The data related to the research objectives of this study were collected from bothprimary and secondary sources. Two major kinds of data were used in this study: climate variabilityand cropping pattern.
There is a growing consensus among the scientific community that climate related data shouldbe considered in the analysis of agricultural vulnerability, as such a consideration would enable theidentification of hot-spot areas that need immediate intervention. Accordingly, the meteorological datasuch as daily/monthly/annual temperature and rainfall was collected from the Indian MeteorologyDepartment (IMD) for the period of 1919–2002 (Figure 2). This data was then analysed to assess themagnitude and extent of climate change for the selected districts in CAP. Trend analysis was carriedout to see the pattern of change in climatic variables. Descriptive statistics (average maximum andminimum) were used to analyse temperatures and rainfall for varying periods in the selected districts.Average, arithmetic mean and percentage were calculated for the purpose of comparison betweendifferent districts.
Cropping pattern and information of agriculture in the case study districts are important tounderstand the characteristics of agriculture vulnerability to the risks of climate variability and thecoping capability of the farmers in the region. The selection of crops was done through 12 quantitativesurveys, five workshops and several field visits in 22 case study sites in Krishna and Guntur districts(mostly in coastal and riverine agricultural areas), between November 2018 and June 2019 (Figures 3

Sustainability 2020, 12, 4771 8 of 24
and 4). A paper-based questionnaire consisting of 15 questions (written in English) was suppliedto the farmers. The majority of the farmers were able to read and understand the questionnaire.Translation into the local language (Telugu) was also offered to farmers who were not confident atreading the English version of the questionnaire. The survey questionnaire had sets of questions toidentify information about crops, cropping patterns, water variability and irrigation, and governmentsubsidies (refer to appendix for more detail).Sustainability 2020, 12, x FOR PEER REVIEW 8 of 26
Figure 2. (A,B) Temperatures and rainfall trends (annual) in Guntur and Krishna districts for the period 1919–2002.
Cropping pattern and information of agriculture in the case study districts are important to understand the characteristics of agriculture vulnerability to the risks of climate variability and the coping capability of the farmers in the region. The selection of crops was done through 12 quantitative surveys, five workshops and several field visits in 22 case study sites in Krishna and Guntur districts (mostly in coastal and riverine agricultural areas), between November 2018 and June 2019 (Figures 3 and 4). A paper-based questionnaire consisting of 15 questions (written in English) was supplied to the farmers. The majority of the farmers were able to read and understand the questionnaire. Translation into the local language (Telugu) was also offered to farmers who were not confident at reading the English version of the questionnaire. The survey questionnaire had sets of questions to identify information about crops, cropping patterns, water variability and irrigation, and government subsidies (refer to appendix for more detail).
Along with this, five workshops (consisting of unstructured dialogue) were conducted with the famers, and several field site visits were made to observe various crop varieties in different locations. The primary author of this paper met more than 1000 farmers to identify the crops grown in the case study areas. Agricultural measurements were also conducted for each of the 22 case sites, using ArcGIS to study the cropping intensity. The farmers who participated in the survey and workshops typically managed between 0.5 to 5 hectares of agricultural land and grew (in total) over 50 varieties of crops. Simultaneously, qualitative data on the impact of agricultural losses on farmers’ lives was also collected through personal interviews.
Figure 2. (A,B) Temperatures and rainfall trends (annual) in Guntur and Krishna districts for theperiod 1919–2002.Sustainability 2020, 12, x FOR PEER REVIEW 9 of 26
Figure 3. Case study areas in the Guntur district. Figure 3. Case study areas in the Guntur district.

Sustainability 2020, 12, 4771 9 of 24Sustainability 2020, 12, x FOR PEER REVIEW 10 of 26
Figure 4. Case study areas in the Krishna district.
4.2. Parameters/Indicators
The raw data collected from the fieldwork was first processed and categorised into six different categories with respect to crops. Subsequently, the six categories of crops for the present study were arranged in a tabular form (Table 3). The research identified that in some sites such as Pedavadlapudi, Chirravuru, Revendra Padu, Pedapalem, Kotta Palem, Kunchanapalli, farmers were farming 2–3 crops in their fields in three seasons (Kharif, Rabi, Ziad) per year. While, some farmers in other sites were growing two crops at the same time (as inner crops such as Banana with Bitter or Ridge gourd, Ridge gourd with Lady’s fingers).The inclusion of these issues for the AGCVI was applied to 22 case study sites.
Table 3. Crop varieties farmed in Krishna and Guntur districts.
Vegetable Crops
Leafy Vegetable Crops
Fruit Crops
Food Grain Crops
Flower Crops Other Crops
Beans Amaranthus leaves
Groundnut Corn Mary gold
Colocasia Coriander Guava Maize Rose Cotton Cucumber Chinese Spinach Banana Rice Jasmin Jute
Cauliflower Curry leaves Mango Sapota Jasminum Mulberry
Cabbage Mint Papaya Jasminum multiflorum
Sugar cane
Citrus Sour Spinach Lily Betel leaves
Figure 4. Case study areas in the Krishna district.
Along with this, five workshops (consisting of unstructured dialogue) were conducted with thefamers, and several field site visits were made to observe various crop varieties in different locations.The primary author of this paper met more than 1000 farmers to identify the crops grown in the casestudy areas. Agricultural measurements were also conducted for each of the 22 case sites, using ArcGISto study the cropping intensity. The farmers who participated in the survey and workshops typicallymanaged between 0.5 to 5 hectares of agricultural land and grew (in total) over 50 varieties of crops.Simultaneously, qualitative data on the impact of agricultural losses on farmers’ lives was also collectedthrough personal interviews.
4.2. Parameters/Indicators
The raw data collected from the fieldwork was first processed and categorised into six differentcategories with respect to crops. Subsequently, the six categories of crops for the present study werearranged in a tabular form (Table 3). The research identified that in some sites such as Pedavadlapudi,Chirravuru, Revendra Padu, Pedapalem, Kotta Palem, Kunchanapalli, farmers were farming 2–3 cropsin their fields in three seasons (Kharif, Rabi, Ziad) per year. While, some farmers in other sites weregrowing two crops at the same time (as inner crops such as Banana with Bitter or Ridge gourd,Ridge gourd with Lady’s fingers). The inclusion of these issues for the AGCVI was applied to 22 casestudy sites.

Sustainability 2020, 12, 4771 10 of 24
Table 3. Crop varieties farmed in Krishna and Guntur districts.
Vegetable Crops Leafy Vegetable Crops Fruit Crops Food Grain Crops Flower Crops Other Crops
Beans Amaranthus leaves Groundnut Corn Mary goldColocasia Coriander Guava Maize Rose CottonCucumber Chinese Spinach Banana Rice Jasmin Jute
Cauliflower Curry leaves Mango Sapota Jasminum MulberryCabbage Mint Papaya Jasminum multiflorum Sugar cane
Citrus Sour Spinach Lily Betel leavesChillies
Drumstick ChrysanthsGreen GramBottle gourd
BrinjalBlack gramBitter gourdLady fingers
OnionRidge gourd
TomatoTapoica
TurmericIvy gourd
Teasel gourdYam
Later, the trend analysis of the climatic data was carried out to determine the magnitude,direction and significance of the trends in annual and seasonal rainfall and temperature for eachsample district (Figure 2). A trend analysis of the climatic data reveal that temperature underwentan increasing trend in both districts during the last century. In particular, around the 1970s, a sharpincrease was observed in both districts. Rainfall shows a gradual but insignificant trend of increase.Increases in temperature could result in higher evaporation rates, further resulting in higher waterdemand from the agricultural sector. In majority of the case study sites, especially in the Guntur district,water availability is good; however, higher temperatures and extended summers impact the crops’yields and farmers’ economic status. Based on these trends and themes, the centurial fluctuations inthe agriculture sector were estimated for both districts.
Finally, based on the data collected from the farmers through questionnaire, field visits andworkshops, temperatures and rainfall trend analysis and natural disasters impact severity, the six keycategories of crops were selected as six key parameters (Table 4).
Table 4. Newly established parameters.
Number Parameters Designated Symbol for AGCVI
1 Fruit crops a2 Vegetable crops b3 Flower crops c4 Leafy vegetable crops d5 Food grain crops e6 Other crops f
The AGCVI parameters’ vulnerability threshold (Table 5) was derived from the analysis ofinformation obtained from farmer’s discussions and their economic statistics (89 percent of farmersshared data from their bills, which relate how much is spent for the farm in a particular year, and howmuch they earned through the crop production).
The current research considered the data from crop yield damage due to climate change andnatural disasters in the previous ten years. These statistics were compared with AP Government’sstatistics. The results show that there was a significant difference between official data and farmers’ data.For example, some farmers suffered a low crop yield, but government official statistics recorded a higher

Sustainability 2020, 12, 4771 11 of 24
yield; this could be due to different market rates at local, regional and national levels. Furthermore,some farmers sell their products through unofficial channels because of the lack of transportationfacilities, and agriculture is only their source of income. These statistics are often not included ingovernment official reports, due to the lack of proper communication.
Table 5. Parameter’s ratings associated with varying thresholds of vulnerability.
No. AgriculturalParameters
DesignatedSymbol for AGCVI
Vulnerability Threshold (£millions)
Low (1) Moderate (2) High (3) Very High (4)
1 Fruit crops a <0.5 0.5–1.5 >1.5–2.5 >2.52 Vegetable crops b <1.5 1.5–2.5 >2.5–3.2 >3.23 Flower crops c <0.4 0.4–1.2 >1.2–2.4 >2.44 Leafy vegetable crops d <1.0 1.0–2.0 >2–3.1.0 >3.15 Food grain crops e <0.4 0.4–1.1 >1.1–1.5 >1.56 Other crops f <0.6 0.6–1.2 >1.2–2.2 >2.2
Official statistical records contain information concerning crop yields, purchase and revenuerecords, farmer numbers in particular fields, farmer’s economic status (how much farmland they haveand how many crop varieties they usually cultivate per year), soil fertility test results, supplied fertilisers,labour use, seasonal pattern crop insurance etc. These documents helped to determine the thresholdvalues in a systematic way. Consideration of all these issues lead to the current study including thefarmer’s statistics as they are more accurate and frequently updated.
The finalisation of the threshold of the AGCVI required that each of the selected agriculturalvulnerability parameters be specific and contribute similarly (equally) towards the agricultural coastalvulnerability measurement. Accordingly, the parameters are equally weighted on a measurementscale (1–4).
4.3. Index
After the identification and development of the 6 crop parameters and vulnerability thresholds,the Agricultural Coastal Vulnerability Index (AGCVI) was developed. For the index development,a simple method with equal weights as proposed by Kantamaneni et al. [60] was adopted for thisstudy. Equal weight method is easy to calculate and simple to understand, and therefore it has evenbeen adopted for the calculation of the Human Development Index by the United Nations (UN).Kantamaneni et al. [60] established the physical coastal vulnerability index (PCVI), the economiccoastal vulnerability index (ECVI) and the combined coastal vulnerability index (CCVI) indices toevaluate the coastal vulnerability of the UK using a combination of novel and existing physical andeconomic parameters.
In this study [60], the coastline of 11 case study areas in the UK was divided into 1 km and0.5 km cells, and, subsequently, relative vulnerability was ranked according to low, moderate, highand very high risks. The index helped to identify relative coastal risk along diverse segments ofthe UK coastline. However, this new study did not take existing parameters and their thresholdsfrom Kantamaneni et al. [60]. Instead, this current study uses the newly established components andparameters from the case study empirical data and ground analysis.
In total, 152 hectares were considered for the assessment. Three hectares were excluded fromthe analysis, because these lands bordered across different ownerships. In total, 149 hectares weredivided into 1-hectare cell i.e., 149 cells. A transect baseline was drawn across the frontage of each ofthe identified agricultural coastal vulnerability sites and a 1-hectare grid (or cell) was drawn inlandfrom the baseline (Figure 5). Comprehensive measurements based upon each parameter were recordedwithin each identified cell.

Sustainability 2020, 12, 4771 12 of 24
Sustainability 2020, 12, x FOR PEER REVIEW 13 of 26
4.3. Index
After the identification and development of the 6 crop parameters and vulnerability thresholds, the Agricultural Coastal Vulnerability Index (AGCVI) was developed. For the index development, a simple method with equal weights as proposed by Kantamaneni et al. [60] was adopted for this study. Equal weight method is easy to calculate and simple to understand, and therefore it has even been adopted for the calculation of the Human Development Index by the United Nations (UN). Kantamaneni et al. [60] established the physical coastal vulnerability index (PCVI), the economic coastal vulnerability index (ECVI) and the combined coastal vulnerability index (CCVI) indices to evaluate the coastal vulnerability of the UK using a combination of novel and existing physical and economic parameters.
In this study[60], the coastline of 11 case study areas in the UK was divided into 1 km and 0.5 km cells, and, subsequently, relative vulnerability was ranked according to low, moderate, high and very high risks. The index helped to identify relative coastal risk along diverse segments of the UK coastline. However, this new study did not take existing parameters and their thresholds from Kantamaneni et al. [60]. Instead, this current study uses the newly established components and parameters from the case study empirical data and ground analysis.
In total, 152 hectares were considered for the assessment. Three hectares were excluded from the analysis, because these lands bordered across different ownerships. In total, 149 hectares were divided into 1-hectare cell i.e., 149 cells. A transect baseline was drawn across the frontage of each of the identified agricultural coastal vulnerability sites and a 1-hectare grid (or cell) was drawn inland from the baseline (Figure 5). Comprehensive measurements based upon each parameter were recorded within each identified cell.
Figure 5. Transect line and 1-hectare agricultural coastal cell.
To evaluate agriculture vulnerability, each and every individual measurement was compared and assigned a rank—from low (1), moderate (2), high (3) to very high (4) vulnerability. Once the rankings had been allocated, these values were then summed to provide a relative AGCVI (vulnerability index) score, where
where each letter was equal to the ranking score for each parameter (ranging from 6 to 24). Then, these scores were used to classify the sites in terms of agricultural vulnerability (Table 6).
Figure 5. Transect line and 1-hectare agricultural coastal cell.
To evaluate agriculture vulnerability, each and every individual measurement was compared andassigned a rank—from low (1), moderate (2), high (3) to very high (4) vulnerability. Once the rankingshad been allocated, these values were then summed to provide a relative AGCVI (vulnerability index)score, where
AGCVI = a + b + c + d + e + f
where each letter was equal to the ranking score for each parameter (ranging from 6 to 24). Then,these scores were used to classify the sites in terms of agricultural vulnerability (Table 6).
Table 6. Total relative vulnerability score.
Total Relative Vulnerability Score Vulnerability
<11 Low11–14 Moderate15–18 High19–24 Very High
5. Results
5.1. Analysis of the AGCVI Values
Agricultural coastal cell measurements were carried out for each and every individual location,in accordance with the procedures explained in the methodology section. Each agricultural field wasdivided into 1-hectare cells and in total 149 hectares were divided into 149 cells (Table 7). In Gunturdistrict (‘district’ is synonymous with a ‘county’ in other countries) 20 sites were associated with circa143 hectares of coast agricultural land (143 cells), and the two sites in Krishna district were associatedwith circa six hectares of land (six cells).

Sustainability 2020, 12, 4771 13 of 24
Table 7. Site locations and numbers of associated cells.
Number Site Name Agricultural Land Length inCoastal Areas Considered Cell Range Total Assessed Cells
Guntur district -sites1 Nutakki 12 1–12 122 Vadlapudi 21 13–33 213 Pedapalem 4 34–37 44 Nidamarru 2 38–39 25 Aatmakuru 4 40–43 46 Revendrapadu 3 44–46 37 Namburu 38 47–84 388 Kaza 4 85–88 49 Kunchanapalli 4 89–92 4
10 Vaddeswaram 2 93–94 211 Kotha Palem 4 95–98 412 Ippatam 4 99102 413 Nizampatnam 2 103–104 214 Penumaka 4 105–108 415 Paturu 4 109–112 416 Tadepalli 8 113–120 817 Bommivani palem 4 121–124 418 Chirravuru 8 125–132 819 Tulluru 9 133–141 920 Mangalagiri 2 142–143 2
Krishna district -sites21 Madalavari gudem 4 144–147 422 Vijayawada 2 148–149 2
Total Hectares—149 Total Cells—149
5.2. Application of Agricultural Coastal Vulnerability Scores
There are substantial variations between the 149 cells with respect to their AGCVI values (Figure 6).The average CVI score for fruit crops was 2.7, and the highest was four, which was recorded for 55cells (37 percent). Most of the highest values were recorded at the Peda Vadlapudi and Pedapalemsites, which are located in Guntur district. The lowest score was one, and 44 (29 percent) cells receivedthis value. The majority of these lowest values were recorded at the Namburu site (Guntur district).The CVI scores for the fruit crop parameter clearly specified that the sites in Guntur district havegreater vulnerability with respect to this parameter than those in the Krishna district sites.
Sustainability 2020, 12, x FOR PEER REVIEW 15 of 26
5.2. Application of Agricultural Coastal Vulnerability Scores
There are substantial variations between the 149 cells with respect to their AGCVI values (Figure 6). The average CVI score for fruit crops was 2.7, and the highest was four, which was recorded for 55 cells (37 percent). Most of the highest values were recorded at the Peda Vadlapudi and Pedapalem sites, which are located in Guntur district. The lowest score was one, and 44 (29 percent) cells received this value. The majority of these lowest values were recorded at the Namburu site (Guntur district). The CVI scores for the fruit crop parameter clearly specified that the sites in Guntur district have greater vulnerability with respect to this parameter than those in the Krishna district sites.
Figure 6. Agricultural Coastal Vulnerability Index (AGCVI) scores for fruit crops.
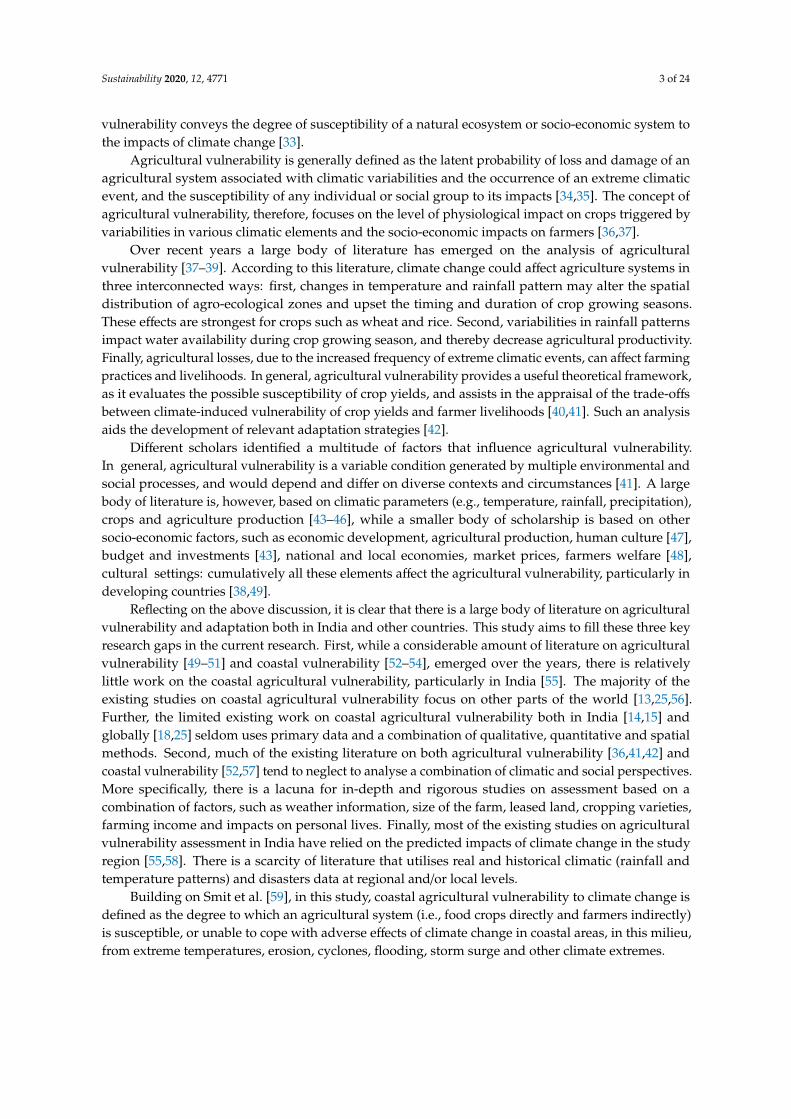
Significant variance exists among the vegetable crop CVI values for the 149 cells (Figure 7). The average CVI score was 2.4, and the highest score was four, which was recorded for 28 cells (19 percent). Those that received higher scores were found at the Revendrapadu and Kunchanapalli sites (Guntur district). The lowest score was one, and 42 cells (28 percent) received this score.
Figure 7. AGCVI scores for vegetable crops.
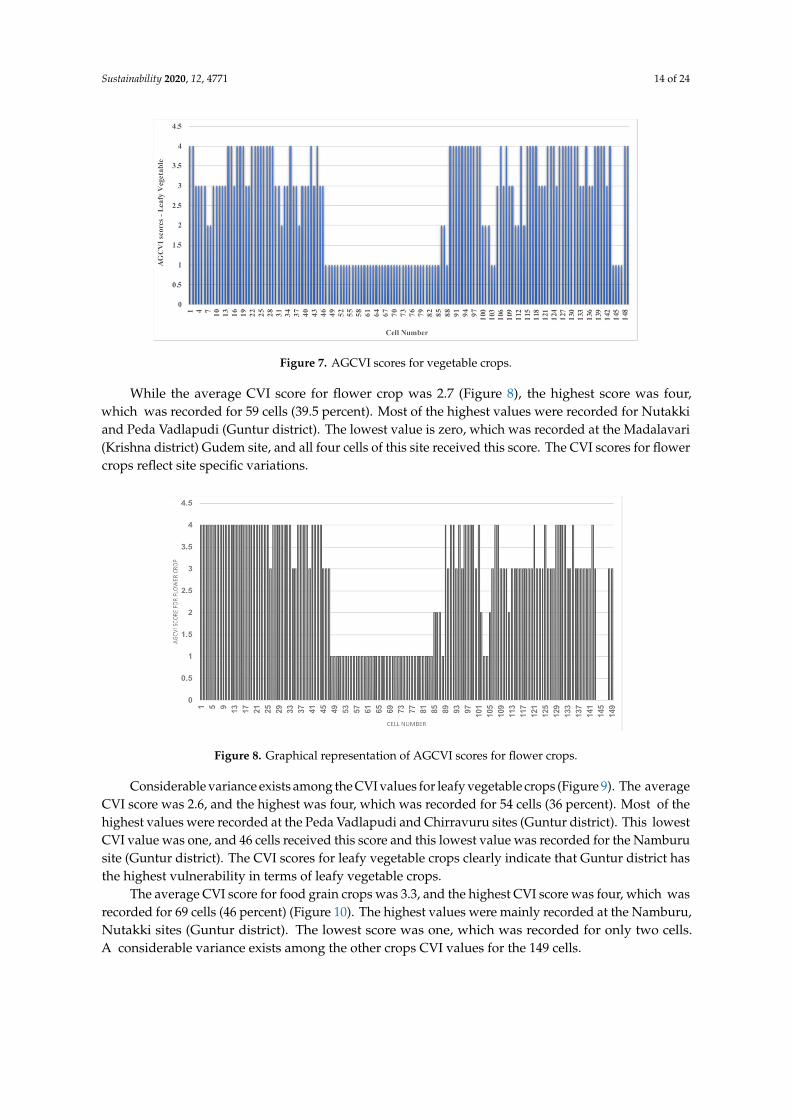
While the average CVI score for flower crop was 2.7 (Figure 8), the highest score was four, which was recorded for 59 cells (39.5 percent). Most of the highest values were recorded for Nutakki and Peda Vadlapudi (Guntur district). The lowest value is zero, which was recorded at the Madalavari (Krishna district) Gudem site, and all four cells of this site received this score. The CVI scores for flower crops reflect site specific variations.
Figure 6. Agricultural Coastal Vulnerability Index (AGCVI) scores for fruit crops.
Significant variance exists among the vegetable crop CVI values for the 149 cells (Figure 7).The average CVI score was 2.4, and the highest score was four, which was recorded for 28 cells (19percent). Those that received higher scores were found at the Revendrapadu and Kunchanapalli sites(Guntur district). The lowest score was one, and 42 cells (28 percent) received this score.
Sustainability 2020, 12, 4771 14 of 24
Sustainability 2020, 12, x FOR PEER REVIEW 15 of 26
5.2. Application of Agricultural Coastal Vulnerability Scores
There are substantial variations between the 149 cells with respect to their AGCVI values (Figure 6). The average CVI score for fruit crops was 2.7, and the highest was four, which was recorded for 55 cells (37 percent). Most of the highest values were recorded at the Peda Vadlapudi and Pedapalem sites, which are located in Guntur district. The lowest score was one, and 44 (29 percent) cells received this value. The majority of these lowest values were recorded at the Namburu site (Guntur district). The CVI scores for the fruit crop parameter clearly specified that the sites in Guntur district have greater vulnerability with respect to this parameter than those in the Krishna district sites.
Figure 6. Agricultural Coastal Vulnerability Index (AGCVI) scores for fruit crops.
Significant variance exists among the vegetable crop CVI values for the 149 cells (Figure 7). The average CVI score was 2.4, and the highest score was four, which was recorded for 28 cells (19 percent). Those that received higher scores were found at the Revendrapadu and Kunchanapalli sites (Guntur district). The lowest score was one, and 42 cells (28 percent) received this score.
Figure 7. AGCVI scores for vegetable crops.
While the average CVI score for flower crop was 2.7 (Figure 8), the highest score was four, which was recorded for 59 cells (39.5 percent). Most of the highest values were recorded for Nutakki and Peda Vadlapudi (Guntur district). The lowest value is zero, which was recorded at the Madalavari (Krishna district) Gudem site, and all four cells of this site received this score. The CVI scores for flower crops reflect site specific variations.
Figure 7. AGCVI scores for vegetable crops.
While the average CVI score for flower crop was 2.7 (Figure 8), the highest score was four,which was recorded for 59 cells (39.5 percent). Most of the highest values were recorded for Nutakkiand Peda Vadlapudi (Guntur district). The lowest value is zero, which was recorded at the Madalavari(Krishna district) Gudem site, and all four cells of this site received this score. The CVI scores for flowercrops reflect site specific variations.Sustainability 2020, 12, x FOR PEER REVIEW 16 of 26
Figure 8. Graphical representation of AGCVI scores for flower crops.
Considerable variance exists among the CVI values for leafy vegetable crops (Figure 9). The average CVI score was 2.6, and the highest was four, which was recorded for 54 cells (36 percent). Most of the highest values were recorded at the Peda Vadlapudi and Chirravuru sites (Guntur district). This lowest CVI value was one, and 46 cells received this score and this lowest value was recorded for the Namburu site (Guntur district). The CVI scores for leafy vegetable crops clearly indicate that Guntur district has the highest vulnerability in terms of leafy vegetable crops.
Figure 9. Graphical representation of AGCVI scores for leafy vegetable.
The average CVI score for food grain crops was 3.3, and the highest CVI score was four, which was recorded for 69 cells (46 percent) (Figure 10). The highest values were mainly recorded at the Namburu, Nutakki sites (Guntur district). The lowest score was one, which was recorded for only two cells. A considerable variance exists among the other crops CVI values for the 149 cells.
Figure 10. Graphical representation of AGCVI scores for food grain crops.
Figure 8. Graphical representation of AGCVI scores for flower crops.
Considerable variance exists among the CVI values for leafy vegetable crops (Figure 9). The averageCVI score was 2.6, and the highest was four, which was recorded for 54 cells (36 percent). Most of thehighest values were recorded at the Peda Vadlapudi and Chirravuru sites (Guntur district). This lowestCVI value was one, and 46 cells received this score and this lowest value was recorded for the Namburusite (Guntur district). The CVI scores for leafy vegetable crops clearly indicate that Guntur district hasthe highest vulnerability in terms of leafy vegetable crops.
The average CVI score for food grain crops was 3.3, and the highest CVI score was four, which wasrecorded for 69 cells (46 percent) (Figure 10). The highest values were mainly recorded at the Namburu,Nutakki sites (Guntur district). The lowest score was one, which was recorded for only two cells.A considerable variance exists among the other crops CVI values for the 149 cells.

Sustainability 2020, 12, 4771 15 of 24
Sustainability 2020, 12, x FOR PEER REVIEW 16 of 26
Figure 8. Graphical representation of AGCVI scores for flower crops.
Considerable variance exists among the CVI values for leafy vegetable crops (Figure 9). The average CVI score was 2.6, and the highest was four, which was recorded for 54 cells (36 percent). Most of the highest values were recorded at the Peda Vadlapudi and Chirravuru sites (Guntur district). This lowest CVI value was one, and 46 cells received this score and this lowest value was recorded for the Namburu site (Guntur district). The CVI scores for leafy vegetable crops clearly indicate that Guntur district has the highest vulnerability in terms of leafy vegetable crops.
Figure 9. Graphical representation of AGCVI scores for leafy vegetable.
The average CVI score for food grain crops was 3.3, and the highest CVI score was four, which was recorded for 69 cells (46 percent) (Figure 10). The highest values were mainly recorded at the Namburu, Nutakki sites (Guntur district). The lowest score was one, which was recorded for only two cells. A considerable variance exists among the other crops CVI values for the 149 cells.
Figure 10. Graphical representation of AGCVI scores for food grain crops.
Figure 9. Graphical representation of AGCVI scores for leafy vegetable.
Sustainability 2020, 12, x FOR PEER REVIEW 16 of 26
Figure 8. Graphical representation of AGCVI scores for flower crops.
Considerable variance exists among the CVI values for leafy vegetable crops (Figure 9). The average CVI score was 2.6, and the highest was four, which was recorded for 54 cells (36 percent). Most of the highest values were recorded at the Peda Vadlapudi and Chirravuru sites (Guntur district). This lowest CVI value was one, and 46 cells received this score and this lowest value was recorded for the Namburu site (Guntur district). The CVI scores for leafy vegetable crops clearly indicate that Guntur district has the highest vulnerability in terms of leafy vegetable crops.
Figure 9. Graphical representation of AGCVI scores for leafy vegetable.
The average CVI score for food grain crops was 3.3, and the highest CVI score was four, which was recorded for 69 cells (46 percent) (Figure 10). The highest values were mainly recorded at the Namburu, Nutakki sites (Guntur district). The lowest score was one, which was recorded for only two cells. A considerable variance exists among the other crops CVI values for the 149 cells.
Figure 10. Graphical representation of AGCVI scores for food grain crops. Figure 10. Graphical representation of AGCVI scores for food grain crops.
The average CVI score for other crops was 2.3, and the highest CVI score was four, which wasrecorded for 21 cells (Figure 11). Most of the highest values were recorded at Nutakki and PedaVadlapudi. Of the sites surveyed, the CVI scores for food grains and leafy vegetables suggestthat locations in Guntur district take more coastal agricultural protection measures than those inKrishna district.
Sustainability 2020, 12, x FOR PEER REVIEW 17 of 26
The average CVI score for other crops was 2.3, and the highest CVI score was four, which was recorded for 21 cells (Figure 11). Most of the highest values were recorded at Nutakki and Peda Vadlapudi. Of the sites surveyed, the CVI scores for food grains and leafy vegetables suggest that locations in Guntur district take more coastal agricultural protection measures than those in Krishna district.
Figure 11. Graphical representation of AGCVI scores for other crops.
5.3. Overall AGCVI Scores and Trends
Considerable variations exist between the 149 AGCVI values as shown in Figure 12. The greater number of cells fall between very high and high categories. The average value was 16.21, which corresponds to the high category. However, the maximum AGCVI value (23) was obtained for the Peda Vadlapudi and Chirravuru sites (Guntur district), while the lowest (seven) was obtained for the Namburu site.
Figure 12. Overall trend of AGCVI values.
As shown in Figure 13, more than 48 percent of cells were rated as having very high vulnerability (19–24), and 19 percent of the cells were rated as highly vulnerable (16–18). In addition, only six percent of the cells were found to be moderately vulnerable (12–15). The overall CVI scores clearly indicated that 67 percent of cells have either extremely high or high agricultural vulnerability in the selected 22 case study areas in coastal Andhra Pradesh (Krishna and Guntur districts).
Figure 11. Graphical representation of AGCVI scores for other crops.
5.3. Overall AGCVI Scores and Trends
Considerable variations exist between the 149 AGCVI values as shown in Figure 12. The greaternumber of cells fall between very high and high categories. The average value was 16.21,which corresponds to the high category. However, the maximum AGCVI value (23) was obtained forthe Peda Vadlapudi and Chirravuru sites (Guntur district), while the lowest (seven) was obtained forthe Namburu site.

Sustainability 2020, 12, 4771 16 of 24
Sustainability 2020, 12, x FOR PEER REVIEW 17 of 26
The average CVI score for other crops was 2.3, and the highest CVI score was four, which was recorded for 21 cells (Figure 11). Most of the highest values were recorded at Nutakki and Peda Vadlapudi. Of the sites surveyed, the CVI scores for food grains and leafy vegetables suggest that locations in Guntur district take more coastal agricultural protection measures than those in Krishna district.
Figure 11. Graphical representation of AGCVI scores for other crops.
5.3. Overall AGCVI Scores and Trends
Considerable variations exist between the 149 AGCVI values as shown in Figure 12. The greater number of cells fall between very high and high categories. The average value was 16.21, which corresponds to the high category. However, the maximum AGCVI value (23) was obtained for the Peda Vadlapudi and Chirravuru sites (Guntur district), while the lowest (seven) was obtained for the Namburu site.
Figure 12. Overall trend of AGCVI values.
As shown in Figure 13, more than 48 percent of cells were rated as having very high vulnerability (19–24), and 19 percent of the cells were rated as highly vulnerable (16–18). In addition, only six percent of the cells were found to be moderately vulnerable (12–15). The overall CVI scores clearly indicated that 67 percent of cells have either extremely high or high agricultural vulnerability in the selected 22 case study areas in coastal Andhra Pradesh (Krishna and Guntur districts).
Figure 12. Overall trend of AGCVI values.
As shown in Figure 13, more than 48 percent of cells were rated as having very high vulnerability(19–24), and 19 percent of the cells were rated as highly vulnerable (16–18). In addition, only six percentof the cells were found to be moderately vulnerable (12–15). The overall CVI scores clearly indicatedthat 67 percent of cells have either extremely high or high agricultural vulnerability in the selected 22case study areas in Coastal Andhra Pradesh (Krishna and Guntur districts).Sustainability 2020, 12, x FOR PEER REVIEW 18 of 26
Figure 13. Overall AGCVI scores distribution.
AGCVI values reveal the overall vulnerability and suggest that the Guntur district case study locations may be more vulnerable than those in Krishan district because of more crops grown in three seasons. Some agricultural cells have few or no flower crops (Madalavari Gudem-Krishna district) and some other sites such as Namburu have huge number of food grains in 38 cells.
6. Discussion
6.1. Agricultural Vulnerability from a Physiological and Environmental Perspective
The present study established the novel Agricultural Coastal Vulnerability Index (AGCVI) with six new parameters: fruit crops, vegetable crops, flower crops, leafy vegetable crops, food grain crops and other crops. The selection of agricultural parameters can be complicated, due to the number of crops within specific coastal and agricultural environments. However, these parameters were developed by conducting surveys and workshops for farmers in selected case study areas between November 2018 and June 2019 in the CAP region. This method of parameters is a new approach to agricultural vulnerability assessment. The literature on agricultural coastal vulnerability is very limited in India, and this is perhaps the first index which evaluates the coastal vulnerability at the sub-regional level in India.
The findings of this research show that in some agricultural sites, such as Madalavarigudem (Krishna district) and Vijayawada, (Krishna district), there are no food grain crops, because of unsuitable geographical locations, poor soil suitability or lack of appropriate water irrigation facilities. Before planning the farming in a particular area, the famers consider water availability and water quality [75]. In Madalavari Gudem (Krishna district), farmers are always keen to farm fruit (mango), even though they suffer from huge losses due to frequent natural disaster events such as cyclones (Figure 14). Cyclones result in severe destruction to the agricultural farms in coastal areas especially in tropical countries [76]. High climate variability increases the natural disasters’ number, and ultimately leads to more fiscal damage [77].
Figure 13. Overall AGCVI scores distribution.
AGCVI values reveal the overall vulnerability and suggest that the Guntur district case studylocations may be more vulnerable than those in Krishan district because of more crops grown in threeseasons. Some agricultural cells have few or no flower crops (Madalavari Gudem-Krishna district) andsome other sites such as Namburu have huge number of food grains in 38 cells.
6. Discussion
6.1. Agricultural Vulnerability from a Physiological and Environmental Perspective
The present study established the novel Agricultural Coastal Vulnerability Index (AGCVI) with sixnew parameters: fruit crops, vegetable crops, flower crops, leafy vegetable crops, food grain crops andother crops. The selection of agricultural parameters can be complicated, due to the number of cropswithin specific coastal and agricultural environments. However, these parameters were developed

Sustainability 2020, 12, 4771 17 of 24
by conducting surveys and workshops for farmers in selected case study areas between November2018 and June 2019 in the CAP region. This method of parameters is a new approach to agriculturalvulnerability assessment. The literature on agricultural coastal vulnerability is very limited in India,and this is perhaps the first index which evaluates the coastal vulnerability at the sub-regional levelin India.
The findings of this research show that in some agricultural sites, such as Madalavarigudem(Krishna district) and Vijayawada, (Krishna district), there are no food grain crops, because ofunsuitable geographical locations, poor soil suitability or lack of appropriate water irrigation facilities.Before planning the farming in a particular area, the famers consider water availability and waterquality [75]. In Madalavari Gudem (Krishna district), farmers are always keen to farm fruit (mango),even though they suffer from huge losses due to frequent natural disaster events such as cyclones(Figure 14). Cyclones result in severe destruction to the agricultural farms in coastal areas especially intropical countries [76]. High climate variability increases the natural disasters’ number, and ultimatelyleads to more fiscal damage [77].Sustainability 2020, 12, x FOR PEER REVIEW 19 of 26
Figure 14. Cyclone Fani impacts on a mango garden in Madalavarigudem (June 2019).
The degree of the impact of climate change and other natural hazards in agriculture depends on the level of susceptibility or exposure of farmers to these effects. Several fruit crops were impacted by cyclone Fani in CAP in the case study areas in May 2019. In Chirravuru (Guntur district) banana crops were severely damaged due to Cyclone Fani, and several farmers lost entire crops (Figure 15) and did not get an insurance payment for that damage. Due to these unexpected weather events, the farmers’ lives were negatively impacted socially and economically. Crop change may be an appropriate alternative for reducing vulnerability or economic insurance for evading the influence of risk exposure [78]. In many regions across the world, the circumstances that give rise to flooding or crop failure are expected to be intensified by climate change in the coming years [79].
Figure 15. Cyclone Fani impacts on Banana crop in Chirravuru—June 2019.
The highest coastal vulnerability was recorded in the Peda Vadlapudi and Chirravuru sites, because of multiple crop (flower, fruit and vegetable) cultivation and rotations per year. Cyclones, flooding, strong winds and erosion are major issues in the selected case study areas, and these are impacting the coastal agricultural areas. In locations such as Tulluru, Vijayawada and Kunchanapalli, the addition of new urban developments (Figure 16) will further increase pressure, potentially leading to even greater economic losses from flooding and storm damage. Agricultural lands, which serve as the main source of livelihood, have been intruded upon by the urban development processes
Figure 14. Cyclone Fani impacts on a mango garden in Madalavarigudem (June 2019).
The degree of the impact of climate change and other natural hazards in agriculture depends onthe level of susceptibility or exposure of farmers to these effects. Several fruit crops were impactedby cyclone Fani in CAP in the case study areas in May 2019. In Chirravuru (Guntur district) bananacrops were severely damaged due to Cyclone Fani, and several farmers lost entire crops (Figure 15)and did not get an insurance payment for that damage. Due to these unexpected weather events,the farmers’ lives were negatively impacted socially and economically. Crop change may be anappropriate alternative for reducing vulnerability or economic insurance for evading the influence ofrisk exposure [78]. In many regions across the world, the circumstances that give rise to flooding orcrop failure are expected to be intensified by climate change in the coming years [79].
The highest coastal vulnerability was recorded in the Peda Vadlapudi and Chirravuru sites,because of multiple crop (flower, fruit and vegetable) cultivation and rotations per year. Cyclones,flooding, strong winds and erosion are major issues in the selected case study areas, and these areimpacting the coastal agricultural areas. In locations such as Tulluru, Vijayawada and Kunchanapalli,the addition of new urban developments (Figure 16) will further increase pressure, potentially leadingto even greater economic losses from flooding and storm damage. Agricultural lands, which serve asthe main source of livelihood, have been intruded upon by the urban development processes in recentyears in CAP. Additionally, the pressures of rapid urbanisation have adverse impacts on (mainly)poorer farming communities, especially in coastal regions [80].

Sustainability 2020, 12, 4771 18 of 24
Sustainability 2020, 12, x FOR PEER REVIEW 19 of 26
Figure 14. Cyclone Fani impacts on a mango garden in Madalavarigudem (June 2019).
The degree of the impact of climate change and other natural hazards in agriculture depends on the level of susceptibility or exposure of farmers to these effects. Several fruit crops were impacted by cyclone Fani in CAP in the case study areas in May 2019. In Chirravuru (Guntur district) banana crops were severely damaged due to Cyclone Fani, and several farmers lost entire crops (Figure 15) and did not get an insurance payment for that damage. Due to these unexpected weather events, the farmers’ lives were negatively impacted socially and economically. Crop change may be an appropriate alternative for reducing vulnerability or economic insurance for evading the influence of risk exposure [78]. In many regions across the world, the circumstances that give rise to flooding or crop failure are expected to be intensified by climate change in the coming years [79].
Figure 15. Cyclone Fani impacts on Banana crop in Chirravuru—June 2019.
The highest coastal vulnerability was recorded in the Peda Vadlapudi and Chirravuru sites, because of multiple crop (flower, fruit and vegetable) cultivation and rotations per year. Cyclones, flooding, strong winds and erosion are major issues in the selected case study areas, and these are impacting the coastal agricultural areas. In locations such as Tulluru, Vijayawada and Kunchanapalli, the addition of new urban developments (Figure 16) will further increase pressure, potentially leading to even greater economic losses from flooding and storm damage. Agricultural lands, which serve as the main source of livelihood, have been intruded upon by the urban development processes
Figure 15. Cyclone Fani impacts on Banana crop in Chirravuru—June 2019.
Sustainability 2020, 12, x FOR PEER REVIEW 20 of 26
in recent years in CAP. Additionally, the pressures of rapid urbanisation have adverse impacts on (mainly) poorer farming communities, especially in coastal regions [80].
The main challenge from rapid urban growth is changing land use patterns. Nonetheless, whilst urbanisation is necessary, it does not need to destroy rural farming; there is a need for more careful consideration and balancing of urban development and protection of agricultural space. Whilst ensuring necessary and sustainable urban development take place, policymakers should focus more attention on the protection of agricultural lands, as these are the key source of economic livelihood in CAP.
Figure 16. New urban development in Kunchanapalli.
The current study also found that rice is not a commercial crop in the majority of study areas, and some farmers even expressed that they are no longer interested in farming, because of unexpected losses due to natural disasters and lack of support from the government. Though India ranks third in the production of rice, its yield is less than China, Brazil and the United States [81]. On the evidence of overall trends, AGCVI index scores showed the diverse trends for six crop varieties, of which the fruit crops, banana and in food grains rice are the most vulnerable crops.
6.2. Agricultural Vulnerability from a Socio-Economic and Cultural Perspective
In CAP, climate change creates effects not only in agriculture but also in farmers’ personal lives. During the data collection process in the CAP region, many young farmers shared novel insights into the changing socio-economic aspects of agricultural life particularly about changing marital practices. The majority of the farmers said that they are not getting married because of their farming profession, which is leading to a marriage crisis. The worsening fluctuations in climatic conditions are leading to many young farmers becoming middle-aged bachelors. In Krishna and Guntur districts, the majority of farmers are male and earn low to medium ranged incomes, and they typically have between one to five acres of farming land. In India, the majority of marriages are arranged; however, due to the increasing uncertainty of farmers’ incomes, many parents no longer want farmers as their son-in-law. Increasingly the eligible women instead prefer to marry employees (particularly government employees), who earn a stable monthly income.
One of the young farmers from Guntur district said: “I am searching for a suitable bride for eight years and still not yet married”.
Another farmer, now is in his early 40s, said that: “I did not get a bride even though I offered a financial incentive” (known locally as a Kanyasulkam—the traditional custom of a gift to the future bride).
Many of the farmers remain as bachelors, due to changes in the brides’ preferences as a corollary of the climate crisis. These circumstances explain that in both districts, agriculture is becoming an increasingly uncertain, precarious and undesirable profession, due to the climate crisis. A significant
Figure 16. New urban development in Kunchanapalli.
The main challenge from rapid urban growth is changing land use patterns. Nonetheless,whilst urbanisation is necessary, it does not need to destroy rural farming; there is a need formore careful consideration and balancing of urban development and protection of agricultural space.Whilst ensuring necessary and sustainable urban development take place, policymakers should focusmore attention on the protection of agricultural lands, as these are the key source of economic livelihoodin CAP.
The current study also found that rice is not a commercial crop in the majority of study areas,and some farmers even expressed that they are no longer interested in farming, because of unexpectedlosses due to natural disasters and lack of support from the government. Though India ranks third inthe production of rice, its yield is less than China, Brazil and the United States [81]. On the evidence ofoverall trends, AGCVI index scores showed the diverse trends for six crop varieties, of which the fruitcrops, banana and in food grains rice are the most vulnerable crops.
6.2. Agricultural Vulnerability from a Socio-Economic and Cultural Perspective
In CAP, climate change creates effects not only in agriculture but also in farmers’ personal lives.During the data collection process in the CAP region, many young farmers shared novel insightsinto the changing socio-economic aspects of agricultural life particularly about changing marital

Sustainability 2020, 12, 4771 19 of 24
practices. The majority of the farmers said that they are not getting married because of their farmingprofession, which is leading to a marriage crisis. The worsening fluctuations in climatic conditions areleading to many young farmers becoming middle-aged bachelors. In Krishna and Guntur districts,the majority of farmers are male and earn low to medium ranged incomes, and they typically havebetween one to five acres of farming land. In India, the majority of marriages are arranged; however,due to the increasing uncertainty of farmers’ incomes, many parents no longer want farmers astheir son-in-law. Increasingly the eligible women instead prefer to marry employees (particularlygovernment employees), who earn a stable monthly income.
One of the young farmers from Guntur district said: “I am searching for a suitable bride for eightyears and still not yet married”.
Another farmer, now is in his early 40s, said that: “I did not get a bride even though I offered a financialincentive” (known locally as a Kanyasulkam—the traditional custom of a gift to the future bride).
Many of the farmers remain as bachelors, due to changes in the brides’ preferences as a corollaryof the climate crisis. These circumstances explain that in both districts, agriculture is becoming anincreasingly uncertain, precarious and undesirable profession, due to the climate crisis. A significantnumber of farmers are effectively forced to migrate to other regions (or states in their respected regions)in order to cope with the emerging marriage crisis. If the impact of climate change is not minimisedin the near future, agriculture will be significantly affected, as well as harming many traditionalcultural practices.
The focus on climate change hitherto has mostly focused on the impacts on the natural environment.This research highlights for the first time that social and cultural changes are also occurring as aconsequence of environmental damage. The climate crisis is linked to a marriage crisis, in a placewhere over a billion of the world’s population still have arranged marriages, the social and culturalconsequences of climate change are just beginning to be understood and experienced; but furtherresearch is required to better understand this emerging issue.
7. Conclusions
7.1. Main Research Findings
The coastal agricultural sector in low-to-middle income countries faces many challenges, such asrising demand, pressures from natural disasters, and dealing with the uncertainties of climaticchanges. Upgraded information and knowledge is vital to generate applicable measures to cope withclimate-induced risks and reduce agriculture vulnerability. Accordingly, the current study measuredthe coastal agricultural vulnerability of 22 case study areas located in Andhra Pradesh (AP) (Gunturand Krishna districts), the state with the second longest coastline in India, by the development of anovel index, namely the (Agricultural Coastal Vulnerability Index AGCVI). The AGCVI was establishedwith six new parameters that were evaluated on an agricultural site-by-site basis and then applied tothe 22 identified coastal agricultural areas. The results revealed that agricultural vulnerability variesacross the sites. Current Coastal Andhra Pradesh (CAP) coastal vulnerability is relatively unevenacross the 22 sites, and the highest score was identified in the Pedavadlapudi and Chirravuru sites.The lowest scores were identified at the Nmaburu and Kaza sites, even though they have the highestfood grain vulnerability. The results also show that food grain crops, flower crop and fruit crops arethe most vulnerable; leafy vegetable crops and flower crops are the most profitable crops comparedto other crops. Rice crops are no longer a profitable crop in the case study sites. Fluctuations inclimatic conditions, natural disasters such as floods and cyclones in non-rainy seasons and strongwinds are the main reasons for the agricultural vulnerability in the selected case study areas. Overall,the climate crisis conditions are negatively affecting the farmers’ economic resources, leading toprofound disruption to social life and cultural practices within this community.

Sustainability 2020, 12, 4771 20 of 24
7.2. Policy Implications
The study results have implications for several policy areas with regard to tackling climate-inducedagriculture vulnerability, and for preparing farmers to cope up with the risks from exposure to climatechange. The results of the study show that climate change may pose a serious challenge to theagricultural sector in India through changes in rainfall and temperature patterns and an increasedfrequency of natural disasters such as droughts and floods. Under such circumstances, a large numberof small-scale and marginal farmers will be extremely vulnerable to climate change, and so adaptationshould be a priority for policy development in India. Furthermore, small-scale and marginal farmerswill not be able to cope with the impacts of natural disasters, which will be further exacerbateddue to the challenges posed by climate change. Considering these challenges, the following policyrecommendations are proposed to support adaptation at household level. First, social protectionmeasures that build on traditional risk diffusion measures, such as borrowings in drought years,crop storage for lean years and accumulation of financial assets are recommended, as they can partiallycontribute to improving the adaptive capacity of farmers to new climatic changes. Second, policies thatpromote better access to crop insurance, crop diversity, water harvesting, knowledge and awarenesson water conservation practices, providing drought-resistant crop varieties, and improved weatherinformation availability can play an important role in increasing farmers’ resilience and ability to adaptto climate change. However, the policies that support crop insurance should not incentivise specificcrops, as this will lead to mono-cropping and loss of biodiversity, which, in the long run, may leadto maladaptation (increased vulnerability in subsequent time periods). Finally, best practices andsuccessful examples of sustainable and resilient farming practices in different agro-climatic zonesshould be identified and scaled-up. Simultaneously, farmers should respond to climate change byinvesting in risk reduction strategies such as crop diversification, changing cropping patterns anddates, soil and water management techniques and expanding irrigation.
7.3. Research Challenges and Future Work
Although the present study has produced some significant and interesting results, there are certainresearch limitations and challenges that can be improvised for better research in this field. Firstly, due tothe dearth of availability of consistent government data on crop yield and revenues for a particularregion, it took a lot of time to compile and finalise the data sets. Secondly, significant socio-economic,cultural and caste differences in the 22 case study areas led to challenges in collecting betterrepresentative samples. Thirdly, due to limited fieldwork time, the research could not be extendedto more areas. Fourthly, the lack of full access to census data on soil fertility and crop cultivation isa major limitation, and could be better addressed in future research. Finally, during the field visits,some regional and sub-regional farmers and authorities did not respond within the timeframe andpostponed the meeting events without prior notice. However, most of the vital information wasobtained during the stipulated data collection period.
The results of this research can be improved by spatially comparing other vulnerable regions ofthe state and the country to the present study area. It is further proposed that future work shouldinclude ‘fuzzy logic’ methods to apply a weighting system to parameters. In addition, drone surveydata, spatial data and normal survey data could be combined for a better evaluation of agriculturalvulnerability research. Additionally, more analysis on updated grey literature and policy reportscould be included to analyse agriculture systems in future studies. These research areas could alsosignificantly strengthen the policy implications of this research.
Author Contributions: K.K. designed the study and developed the methodological procedures. K.K. performedfield visits, workshops and surveys. K.K. and K.Y. wrote the paper. L.R., K.Y. and L.C.C. modified the manuscriptand advised on the results and discussion sections. K.Y. advised on limitations and policy recommendations.All authors have read and agreed to the published version of the manuscript.
Funding: This research was funded by the GCRF (Global Challenges Research Fund), United Kingdom.

Sustainability 2020, 12, 4771 21 of 24
Acknowledgments: Particular acknowledgement is made to Pammi Nitin Sinha and Sudha Rani NVV for theirassistance in generating study area maps using MatLab and ArcGIS.
Conflicts of Interest: The authors declare no conflict of interest.
References
1. World Bank. Agriculture Is Environment. Available online: http://siteresources.worldbank.org/
DATASTATISTICS/Resources/WDI07section3-intro.pdf (accessed on 10 December 2019).2. Food and Agricultural Organisation (FAO). Integration of Agriculture into Coastal Area Management.
Available online: http://www.fao.org/3/W8440e07.htm (accessed on 12 December 2019).3. Calabi-Floody, M.; Medina, J.; Rumpel, C.; Condron, L.M.; Hernandez, M.; Dumont, M.; de la Luz Mora, M.
Smart fertilizers as a strategy for sustainable agriculture. In Advances in Agronomy; Elsevier: Amsterdam,The Netherlands, 2018; Volume 147, pp. 119–157.
4. Kotir, J.H. Climate change and variability in Sub-Saharan Africa: A review of current and future trends andimpacts on agriculture and food security. Environ. Dev. Sustain. 2011, 13, 587–605. [CrossRef]
5. Dawson, T.P.; Perryman, A.H.; Osborne, T.M. Modelling impacts of climate change on global food security.Clim. Chang. 2016, 134, 429–440. [CrossRef]
6. D’Amour, C.B.; Reitsma, F.; Baiocchi, G.; Barthel, S.; Güneralp, B.; Erb, K.-H.; Haberl, H.; Creutzig, F.;Seto, K.C. Future urban land expansion and implications for global croplands. Proc. Natl. Acad. Sci. USA2017, 114, 8939–8944.
7. United Nations (UN). Devastating Impacts of Climate Change Threatening Farm Outputs, Increasing GlobalHunger, Delegates Say as Second Committee Takes up Agriculture, Food Security. Available online:https://www.un.org/press/en/2018/gaef3499.doc.htm (accessed on 12 October 2019).
8. Knox, J.; Hess, T.; Daccache, A.; Wheeler, T. Climate change impacts on crop productivity in Africa and SouthAsia. Environ. Res. Lett. 2012, 7, 034032. [CrossRef]
9. Field, C.B.; Barros, V.R.; Dokken, D.; Mach, K.; Mastrandrea, M.; Bilir, T.; Chatterjee, M.; Ebi, K.; Estrada, Y.;Genova, R. IPCC, 2014: Climate Change 2014: Impacts, Adaptation, and Vulnerability. Part A: Global and SectoralAspects. Contribution of Working Group II to the Fifth Assessment Report of the Intergovernmental Panel on ClimateChange; Cambridge University Press: Cambridge, UK; New York, NY, USA, 2014.
10. Adger, W.N.; Hughes, T.P.; Folke, C.; Carpenter, S.R.; Rockström, J. Social-ecological resilience to coastaldisasters. Science 2005, 309, 1036–1039. [CrossRef] [PubMed]
11. Rasul, G.; Mahmood, A.; Sadiq, A.; Khan, S. Vulnerability of the Indus delta to climate change in Pakistan.Pak. J. Meteorol. 2012, 8, 89–107.
12. Akanda, M.; Howlader, M. Coastal farmers’ perception of climate change effects on agriculture at GalachipaUpazila under Patuakhali District of Bangladesh. Glob. J. Sci. Front. Res. Agric. Vet. 2015, 15, 30–39.
13. Huq, N.; Hugé, J.; Boon, E.; Gain, A.K. Climate change impacts in agricultural communities in rural areas ofcoastal Bangladesh: A tale of many stories. Sustainability 2015, 7, 8437–8460. [CrossRef]
14. Gopalakrishnan, T.; Hasan, M.K.; Haque, A.; Jayasinghe, S.L.; Kumar, L. Sustainability of Coastal Agricultureunder Climate Change. Sustainability 2019, 11, 7200. [CrossRef]
15. Geethalakshmi, V.; Manikandan, N.; Sumathi, S.; Bhuvaneswari, K.; Gowtham, R.; Pannerselvam, S. Impact ofClimate Change on Coastal Agriculture. Int. J. Econ. Plants 2016, 3, 93–97.
16. Banerjee, S.; Samanta, S.; Chakraborti, P.K. Impact of Climate Change on Coastal Agro-Ecosystems.In Sustainable Agriculture Reviews 33; Springer: Berlin/Heidelberg, Germany, 2018; pp. 115–133.
17. Van Dan, T.; Bond, J.; Thuy, N.T.T. Assessment of Impacts of Climate Change on Agriculture and Fisheries inthe Coastal Areas of Thua Thien Hue Province, Vietnam. Agric. Dev. Notes 2018, 8, 1–4.
18. Hoque, M.Z.; Cui, S.; Xu, L.; Islam, I.; Tang, J.; Ding, S. Assessing Agricultural Livelihood Vulnerability toClimate Change in Coastal Bangladesh. Int. J. Environ. Res. Public Health 2019, 16, 4552. [CrossRef] [PubMed]
19. Kareemulla, K.; Venkattakumar, R.; Samuel, M.P. An analysis on agricultural sustainability in India. Curr. Sci.2017, 112, 258–266. [CrossRef]
20. Natcom, I.; Ministry of Environment and Forests, Government of India. India: Second NationalCommunication to the United Nations Framework Convention on Climate Change. 2013. Available online:http://envfor.nic.in/ (accessed on 10 December 2019).

Sustainability 2020, 12, 4771 22 of 24
21. Auffhammer, M.; Ramanathan, V.; Vincent, J.R. Climate change, the monsoon, and rice yield in India.Clim. Chang. 2012, 111, 411–424. [CrossRef]
22. Cline, W.R. Global Warming and Agriculture: Impact Estimates by Country; Peterson Institute,Columbia University Press: Washington, DC, USA, 2007.
23. Centre for Coastal Zone Management and Coastal Shelter Belt. Coastal States of India. Available online:http://iomenvis.nic.in/index2.aspx?slid=758&sublinkid=119&langid=1&mid=1 (accessed on 1 January 2020).
24. Rosenzweig, C.; Hillel, D. Climate Change and the Global Harvest: Potential Impacts of the Greenhouse Effect onAgriculture; Oxford University Press: Oxford, UK, 1998.
25. Hareau, A.; Hofstadter, R.; Saizar, A. Vulnerability to climate change in Uruguay: Potential impacts on theagricultural and coastal resource sectors and response capabilities. Clim. Res. 1999, 12, 185–193. [CrossRef]
26. Wisner, B.; Luce, H.R. Disaster vulnerability: Scale, power and daily life. GeoJournal 1993, 30, 127–140.[CrossRef]
27. Blaikie, P.; Cannon, T.; Davis, I.; Wisner, B. At Risk: Natural Hazards, People’s Vulnerability and Disasters;Routledge: London, UK, 2014.
28. Cutter, S.L. Vulnerability to environmental hazards. Prog. Hum. Geogr. 1996, 20, 529–539. [CrossRef]29. Fuchs, S.; Birkmann, J.; Glade, T. Vulnerability assessment in natural hazard and risk analysis: Current
approaches and future challenges. Nat. Hazards 2012, 64, 1969–1975. [CrossRef]30. Dilley, M.; Boudreau, T.E. Coming to terms with vulnerability: A critique of the food security definition.
Food Policy 2001, 26, 229–247. [CrossRef]31. Yin, P.; Fang, X.; Yun, Y. Regional differences of vulnerability of food security in China. J. Geogr. Sci. 2009,
19, 532. [CrossRef]32. Füssel, H.-M.; Klein, R.J. Climate change vulnerability assessments: An evolution of conceptual thinking.
Clim. Chang. 2006, 75, 301–329. [CrossRef]33. Yenneti, K.; Tripathi, S.; Wei, Y.D.; Chen, W.; Joshi, G. The truly disadvantaged? Assessing social vulnerability
to climate change in urban India. Habitat Int. 2016, 56, 124–135. [CrossRef]34. Lavell, A. Unpacking climate change adaptation and disaster risk management: Searching for the links and
the differences: A conceptual and epistemological critique and proposal. IUCN-Flacso Proj. Clim. Chang.Adapt. Disaster Risk Reduct. 2011.
35. Kelly, P.M.; Adger, W.N. Theory and practice in assessing vulnerability to climate change and facilitatingadaptation. Clim. Chang. 2000, 47, 325–352. [CrossRef]
36. Dong, Z.; Pan, Z.; An, P.; Wang, L.; Zhang, J.; He, D.; Han, H.; Pan, X. A novel method for quantitativelyevaluating agricultural vulnerability to climate change. Ecol. Indic. 2015, 48, 49–54. [CrossRef]
37. Hulme, D.; Mosley, P. Finance for the Poor Or Poorest?: Financial Innovation, Poverty and Vulnerability;University of Reading, Department of Economics and Department of Agricultural Economics: Reading,UK, 1996.
38. Fischer, G.; Frohberg, K.; Parry, M.L.; Rosenzweig, C. Impacts of potential climate change on globaland regional food production and vulnerability. In Climate Change and World Food Security; Springer:Berlin/Heidelberg, Germany, 1996; pp. 115–159.
39. Solomon, S.; Qin, D.; Manning, M.; Averyt, K.; Marquis, M. Climate Change 2007-the Physical Science Basis:Working Group I Contribution to the Fourth Assessment Report of the IPCC; Cambridge University Press:Cambridge, UK, 2007; Volume 4.
40. Mitter, H.; Kirchner, M.; Schmid, E.; Schönhart, M. The participation of agricultural stakeholders in assessingregional vulnerability of cropland to soil water erosion in Austria. Reg. Environ. Chang. 2014, 14, 385–400.[CrossRef]
41. Berry, P.; Rounsevell, M.; Harrison, P.; Audsley, E. Assessing the vulnerability of agricultural land use andspecies to climate change and the role of policy in facilitating adaptation. Environ. Sci. Policy 2006, 9, 189–204.[CrossRef]
42. Fellmann, T. The assessment of climate change-related vulnerability in the agricultural sector: Reviewingconceptual frameworks. Build. Resil. Adapt. Clim. Chang. Agric. Sect. 2012, 23, 37.
43. Wu, H.; Qian, H.; Chen, J.; Huo, C. Assessment of agricultural drought vulnerability in the Guanzhong Plain,China. Water Resour. Manag. 2017, 31, 1557–1574. [CrossRef]
44. Wilhelmi, O.V.; Wilhite, D.A. Assessing vulnerability to agricultural drought: A Nebraska case study.Nat. Hazards 2002, 25, 37–58. [CrossRef]

Sustainability 2020, 12, 4771 23 of 24
45. Neset, T.-S.; Wiréhn, L.; Opach, T.; Glaas, E.; Linnér, B.-O. Evaluation of indicators for agricultural vulnerabilityto climate change: The case of Swedish agriculture. Ecol. Indic. 2019, 105, 571–580. [CrossRef]
46. Liang, L.; Ridoutt, B.G.; Wu, W.; Lal, R.; Wang, L.; Wang, Y.; Li, C.; Zhao, G. A multi-indicator assessment ofperi-urban agricultural production in Beijing, China. Ecol. Indic. 2019, 97, 350–362. [CrossRef]
47. Li, Y.; Xiong, W.; Hu, W.; Berry, P.; Ju, H.; Lin, E.; Wang, W.; Li, K.; Pan, J. Integrated assessment of China’sagricultural vulnerability to climate change: A multi-indicator approach. Clim. Chang. 2015, 128, 355–366.[CrossRef]
48. Pathiraja, E.; Griffith, G.; Farquharson, B.; Faggian, R. The Economic Cost of Climate Change and the Benefitsfrom Investments in Adaptation Options for Sri Lankan Coconut Value Chains. In Proceedings of theInternational European Forum, Innsbruck-Igls, Austria, 13–17 February 2017; pp. 460–485.
49. Fischer, G.; Shah, M.M.; Van Velthuizen, H. Climate Change and Agricultural Vulnerability; IIASA: Laxenburg,Austria, 2002.
50. Wiréhn, L.; Danielsson, Å.; Neset, T.-S.S. Assessment of composite index methods for agricultural vulnerabilityto climate change. J. Environ. Manag. 2015, 156, 70–80. [CrossRef]
51. Teshome, M. Rural households’ agricultural land vulnerability to climate change in Dembia woreda,Northwest Ethiopia. Environ. Syst. Res. 2016, 5, 14. [CrossRef]
52. Dwarakish, G.; Vinay, S.; Natesan, U.; Asano, T.; Kakinuma, T.; Venkataramana, K.; Pai, B.J.; Babita, M.Coastal vulnerability assessment of the future sea level rise in Udupi coastal zone of Karnataka state,west coast of India. Ocean Coast. Manag. 2009, 52, 467–478. [CrossRef]
53. Rani, N.S.; Satyanarayana, A.; Bhaskaran, P.K. Coastal vulnerability assessment studies over India: A review.Nat. Hazards 2015, 77, 405–428. [CrossRef]
54. Patnaik, U.; Narayanan, K. Vulnerability and Climate Change: An Analysis of the Eastern Coastal Districts of India;University Library of Munich: Munich, Germany, 2009.
55. Panda, A. Vulnerability to climate variability and drought among small and marginal farmers: A case studyin Odisha, India. Clim. Dev. 2017, 9, 605–617. [CrossRef]
56. Islam, M.A.; Shitangsu, P.K.; Hassan, M.Z. Agricultural vulnerability in Bangladesh to climate changeinduced sea level rise and options for adaptation: A study of a coastal Upazila. J. Agric. Environ. Int. Dev.(Jaeid) 2015, 109, 19–39.
57. Kumar, A.A.; Kunte, P.D. Coastal vulnerability assessment for Chennai, east coast of India using geospatialtechniques. Nat. Hazards 2012, 64, 853–872. [CrossRef]
58. Shukla, R.; Sachdeva, K.; Joshi, P. Inherent vulnerability of agricultural communities in Himalaya: Avillage-level hotspot analysis in the Uttarakhand state of India. Appl. Geogr. 2016, 74, 182–198. [CrossRef]
59. Smit, B.; Pilifosova, O.; Burton, I.; Challenger, B.; Huq, S.; Klein, R.; Yohe, G.; McCarthy, J.J.; Canziano, O.F.Adaptation and Vulnerability, Contribution of Working Group II to the Third Assessment Report of theIntergovernmental Panel on Climate Change: Adaptation to Climate Change in the Context of Sustainable Developmentand Equity; Cambridge University Press: Cambridge, UK, 2001; pp. 877–912.
60. Kantamaneni, K.; Phillips, M.; Thomas, T.; Jenkins, R. Assessing coastal vulnerability: Development of acombined physical and economic index. Ocean Coast. Manag. 2018, 158, 164–175. [CrossRef]
61. Kantamaneni, K.; Sudha Rani, N.; Rice, L.; Sur, K.; Thayaparan, M.; Kulatunga, U.; Rege, R.; Yenneti, K.;Campos, L.C. A systematic review of coastal vulnerability assessment studies along Andhra Pradesh, India:A critical evaluation of data gathering, risk levels and mitigation strategies. Water 2019, 11, 393. [CrossRef]
62. Krishna, V.K.R. Ground Water Brochure-Krishna District. Available online: http://cgwb.gov.in/District_Profile/AP/Krishna.pdf (accessed on 20 October 2019).
63. Vijayawada Municipal Corporation. District Profile. Available online: https://vijayawada.cdma.ap.gov.in/en/
district-profilehttps://vijayawada.cdma.ap.gov.in/en/district-profile (accessed on 8 July 2019).64. Directorate of Census Operations. Village Town Directory. Available online: http://censusindia.gov.in/
2011census/dchb/2816_PART_A_DCHB_KRISHNA.pdf (accessed on 22 October 2019).65. Kumar, S.J. Groundwater Brochure, Guntur District-Andhra Pradesh. Available online: http://cgwb.gov.in/
district_profile/ap/guntur.pdf (accessed on 12 August 2019).66. Rosegrant, M.W.; Ringler, C.; Zhu, T. Water for agriculture: Maintaining food security under growing scarcity.
Annu. Rev. Environ. Resour. 2009, 34, 205–222. [CrossRef]67. Atapattu, S.S.; Kodituwakku, D.C. Agriculture in South Asia and its implications on downstream health and
sustainability: A review. Agric. Water Manag. 2009, 96, 361–373. [CrossRef]

Sustainability 2020, 12, 4771 24 of 24
68. Dasgupta, S.; Hossain, M.M.; Huq, M.; Wheeler, D. Climate change and soil salinity: The case of coastalBangladesh. Ambio 2015, 44, 815–826. [CrossRef] [PubMed]
69. Lamboll, R.; Stathers, T.; Morton, J. Climate change and agricultural systems. In Agricultural Systems; Elsevier:Amsterdam, The Netherlands, 2017; pp. 441–490.
70. Masutomi, Y.; Takahashi, K.; Harasawa, H.; Matsuoka, Y. Impact assessment of climate change on riceproduction in Asia in comprehensive consideration of process/parameter uncertainty in general circulationmodels. Agric. Ecosyst. Environ. 2009, 131, 281–291. [CrossRef]
71. Rao, K.N.; Subraelu, P.; Kumar, K.C.V.N.; Demudu, G.; Malini, B.H.; Ratheesh, R.; Rajawat, A. Climate changeand sea-level rise: Impact on agriculture along Andhra Pradesh coast—A geomatics analysis. J. Indian Soc.Remote Sens. 2011, 39, 415–422.
72. Greeshma, R.; Bhave, M.; Kumar, P.S. Application of growth models for area, production and productivitytrends of sugarcane crop for coastal Andhra region of Andhra Pradesh. Int. J. Agric. Sci. Res. 2017, 7, 7–14.
73. Malathi, M.; Rajakumari, S. Review of depleting coastal resource areas in GODAVARI delta upon humaninterventions, Andhra Pradesh. J. Coast. Conserv. 2019, 23, 543–551. [CrossRef]
74. Ray, K.; Arora, K.; Srivastav, A. Weather Extremes and Agriculture. In Proceedings of the InternationalArchives of the Photogrammetry, Remote Sensing & Spatial Information Sciences, Volume XLII-3/W6,ISPRS-GEOGLAM-ISRS Joint Int. Workshop on “Earth Observations for Agricultural Monitoring”,New Delhi, India, 18–20 February 2019.
75. Das, H.P. Agrometeorological impact assessment of natural disasters and extreme events and agriculturalstrategies adopted in areas with high weather risks. In Natural Disasters and Extreme Events in Agriculture;Springer: Berlin/Heidelberg, Germany, 2005; pp. 93–118.
76. Sivakumar, M.V.; Motha, R.P.; Das, H.P. Natural Disaster and Extreme Events in Agriculture; Springer:Berlin/Heidelberg, Germany, 2005; Volume 376.
77. Riebau, A.R.; Fox, D.G. Damage assessment of agrometeorological relevance from natural disasters: Economicand social consequences. In Natural Disasters and Extreme Events in Agriculture; Springer: Berlin/Heidelberg,Germany, 2005; pp. 119–135.
78. Falco, S.D.; Adinolfi, F.; Bozzola, M.; Capitanio, F. Crop insurance as a strategy for adapting to climate change.J. Agric. Econ. 2014, 65, 485–504. [CrossRef]
79. Mcleman, R.; Smit, B. Vulnerability to climate change hazards and risks: Crop and flood insurance.Can. Geogr./Le Géographe Can. 2006, 50, 217–226. [CrossRef]
80. Naab, F.Z.; Dinye, R.D.; Kasanga, R.K. Urbanisation and its impact on agricultural lands in growing cities indeveloping countries: A case study of Tamale in Ghana. Mod. Soc. Sci. J. 2013, 2, 256–287.
81. PRS Legislative Research. State of Agriculture in India. Available online: https://prsindia.org/policy/
discussion-papers/state-agriculture-india (accessed on 5 June 2020).
© 2020 by the authors. Licensee MDPI, Basel, Switzerland. This article is an open accessarticle distributed under the terms and conditions of the Creative Commons Attribution(CC BY) license (http://creativecommons.org/licenses/by/4.0/).