Embed Size (px)
Citation preview
Assessing the relationship between city growth and electricity use over time: A comparative analysis of Chandigarh and Seattle
Reid R. Haefer
A thesis submitted in partial fulfillment of the requirements for the degree of
Master of Urban Planning
University of Washington 2014
Chair of the Supervisory Committee: Manish Chalana Committee Member: Jan Whittington
Program Authorized to Offer Degree: Urban Design & Planning
University of Washington
Abstract
Assessing the relationship between city growth and electricity use over time:!
A comparative analysis of Chandigarh and Seattle
Reid R. Haefer
Chair of the Supervisory Committee: Manish Chalana Committee Member: Jan Whittington
Department of Urban Design and Planning
Urbanization in developing countries will be one of several global processes that define the 21st century. The ramifications of hundreds of millions of rural citizens transitioning to urban lifestyles are multifold and highly uncertain. The state of the global climate is one particularly dubious outcome of this process, due to the expected rises in energy consumption that accompany urbanization. Still, the subsequent socioenvironmental impacts of 21st century urbanization are reliant upon decisions made by planners and policy-makers at the local level regarding the characteristics of both growing cities and newly created ones. This thesis attempts to engender a better understanding of the relationship between common characteristics of cities and their resulting energy consumption by comparing two cities from distinct contexts. I employ a longitudinal, mixed-methods approach to analyze data for Seattle in the United States and Chandigarh in India to discern similarities and differences between both cities regarding population size, density, urban form, electricity consumption, and climate over time. In contrast to a strictly quantitative approach, I employed a mixed method research design in order to take advantage of qualitative data obtained through field observations in both cities. The result is a thorough assessment of the relationship between city growth and energy use among two cities characterized by dissimilar geographical and socioeconomic settings. The analysis and discussion yielded several notable findings. In both cities the residential sector is the predominant categorical user of electricity, though recent growth trajectories differ. The urbanization process that is currently occurring in Chandigarh appears quite unique compared to what has ever occurred in Seattle. Climate change will impact electricity use in each city but the outcomes will differ due to geographical differences. It is possible and useful to compared seemingly matchless cities, though there are numerous methodological impediments to such a process. These findings indicate the need for mixed method research approaches that bolster quantitative analysis and contribute to a unified science of urbanization.
TABLE OF CONTENTS
List of Figures ............................................................................................................................ i
1.Introduction .......................................................................................................................... 1
Summary......................................................................................................................... 5
2. Literature Review................................................................................................................... 6
� 'HQVLW\�DQG�8UEDQ�)RUP������������������������������������������������������������������������������������������������� Access to Electricity...................................................................................................... 11
Economics...................................................................................................................... 12
Climate Change............................................................................................................. 13
Urbanization Theory..................................................................................................... 14
� 6XPPDU\�����������������������������������������������������������������������������������������������������������������������������3. Methodology.......................................................................................................................... 18
Case Studies................................................................................................................... 18
Variables........................................................................................................................ 19
� &KDQGLJDUK�'DWD��������������������������������������������������������������������������������������������������������������� 6HDWWOH�'DWD����������������������������������������������������������������������������������������������������������������������� Analytic Plan................................................................................................................. 23
Summary........................................................................................................................ 24
4. Analysis.................................................................................................................................. 25
Case Study #1: Chandigarh......................................................................................... 25
History................................................................................................................ 25
� � 3ODQQLQJ��*URZWK���'HQVLW\����������������������������������������������������������������������������� Electricity Consumption.................................................................................. 29
Infrastructure..................................................................................................... 30
Land Use........................................................................................................... 32
Household Behavior......................................................................................... 33
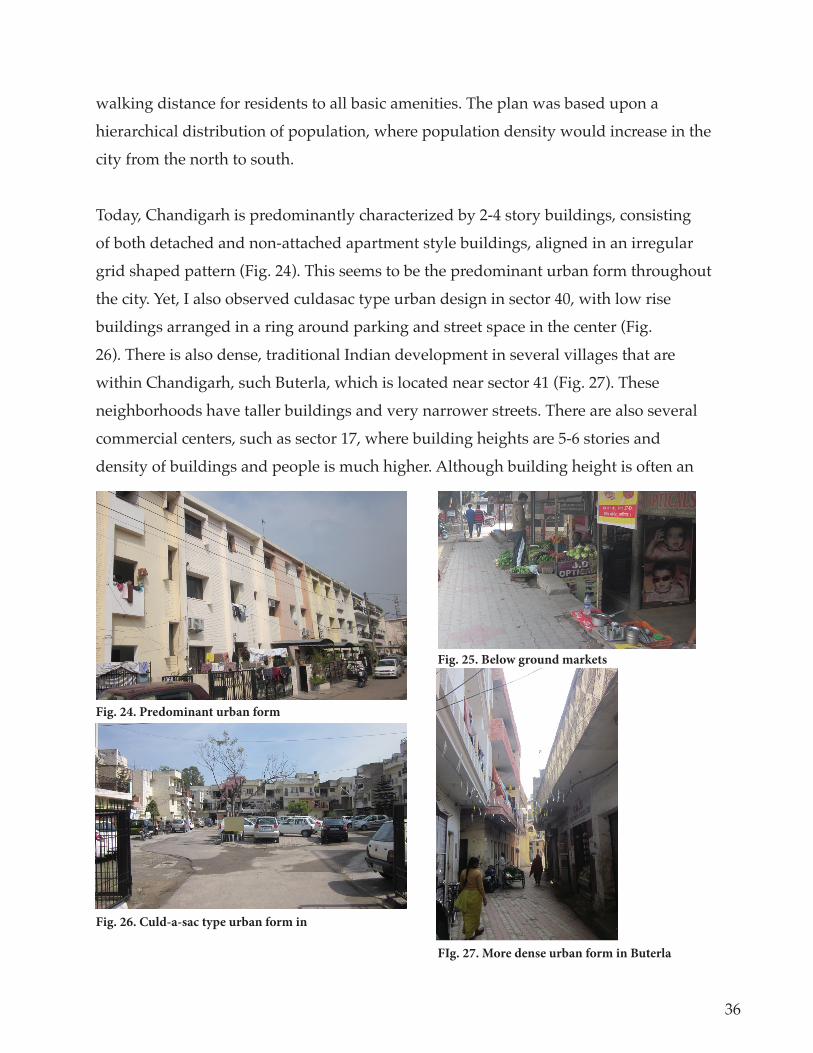
Urban form........................................................................................................ 35
� � &OLPDWH������������������������������������������������������������������������������������������������������������������ Case Study #2: Seattle.................................................................................................. 38

History............................................................................................................... 38
� � 3ODQQLQJ��*URZWK���'HQVLW\���������������������������������������������������������������������������� Electricity Consumption................................................................................. 42
Urban Form...................................................................................................... 44
Land Use........................................................................................................... 45
Climate.............................................................................................................. 46
� &DVH�6WXG\�&RPSDULVRQ������������������������������������������������������������������������������������������������� � 3RSXODWLRQ��'HQVLW\����������������������������������������������������������������������������������������� Electricity........................................................................................................... 50
Comparison Summary ................................................................................... 51
���'LVFXVVLRQ�������������������������������������������������������������������������������������������������������������������������������� Introduction.................................................................................................................. 54
Energy growth patterns.............................................................................................. 54
� 6L]H�DQG�HFLHQF\���������������������������������������������������������������������������������������������������������� Climate change............................................................................................................ 58
Urbanization Theory................................................................................................... 61
���5HÁHFWLRQV�������������������������������������������������������������������������������������������������������������������������������� 'DWD�$FTXLVLWLRQ������������������������������������������������������������������������������������������������������������� 'DWD�3URFHVVLQJ�������������������������������������������������������������������������������������������������������������� Anecdotes.................................................................................................................... 68
� /LPLWDWLRQV����������������������������������������������������������������������������������������������������������������������� 6XPPDU\����������������������������������������������������������������������������������������������������������������������������&RQFOXVLRQ������������������������������������������������������������������������������������������������������������������������������� )LQGLQJV���������������������������������������������������������������������������������������������������������������������������� )XWXUH�UHVHDUFK���������������������������������������������������������������������������������������������������������������� 6XPPDU\����������������������������������������������������������������������������������������������������������������������������5HIHUHQFHV�������������������������������������������������������������������������������������������������������������������������������
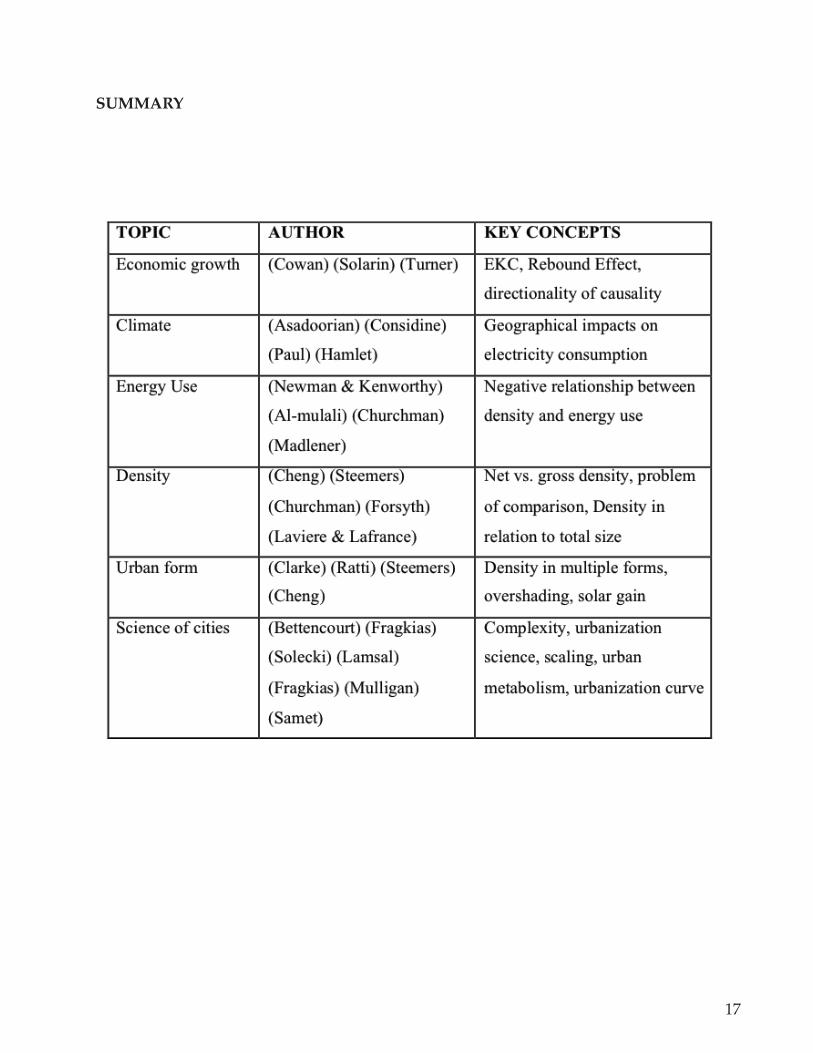
LIST OF FIGURES
i
Fig. 3. Theoretical relationship between electricity use and population density................................................. 4
Fig. 5. Density and energy consumption.............................................................................................................. 7Fig. 6. Density in Different Urban Forms............................................................................................................ 10Fig. 7. Context Map of Chandigarh..................................................................................................................... 25
Fig. 9. Chandigarh Total Population (1990-2010).............................................................................................. 28Fig. 10. Chandigarh Population Density (1960-2010)........................................................................................ 28
Fig. 8. Chandigarh Sectoral Population Density Maps (1961-2001) ................................................................. 27
Fig. 11. Chandigarh Per Capita Electricity Use................................................................................................... 29Fig. 12. Chandigarh Total Electricity Use............................................................................................................ 29Fig. 13. Chandigarh Total Electricity Use by Sector............................................................................................ 30
Fig. 19. Chandigarh Open Space Map................................................................................................................. 33Fig. 20. Chandigarh Per Capita Income (1994-2011)......................................................................................... 34
Fig. 28. Chandigarh Average Temperature (1982-2009).................................................................................... 37Fig. 29. Seattle Context Map............................................................................................................................... 38Fig. 30. Seattle Residential Construction (1921-1940)...................................................................................... 39Fig. 31. Seattle Total Population (1990-2010).................................................................................................... 39Fig. 32. Seattle Population Density (1990-2010)................................................................................................ 39Fig. 33. Seattle Population Density Maps Over Time........................................................................................ 41
Fig. 37. Seattle Total Electricity Consumption ................................................................................................. 43
Fig. 18. Chandigarh Land Use Composition (2000)........................................................................................... 32
Fig. 4. Theoretical relationship between temperature and electricity use........................................................... 4
Fig. 2. World Energy Consumption, 1990-2040................................................................................................... 1Fig. 1. Global urban and rural growth.................................................................................................................. 1
Fig. 23. Initial Plan of Chandigarh Map ............................................................................................................. 35
Fig. 35. Electricity Sales (1939-1950)................................................................................................................. 42Fig. 34. Installed Electric Ranges (1922-1930).................................................................................................. 42
Fig. 36. Seattle Units With Central Heating (1940)........................................................................................... 42
Fig. 16. Electricity Distribution........................................................................................................................... 31Fig. 15. Makeshift electricity connections........................................................................................................... 31Fig. 14. Daytime streetlights................................................................................................................................ 31
Fig. 17. Greenbelt in Chandigarh........................................................................................................................ 32
Fig. 21. Residential celebration........................................................................................................................... 34Fig. 22. Residential clothes drying...................................................................................................................... 34
Fig. 25. Below ground markets........................................................................................................................... 36
FIg. 27. More dense urban form in Buterla........................................................................................................ 36Fig. 26. Culd-a-sac type urban form in sector 40............................................................................................... 36
Fig. 24. Predominant urban form....................................................................................................................... 36

Fig. 48. Population densities of cities around the world................................................................................... 49Fig. 49. Per Capita Electricity Use Comparison................................................................................................ 50Fig. 50. Total Electricity Use Comparison......................................................................................................... 50Fig. 51. Annual Growth in Per Capita Electricity Use Comparison................................................................. 51Fig. 52. Chandigarh Income and Electricity Consumption ............................................................................. 54Fig. 53. Seattle Temperature Patterns................................................................................................................ 59Fig. 54. Seattle and Chandigarh on the Urbanization Curve ........................................................................... 61
i
Fig. 38. Seattle Per Capita Electricity Consumption ........................................................................................ 43Fig. 39. Seattle Total Residential & Non-residential Electricity Use................................................................. 43Fig. 40. Seattle Housing Types (2000)................................................................................................................ 45Fig. 41. Seattle Land Use Composition (2003).................................................................................................. 45Fig. 42. Seattle Average Temperatures (1982-2009).......................................................................................... 46Fig. 43. Global Context Map.............................................................................................................................. 47
Fig. 45. Total Population Comparison.............................................................................................................. 48Fig. 46. Decadal Population Growth Comparison............................................................................................ 48Fig. 47. Population Density Comparison.......................................................................................................... 49
Fig. 44. Present Day Quantitative Characteristics............................................................................................ 47
1
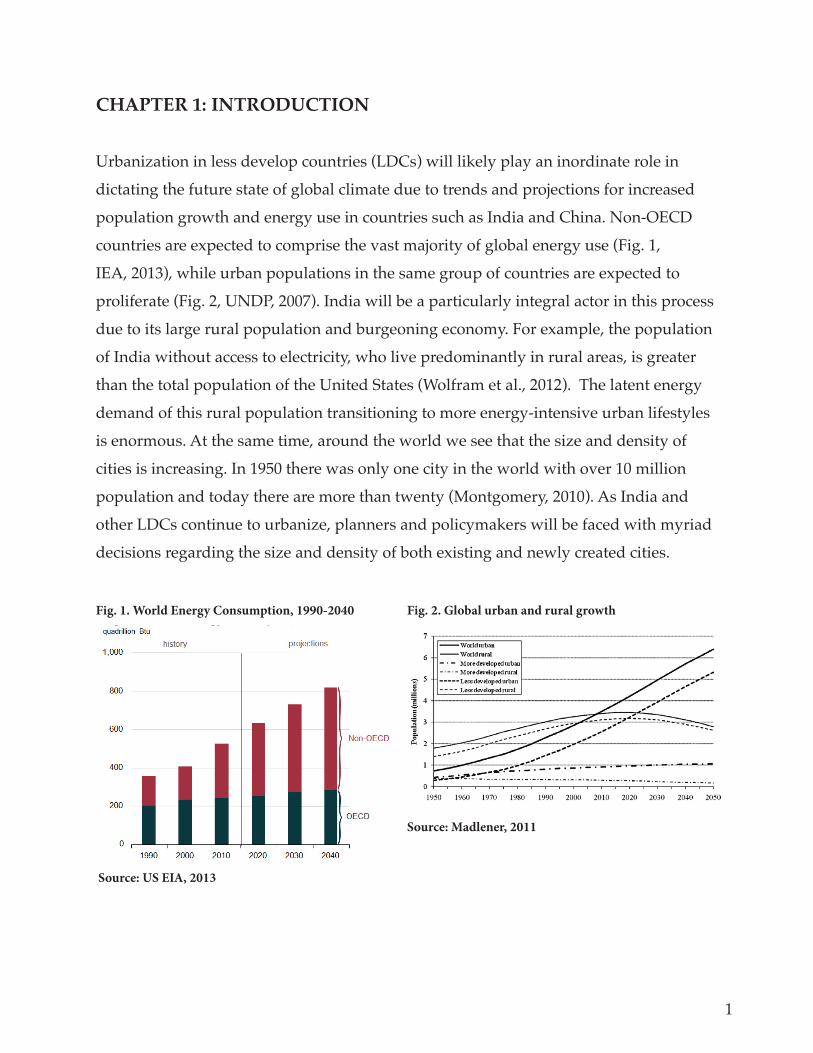
CHAPTER 1: INTRODUCTION
8UEDQL]DWLRQ�LQ�OHVV�GHYHORS�FRXQWULHV��/'&V��ZLOO�OLNHO\�SOD\�DQ�LQRUGLQDWH�UROH�LQ�dictating the future state of global climate due to trends and projections for increased
SRSXODWLRQ�JURZWK�DQG�HQHUJ\�XVH�LQ�FRXQWULHV�VXFK�DV�,QGLD�DQG�&KLQD��1RQ�2(&'�countries are expected to comprise the vast majority of global energy use (Fig. 1,
,($���������ZKLOH�XUEDQ�SRSXODWLRQV�LQ�WKH�VDPH�JURXS�RI�FRXQWULHV�DUH�H[SHFWHG�WR�SUROLIHUDWH��)LJ�����81'3���������,QGLD�ZLOO�EH�D�SDUWLFXODUO\�LQWHJUDO�DFWRU�LQ�WKLV�SURFHVV�due to its large rural population and burgeoning economy. For example, the population
of India without access to electricity, who live predominantly in rural areas, is greater
WKDQ�WKH�WRWDO�SRSXODWLRQ�RI�WKH�8QLWHG�6WDWHV��:ROIUDP�HW�DO�����������7KH�ODWHQW�HQHUJ\�demand of this rural population transitioning to more energy-intensive urban lifestyles
is enormous. At the same time, around the world we see that the size and density of
cities is increasing. In 1950 there was only one city in the world with over 10 million
SRSXODWLRQ�DQG�WRGD\�WKHUH�DUH�PRUH�WKDQ�WZHQW\��0RQWJRPHU\���������$V�,QGLD�DQG�RWKHU�/'&V�FRQWLQXH�WR�XUEDQL]H��SODQQHUV�DQG�SROLF\PDNHUV�ZLOO�EH�IDFHG�ZLWK�P\ULDG�decisions regarding the size and density of both existing and newly created cities.
Source: US EIA, 2013
Fig. 1. World Energy Consumption, 1990-2040
Source: Madlener, 2011
Fig. 2. Global urban and rural growth
2
The size and density of cities is ostensibly relevant from an environmental perspective
EHFDXVH�RI�LPSDFWV�RQ�JOREDO�FOLPDWH�FKDQJH��&LW\�VL]H�LQÁXHQFHV�HQHUJ\�FRQVXPSWLRQ���thus contributing to global climate change and general environmental conditions.
“If energy consumption of cities in Asia or Africa increases to the level of the energy consumption of Northern American cities under today’s conditions �H�J��ZLWK�UHJDUG�WR�WKH�IXHO�PL[���DQ�HFRORJLFDO�FROODSVH�ZLOO�LQHYLWDEO\�EH�WKH�FRQVHTXHQFHVµ��0XOOLJDQ���������
At the same time, there is an ostensibly humanitarian importance attributed to the size
of cities. As urbanization unfolds, city size will increasingly be connected to social
equity and the plight of the urban poor.
“We now face a very uncertain outcome where numerous megacities—each having more than 10 million residents—will increasingly dominate the global urban landscape and control the shape of international public and corporate relationships. Inside many of these megacities, especially in Asia and Africa, the living conditions for millions of inhabitants will continue to be very miserable by WKH�VWDQGDUGV�RI�WKH�PRUH�GHYHORSHG�QDWLRQV�µ��,ELG��
Moreover, if energy demand in India follows previous patterns demonstrated by
countries such as the U.S., then global temperatures may rise by more than 2° C, likely
LQGXFLQJ�D�YDULHW\�RI�VLJQLÀFDQW�JOREDO�FKDOOHQJHV��,($���������7KHUHIRUH��WKH�8�6��DQG�RWKHU�PRUH�GHYHORSHG�FRXQWULHV��0'&V��KDYH�D�VWDNH�LQ�KRZ�,QGLD�XUEDQL]HV�because of the resulting challenges that they themselves may experience. For example,
hydroelectric power generation in Washington State, which depends upon snowpack,
may be impacted by energy use in India because greenhouse gas emitting coal
power contributes to rising global temperatures. The corollary is decreased or altered
VQRZSDFN��UHVXOWLQJ�LQ�FKDQJHV�LQ�ULYHU�ÁRZ�DQG�K\GURHOHFWULFLW\�SURGXFWLRQ��+DPOHW���������$OWKRXJK�IXWXUH�HQHUJ\�GHPDQG�LV�FOHDUO\�LQ�WKH�KDQGV�RI�/'&V��WKH�HQWLUH�international community will feel the subsequent climate impacts, with certain places
experiencing these consequences more severely than others.
Therefore, it is important for knowledge and experiences to be shared across borders. If
urbanization is viewed as a chronological process, then the US, who is 80 percent urban,

3
is amongst a more mature stage of the process, while India, which is only 30 percent
XUEDQ��PD\�EH�MXVW�VWDUWLQJ�WKDW�SURFHVV��8QLWHG�1DWLRQV���������,W�KDV�EHHQ�WKHRUL]HG�that urbanization in all cities follows an S or J shaped curve, where the growth of urban
SRSXODWLRQV�FKDQJH�DW�GLͿHUHQW�UDWHV�RYHU�WLPH��0XOOLJDQ���������%DVHG�XSRQ�VXFK�theories, there may be ways in which cities in the US can provide insight or guidance
into what is currently occurring in Indian cities.
My research question aims to explore challenges and opportunities in the energy-
XUEDQL]DWLRQ�ÀHOG�E\�DVVHVVLQJ�WKH�SRWHQWLDO�IRU�FRPSDULVRQ�DQG�NQRZOHGJH�WUDQVIHU��,�focus my research on two cities: Seattle, Washington and Chandigarh, India. Through
FRPSDULQJ�WKHVH�FLWLHV�,�DWWHPSW�WR�GLVFRYHU�WKH�IROORZLQJ�����+RZ�FDQ�FRPSDULQJ�FLWLHV�contribute to a shared understanding of the relationship between city size and energy
XVH�DPLG�D�FKDQJLQJ�FOLPDWH"�����$UH�WKHUH�JHQHULF�SDWWHUQV�WKDW�FDQ�EH�REVHUYHG�LQ�VHHPLQJO\�GLVVLPLODU�FLWLHV"��DQG����:KDW�PHWKRGRORJLFDO�DSSURDFKHV�DUH�XVHIXO�IRU�developing a theory of all cities in space and time?
In order to investigate these questions, I hypothesize that as cities become bigger
and warmer, their electricity use will rise as well. Moreover, I hypothesize that this
relationship between city size, temperature, and electricity consumption over time in
6HDWWOH��:DVKLQJWRQ�DQG�&KDQGLJDUK��,QGLD�LV�IXQGDPHQWDOO\�GLͿHUHQW��,�LQWHQG�WR�VKHG�light onto the evolution of urbanization and energy as a process by looking at two cities
LQ�GLͿHUHQW�VWDJHV�RI�GHYHORSPHQW�LQ�RUGHU�WR�KHOS�XQGHUVWDQG�ZKDW�PD\�RFFXU�LQ�,QGLD�in the future.
Additionally, I hypothesize the existence of thresholds, where the impact of urban
density and size eventually ceases to contribute to increased energy savings or
HFLHQFLHV��)LJ������:KLOH�ODUJHU��GHQVHU�FLWLHV�H[SHULHQFH�HQHUJ\�HFLHQFLHV�IRU�VHYHUDO�reasons, I imagine that there may come a point when they experience diminishing
returns as size and density continue to increase. This theory attempts to assess whether
WKHUH�PD\�EH�DQ�LGHDO�UDQJH�RI�FLW\�VL]HV�LQ�WHUPV�RI�HQHUJ\�HFLHQF\��3UHYLRXV�UHVHDUFK�on urban metabolism uses a biological analogy to infer that larger urban agglomerations

4
DUH�PRUH�H��FLHQW�WKDQ�VPDOOHU�RQHV��+RZHYHU��,�VXVSHFW�WKDW�WKLV�DQDORJ\�LV�LQVX��FLHQW�DQG�HQHUJ\�H��FLHQF\�PD\�GHFUHDVH�RQFH�D�FLW\�EHFRPHV�particularly immense.
,�DOVR�H[SHFW�WR�À�QG�D�SRVLWLYH�UHODWLRQVKLS�between higher temperatures and increased
electricity use because of the need for increased
electricity to cool buildings as temperatures
rise. In certain cases, if the fuel used to generate
electricity contributes to a warming climate (ie
IRVVLO�IXHOV���WKHQ�WKH�UHVXOW�PD\�EH�D�SRVLWLYH�feedback loop, leading to exponential growth in
HOHFWULFLW\�XVH�DQG�WHPSHUDWXUH��)LJ������(OHFWULFLW\�generation and use begets higher temperatures
due to climate change and high temperature
begets increased electricity use needed to cool
buildings. Yet, this relationship will likely be
GLͿ�HUHQW�LQ�6HDWWOH�DQG�&KDQGLJDUK�EHFDXVH�RI�GLͿ�HUHQFHV�LQ�DYHUDJH�WHPSHUDWXUHV�EHWZHHQ�WKH�two cities.
,Q�JHQHUDO��,�H[SHFW�WR�À�QG�ERWK�IXQGDPHQWDO�GLͿ�HUHQFHV�DQG�VLPLODULWLHV�EHWZHHQ�WKH�relationship between population growth and energy use in Chandigarh and Seattle.
Even if I control for certain variables, such as income or energy supply, there are likely
D�UDQJH�RI�RWKHU�FRUH�GLͿ�HUHQFHV�EHWZHHQ�WKH�WZR�FLWLHV�WKDW�ZLOO�LQÁ�XHQFH�HOHFWULFLW\�usage in dissimilar ways. At the same time, I theorize that there may be aspects of
electricity consumption that are similar between them, due to characteristics that are
inherent to nearly all cities and urbanization processes. This last theory pertains to an
ancillary purpose of this paper, which is to assist in the development of a science of
cities, which coalesces the myriad processes and disciplines that comprise urbanization,
Fig. 4. Th eoretical relationship between temperature and electricity use
Fig. 3. Th eoretical relationship between electricity use and population density
5
LQWR�D�GLVWLQFW�WKHRU\�DQG�PHWKRGRORJ\��6ROHFNL���������:KLOH�PXFK�UHFHQW�UHVHDUFK�RQ�this topic takes a quantitative approach, in this paper I use utilize a mixed methods
approach, which presents quantitative data in conjuction with observations obtained
IURP�ÀHOG�UHVHDUFK��7KH�UHVXOW�LV�D�PRUH�QXDQFHG�DVVHVVPHQW�RI�HQHUJ\�JURZWK�SDWWHUQV�LQ�HDFK�FLW\��ZKLFK�EHQHÀWV�ERWK�WKHRU\�DQG�SURYLGHV�SUDFWLFDO�OHVVRQV�IRU�SODQQHUV�and policy makers. Assessing how cities have grown and used energy in the past will
help us better understand what may occur in the future, as well as help guide planning
decisions today. As global climate change and demographic growth unfold, such
research is necessary to engender the development of cities that are sustainable in the
most fundamental way; they consume energy resources in a manner that will allow
future generations to do the same.
SUMMARY
)ROORZLQJ�WKH�LQWURGXFWLRQ��WKLV�SDSHU�KDV�ÀYH�SDUWV��&KDSWHU���SURYLGHV�D�VXPPDU\�of previous literature on this subject. For instance, existing research generally
indicates a negative relationship between population density and energy use but
a positive relationship between total population and energy use. Additionally, as
climate change unfolds, there are indications that higher temperatures may alter
energy use in cities, with changes in the need for heating and cooling electricity in
buildings. Chapter 3 outlines the methodology of this thesis, in which I employed a
mixed methods approach, combining non-experimental and comparative research
WR�WHVW�WKH�K\SRWKHVHV��0RUH�VSHFLÀFDOO\��,�WDNH�D�FDVH�VWXG\�DSSURDFK�WR�LQYHVWLJDWH�WKH�HQXPHUDWHG�UHVHDUFK�TXHVWLRQV��0HWKRGRORJLFDOO\��,�ÀUVW�DQDO\]H�HQHUJ\�JURZWK�patterns over time in Chandigarh, India and Seattle, Washington separately and then
FRPSDUH�WKH�ÀQGLQJV�DJDLQVW�HDFK�RWKHU��&KDSWHU���SUHVHQWV�DQ�DQDO\VLV�RI�WKH�GDWD�WKDW�were gathered. I utilize descriptive statistics to analyze both quantitative and qualitative
data that I gathered from various governmental administrative bodies and acquired
from other research resources. Chapter 5 discusses the analytical outcomes and places
the results in relation to previous theory and literature. Chapter 6 concludes the paper
E\�VXPPDUL]LQJ�WKH�NH\�ÀQGLQJV��OLPLWDWLRQV��DQG�IXWXUH�UHVHDUFK��
6
CHAPTER 2: LITERATURE REVIEW
This chapter explores existing research on the relationship between energy use and
city growth over time among cities of distinct origins. Subsections include density,
urban form, access to electricity, economics, climate change, and urbanization science &
evolution.
DENSITY & URBAN FORM
The initial challenge of assessing the relationship between city size and electricity
FRQVXPSWLRQ�LV�GHFLGLQJ�XSRQ�KRZ�WR�GHÀQH�GHQVLW\���7KHUH�DUH�D�YDULHW\�RI�GHQVLW\�measures that are based upon the ratio of people to buildings, people to area, and
EXLOGLQJV�WR�DUHD��0RUHRYHU��WKHVH�GHÀQLWLRQV�GLͿHU�WKURXJKRXW�WKH�ZRUOG��,Q�WHUPV�RI�buildings, net density often includes only the parcel or excludes certain uses, while site
coverage is simply the ratio of the building footprint to the total parcel area (Forsythe,
�������<HW��GXH�WR�GLͿHULQJ�GHÀQLWLRQV�DURXQG�WKH�ZRUOG��WKHUH�LV�QR�FRQVHQVXV�UHJDUGLQJ�WKH�GHÀQLWLRQ�RI�QHW�YHUVXV�JURVV�GHQVLW\��&KHQJ��������&KXUFKPDQ���������$QRWKHU�GHQVLW\�PHDVXUH�LV�)ORRU�$UHD�5DWLR��)$5���RU�SORW�UDWLR��ZKLFK�LV�GHÀQHG�DV�WKH�EXLOW�ÁRRU�DUHD�RQ�DOO�ÁRRUV�LQ�D�EXLOGLQJ��GLYLGHG�E\�WKH�SORW�DUHD��)$5�LV�RIWHQ�FRQVLGHUHG�WKH�PRVW�XQDPELJXRXV�PHDVXUH�RI�GHQVLW\��)RUV\WK���������2WKHUV�DUJXH�that we should examine spot densities rather than average densities to achieve a better
understanding of how density is actually manifested at the street level (Churchman,
�������,Q�WKH�86��ORZ�GHQVLW\�LV�FRPPRQO\�FKDUDFWHUL]HG�DV�������GZHOOLQJV�SHU�KHFWUH��'3+���PHGLXP�GHQVLW\�DV�������'3+��DQG�KLJK�GHQVLW\�DV�RYHU�����'3+��&KHQJ���������,Q�WKH�86��XUEDQ�LV�GHÀQHG�DV�FHQVXV�EORFNV�WKDW�KDYH�SRSXODWLRQ�GHQVLW\�RI�DW�OHDVW�����people per square mile or surrounding census blocks with an overall density of at least
����SHRSOH�SHU�VTXDUH�PLOH��<RXQJ���������,W�LV�DOVR�XVHIXO�WR�XQGHUVWDQG�WKH�UDQJH�RI�density levels currently present in regions around the world. At 439 people per square
mile, the Netherlands is the most densely populated country in Europe (Churchman,
�������7UDQVLW�RULHQWHG�GHYHORSPHQW��72'��KDV�EHHQ�GHÀQHG�DV����'3+��ZLWK��������XQLWV�SHU�KHFWDUH�IRU�XS�WR�WKUHH�VWRU\�DSDUWPHQW�EXLOGLQJV��&KXUFKPDQ���������
�
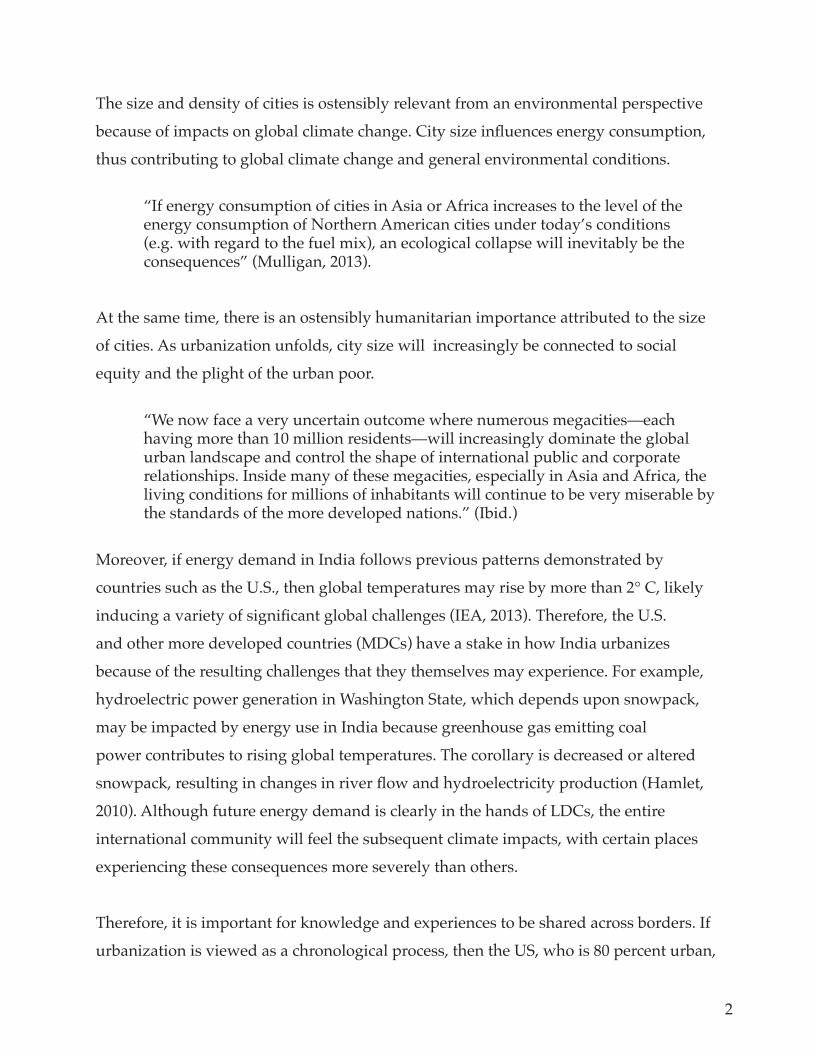
A plethora of studies have looked at the relationship between energy use and
population growth over time by employing energy quite broadly and aggregating
DOO�IXHO�W\SHV�LQWR�RQH�YDULDEOH��$O�PXODOL�HW�DO���������7KXV��WKHVH�VWXGLHV�LQFRUSRUDWH�WUDQVSRUWDWLRQ�HQHUJ\�XVH�LQWR�WKHLU�PRGHO�DQG�JHQHUDOO\�ÀQG�D�QHJDWLYH�UHODWLRQVKLS�EHWZHHQ�SRSXODWLRQ�GHQVLW\�DQG�HQHUJ\�XVH��1HZPDQ��.HQZRUWK\���������0RUH�SHRSOH�LQ�D�GHÀQHG�VSDFH�OHDGV�WR�LQFUHDVHG�HFRQRPLF�DFWLYLW\�LQ�WKRVH�DUHDV��WKXV�reducing the distance and required energy for people to travel to work and for the
exchange of goods. Increased density also increases the viability of mass transportation,
ZKLFK�XVHV�HQHUJ\�PRUH�HFLHQWO\�WKDQ�WKH�SHUVRQDO�DXWRPRELOH��)RU�LQVWDQFH��population densities above 30 persons per hectare have been shown to increase the use
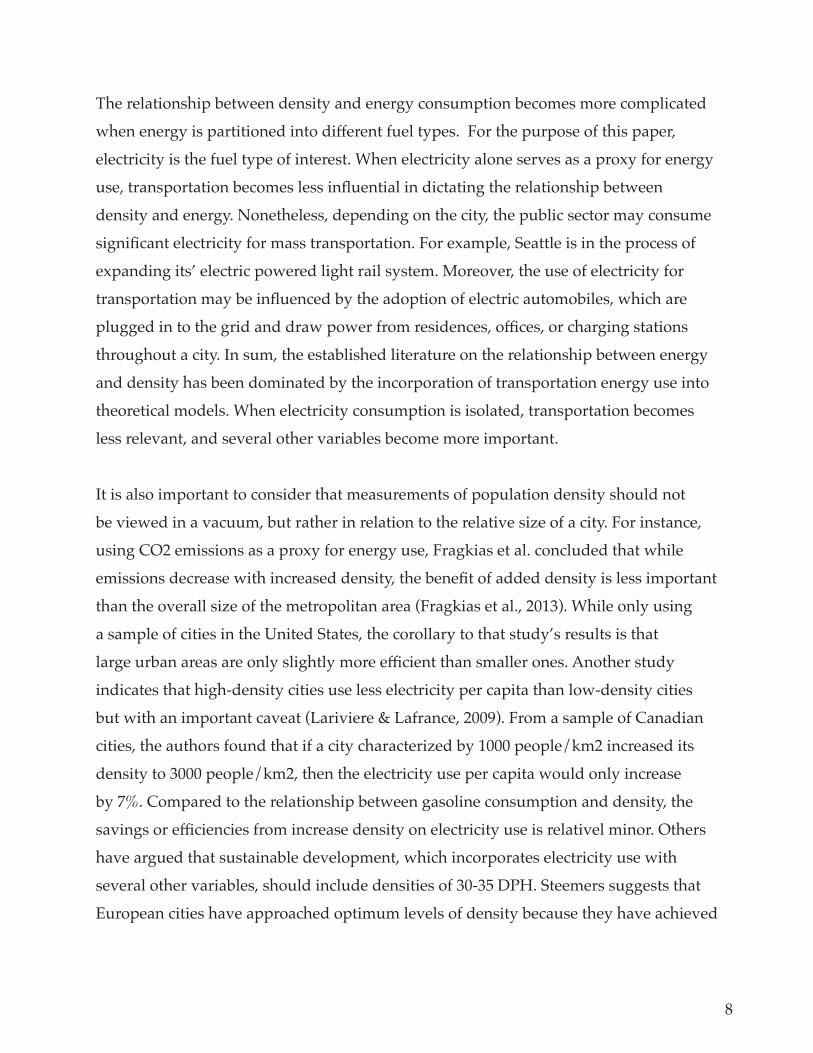
RI�SXEOLF�WUDQVSRUWDWLRQ��&KXUFKPDQ����������,Q�VXP��WKH�UXOH�RI�WKXPE�LV�D�QHJDWLYH�relationship between density and energy consumption; as the quantity of people in a
GHÀQHG�VSDFH�LQFUHDVHV��WKH�WRWDO�DPRXQW�RI�HQHUJ\�FRQVXPHG�ZLOO�GHFUHDVH��)LJ�����Fig. 5. Density and energy consumption
Source: Newman and Kenworthy, 1999
8
The relationship between density and energy consumption becomes more complicated
ZKHQ�HQHUJ\�LV�SDUWLWLRQHG�LQWR�GLͿHUHQW�IXHO�W\SHV���)RU�WKH�SXUSRVH�RI�WKLV�SDSHU��electricity is the fuel type of interest. When electricity alone serves as a proxy for energy
XVH��WUDQVSRUWDWLRQ�EHFRPHV�OHVV�LQÁXHQWLDO�LQ�GLFWDWLQJ�WKH�UHODWLRQVKLS�EHWZHHQ�density and energy. Nonetheless, depending on the city, the public sector may consume
VLJQLÀFDQW�HOHFWULFLW\�IRU�PDVV�WUDQVSRUWDWLRQ��)RU�H[DPSOH��6HDWWOH�LV�LQ�WKH�SURFHVV�RI�expanding its’ electric powered light rail system. Moreover, the use of electricity for
WUDQVSRUWDWLRQ�PD\�EH�LQÁXHQFHG�E\�WKH�DGRSWLRQ�RI�HOHFWULF�DXWRPRELOHV��ZKLFK�DUH�SOXJJHG�LQ�WR�WKH�JULG�DQG�GUDZ�SRZHU�IURP�UHVLGHQFHV��RFHV��RU�FKDUJLQJ�VWDWLRQV�throughout a city. In sum, the established literature on the relationship between energy
and density has been dominated by the incorporation of transportation energy use into
theoretical models. When electricity consumption is isolated, transportation becomes
less relevant, and several other variables become more important.
It is also important to consider that measurements of population density should not
be viewed in a vacuum, but rather in relation to the relative size of a city. For instance,
using CO2 emissions as a proxy for energy use, Fragkias et al. concluded that while
HPLVVLRQV�GHFUHDVH�ZLWK�LQFUHDVHG�GHQVLW\��WKH�EHQHÀW�RI�DGGHG�GHQVLW\�LV�OHVV�LPSRUWDQW�WKDQ�WKH�RYHUDOO�VL]H�RI�WKH�PHWURSROLWDQ�DUHD��)UDJNLDV�HW�DO����������:KLOH�RQO\�XVLQJ�a sample of cities in the United States, the corollary to that study’s results is that
ODUJH�XUEDQ�DUHDV�DUH�RQO\�VOLJKWO\�PRUH�HFLHQW�WKDQ�VPDOOHU�RQHV��$QRWKHU�VWXG\�indicates that high-density cities use less electricity per capita than low-density cities
EXW�ZLWK�DQ�LPSRUWDQW�FDYHDW��/DULYLHUH��/DIUDQFH���������)URP�D�VDPSOH�RI�&DQDGLDQ�cities, the authors found that if a city characterized by 1000 people/km2 increased its
density to 3000 people/km2, then the electricity use per capita would only increase
E\�����&RPSDUHG�WR�WKH�UHODWLRQVKLS�EHWZHHQ�JDVROLQH�FRQVXPSWLRQ�DQG�GHQVLW\��WKH�VDYLQJV�RU�HFLHQFLHV�IURP�LQFUHDVH�GHQVLW\�RQ�HOHFWULFLW\�XVH�LV�UHODWLYHO�PLQRU��2WKHUV�have argued that sustainable development, which incorporates electricity use with
VHYHUDO�RWKHU�YDULDEOHV��VKRXOG�LQFOXGH�GHQVLWLHV�RI�������'3+��6WHHPHUV�VXJJHVWV�WKDW�European cities have approached optimum levels of density because they have achieved
9
moderate energy use under moderate densities, while maintaining a high quality of life
�6WHHPHUV��������
Buildings are the predominant users of municipal electricity use, but the general
relationship between urban form and electricity use is complicated and equivocal.
Residential buildings in particular are a predominant energy consumer, as they
DFFRXQW�RQ�DYHUDJH�IRU�����RI�WRWDO�HQHUJ\�XVH�LQ�FRXQWULHV�DURXQG�WKH�ZRUOG��6ZDQ���������%XLOGLQJV�GHVLJQHG�DW�KLJKHU�GHQVLWLHV�DUH�JHQHUDOO\�DVVRFLDWHG�ZLWK�VPDOOHU�residential areas, which reduces energy for heating and cooling. High density can also
HQJHQGHU�HQHUJ\�HFLHQF\�EHFDXVH�LW�DOORZV�WKH�VKDULQJ�RI�UHVRXUFHV��6WHHPHUV���������For instance, shared walls in high rise buildings, compared to detached residences,
UHGXFH�WKH�DPRXQW�RI�EXLOGLQJ�KHDW�ORVV�DQG�WRWDO�HQHUJ\�FRQVXPSWLRQ��&ODUNH���������0RUHRHYHU��KLJKHU�GHQVLWLHV�PD\�DOVR�HQDEOH�WKH�YLDELOLW\�RI�ODUJHU�VFDOH�HQHUJ\�HFLHQW�V\VWHPV��VXFK�DV�FRPELQHG�KHDW�DQG�SRZHU�V\VWHPV��&+3���&KHQJ���������<HW��WKHUH�LV�DQ�LQGLFDWLRQ�WKDW�&+3�LV�YLDEOH�DW�GHQVLWLHV�UDQJLQJ�IURP��������'3+��LQGLFDWLQJ�D�wider range of potential applications, depending on discount rates and energy prices
�&KXUFKPDQ���������/DVWO\��KLJKHU�GHQVLWLHV�DUH�DOVR�PRUH�HFRQRPLFDOO\�SURÀWDEOH�DQG�WKLV�DOORZV�PRUH�PRQH\�WR�EH�LQYHVWHG�LQ�XVLQJ�HQHUJ\�HFLHQW�EXLOGLQJ�PDWHULDOV��&KXUFKPDQ���������
Previous research also demonstrates the importance of urban geometry, where
EXLOGLQJ�RYHUVKDGLQJ�DQG�VRODU�JDLQ�FDQ�LQÁXHQFH�EXLOGLQJ�HQHUJ\�XVH��5DWWL���������)RU�LQVWDQFH��SDVVLYH�VRODU�EXLOGLQJ�GHVLJQ�DWWHPSWV�WR�RSWLPL]H�VRODU�JDLQ�E\�VSHFLÀHG�building siting, orientation, layout, and landscaping, in order to mitigate energy used
IRU�LQWHULRU�VSDFH�KHDWLQJ�DQG�FRROLQJ��0DGOHQHU���������6WHHPHUV�FLWHV�D�RQH�WKLUG�LQFUHDVH�LQ�KHDWLQJ�HQHUJ\�IRU�DQ�XUEDQ�KRXVH�FRPSDUHG�WR�D�JUHHQÀHOG�KRXVH�ZKHQ�FRQVLGHULQJ�WKH�SRWHQWLDO�IRU�SDVVLYH�VRODU�GHVLJQ��6WHHPHUV���������<HW��DFKLHYLQJ�energy savings from passive solar design is challenged by higher urban densities,
ZKHUH�KLJK�ULVH�EXLOGLQJV�FUHDWH�VKDGH�DQG�SUHYHQW�VRODU�JDLQ��,ELG����+LJK�GHQVLW\�DOVR�poses challenges to active solar demand, such as photovoltaics, which also relies upon
solar access for energy production. Additionally, high building density may reduce
10
the available ground area for vegetation and trees, which help purify and cool urban
DUHDV��UHVXOWLQJ�LQ�LQFUHDVHG�XUEDQ�KHDW�LVODQG�HͿ�HFW��,ELG����7KH�XUEDQ�KHDW�LVODQG�HͿ�HFW�LV�D�SKHQRPHQRQ�LQ�ZKLFK�DUHDV�ZLWK�VLJQLÀ�FDQW�LPSHUYLRXV�VXUIDFH�ODQG�FRYHU�absorb radiation from the sun, which increases the ambient temperature of those areas
FRPSDUHG�WR�DGMDFHQW�DUHDV��<RXQJ���������7KH�UHVXOW�LV�ZDUPHU�XUEDQ�WHPSHUDWXUHV��ZKLFK�LQÁ�XHQFHV�HQHUJ\�FRQVXPSWLRQ�SDWWHUQV�
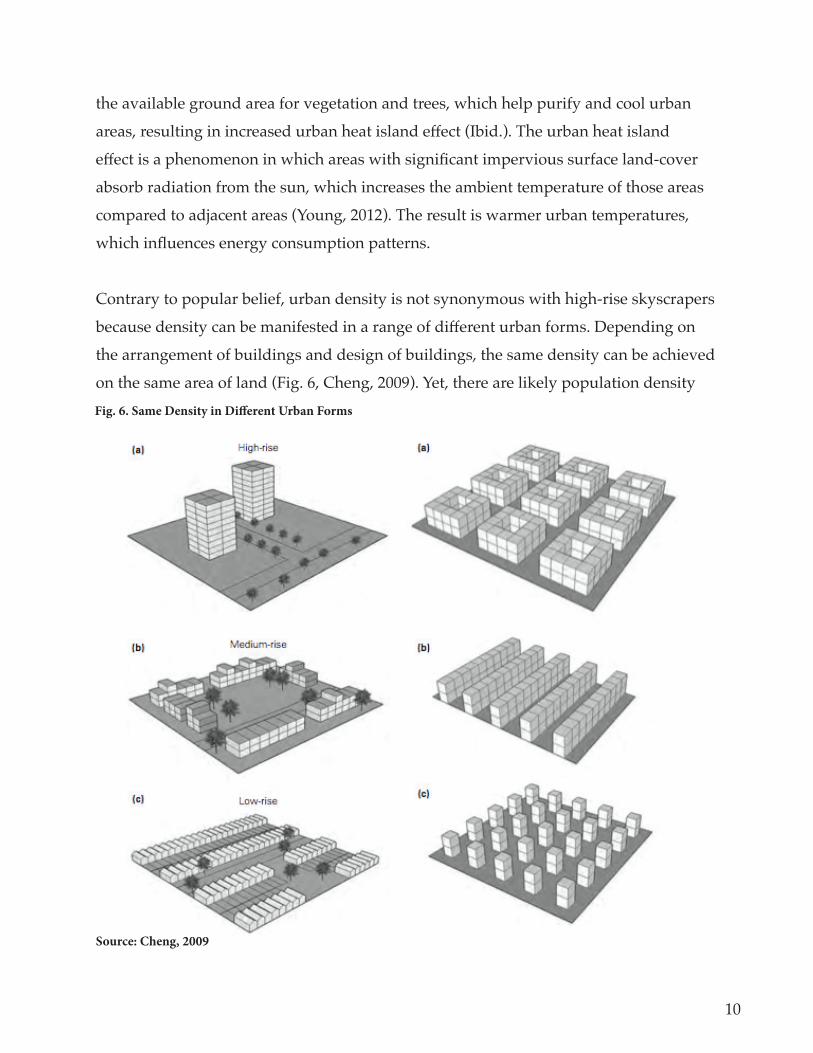
Contrary to popular belief, urban density is not synonymous with high-rise skyscrapers
EHFDXVH�GHQVLW\�FDQ�EH�PDQLIHVWHG�LQ�D�UDQJH�RI�GLͿ�HUHQW�XUEDQ�IRUPV��'HSHQGLQJ�RQ�the arrangement of buildings and design of buildings, the same density can be achieved
RQ�WKH�VDPH�DUHD�RI�ODQG��)LJ�����&KHQJ���������<HW��WKHUH�DUH�OLNHO\�SRSXODWLRQ�GHQVLW\�Fig. 6. Same Density in Diff erent Urban Forms
Source: Cheng, 2009
11
thresholds, where at a certain level of population it may be impossible to arrange and
GHVLJQ�EXLOGLQJV�LQ�D�ZD\�WKDW�HQDEOHV�HQHUJ\�HFLHQFLHV��7KHUHIRUH��ZKHQ�DVVHVVLQJ�WKH�UHODWLRQVKLS�EHWZHHQ�SRSXODWLRQ�GHQVLW\�DQG�HOHFWULFLW\�XVH�LQ�GLͿHUHQW�FLWLHV��LW�LV�XVHIXO�WR�FRQVLGHU�KRZ�HDFK�FLW\·V�XUEDQ�IRUP�PD\�LQÁXHQFH�LW·V�OHYHO�RI�HOHFWULFLW\�consumption.
ACCESS TO ELECTRICITY
Intuitively, access to continuous and reliable energy supplies will impact city electricity
consumption, regardless of the urban form. When supply infrastructure is inadequate,
or when demand outpaces supply, shortages may occur, resulting in lower total
electricity consumption. As cities get bigger, demand for electricity increases, yet total
consumption will rise only if supply increases as well. For instance, In July 2012, two
HQHUJ\�EODFNRXWV�DͿHFWHG�D�ODUJH�VZDWK�RI�QRUWKHUQ�,QGLD��LQFOXGLQJ�&KDQGLJDUK��leaving close to a billion people without power – the largest such occurrence in human
KLVWRU\��(6,���������6XFK�HYHQWV�UHÁHFW�EXUJHRQLQJ�KRXVHKROG�HOHFWULFLW\�GHPDQG�DV�more and more people move into cities. For India in particular, studies have looked
DW�KRZ�LQGLYLGXDO�KRXVHKROG�HOHFWULFLW\�GHPDQG�LV�LQÁXHQFHG�E\�IDFWRUV�VXFK�DV�LQFRPH��SULFHV��KRXVHKROG�VL]H�DQG�RWKHU�KRXVHKROG�VSHFLÀF�FKDUDFWHULVWLFV��)LOLSSLQL��3DFKDXUL���������7KH�UHVXOWV�LQGLFDWH�WKDW�KRXVHKROGV�OLYLQJ�LQ�ODUJHU�,QGLDQ�FLWLHV�VKRZ�VLJQLÀFDQWO\�KLJKHU�HOHFWULFLW\�FRQVXPSWLRQ�WKDQ�WKRVH�OLYLQJ�LQ�FLWLHV�ZLWK�OHVV�WKDQ���million inhabitants.
7KLV�ÀQGLQJ�VXJJHVWV�WKDW�ODUJHU�FLWLHV�DUH�FKDUDFWHUL]HG�E\�PRUH�GHYHORSHG�PDUNHWV�and electricity infrastructure and have continuous access to electricity and other
technology that increases household electricity consumption. Reliable electricity
LQIUDVWUXFWXUH�LQ�ODUJHU�FLWLHV�PD\�LQÁXHQFH�HOHFWULFLW\�FRQVXPSWLRQ��ZKLOH�LOOHJDO�DFFHVV�to electricity in large cities may be relevant as well. Populations in informal settlements
FUHDWH�LOOHJDO�KRRNXSV�WR�WKH�HOHFWULFDO�JULG�DQG�LQÁXHQFH�HOHFWULFLW\�FRQVXPSWLRQ�ZKLOH�QRW�EHLQJ�RFLDOO\�DFFRXQWHG�IRU�LQ�SRSXODWLRQ�HVWLPDWHV��7KLV�RFFXUUHQFH�LV�FRPPRQ�LQ�Indian cities, including Chandigarh.
12
ECONOMICS
The movement of people from rural to urban areas entails both a structural shift in the
economy from low-energy intensity agriculture to high-energy intensity production of
commodities, as well an increase in the consumption of energy intensive commercial
SURGXFWV�E\�UXUDO�WR�XUEDQ�PLJUDQWV��0DGOHQHU���������$VVHVVLQJ�WKH�UHODWLRQVKLS�EHWZHHQ�FLW\�VL]H�DQG�HQHUJ\�XVH�LV�GLFXOW��SDUWO\�GXH�WR�WKH�FKDOOHQJH�RI�GLVHQWDQJOLQJ�the relationship between energy use and economic growth. There are several prominent
theories regarding the relationship between economic growth and energy use. The
feedback hypothesis indicates biodirectional causality, where electricity consumption
FDXVHV�HFRQRPLF�JURZWK�$1'�HFRQRPLF�JURZWK�FDXVHV�HOHFWULFLW\�FRQVXPSWLRQ��6RODULQ���������&RQYHUVHO\��WKH�FRQVHUYDWLRQ�K\SRWKHVLV�LQIHUV�XQLGLUHFWLRQDO�FDXVDOLW\�from economic growth to energy use. Lastly, the neutrality hypothesis states no
FDXVDOLW\�EHWZHHQ�WKH�WZR�YDULDEOHV�ZKDWVRHYHU���&RZDQ���������,Q�,QGLD�LQ�SDUWLFXODU��Cowan found no causality in any direction between electricity consumption and
economic growth, which may be a result of the countries unpredictable energy supply
V\VWHP��,ELG����
0RUH�JHQHUDOO\��WKH�(QYLURQPHQWDO�.X]QHWV�&XUYH��(.&��FDQ�KHOS�VKHG�OLJKW�RQ�WKH�potential relationship between economic growth and environmental conditions (or
HQHUJ\�HFLHQF\��RYHU�WLPH��2ULJLQDOO\�GHYHORSHG�E\�.X]QHWV�DQG�6LPRQ���������the EKC theorizes an inverted-U shaped relationship, where a country will initially
industrialize and experience high levels of environmental degradation, followed by
a sharp decrease in environmental harm as increased incomes raises environmental
VWHZDUGVKLS�DPRQJVW�WKH�SRSXODWLRQ��,ELG����2QH�DUJXPHQW�HPEHGGHG�ZLWKLQ�WKH�EKC theory is that economic growth fuels innovation in environmentally benign
WHFKQRORJLHV��LQFOXGLQJ�WKRVH�WKDW�LQFUHDVH�WKH�HQHUJ\�HFLHQF\�RI�FLWLHV��7KRXJK�WKH�EKC is generally interpreted at the country level and in relation to environmental
pollution, it provides another theoretical framework in which to help assess the
relationship between changes in energy use and economic growth over time.
$GGLWLRQDOO\��WKH�¶UHERXQG�HͿHFW·�UHSUHVHQWV�WKH�WKHRU\�WKDW�RYHU�WLPH�LQFUHDVHG�HQHUJ\�
13
HFLHQF\�PD\�GHFUHDVH�WKH�SULFH�RI�HOHFWULFLW\��ZKLFK�ZLOO�DFWXDOO\�LQFUHDVH�RYHUDOO�OHYHOV�RI�FRQVXPSWLRQ�EHFDXVH�SHRSOH�FDQ�DͿRUG�WR�SD\�IRU�PRUH�WRWDO�HOHFWULFLW\��7XUQHU���������6LPLODU�WR�WKH�(.&��WKH�UHERXQG�HͿHFW�SURYLGHV�D�XVHIXO�HFRQRPLF�WKHRU\�in which to assess the determinants of urban electricity use over time and to help
disentangle the impact of economics from other pertinent variables.
CLIMATE CHANGE
7KH�,QWHUJRYHUQPHQWDO�3DQHO�RQ�&OLPDWH�&KDQJH��,3&&��UHFHQWO\�UHOHDVHG�WKHLU�)LIWK�Assessment Report on global climate change, indicating that global temperatures
ZLOO�FRQWLQXH�WR�ULVH�WR�OHYHOV�WKDW�PD\�GLVUXSW�KXPDQ�DFWLYLWLHV��,33&���������5LVLQJ�temperatures may theoretical beget increased electricity consumption because of
the need for additional air conditioning in buildings. Yet, at the same time, rising
WHPSHUDWXUHV�PD\�GHFUHDVH�HOHFWULFLW\�FRQVXPSWLRQ�LQ�ORFDWLRQV�WKDW�UHTXLUH�VLJQLÀFDQW�indoor heating. Therefore, it is uncertain how exactly rising temperatures will generally
impact electricity use in cities in general because of how variations in regional
JHRJUDSK\�LQÁXHQFH�FRQVXPSWLRQ�SDWWHUQV��)RU�LQVWDQFH��FLWLHV�LQ�KLJKHU�ODWLWXGHV�PD\�consume more energy for heating buildings compared to cities in the tropics, which
PD\�DOORFDWH�D�JUHDWHU�SURSRUWLRQ�RI�HOHFWULFLW\�IRU�DLU�FRQGLWLRQLQJ��/DQNDR���������
Several studies have looked at climatic impacts on electricity use in diverse
geogrpahical settings. For instance, there are indications that climate change may
impact Seattle through increased average temperatures and extreme heat events,
OHDGLQJ�WR�LQFUHDVHG�HQHUJ\�GHPDQG�IRU�FRROLQJ��&LW\�RI�6HDWWOH����������,Q�&KLQD��Asadoorian indicates a positive feedback between temperature and electricity demand
�$VDGRRULDQ���������ZKLOH�&RQVLGLQH�GHYHORSHG�D�PRGHO�LQ�WKH�86�WKDW�VXJJHVWHG�WKDW�ZDUPHU�FOLPDWH�PD\�VOLJKWO\�UHGXFH�HQHUJ\�GHPDQG��&RQVLGLQH���������7KH�KLJK�temperature, high electricity theory implies a feedback loop for countries in lower
latitudes, where rising global temperatures due to climate change beget increased
electricity requirements for air conditioning. If that air conditioning electricity is
produced using fossil fuels then this will further increase temperatures and the result
14
will be a positive feedback loop where temperatures and electricity consumption rise
exponentially.
URBANIZATION THEORY
In order to better understand the intricate relationship between energy use and
urban growth over time, new theoretical and methodological approaches should
EH�FRQVLGHUHG��)RU�LQVWDQFH��WKHUH�KDYH�EHHQ�UHFHQW�FDOOV�IRU�D�XQLÀHG�VFLHQFH�RI�XUEDQL]DWLRQ��6ROHFNL���������7KLV�VFLHQFH�RI�FLWLHV��RU�XUEDQL]DWLRQ�VFLHQFH��ZRXOG�DVVHVV�the possibility of identifying fundamental laws of the urbanization process, such as
its origin, development, organization, emergent properties, and connections to other
processes. An urbanization science may be comprised of at least three core components;
���D�IUDPHZRUN�WKDW�LGHQWLÀHV�WKH�EDVLF�FRPSRQHQWV�RI�XUEDQL]DWLRQ�DFURVV�FRKRUWV�RI�FLWLHV�����HPSLULFDO�HYLGHQFH�WKDW�VXSSRUWV�XUEDQL]DWLRQ�DV�D�XQLTXH�V\VWHP��DQG����GHPRQVWUDWHG�UHODWLRQVKLSV�EHWZHHQ�XUEDQL]DWLRQ�DQG�RWKHU�(DUWK�V\VWHPV��,ELG����
The study of complexity and cities is one example of a recent contribution to an
urbanization science. Complexity theory points to the potential existence of certain
universal characteristics that can be applied generically to cities of all size, location, and
stage of economic development. Central to complexity is the idea of emergence, where
the interaction of myriad actors’ actions produces singular utcomes that are distinct
IURP�WKH�EHKDYLRU�RI�WKH�LQGLYLGXDO�DFWRUV��6DPHW���������6FDOLQJ�DQDO\VLV�KDV�EHHQ�RI�SDUWLFXODU�LQWHUHVW�WR�WKRVH�VWXG\LQJ�XUEDQL]DWLRQ�VFLHQFH��6FDOLQJ�FDQ�EH�GHÀQHG�DV�KRZ�FHUWDLQ�FKDUDFWHULVWLFV��HJ�HOHFWULFLW\�XVH��FKDQJH�LQ�UHODWLRQ�WR�WKH�RYHUDOO�VL]H�RI�WKH�V\VWHP��HJ�XUEDQ�SRSXODWLRQ�GHQVLW\���7KH�SUHVHQFH�RI�D�VFDOLQJ�FKDUDFWHULVWLF�PHDQV�that the relationship between several variables is the same over a wide range of system
sizes, indicating potentially universal characteristics of cities. Several recent studies
have indicated the existence of near universal relationships between city population size
DQG�RWKHU�YDULDEOHV��VXFK�DV�LQQRYDWLRQ��%HWWHQFRXUW�HW�DO����������%\�ORRNLQJ�DW�D�ODUJH�VDPSOH�RI�FLWLHV��DQRWKHU�VWXG\�LGHQWLÀHG�WKLV�VFDOLQJ�HͿHFW�EHWZHHQ�SRSXODWLRQ�VL]H�DQG�12��SROOXWLRQ��/DPVDO�HW�DO����������$V�SRSXODWLRQ�LQFUHDVHV��12��SROOXWLRQ�ZLOO�
15
increase at the same rate, regardless of the context and location in which a city resides.
Other research has indicated the existence of generic mechanisms and properties of city
VL]H�DQG�&2��HPLVVLRQV��)UDJNLDV���������
Additional research has contributed to an urbanization science by comparing cities
to biological systems. Urban metabolism is a widely used concept that theorizes
how cities work as a system of inputs and outputs that are analogous to energy use
LQ�ELRORJLFDO�V\VWHPV��,Q�WHUPV�RI�HFLHQF\��.OLHEHU·V�/DZ�VWDWHV�WKDW�ODUJHU�DQLPDOV�consume proportionately less energy than smaller animals, inferring that they are
PRUH�HQHUJ\�HFLHQW��)UDJNLDV���������7KHUHIRUH��LI�FLWLHV�DUH�FKDUDFWHUL]HG�E\�D�W\SH�of urban metabolism similar to what exists in the ecology, then larger cities may be
PRUH�HQHUJ\�HFLHQW�WKDQ�VPDOOHU�FLWLHV��8VLQJ�DQRWKHU�ELRORJLFDO�DQDORJXH��WKH�$OOHH�(ͿHFW�K\SRWKHVL]HV�WKDW�LQFUHDVHG�SRSXODWLRQ�GHQVLW\�LQIHUV�LQFUHDVHG�ÀWQHVV�DQG�WKHUHIRUH�LQFUHDVHG�OLNHOLKRRG�RI�VXUYLYDO��.ROEHUW���������,W�LV�XQFOHDU�ZKHWKHU�WKLV�HͿHFW�observed in biological systems can be applied to urban systems. Although there have
been recent developments in urbanization science, more work is needed, especially on
SRSXODWLRQ�VFDOLQJ�WR�DVVHVV�ZKHWKHU�ODUJHU�FLWLHV�DUH�PRUH�RU�OHVV�HFLHQW�WKDQ�VPDOOHU�RQHV��0DUFRWXOOLR���������
Similiarly, adjacent research has focused on how cities change over time rather than on
their characteristics at one point in time. The result is an attempt to discern how all cities
may or may not conform to generic chronological growth patterns. Cities throughout
WKH�ZRUOG�DUH�FKDUDFWHUL]HG�E\�GLͿHUHQW�VL]HV��ZKLFK�DUH�WKH�UHVXOW�RI�KLVWRULFDO�JURZWK�trajectories. Yet, it is possible that cities are characterized by generic evolutionary
mechanisms and should be viewed as objects evolving within systems over time
�6ZHUWV���������%DVHG�XSRQ�WKLV�WKHRU\��ZH�FDQ�LGHQWLI\�WUDMHFWRULHV�RI�SRSXODWLRQ�JURZWK�LQ�FLWLHV��1RUWKDP�ÀUVW�VXJJHVWHG�D�WKHRU\�RI�XUEDQL]DWLRQ�HYROXWLRQ�LQ�WKH�IRUP�RI�DQ�6�VKDSHG�FXUYH�ZLWK�WKUHH�FKURQRORJLFDO�VWDJHV�RI�XUEDQ�SRSXODWLRQ�JURZWK�����LQLWLDO�����DFFHOHUDWLRQ��DQG����WHUPLQDO��0XOOLJDQ���������7UDGLWLRQDO�VWDJH�WKHRU\�RI�economic growth helps to explain the characteristics of the urbanization curve. Initially,
primary economic activities are dominant and urbanization is slow. Urbanization then

16
DFFHOHUDWHV�DV�LQGXVWULDOL]DWLRQ�RFFXUV��'XULQJ�WKLV�H[SDQVLRQDU\�VHFRQG�SKDVH��WKHUH�is an exodus of people from rural to urban, which creates an inital concentration in
city population. Finally, urbanization slows as an economy is characterized by tertiary
economic activities such as personal services. This last stage may be characterized by
VXEXUEDQL]DWLRQ��6DPHW��������
It is generally understood that cities within the same urban system follow similiar
patterns of growth, but the similarities between the growth patterns of cities among
GLͿHUHQW�XUEDQ�V\VWHPV�LV�OHVV�FHUWDLQ��2YHU�WLPH��FLWLHV�DUH�JHQHUDOO\�XQGHUVWRRG�WR�JURZ�IURP�WKH�ERWWRP�XS��ZLWK�WKHLU�ÀUVW�DQG�VHFRQG�¶QDWXUHV·�GHWHUPLQLQJ�WKH�H[WHQW�RI�GHYHORSPHQW�DW�D�SDUWLFXODU�ORFDWLRQ��6DPHW���������6XFK�ERWWRP�XS�JURZWK�occurs relatively randomly, in constrast to to being the outcome of direct government
LQWHUYHQWLRQ��7KLV�ÀUVW�QDWXUH�LQFOXGHV�JHRJUDSKLFDO�YDULDEOHV��VXFK�DV�QDYLJDEOH�ULYHUV�or useful natural resources, which enables an initial settlement. A city’s subsequent
development is then dependent on second natures, which includes implementation
of technology for a variety of basic purposes including infrastructure, defense, and
communication. Institutions will alter the the evolutionary trajectory of a growing city
unit through designed interventions, interrupting the random components that propel
FLW\�JURZWK��,ELG��
Similar to historic patterns of urbanization, there are patterns of electricity consumption
WKDW�ZH�FDQ�REVHUYH�RYHU�WLPH��3DULNK�QRWHV�WKDW�UHVLGHQWLDO�HOHFWULÀFDWLRQ�WRGD\�LV�proceeding much more rapidly than it did in the past within earlier industrialized
HFRQRPLHV��UHVXOWLQJ�LQ�SUHVHQWO\�H[DJJHUDWHG�GHPDQGV�IRU�HOHFWULFLW\��3DULNK���������At the same time, the author intimates that new technologies are arising today, not
available to the initially industrialized nations, which may help accommodate rapidly
increasing present energy demands. Given the uncertainty of myriad variables that
impact changes in electricity consumption, predicting future patterns is problematic.
��
SUMMARY
18
CHAPTER 3: METHODOLOGY
This chapter describes the methodology I employed for investigating the manner
in which city size and energy use change over time. The research design is a mixed
methods approach and employs comparative case study analysis with descriptive
VWDWLVWLFV��%URDGO\��WKH�UHVHDUFK�GHVLJQ�LV�VWUXFWXUHG�WR�ÀUVW�DVVHVV�WKH�UHODWLRQVKLS�between several chosen variables in two case study cities separately and then compare
the results against each other. The result is an assessment of the similarities and
GLͿHUHQFH�WKDW�PD\�H[LVW�EHWZHHQ�WKH�WZR�FLWLHV�
CASE STUDIES
My research design is structured around case studies of one city in the United
6WDWHV��6HDWWOH��DQG�RQH�FLW\�LQ�,QGLD��&KDQGLJDUK���7KHVH�FLWLHV�ZHUH�FKRVHQ�GXH�WR�convenience, familiarity, and access to data. Because I work and study in Seattle, I
have insights and access to data that does not apply to other cities in the US. I chose
Chandigarh because I had the opportunity to reside there during a three-month study
program in the winter of 2014. As a result, I had a unique opportunity to pursue the
FROOHFWLRQ�RI�RWKHUZLVH�LQDFFHVVLEOH�GDWD�DQG�ZDV�DEOH�WR�GUDZ�LQVLJKWV�WKURXJK�ÀHOG�observation that would not be possible remotely.
The methodology employs case study comparison, rather than experimentation, as
the principal method of theory testing. Comparative analysis juxtaposes geopolitical
HQWLWLHV�WR�DVVLVW�LQ�WHVWLQJ�K\SRWKHVHV�RU�UHYHDOLQJ�VLPLODULWLHV�DQG�GLͿHUHQFHV�EHWZHHQ�GLͿHUHQW�V\VWHPV��$OWKRXJK�H[SHULPHQWDWLRQ�PD\�EH�SRVVLEOH�LQ�OLPLWHG�FLUFXPVWDQFHV�within urbanization science, it is usually impractical because it requires establishing
D�FRQWURO�DQG�H[SHULPHQWDO�JURXSV��3HWHUV���������)RU�LQVWDQFH��LW�ZRXOG�EH�SUDFWLFDOO\�impossible to observe two identical cities and perform an intervention on one while
holding the other constant. Rather, comparison is used because urbanization is a process
that requires descriptive richness, within complex and often unplanned settings (Peters,
�������&RPSDUDWLYH�FDVH�VWXG\�DQDO\VLV�LV�XVHIXO�EHFDXVH�LW�HVSRXVHV�VSHFLÀFDWLRQ�
19
over generalization. When attempting to identify universal characteristics between
RXWZDUGO\�XQLTXH�FLWLHV��FRPSDULVRQ�LV�D�XVHIXO�ÀUVW�VWHS��2QFH�LQLWLDO�WKHRULHV�DUH�WHVWHG�through comparative case study, the sample can be expanded to include more cities and
more reliable conclusions may be drawn.
VARIABLES
The fundamental concepts of my research design are energy use, population growth,
and climate change, measured over time. I have chosen several variables to represent
these concepts. Population growth is represented by population density, climate
change is represented by temperature, and energy is represented by electricity use.
Additionally, I included income as a control variable because of the previously
discussed relationship between energy and economic growth.
I chose these variables for several reasons. Population density and size helps assess
the intensity of urbanization in a particular city. As the movement of people from rural
to urban areas increases, the number of people per area in cities increases, as does the
absolute quantity of people. In this context, population density is measured by the total
SRSXODWLRQ�GLYLGHG�E\�WKH�WRWDO�DUHD�RI�D�FLW\��3RSXODWLRQ�LV�GHÀQHG�DV�WKH�QXPEHU�RI�SHRSOH�ZKR�SHUPDQHQWO\�UHVLGH�ZLWKLQ�WKH�XUEDQ�ERXQGDULHV��ZKLFK�DUH�VSHFLÀFDOO\�GHÀQHG�WKURXJK�FHQVXV�HVWLPDWHV��
I have chosen electricity to represent energy because of its relevance to both
urbanization and climate change. Electricity is an essential factor in practically all
aspects of life and will continue to be so far into the future. While society may develop
substitutes for oil, there is no substitute for electricity. Moreover, electricity is a key
instigator of climate change, as power generation accounts for the highest proportion of
JOREDO�JUHHQKRXVH�JDV�HPLVVLRQV�RXW�RI�DOO�HQHUJ\�VHFWRUV��0RQWJRPHU\���������
I have chosen temperature because it is often referenced as a proxy for climate change
and because of its relevance to the amount of electricity needed for heating and cooling
20
buildings. Additionally, I have hypothesized an important potential feedback loop,
where the generation of electricity with fossil fuels increases global temperatures,
leading to an increased or decreased electricity use needed for heating and cooling.
In one sense, population density is disproportionately related to residential electricity
use because it pertains to the concentration of people living in some form of residential
buildings. Conversely, commercial and industrial electricity consumption may be
LQÁXHQFHG�E\�SHRSOH�ZKR�FRPPXWH�IURP�DGMDFHQW�FLWLHV�DQG�ZKR�GR�QRW�OLYH�ZLWKLQ�the city in which I am comparing it’s population density. Though this may be partly
WUXH��WKH�FRQFHQWUDWLRQ�RI�SRSXODWLRQ�LQ�D�FLW\�ZLOO�VWLOO�LQÁXHQFH�RWKHU�VHFWRUV�RI�electricity consumption in various ways. For instance, the concentration of people,
DQG�WKHLU�DVVRFLDWHG�FRQVXPHU�DFWLYDWHV��PD\�LQÁXHQFH�WKH�QXPEHU�RI�FRPPHUFLDO�businesses in a certain area, resulting in increased commercial electricity use. Moreover,
industrial sectors may congregate near concentrations of people because they provide
employment, resulting in relationships between industrial electricity consumption
and population density. Although the relationship between residential electricity use
and population density may be more direct, there clearly exists spatial relationships
with other sectors of electricity use that justify using aggregate electricity consumption
measures.
Y= per capita electricity consumption (sum of industrial, commercial, residential, &
PLVFHOODQHRXV�HOHFWULFLW\�XVH�WRWDO�SRSXODWLRQ�;� �SRSXODWLRQ�GHQVLW\��SRS�NP��X2= total population
X3= average annual high and low maximum and minimum temperatures
;� �SHU�FDSLWD�LQFRPH��WRWDO�LQFRPH�WRWDO�SRSXODWLRQ�
CHANDIGARH DATA
I collected data in India through personal requests from local administrative agencies,
by using research libraries, and utilizing some existing online data sources. The

21
most extensive component of my data gathering process involved visiting various
governmental departments in Chandigarh. Through roughly a dozen separate visits, I
attempted to acquire data from the following agencies:
�� &KDQGLJDUK�'HSDUWPHQW�RI�7RZQ�3ODQQLQJ��87�6HFUHWDULDW��6HFWRU����&KDQGLJDUK��� &KDQGLJDUK�(OHFWULFLW\�'HSDUWPHQW��87�6HFUHWDULDW��6HFWRU����&KDQGLJDUK�� &KDQGLJDUK�'HSDUWPHQW�RI�(QYLURQPHQW��3DU\DYDUDQ�%KDZDQ���UG�)ORRU����6HFWRU�
19-B, Chandigarh
�� *RYHUQPHQW�RI�,QGLD��5HJLRQDO�&HQVXV�2FH��-DQJDQDQD�%KDZDQ�3ORW�1R���%�Sector-19-A, Madhya Marg, Chandigarh
�� Chandigarh Renewable Energy and Science & Technology Promotion Society
�&5(67����VW�)ORRU��3DU\DYDUDQ�%KDZDQ�0DGK\D�0DUJ��6HFWRU����%��&KDQGLJDUK�� Chandigarh Meteorological Centre, Sector-39, Chandigarh
�� 'LUHFWRUDWH�RI�(FRQRPLFV�DQG�6WDWLVWLFV��87�&KDQGLJDUK��87�6HFUHWDULDW��6HFWRU����Chandigarh
In addition to government agencies, I also utilized several research libraries to collect
data. They included the following:
�� 3DQMDE�8QLYHUVLW\��*HRJUDSK\�'HSDUWPHQW�/LEUDU\��6HFWRU�����&KDQGLJDUK�� &KDQGLJDUK�&ROOHJH�RI�$UFKLWHFWXUH�/LEUDU\��9LG\D�3DWK��6HFWRU����'��&KDQGLJDUK�� 7KH�(QHUJ\��5HVRXUFHV�,QVWLWXWH��7(5,��5HVHDUFK�/LEUDU\��,QGLD�+DELWDW�&HQWUH��
/RGKL�5RDG��1HZ�'HOKL
Through these resources I was able to develop an original dataset, containing both
quantitative and qualitative data, which is the aggregation of bits and pieces of data that
,�JDWKHUHG�IURP�P\ULDG�GLͿHUHQW�DGPLQLVWUDWLYH�ERGLHV��UHVHDUFK�UHVRXUFHV��DV�ZHOO�DV�P\�ÀHOG�REVHUYDWLRQV��
4XDQWLWDWLYH�'DWD��� annual per capita electricity use, 1985-2011
22
�� total electricity use, 2006-2011
�� HOHFWULFLW\�XVH�SHU�FRQVXPSWLRQ�VHFWRU������������� annual per capita income, 1992-2012
�� total decadal population 1900-2010
�� total average decadal population density , 1961-2011
�� annual monthly high and low maximum/minimum temperature 1982-2009
�� *,6�GDWD��VKDSHÀOH�RI�FLW\�DGPLQLVWUDWLYH�ERXQGDU\�
4XDOLWDWLYH�'DWD�
,�GHYHORSHG�ÀHOG�REVHUYDWLRQV�GXULQJ�P\���PRQWKV�OLYLQJ�LQ�&KDQGLJDUK��LQ�ZKLFK�,�took notes and pictures of my surroundings as I traversed the city. For example, I kept
a running list of observations regarding what may impact residential electricity use
LQ�&KDQGLJDUK���,�DOVR�REWDLQHG�DQHFGRWDO�LQIRUPDWLRQ�IURP�DGPLQLVWUDWLRQ�RFLDOV�LQ�various city departments as I collected data. I also referenced maps showing sectoral
SRSXODWLRQ�GHQVLW\�OHYHOV�SURYLGHG�WKURXJK�FHQVXV�GDWD�DQG�,�LGHQWLÀHG�VHFWRUV�WKDW�represented a diverse range of high, mid, and low densities. I then visited each sector,
taking pictures, notes, and observing the urban form.
SEATTLE DATA
Compared to my experience collecting data in Chandigarh, acquiring data in Seattle
was straightforward and involved brief online searches and several visits to local
JRYHUQPHQWDO�RFHV��,�DFTXLUHG�HOHFWULFLW\�GDWD�IURP�6HDWWOH�&LW\�/LJKW��ZKLFK�LV�WKH�public utility serving the Seattle area. Other data, such as population and economics,
was acquired via existing online sources.
�� 6HDWWOH�&LW\�/LJKW�������WK�$YHQXH��6XLWH�������6HDWWOH��:$�� :DVKLQJWRQ�6WDWH�*HRVSDWLDO�'DWD�$UFKLYH��:$*'$��� U.S. Census
�� University of Washington Libraries

23
�� Weather Underground
4XDQWLWDWLYH�'DWD�
�� WRWDO�DQQXDO�HOHFWULFLW\�XVH��UHVLGHQWLDO��QRQ�UHVLGHQWLDO��������������� total decadal population 1900-2010
�� total decadal average population density, 1900-2010
�� annual monthly high and low maximum/minimum temperature 1982-2009
�� *,6�GDWD��VKDSHÀOH�RI�FLW\�DGPLQLVWUDWLYH�ERXQGDU\�
4XDOLWDWLYH�'DWD�
For Seattle, I leveraged my experience living and studying urban planning within the
city for several years to develop a collection of observations and anecdotal evidence
regarding population and electricity use.
ANALYTIC PLAN
My analytic plan employed descriptive statistical analysis of quantitative data and
interpretation of qualitative observations for each case study city individually.
To analyze the quantitative dataset, I used the computing software R to carry out
univariate and bivariate descriptive statistics to summarize basic patterns among
variables over time. Scatter plots are used to discern associations between variables,
such as whether the relationship between variables is generally positive or negative.
These results helped shed light on my research questions and inform future statistical
analysis that should unfold.
In addition, I organized my qualitative observations, in conjunction with additional
UHVHDUFK��WR�LGHQWLI\�LPSRUWDQW�FKDUDFWHULVWLFV�WKDW�PD\�LQÁXHQFH�YDULDEOH�RXWFRPHV�in each city. For instance, I summarized my observations on residential electricity
use, such as the type of common household appliances in Chandigarh. I also used
24
geographic information systems to present certain aspects of the dataset, such as
sectoral population density, in a visual format that assists in assessing trends over time.
Both my qualitative observations and GIS analysis help to bolster the quantitative
statistical aspect of my analytic plan and create a comprehensive analysis of the dataset
I developed.
I utilized the aforementioned techniques to analyze Seattle and Chandigarh separately
and then compared the results of both analyses against each other. The comparative
aspect of the analytic plan also used descriptive statistics to begin to investigate
relationships between the variables of both cities. Furthermore, I created an evaluation
matrix that juxtaposes the qualitative observations of each city, which leads into the
subsequent discussion chapter.
SUMMARY
This chapter outlined the methodology approach I employed for assessing the interplay
between energy and growth in Chandigarh and Seattle. In this chapter, I outlined the
case study structure of my methodology, enumerated the chosen variables, explained
the data I collected in both cities, and described my analytic plan.

25
CHAPTER 4: ANALYSIS
In this chapter I present an analysis of the data that I gathered for Chandigarh and
Seattle, which includes quantitative and qualitative data, backed by additional research.
I analyze both case study cities separately and then compare the results between the
two. The analysis subsections include context, history, population, electricity use, land
use, density, urban form, and climate.
CASE STUDY #1: CHANDIGARH
Chandigarh is a city in northwest India
that is encompassed within the Chandigarh
Union Territory and lies adjacent to the
VWDWHV�RI�3XQMDE�DQG�+DU\DQD��)LJ������,W�ZDV�WKH�ÀUVW�ODUJH�VFDOH�SODQQHG�FLW\�LQ�,QGLD�and today maintains a population of just
around one million citizens.
HISTORY
&KDQGLJDUK�ZDV�FRQFHLYHG�LQ�WKH�ZDNH�,QGLDQ�LQGHSHQGHQFH�LQ������IURP�*UHDW�%ULWDLQ��where British India was divided into modern day India and Pakistan. As a result, the
capital city of British Punjab – Lahore – was absorbed by Pakistan, leaving the modern
3XQMDE�,QGLDQ�VWDWH�ZLWKRXW�D�FDSLWDO�FLW\��,QGLD·V�ÀUVW�3ULPDWH�0LQLVWHU��-DZDKDUODO�Nehru decided to create Chandigarh as a replacement for the previous capital city. The
initial master plans of Chandigarh were developed by an American team of planners,
but the ultimate planning and design process was carried out by French architect Le
Corbusier. The design principles were complex and represented a variety of post-
FRORQLDO�LQÁXHQFHV��LQFOXGLQJ�WKH�SROLWLFV�DURXQG�WKH�,QGLD�3DNLVWDQ�SDUWLWLRQ��DQG�“Nehruvian quasi-socialist nation-state ideologies, aspirations of modernity, and the
FRQYHUJHQFH�RI�ZHVWHUQ�HDVWHUQ�SODQQLQJ�SDUDGLJPVµ��&KDODQD���������
Fig. 7. Context Map of Chandigarh
26
PLANNING, GROWTH, & DENSITY
Chandigarh was planned according to sectors, which are sub-city district or
QHLJKERUKRRG�XQLWV��9LPDO���������7KH�RULJLQDO�SODQ�ZDV�IRU�D�SRSXODWLRQ�RI���������WR�EH�DFFRPPRGDWHG�LQ�WZR�SKDVHV�RI�GHYHORSPHQW��ZKHUH�VHFWRUV������ZRXOG�ÀUVW�KRXVH���������SHRSOH��IROORZHG�E\����KLJKHU�GHQVLW\�VHFWRUV�KRXVLQJ���������SHRSOH��0DQ\�viewed the planned population of 500,000 as an exaggerated sum because the city was
brand new and its level of attractiveness to urban migrants was highly uncertain. At
ÀUVW��SRSXODWLRQ�JURZWK�ZDV�VORZ�IRU�VHYHUDO�UHDVRQV�LQFOXGLQJ�VORZ�VXSSO\�RI�EXLOGLQJ�PDWHULDOV��SRRU�WUDQVSRUW�OLQNV��DQG�LQVXFLHQW�IXQGV�IURP�WKH�QDWLRQDO�JRYHUQPHQW��But soon after its establishment it began growing at a faster rate than almost any city
in India. This was the result the reorganization of Punjab in 1966, which established
Chandigarh as the joint capital of the states of Punjab, Haryana, and of its own Union
7HUULWRU\��7KH�XSVKRW�ZDV�DQ�LQÁX[�RI�JRYHUQPHQWDO�RFHV�DQG�WKHLU�DVVRFLDWHG�employees.
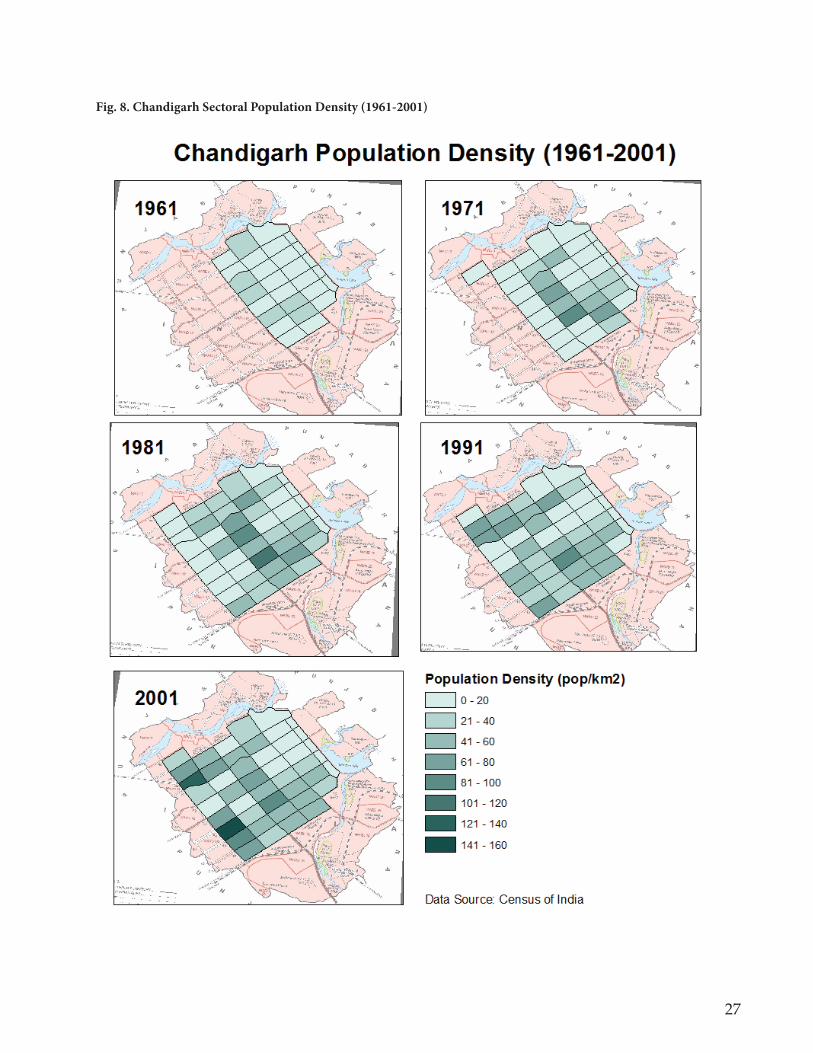
Although planned as predominantly high density, the city developed into one that
LV�SUHGRPLQDQWO\�ORZ�GHQVLW\��EDVHG�XSRQ�,QGLDQ�VWDQGDUGV��)LJ������7KH�UDWLR�RI�ORZ�density to high density sectors was planned as 2:3 but became manifested as 3:2.
Population in each sector increased from 1961 to 1981 but then an array of sectors actual
ORVV�SRSXODWLRQ�GXULQJ�WKH�����V��,ELG����7KLV�HYROXWLRQ�RI�JURZWK�FRXOG�EH�H[SODLQHG�E\�VHYHUDO�IDFWRUV��7KH�ÀUVW�SKDVH�RI�GHYHORSPHQW�ZDV�RFFXSLHG�E\�JURXSV�RI�IDPLOLHV�but as the families aged, the younger members formed families and moved outside of
phase one because there was not available housing. Additionally, some of the initial
sectors consisted of rental housing. As land values increased over time, higher rents
created pressures that pushed these renters out of these areas. By 1981 a variety of
informal homes and settlements had become established. Eventually these populations
ZHUH�UHPRYHG�DQG�UHHVWDEOLVKHG�LQ�WKH�SHULSKHUDO�YLOODJHV��'XULQJ�WKH�����V��WKH�urban portion of Chandigarh UT grew at a rate of 36.2 percent while the rural portion
LQFUHDVHG�E\�������SHUFHQW��,ELG����,PPLJUDQWV�WR�&KDQGLJDUK�ZHUH�XQDEOH�WR�VHWWOH�LQ�the central sectors due to increasingly high land values and therefore settled in the
��
Fig. 8. Chandigarh Sectoral Population Density (1961-2001)
28
surrounding villages. Except for the city center, the major areas for employment are
easily accessible from the periphery. For instance, the Capitol Complex is easily accessed
by the northern villages of Khuda Ali Sher, Kansal, and Kaimbwala. In the far west
SRUWLRQ�RI�WKH�FLW\�WKH�XQLYHUVLWLHV�SURYLGH�VLJQLÀ�FDQW�HPSOR\PHQW�DQG�WKH�LQGXVWULDO�area provides employment in the southeast of the city. In sum, the city grew at a much
faster initial rate than planned, but has recently slowed, as land values reached a high
level, thus deterring increased growth.
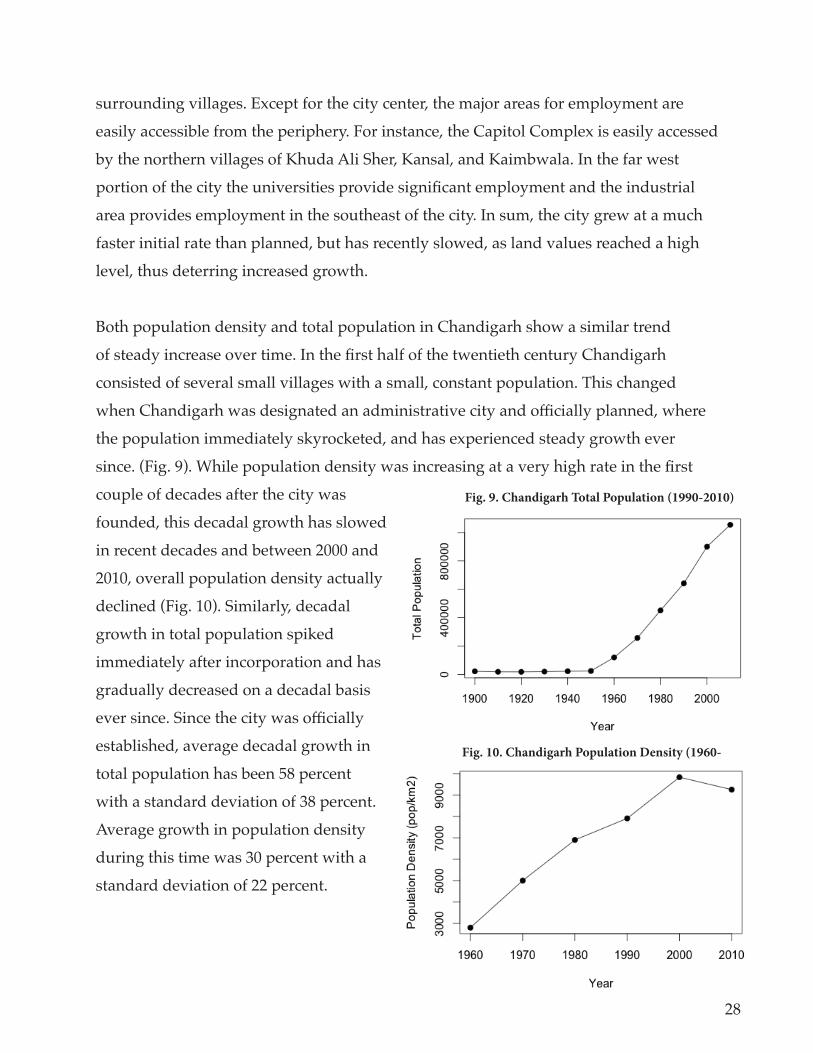
Both population density and total population in Chandigarh show a similar trend
RI�VWHDG\�LQFUHDVH�RYHU�WLPH��,Q�WKH�À�UVW�KDOI�RI�WKH�WZHQWLHWK�FHQWXU\�&KDQGLJDUK�consisted of several small villages with a small, constant population. This changed
ZKHQ�&KDQGLJDUK�ZDV�GHVLJQDWHG�DQ�DGPLQLVWUDWLYH�FLW\�DQG�R��FLDOO\�SODQQHG��ZKHUH�the population immediately skyrocketed, and has experienced steady growth ever
VLQFH���)LJ������:KLOH�SRSXODWLRQ�GHQVLW\�ZDV�LQFUHDVLQJ�DW�D�YHU\�KLJK�UDWH�LQ�WKH�À�UVW�couple of decades after the city was
founded, this decadal growth has slowed
in recent decades and between 2000 and
2010, overall population density actually
GHFOLQHG��)LJ�������6LPLODUO\��GHFDGDO�growth in total population spiked
immediately after incorporation and has
gradually decreased on a decadal basis
HYHU�VLQFH��6LQFH�WKH�FLW\�ZDV�R��FLDOO\�established, average decadal growth in
total population has been 58 percent
with a standard deviation of 38 percent.
Average growth in population density
during this time was 30 percent with a
standard deviation of 22 percent.
Fig. 9. Chandigarh Total Population (1990-2010)
Fig. 10. Chandigarh Population Density (1960-
29
ELECTRICITY CONSUMPTION
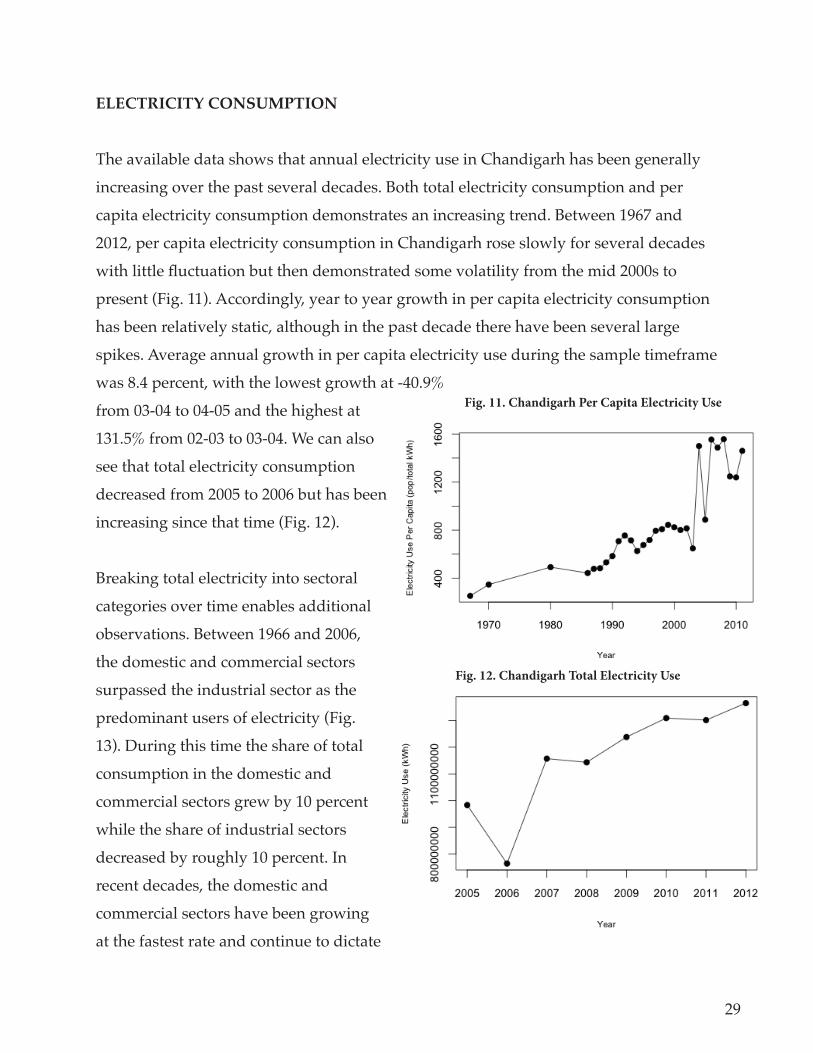
The available data shows that annual electricity use in Chandigarh has been generally
increasing over the past several decades. Both total electricity consumption and per
FDSLWD�HOHFWULFLW\�FRQVXPSWLRQ�GHPRQVWUDWHV�DQ�LQFUHDVLQJ�WUHQG��%HWZHHQ������DQG�2012, per capita electricity consumption in Chandigarh rose slowly for several decades
ZLWK�OLWWOH�Á�XFWXDWLRQ�EXW�WKHQ�GHPRQVWUDWHG�VRPH�YRODWLOLW\�IURP�WKH�PLG�����V�WR�SUHVHQW��)LJ�������$FFRUGLQJO\��\HDU�WR�\HDU�JURZWK�LQ�SHU�FDSLWD�HOHFWULFLW\�FRQVXPSWLRQ�has been relatively static, although in the past decade there have been several large
spikes. Average annual growth in per capita electricity use during the sample timeframe
ZDV�����SHUFHQW��ZLWK�WKH�ORZHVW�JURZWK�DW��������from 03-04 to 04-05 and the highest at
�������IURP�������WR��������:H�FDQ�DOVR�see that total electricity consumption
decreased from 2005 to 2006 but has been
LQFUHDVLQJ�VLQFH�WKDW�WLPH��)LJ�������
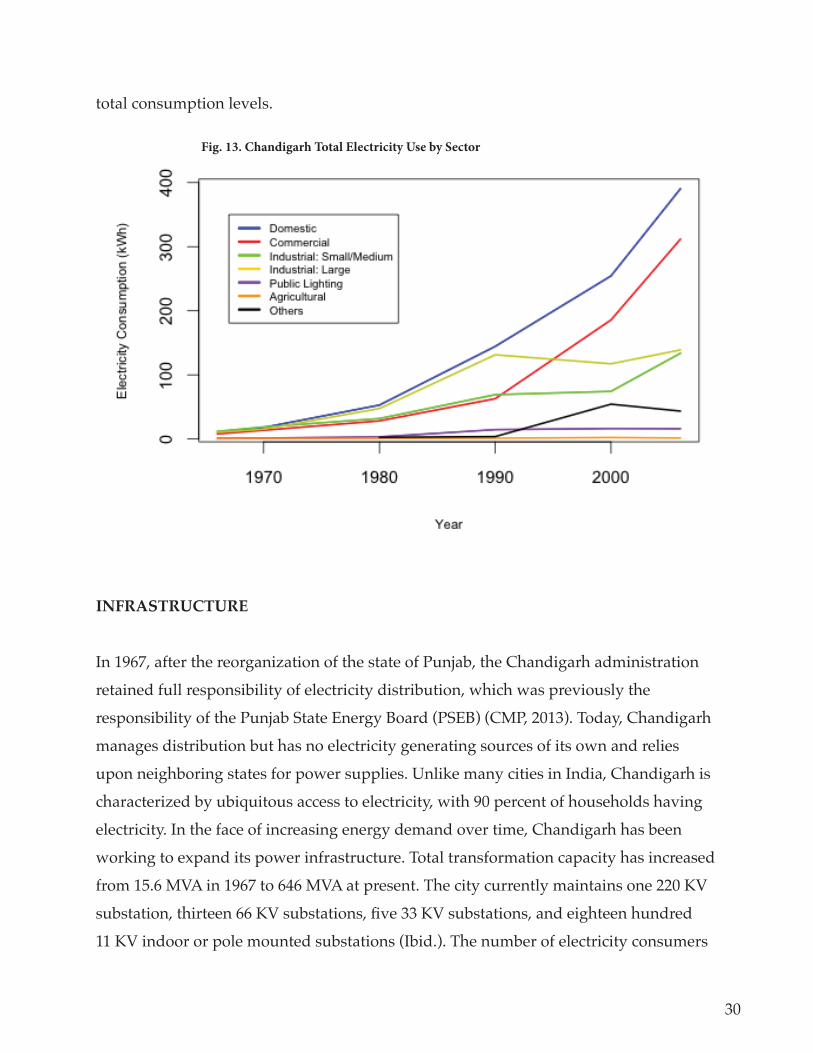
Breaking total electricity into sectoral
categories over time enables additional
observations. Between 1966 and 2006,
the domestic and commercial sectors
surpassed the industrial sector as the
predominant users of electricity (Fig.
�����'XULQJ�WKLV�WLPH�WKH�VKDUH�RI�WRWDO�consumption in the domestic and
commercial sectors grew by 10 percent
while the share of industrial sectors
decreased by roughly 10 percent. In
recent decades, the domestic and
commercial sectors have been growing
at the fastest rate and continue to dictate
Fig. 12. Chandigarh Total Electricity Use
Fig. 11. Chandigarh Per Capita Electricity Use
30
total consumption levels.
INFRASTRUCTURE
,Q�������DIWHU�WKH�UHRUJDQL]DWLRQ�RI�WKH�VWDWH�RI�3XQMDE��WKH�&KDQGLJDUK�DGPLQLVWUDWLRQ�retained full responsibility of electricity distribution, which was previously the
UHVSRQVLELOLW\�RI�WKH�3XQMDE�6WDWH�(QHUJ\�%RDUG��36(%���&03���������7RGD\��&KDQGLJDUK�manages distribution but has no electricity generating sources of its own and relies
upon neighboring states for power supplies. Unlike many cities in India, Chandigarh is
characterized by ubiquitous access to electricity, with 90 percent of households having
electricity. In the face of increasing energy demand over time, Chandigarh has been
working to expand its power infrastructure. Total transformation capacity has increased
IURP������09$�LQ������WR�����09$�DW�SUHVHQW��7KH�FLW\�FXUUHQWO\�PDLQWDLQV�RQH�����.9�VXEVWDWLRQ��WKLUWHHQ����.9�VXEVWDWLRQV��À�YH����.9�VXEVWDWLRQV��DQG�HLJKWHHQ�KXQGUHG����.9�LQGRRU�RU�SROH�PRXQWHG�VXEVWDWLRQV��,ELG����7KH�QXPEHU�RI�HOHFWULFLW\�FRQVXPHUV�
Fig. 13. Chandigarh Total Electricity Use by Sector
31
KDV�JURZQ�E\����������IURP�XQGHU���������LQ�������ZKLOH�WKH�SHDN�SRZHU�GHPDQG�KDV�grown from 14 MW to 350 MW in 2012.
Chandigarh is currently developing renewable energy infrastructure to help meet
growing demand in a more sustainable manner. Chandigarh has established a goal to
install rooftop solar photovoltaics at a capacity of 2.5 MW within 3 years and 10 MW
ZLWKLQ����\HDUV��7(5,���������7KH�DGPLQLVWUDWLRQ�KDV�EHJXQ�LQVWDOOLQJ�RYHU���0:�RI�power on government land and buildings across the city, as well as investing in energy
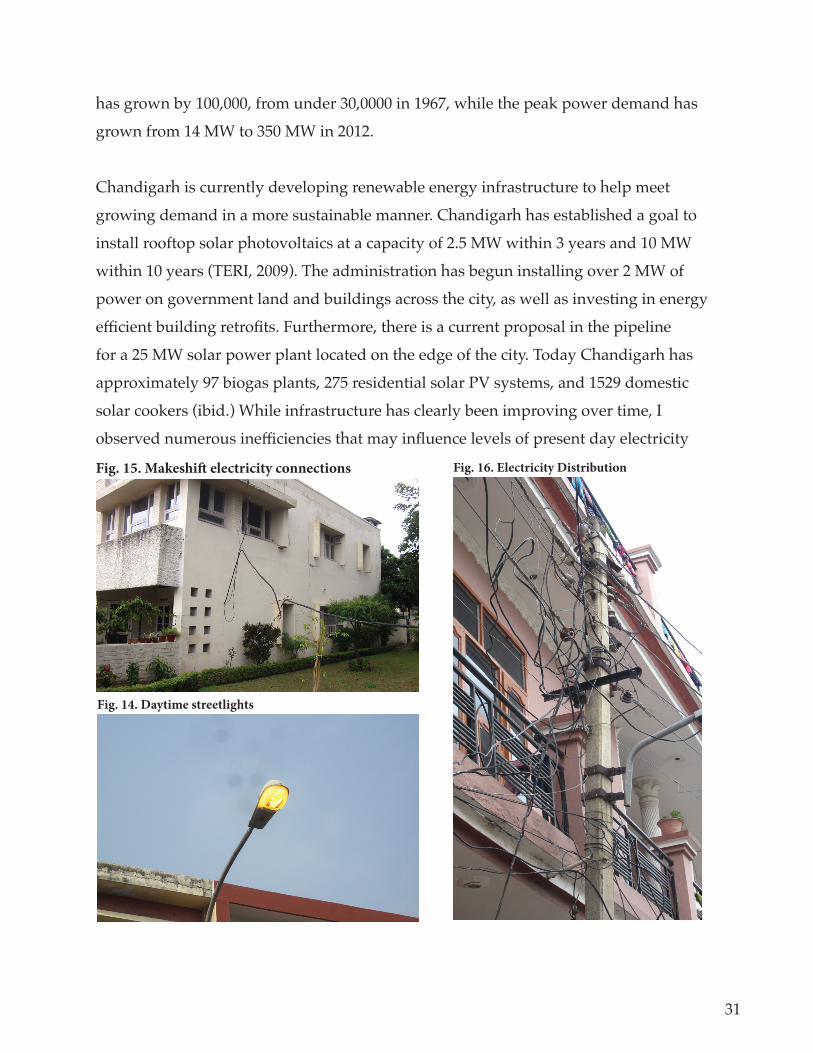
HFLHQW�EXLOGLQJ�UHWURÀWV��)XUWKHUPRUH��WKHUH�LV�D�FXUUHQW�SURSRVDO�LQ�WKH�SLSHOLQH�for a 25 MW solar power plant located on the edge of the city. Today Chandigarh has
DSSUR[LPDWHO\����ELRJDV�SODQWV������UHVLGHQWLDO�VRODU�39�V\VWHPV��DQG������GRPHVWLF�VRODU�FRRNHUV��LELG���:KLOH�LQIUDVWUXFWXUH�KDV�FOHDUO\�EHHQ�LPSURYLQJ�RYHU�WLPH��,�REVHUYHG�QXPHURXV�LQHFLHQFLHV�WKDW�PD\�LQÁXHQFH�OHYHOV�RI�SUHVHQW�GD\�HOHFWULFLW\�
Fig. 16. Electricity DistributionFig. 15. Makeshift electricity connections
Fig. 14. Daytime streetlights
32
FRQVXPSWLRQ�DQG�ZKLFK�OLNHO\�LQÁ�XHQFHG�KLVWRULF�FRQVXPSWLRQ��)RU�LQVWDQFH��,�REVHUYHG�HQWLUH�URZV�RI�VWUHHWOLJKWV�WKDW�ZHUH�LOOXPLQDWHG�GXULQJ�WKH�GD\WLPH��)LJ�������In addition, makeshift electrical connections into residences and businesses are common
�)LJ�������
LAND USE
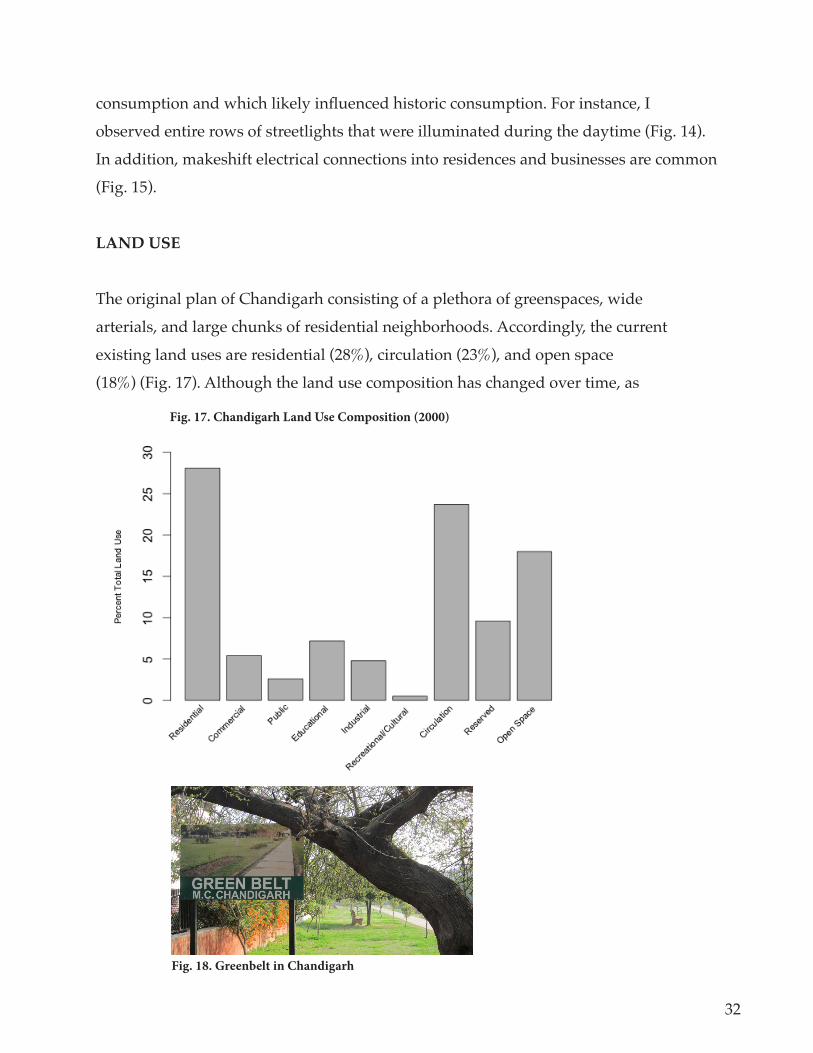
The original plan of Chandigarh consisting of a plethora of greenspaces, wide
arterials, and large chunks of residential neighborhoods. Accordingly, the current
H[LVWLQJ�ODQG�XVHV�DUH�UHVLGHQWLDO��������FLUFXODWLRQ��������DQG�RSHQ�VSDFH��������)LJ�������$OWKRXJK�WKH�ODQG�XVH�FRPSRVLWLRQ�KDV�FKDQJHG�RYHU�WLPH��DV�
Fig. 18. Greenbelt in Chandigarh
Fig. 17. Chandigarh Land Use Composition (2000)
33
commercial and industrial uses have developed, certain uses, such as open space and
residential areas have remained relatively unchanged. Yet, based upon observations
on the ground, the exact land use composition should not be trusted absolutely. For
example, some of the open space is appropriated by the informal sector, as people use
greenspaces to erect makeshift homes, as well as conduct commercial activities, such as
selling fruit or ironing clothes.
HOUSEHOLD BEHAVIOR
As economic growth fuels increases in personal income for the residents of Chandigarh,
electricity consumption of the residential sector will continue to grow, as people are
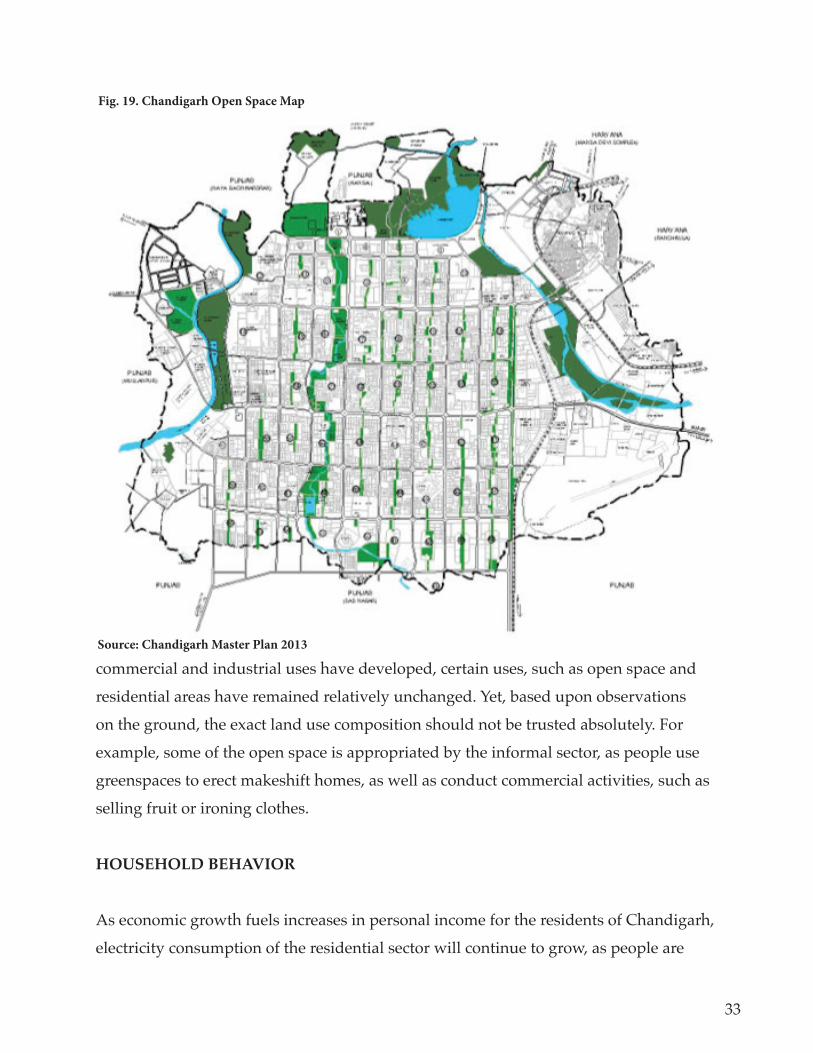
Fig. 19. Chandigarh Open Space Map
Source: Chandigarh Master Plan 2013
34
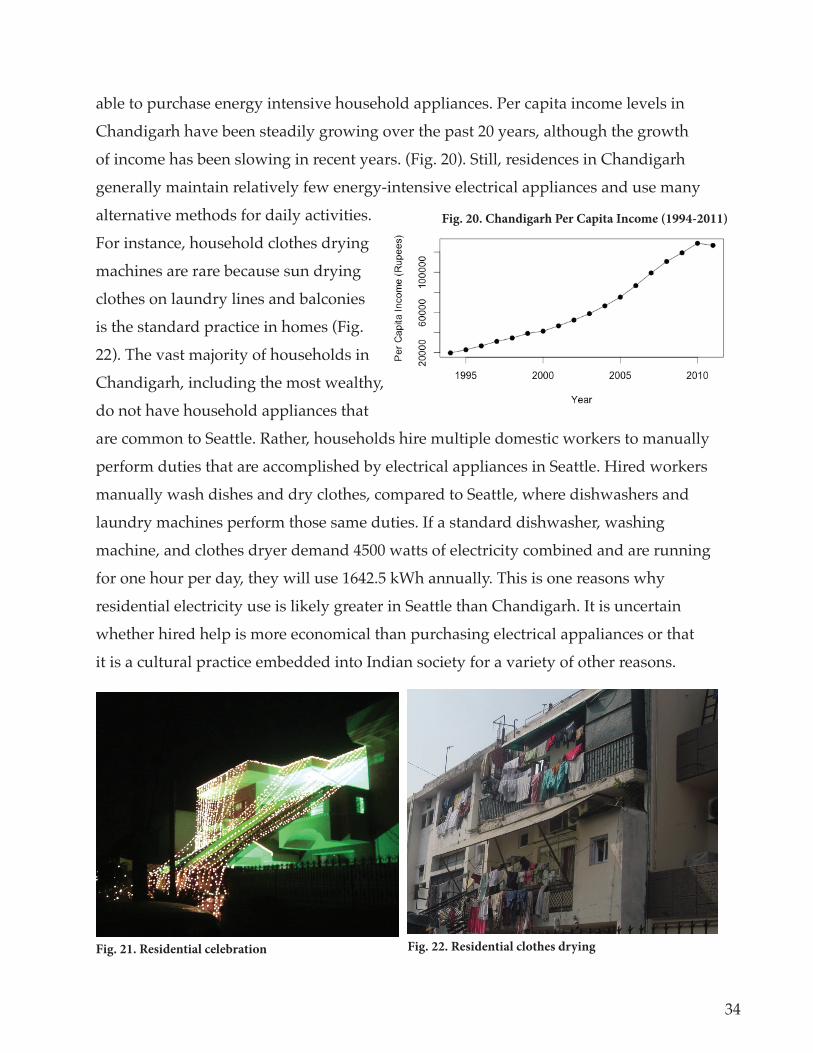
able to purchase energy intensive household appliances. Per capita income levels in
Chandigarh have been steadily growing over the past 20 years, although the growth
RI�LQFRPH�KDV�EHHQ�VORZLQJ�LQ�UHFHQW�\HDUV���)LJ�������6WLOO��UHVLGHQFHV�LQ�&KDQGLJDUK�generally maintain relatively few energy-intensive electrical appliances and use many
alternative methods for daily activities.
For instance, household clothes drying
machines are rare because sun drying
clothes on laundry lines and balconies
is the standard practice in homes (Fig.
�����7KH�YDVW�PDMRULW\�RI�KRXVHKROGV�LQ�Chandigarh, including the most wealthy,
do not have household appliances that
are common to Seattle. Rather, households hire multiple domestic workers to manually
perform duties that are accomplished by electrical appliances in Seattle. Hired workers
manually wash dishes and dry clothes, compared to Seattle, where dishwashers and
laundry machines perform those same duties. If a standard dishwasher, washing
machine, and clothes dryer demand 4500 watts of electricity combined and are running
for one hour per day, they will use 1642.5 kWh annually. This is one reasons why
residential electricity use is likely greater in Seattle than Chandigarh. It is uncertain
whether hired help is more economical than purchasing electrical appaliances or that
it is a cultural practice embedded into Indian society for a variety of other reasons.
Fig. 21. Residential celebration Fig. 22. Residential clothes drying
Fig. 20. Chandigarh Per Capita Income (1994-2011)
35
'LVKZDVKLQJ�PDFKLQHV�DUH�DOVR�VHHPLQJO\�UDUH��ZLWK�PDQXDO�ZDVKLQJ�EHLQJ�WKH�standard practice. While residential electricity use is predominantly modest, compared
to Seattle, there are intermittent electricity binges for weddings and holidays, in which
EXLOGLQJV�DUH�H[WUDYDJDQWO\�IXUQLVKHG�ZLWK�KDQJLQJ�OLJKWV��)LJ�������7KH�FRQWLQXHG�use of traditional fuels for heating and cooking also assists in dampening electricity
demand. These are mostly common in less wealthy households, who rely more on
organic matter for fuel.
URBAN FORM
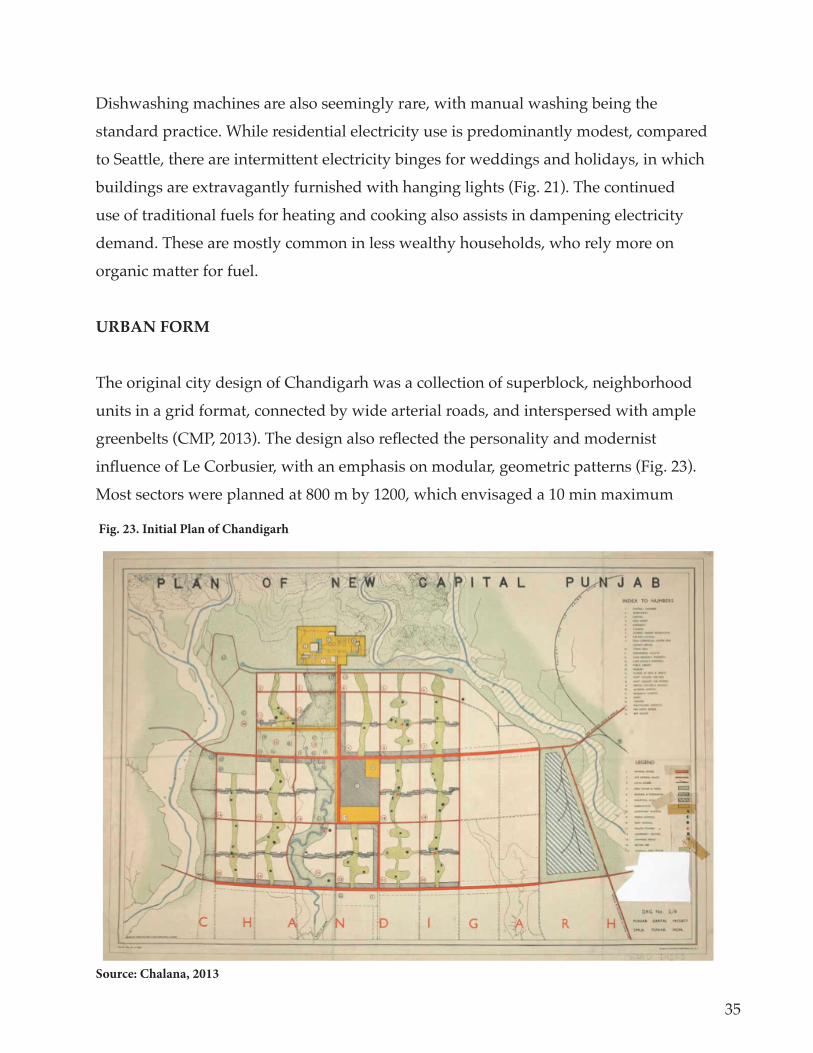
The original city design of Chandigarh was a collection of superblock, neighborhood
units in a grid format, connected by wide arterial roads, and interspersed with ample
JUHHQEHOWV��&03���������7KH�GHVLJQ�DOVR�UHÁ�HFWHG�WKH�SHUVRQDOLW\�DQG�PRGHUQLVW�LQÁ�XHQFH�RI�/H�&RUEXVLHU��ZLWK�DQ�HPSKDVLV�RQ�PRGXODU��JHRPHWULF�SDWWHUQV��)LJ�������Most sectors were planned at 800 m by 1200, which envisaged a 10 min maximum
Fig. 23. Initial Plan of Chandigarh
Source: Chalana, 2013
36
walking distance for residents to all basic amenities. The plan was based upon a
hierarchical distribution of population, where population density would increase in the
city from the north to south.
Today, Chandigarh is predominantly characterized by 2-4 story buildings, consisting
of both detached and non-attached apartment style buildings, aligned in an irregular
JULG�VKDSHG�SDWWHUQ��)LJ�������7KLV�VHHPV�WR�EH�WKH�SUHGRPLQDQW�XUEDQ�IRUP�WKURXJKRXW�the city. Yet, I also observed culdasac type urban design in sector 40, with low rise
buildings arranged in a ring around parking and street space in the center (Fig.
�����7KHUH�LV�DOVR�GHQVH��WUDGLWLRQDO�,QGLDQ�GHYHORSPHQW�LQ�VHYHUDO�YLOODJHV�WKDW�DUH�ZLWKLQ�&KDQGLJDUK��VXFK�%XWHUOD��ZKLFK�LV�ORFDWHG�QHDU�VHFWRU�����)LJ�������7KHVH�neighborhoods have taller buildings and very narrower streets. There are also several
FRPPHUFLDO�FHQWHUV��VXFK�DV�VHFWRU�����ZKHUH�EXLOGLQJ�KHLJKWV�DUH�����VWRULHV�DQG�density of buildings and people is much higher. Although building height is often an
Fig. 24. Predominant urban form
Fig. 26. Culd-a-sac type urban form in
FIg. 27. More dense urban form in Buterla
Fig. 25. Below ground markets

��
indication of density, this is not always the case. There are a numerous below-ground
PDUNHWV�LQ�&KDQGLJDUK��)LJ�������
CLIMATE
Chandigarh resides at the edge of the Shivalik foothills at 304-365 meters above sea
OHYHO�EHWZHHQ������·�ODWLWXGH�QRUWK�DQG������·�ORQJLWXGH�HDVW��3DXO����������7KH�FOLPDWH�of Chandigarh is characterized by cold dry winters, hot summers, and a subtropical
PRQVRRQ�VHDVRQ��&03���������$YHUDJH�DQQXDO�WHPSHUDWXUHV�UDQJH�EHWZHHQ������GHJUHHV�&HOVLXV�DQG�UDLQIDOO�EHWZHHQ���������PP��7KHUH�DUH�IRXU�JHQHUDO�VHDVRQV��ZLQWHU�IURP�November through February, summer from March to June, monsoon from June to
September, and post-monsoon from September to November.
Paul et al, assessed climate change in Chandigarh by analyzing long-term variability
LQ�WHPSHUDWXUHV�DQG�SUHFLSLWDWLRQ�LQ�WKH�FLW\�IURP������������3DXO���������7KH�DXWKRUV·�analysis demonstrates that during this time period Chandigarh was getting warmer in
terms of minimum temperature, extreme weather events were generally decreasing, and
annual rainfall show increasing trends. Additionally, the authors observed decreasing
trends in mean maximum temperatures, increases in foggy days, and decreases in
PRQWKO\�UDLQIDOO�LQ�DOO�PRQWKV�H[FHSW�-XQH��6HSWHPEHU��DQG�'HFHPEHU��7KH�JUDSK�EHORZ�summarizes the minimum and maximum high and low temperature estimates from
1982-2009. Fig. 28. Chandigarh Average Temperature (1982-2009)
Source: Paul, 2013
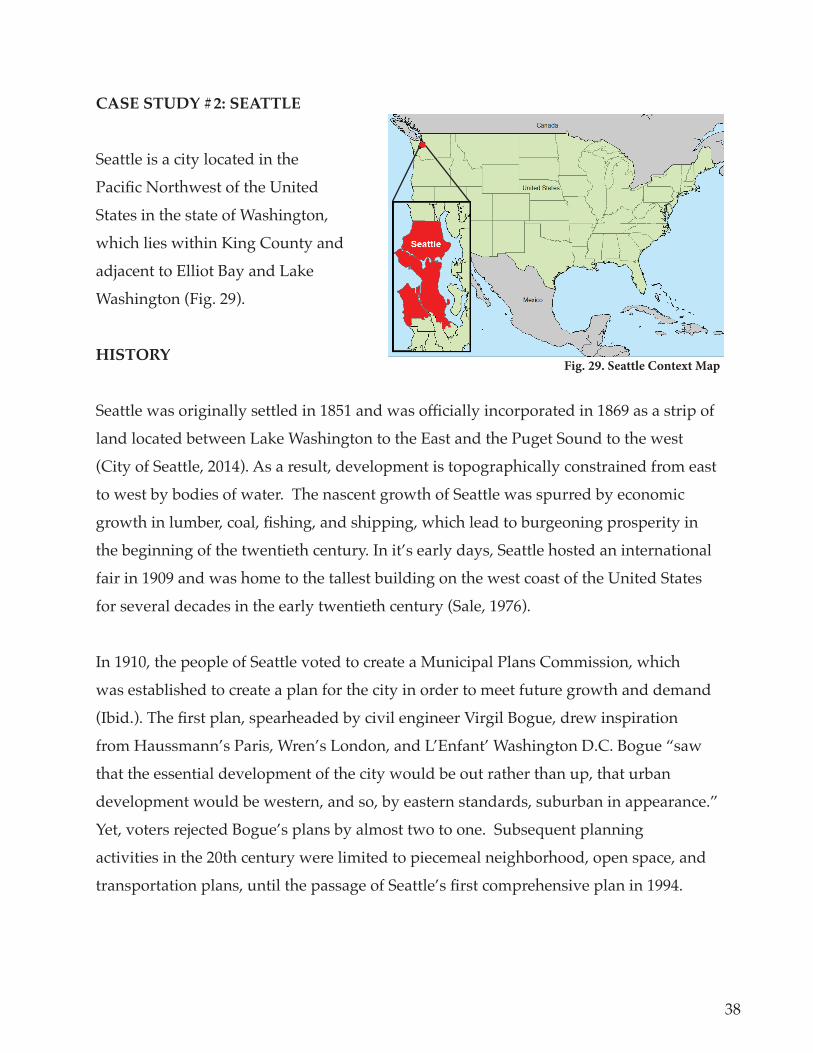
38
CASE STUDY #2: SEATTLE
Seattle is a city located in the
3DFLÀF�1RUWKZHVW�RI�WKH�8QLWHG�States in the state of Washington,
which lies within King County and
adjacent to Elliot Bay and Lake
:DVKLQJWRQ��)LJ������
HISTORY
6HDWWOH�ZDV�RULJLQDOO\�VHWWOHG�LQ������DQG�ZDV�RFLDOO\�LQFRUSRUDWHG�LQ������DV�D�VWULS�RI�land located between Lake Washington to the East and the Puget Sound to the west
�&LW\�RI�6HDWWOH���������$V�D�UHVXOW��GHYHORSPHQW�LV�WRSRJUDSKLFDOO\�FRQVWUDLQHG�IURP�HDVW�to west by bodies of water. The nascent growth of Seattle was spurred by economic
JURZWK�LQ�OXPEHU��FRDO��ÀVKLQJ��DQG�VKLSSLQJ��ZKLFK�OHDG�WR�EXUJHRQLQJ�SURVSHULW\�LQ�the beginning of the twentieth century. In it’s early days, Seattle hosted an international
fair in 1909 and was home to the tallest building on the west coast of the United States
IRU�VHYHUDO�GHFDGHV�LQ�WKH�HDUO\�WZHQWLHWK�FHQWXU\��6DOH���������
In 1910, the people of Seattle voted to create a Municipal Plans Commission, which
was established to create a plan for the city in order to meet future growth and demand
�,ELG����7KH�ÀUVW�SODQ��VSHDUKHDGHG�E\�FLYLO�HQJLQHHU�9LUJLO�%RJXH��GUHZ�LQVSLUDWLRQ�IURP�+DXVVPDQQ·V�3DULV��:UHQ·V�/RQGRQ��DQG�/·(QIDQW·�:DVKLQJWRQ�'�&��%RJXH�´VDZ�that the essential development of the city would be out rather than up, that urban
development would be western, and so, by eastern standards, suburban in appearance.”
Yet, voters rejected Bogue’s plans by almost two to one. Subsequent planning
activities in the 20th century were limited to piecemeal neighborhood, open space, and
WUDQVSRUWDWLRQ�SODQV��XQWLO�WKH�SDVVDJH�RI�6HDWWOH·V�ÀUVW�FRPSUHKHQVLYH�SODQ�LQ������
Fig. 29. Seattle Context Map
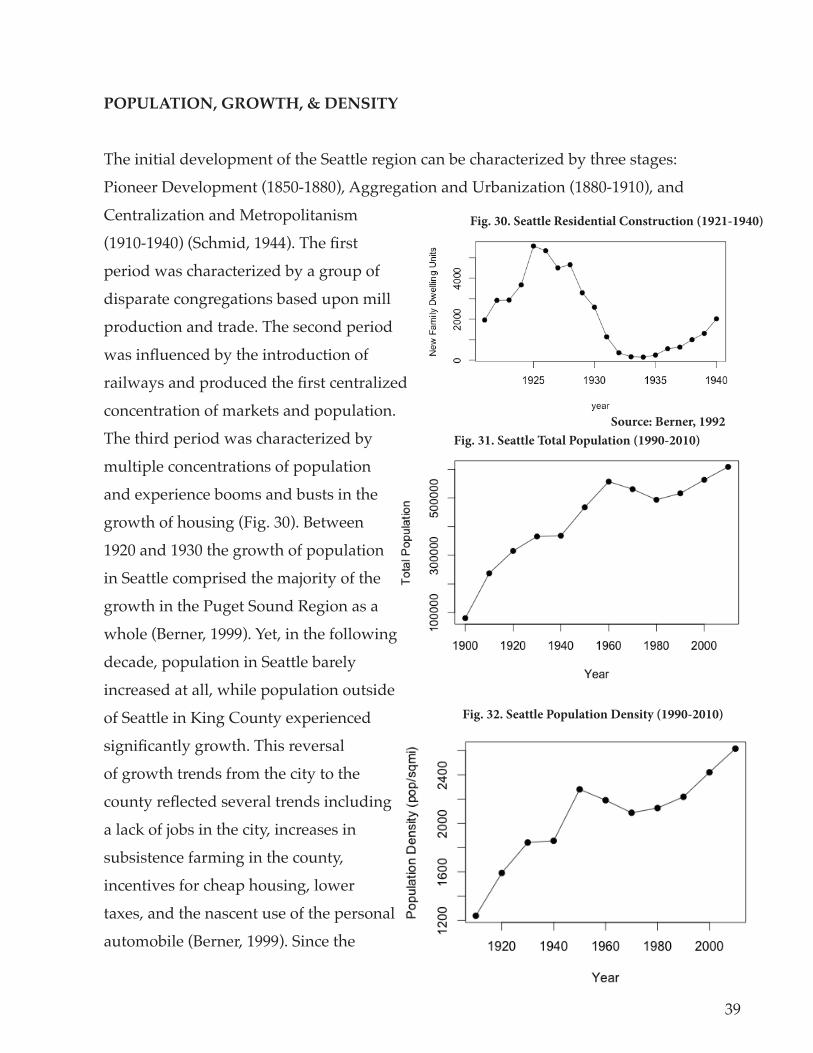
39
POPULATION, GROWTH, & DENSITY
The initial development of the Seattle region can be characterized by three stages:
3LRQHHU�'HYHORSPHQW��������������$JJUHJDWLRQ�DQG�8UEDQL]DWLRQ��������������DQG�Centralization and Metropolitanism
�������������6FKPLG���������7KH�À�UVW�period was characterized by a group of
disparate congregations based upon mill
production and trade. The second period
ZDV�LQÁ�XHQFHG�E\�WKH�LQWURGXFWLRQ�RI�UDLOZD\V�DQG�SURGXFHG�WKH�À�UVW�FHQWUDOL]HG�concentration of markets and population.
The third period was characterized by
multiple concentrations of population
and experience booms and busts in the
JURZWK�RI�KRXVLQJ��)LJ�������%HWZHHQ�1920 and 1930 the growth of population
in Seattle comprised the majority of the
growth in the Puget Sound Region as a
ZKROH��%HUQHU���������<HW��LQ�WKH�IROORZLQJ�decade, population in Seattle barely
increased at all, while population outside
of Seattle in King County experienced
VLJQLÀ�FDQWO\�JURZWK��7KLV�UHYHUVDO�of growth trends from the city to the
FRXQW\�UHÁ�HFWHG�VHYHUDO�WUHQGV�LQFOXGLQJ�a lack of jobs in the city, increases in
subsistence farming in the county,
incentives for cheap housing, lower
taxes, and the nascent use of the personal
DXWRPRELOH��%HUQHU���������6LQFH�WKH�
Fig. 30. Seattle Residential Construction (1921-1940)
Source: Berner, 1992Fig. 31. Seattle Total Population (1990-2010)
Fig. 32. Seattle Population Density (1990-2010)
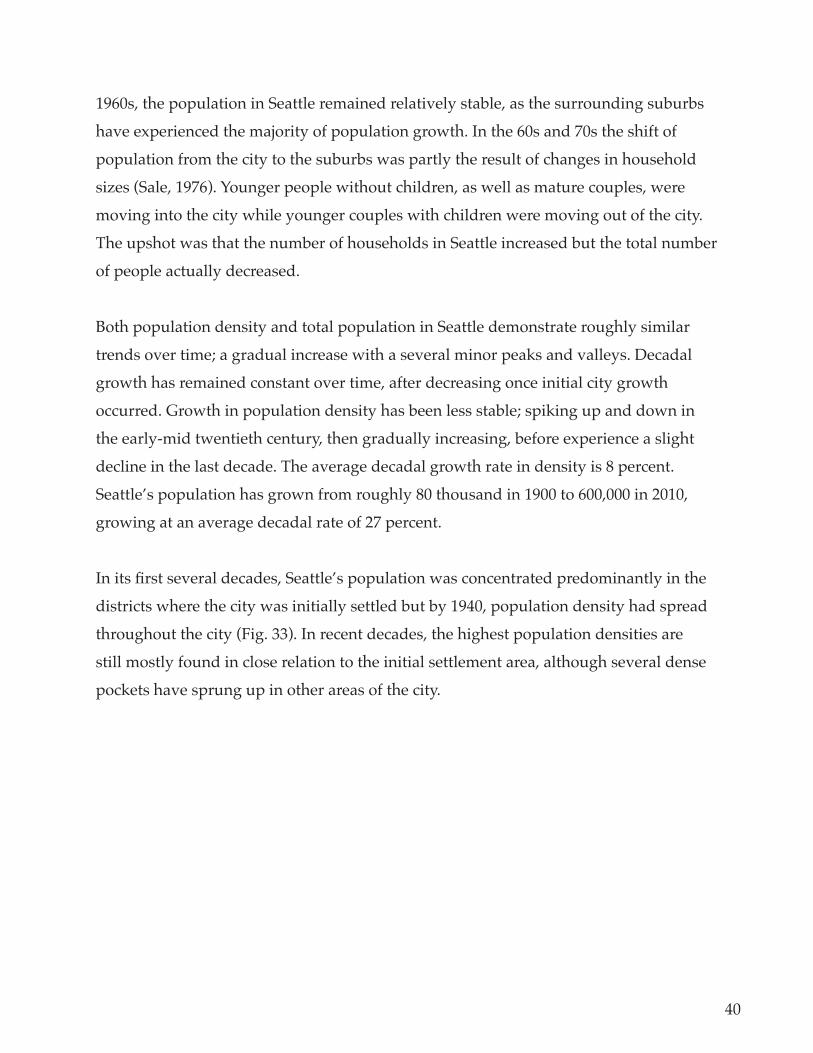
40
1960s, the population in Seattle remained relatively stable, as the surrounding suburbs
KDYH�H[SHULHQFHG�WKH�PDMRULW\�RI�SRSXODWLRQ�JURZWK��,Q�WKH���V�DQG���V�WKH�VKLIW�RI�population from the city to the suburbs was partly the result of changes in household
VL]HV��6DOH���������<RXQJHU�SHRSOH�ZLWKRXW�FKLOGUHQ��DV�ZHOO�DV�PDWXUH�FRXSOHV��ZHUH�moving into the city while younger couples with children were moving out of the city.
The upshot was that the number of households in Seattle increased but the total number
of people actually decreased.
Both population density and total population in Seattle demonstrate roughly similar
WUHQGV�RYHU�WLPH��D�JUDGXDO�LQFUHDVH�ZLWK�D�VHYHUDO�PLQRU�SHDNV�DQG�YDOOH\V��'HFDGDO�growth has remained constant over time, after decreasing once initial city growth
occurred. Growth in population density has been less stable; spiking up and down in
the early-mid twentieth century, then gradually increasing, before experience a slight
decline in the last decade. The average decadal growth rate in density is 8 percent.
Seattle’s population has grown from roughly 80 thousand in 1900 to 600,000 in 2010,
JURZLQJ�DW�DQ�DYHUDJH�GHFDGDO�UDWH�RI����SHUFHQW�
,Q�LWV�ÀUVW�VHYHUDO�GHFDGHV��6HDWWOH·V�SRSXODWLRQ�ZDV�FRQFHQWUDWHG�SUHGRPLQDQWO\�LQ�WKH�districts where the city was initially settled but by 1940, population density had spread
WKURXJKRXW�WKH�FLW\��)LJ�������,Q�UHFHQW�GHFDGHV��WKH�KLJKHVW�SRSXODWLRQ�GHQVLWLHV�DUH�still mostly found in close relation to the initial settlement area, although several dense
pockets have sprung up in other areas of the city.
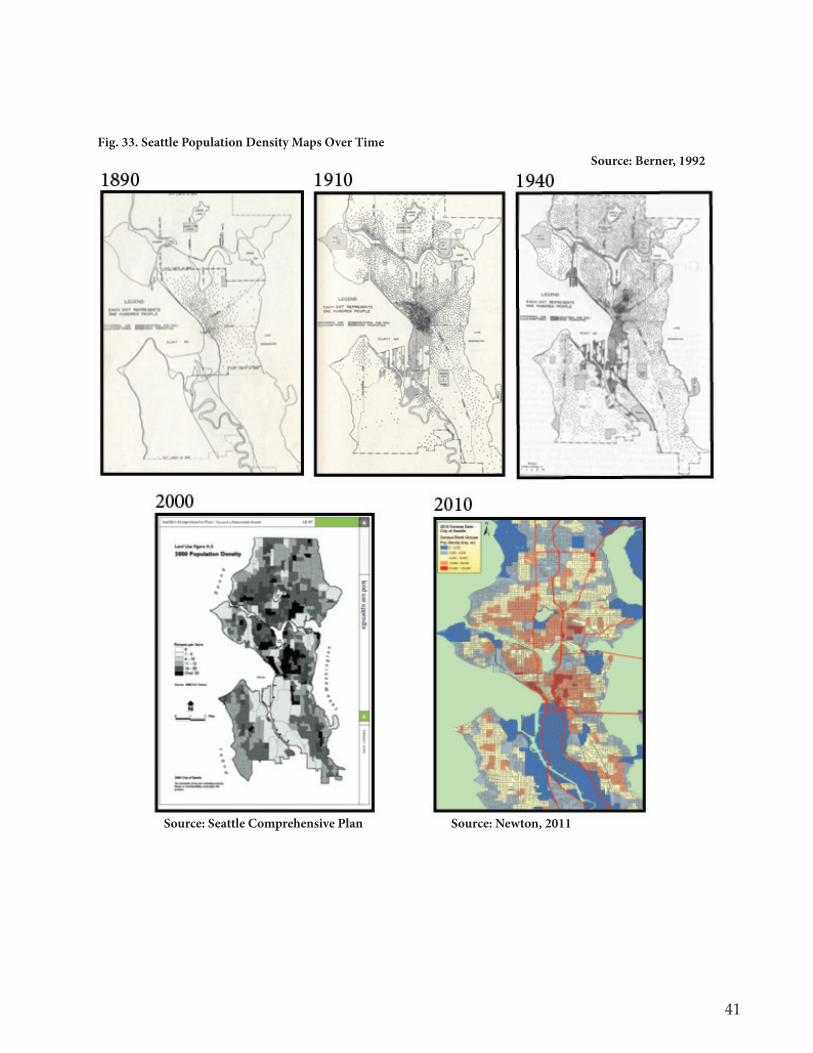
41
Source: Seattle Comprehensive Plan Source: Newton, 2011
Source: Berner, 1992Fig. 33. Seattle Population Density Maps Over Time

42
ELECTRICITY CONSUMPTION
'XULQJ�WKH�EHJLQQLQJ�RI�WKH�WZHQWLHWK�FHQWXU\��a growing population increased pressure for
widespread and reliable electricity services
�%HUQHU���������$W�WKLV�WLPH��PXQLFLSDO�HOHFWULFLW\�demand in Seattle, and the rest of the U.S.,
was substantively related to the use of electric
powered streetcars. In addition to streetcars,
the commercial and industrial sectors were the
predominant consumers of electricity, with
the domestic sector playing a minimal role. By
1920s the composition of city-wide electricity
consumption in Seattle began to change as
KRPH�HOHFWULÀ�FDWLRQ�SUROLIHUDWHG��7KH�QXPEHU�RI�domestic electric ranges in Seattle increased from
������LQ������WR��������LQ�������)LJ�������%HUQHU���������,Q�WKH�����V��FHQWUDO�KHDWLQJ�LQ�EXLOGLQJV�was limited to a small but growing proportion of
WKH�SRSXODWLRQ��)LJ�������'XULQJ�WKLV�WLPH�RWKHU�electric appliances, such as toasters and radios,
EHFDPH�DͿ�RUGDEOH�WR�DOO�LQFRPH�FODVVHV�DQG�became increasingly found in more homes. In
1921, Seattle City Light had 63,000 customers and
roughly 50 percent of their electricity consumption
was generated from the Lake Union Steam Plant.
As electricity consumption was trending upward,
City Light responding by expanding the electricity
infrastructure by developing the Skagit River
Hydroelectricity facilities. In the 1940s, expansion
Fig. 36. Seattle Units With Central Heating (1940)
Source: Berner, 1992
Fig. 35 Electricity Sales (1939-1950)
Fig. 34. Installed Electric Ranges (1922-1930)
Source: Berner, 1992
Source: Berner, 1992
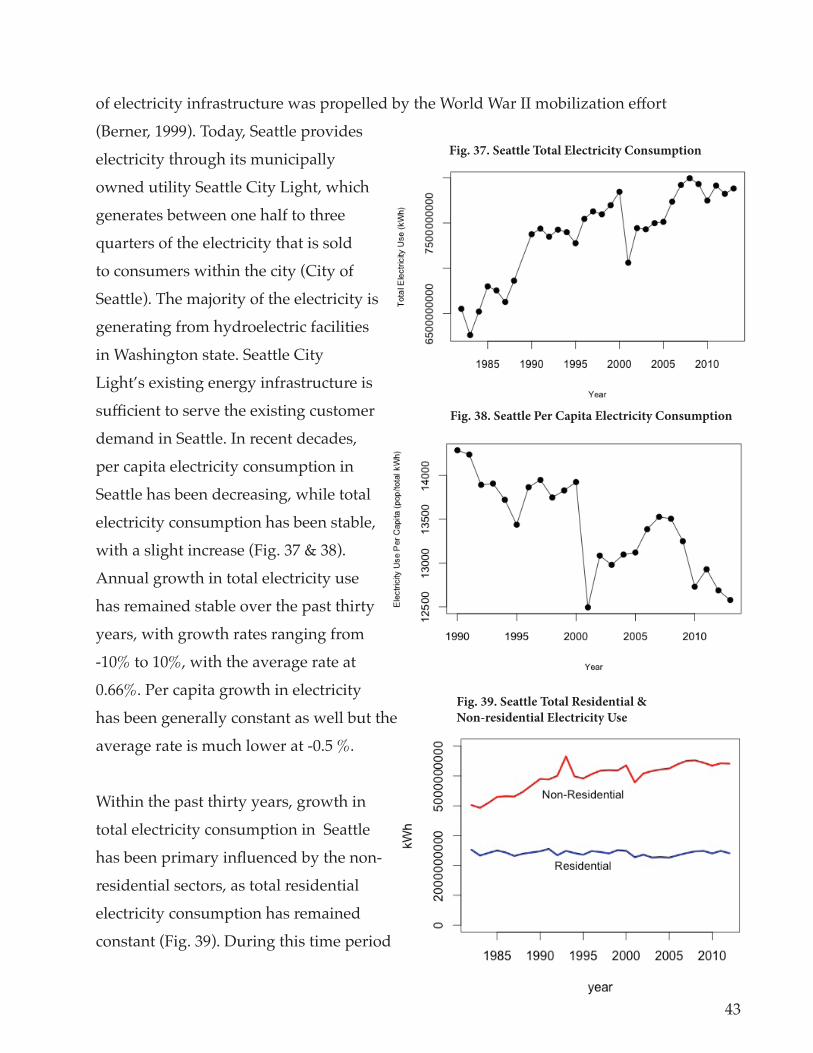
43
RI�HOHFWULFLW\�LQIUDVWUXFWXUH�ZDV�SURSHOOHG�E\�WKH�:RUOG�:DU�,,�PRELOL]DWLRQ�HͿ�RUW��%HUQHU���������7RGD\��6HDWWOH�SURYLGHV�electricity through its municipally
owned utility Seattle City Light, which
generates between one half to three
quarters of the electricity that is sold
to consumers within the city (City of
6HDWWOH���7KH�PDMRULW\�RI�WKH�HOHFWULFLW\�LV�generating from hydroelectric facilities
in Washington state. Seattle City
Light’s existing energy infrastructure is
VX��FLHQW�WR�VHUYH�WKH�H[LVWLQJ�FXVWRPHU�demand in Seattle. In recent decades,
per capita electricity consumption in
Seattle has been decreasing, while total
electricity consumption has been stable,
ZLWK�D�VOLJKW�LQFUHDVH��)LJ�����������Annual growth in total electricity use
has remained stable over the past thirty
years, with growth rates ranging from
�����WR������ZLWK�WKH�DYHUDJH�UDWH�DW��������3HU�FDSLWD�JURZWK�LQ�HOHFWULFLW\�has been generally constant as well but the
DYHUDJH�UDWH�LV�PXFK�ORZHU�DW��������
Within the past thirty years, growth in
total electricity consumption in Seattle
KDV�EHHQ�SULPDU\�LQÁ�XHQFHG�E\�WKH�QRQ��residential sectors, as total residential
electricity consumption has remained
FRQVWDQW��)LJ�������'XULQJ�WKLV�WLPH�SHULRG�
Fig. 37. Seattle Total Electricity Consumption
Fig. 38. Seattle Per Capita Electricity Consumption
Fig. 39. Seattle Total Residential & Non-residential Electricity Use
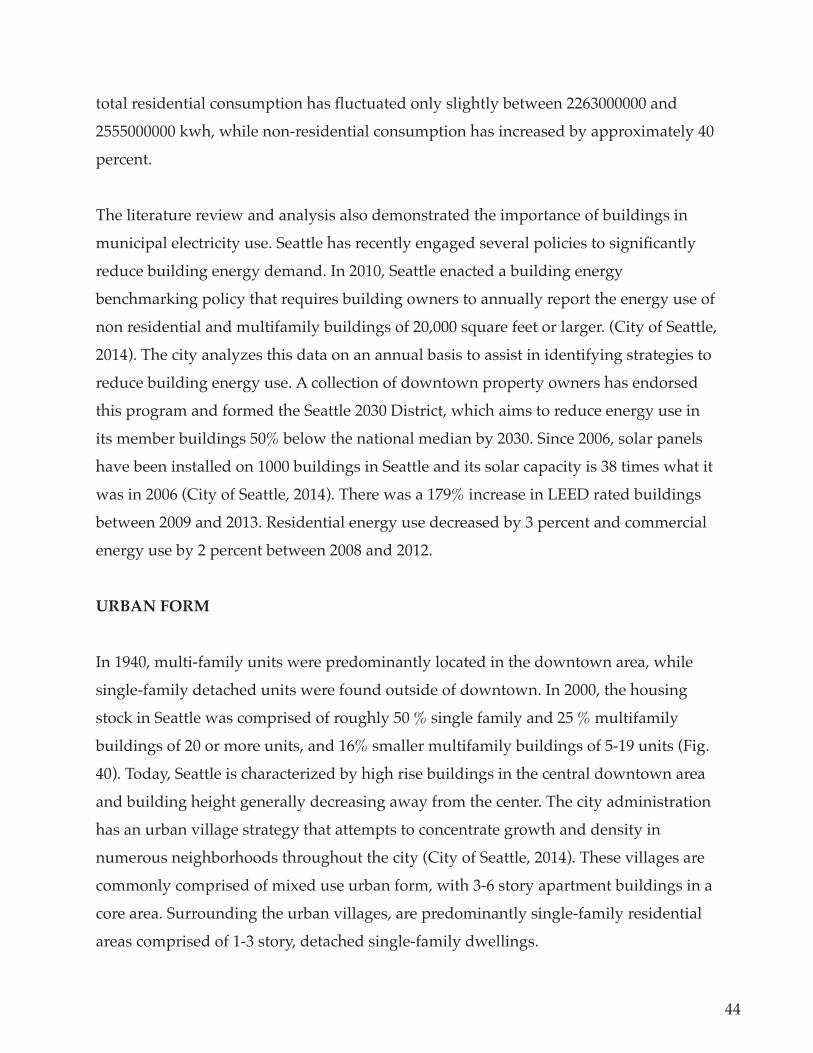
44
WRWDO�UHVLGHQWLDO�FRQVXPSWLRQ�KDV�ÁXFWXDWHG�RQO\�VOLJKWO\�EHWZHHQ������������DQG�2555000000 kwh, while non-residential consumption has increased by approximately 40
percent.
The literature review and analysis also demonstrated the importance of buildings in
PXQLFLSDO�HOHFWULFLW\�XVH��6HDWWOH�KDV�UHFHQWO\�HQJDJHG�VHYHUDO�SROLFLHV�WR�VLJQLÀFDQWO\�reduce building energy demand. In 2010, Seattle enacted a building energy
benchmarking policy that requires building owners to annually report the energy use of
non residential and multifamily buildings of 20,000 square feet or larger. (City of Seattle,
�������7KH�FLW\�DQDO\]HV�WKLV�GDWD�RQ�DQ�DQQXDO�EDVLV�WR�DVVLVW�LQ�LGHQWLI\LQJ�VWUDWHJLHV�WR�reduce building energy use. A collection of downtown property owners has endorsed
WKLV�SURJUDP�DQG�IRUPHG�WKH�6HDWWOH������'LVWULFW��ZKLFK�DLPV�WR�UHGXFH�HQHUJ\�XVH�LQ�LWV�PHPEHU�EXLOGLQJV�����EHORZ�WKH�QDWLRQDO�PHGLDQ�E\�������6LQFH�������VRODU�SDQHOV�have been installed on 1000 buildings in Seattle and its solar capacity is 38 times what it
ZDV�LQ�������&LW\�RI�6HDWWOH���������7KHUH�ZDV�D������LQFUHDVH�LQ�/(('�UDWHG�EXLOGLQJV�between 2009 and 2013. Residential energy use decreased by 3 percent and commercial
energy use by 2 percent between 2008 and 2012.
URBAN FORM
In 1940, multi-family units were predominantly located in the downtown area, while
single-family detached units were found outside of downtown. In 2000, the housing
VWRFN�LQ�6HDWWOH�ZDV�FRPSULVHG�RI�URXJKO\������VLQJOH�IDPLO\�DQG������PXOWLIDPLO\�EXLOGLQJV�RI����RU�PRUH�XQLWV��DQG�����VPDOOHU�PXOWLIDPLO\�EXLOGLQJV�RI������XQLWV��)LJ�������7RGD\��6HDWWOH�LV�FKDUDFWHUL]HG�E\�KLJK�ULVH�EXLOGLQJV�LQ�WKH�FHQWUDO�GRZQWRZQ�DUHD�and building height generally decreasing away from the center. The city administration
has an urban village strategy that attempts to concentrate growth and density in
QXPHURXV�QHLJKERUKRRGV�WKURXJKRXW�WKH�FLW\��&LW\�RI�6HDWWOH���������7KHVH�YLOODJHV�DUH�commonly comprised of mixed use urban form, with 3-6 story apartment buildings in a
core area. Surrounding the urban villages, are predominantly single-family residential
areas comprised of 1-3 story, detached single-family dwellings.

45
LAND USE
$W�SUHVHQW�WRGD\��ODQG�XVH�LQ�6HDWWOH�FRPSULVHV�����VLQJOH�IDPLO\�UHVLGHQWLDO������5LJKW�RI�:D\��DQG�����SDUNV�DQG�RSHQ�VSDFH��)LJ������&LW\�6HDWWOH����������7KH�DUHD�RI�RSHQ�space in Seattle increased from 2960 acres in 1960 to 4545 acres in 2012 (City of Seattle,
�������
Fig. 40. Seattle Housing Types (2000)
Fig. 41. Seattle Land Use Composition (2003)
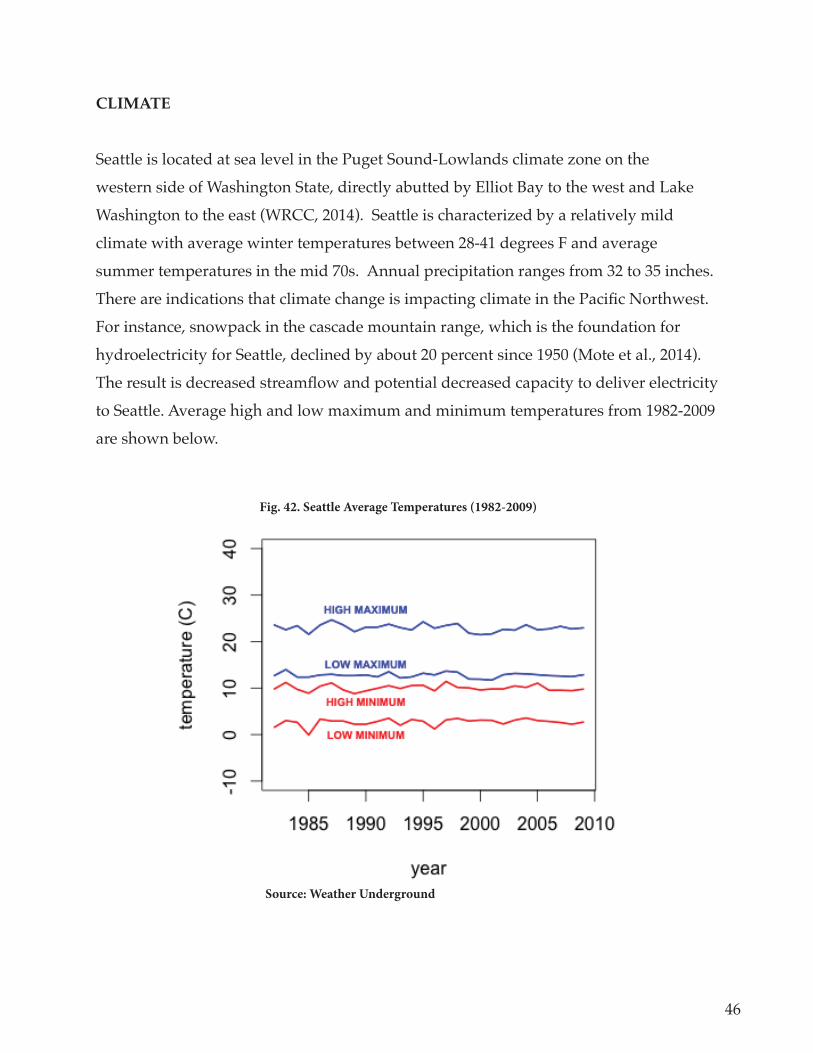
46
CLIMATE
Seattle is located at sea level in the Puget Sound-Lowlands climate zone on the
western side of Washington State, directly abutted by Elliot Bay to the west and Lake
:DVKLQJWRQ�WR�WKH�HDVW��:5&&����������6HDWWOH�LV�FKDUDFWHUL]HG�E\�D�UHODWLYHO\�PLOG�climate with average winter temperatures between 28-41 degrees F and average
VXPPHU�WHPSHUDWXUHV�LQ�WKH�PLG���V���$QQXDO�SUHFLSLWDWLRQ�UDQJHV�IURP����WR����LQFKHV���7KHUH�DUH�LQGLFDWLRQV�WKDW�FOLPDWH�FKDQJH�LV�LPSDFWLQJ�FOLPDWH�LQ�WKH�3DFLÀ�F�1RUWKZHVW��For instance, snowpack in the cascade mountain range, which is the foundation for
K\GURHOHFWULFLW\�IRU�6HDWWOH��GHFOLQHG�E\�DERXW����SHUFHQW�VLQFH�������0RWH�HW�DO����������7KH�UHVXOW�LV�GHFUHDVHG�VWUHDPÁ�RZ�DQG�SRWHQWLDO�GHFUHDVHG�FDSDFLW\�WR�GHOLYHU�HOHFWULFLW\�to Seattle. Average high and low maximum and minimum temperatures from 1982-2009
are shown below.
Fig. 42. Seattle Average Temperatures (1982-2009)
Source: Weather Underground
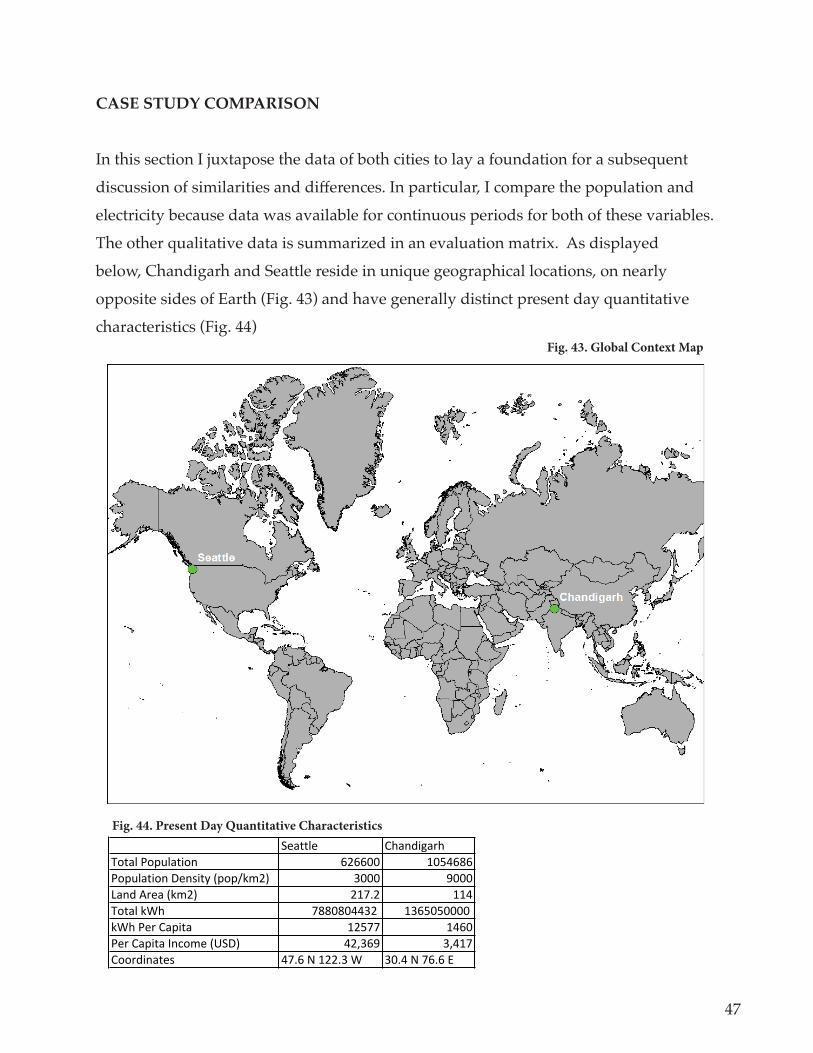
��
CASE STUDY COMPARISON
In this section I juxtapose the data of both cities to lay a foundation for a subsequent
GLVFXVVLRQ�RI�VLPLODULWLHV�DQG�GLͿHUHQFHV��,Q�SDUWLFXODU��,�FRPSDUH�WKH�SRSXODWLRQ�DQG�electricity because data was available for continuous periods for both of these variables.
The other qualitative data is summarized in an evaluation matrix. As displayed
below, Chandigarh and Seattle reside in unique geographical locations, on nearly
RSSRVLWH�VLGHV�RI�(DUWK��)LJ������DQG�KDYH�JHQHUDOO\�GLVWLQFW�SUHVHQW�GD\�TXDQWLWDWLYH�FKDUDFWHULVWLFV��)LJ�����
������ ������������������������� -)--'' (',+-/-������������������#���"��)$ *''' 0'''����������#��)$ )(.!) ((+������� �� .//'/'++*) (*-,',''''� ������������ (),.. (+-'�����������������#��$ +) *-0 * +(.����������� +.!-���())!*� *'!+���.-!-��
Fig. 44. Present Day Quantitative Characteristics
Fig. 43. Global Context Map
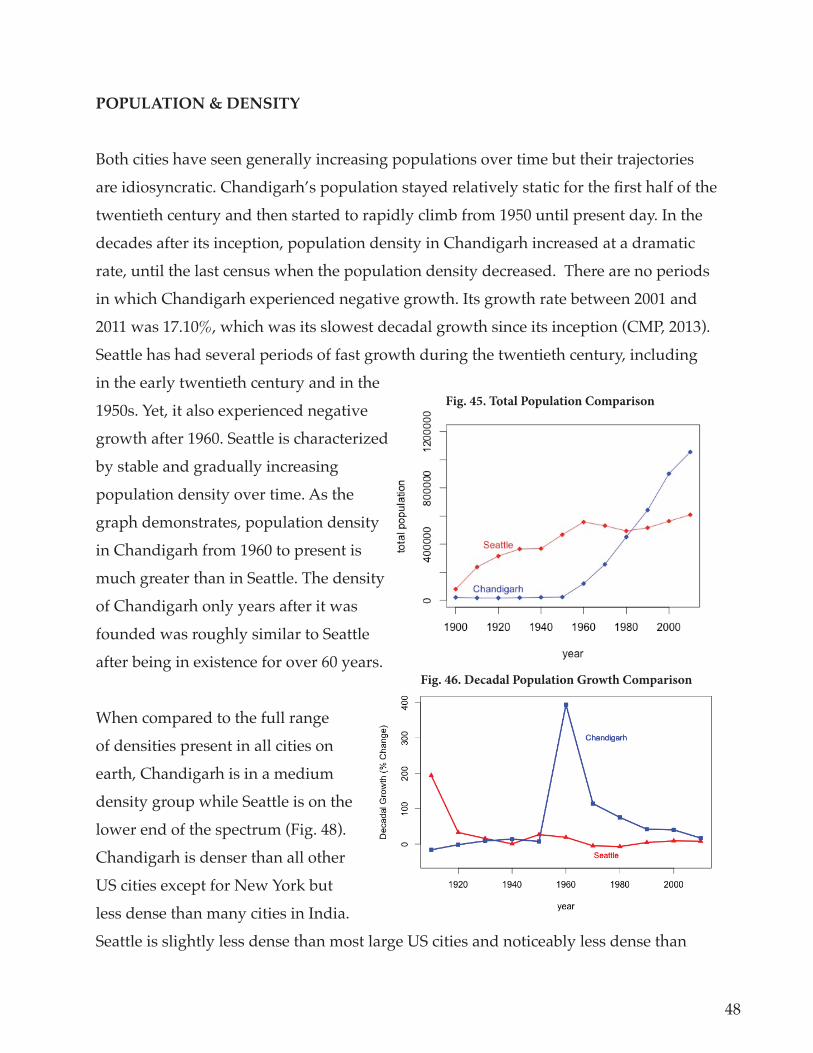
48
POPULATION & DENSITY
Both cities have seen generally increasing populations over time but their trajectories
DUH�LGLRV\QFUDWLF��&KDQGLJDUK·V�SRSXODWLRQ�VWD\HG�UHODWLYHO\�VWDWLF�IRU�WKH�À�UVW�KDOI�RI�WKH�twentieth century and then started to rapidly climb from 1950 until present day. In the
decades after its inception, population density in Chandigarh increased at a dramatic
rate, until the last census when the population density decreased. There are no periods
in which Chandigarh experienced negative growth. Its growth rate between 2001 and
�����ZDV���������ZKLFK�ZDV�LWV�VORZHVW�GHFDGDO�JURZWK�VLQFH�LWV�LQFHSWLRQ��&03���������Seattle has had several periods of fast growth during the twentieth century, including
in the early twentieth century and in the
1950s. Yet, it also experienced negative
growth after 1960. Seattle is characterized
by stable and gradually increasing
population density over time. As the
graph demonstrates, population density
in Chandigarh from 1960 to present is
much greater than in Seattle. The density
of Chandigarh only years after it was
founded was roughly similar to Seattle
after being in existence for over 60 years.
When compared to the full range
of densities present in all cities on
earth, Chandigarh is in a medium
density group while Seattle is on the
ORZHU�HQG�RI�WKH�VSHFWUXP��)LJ�������Chandigarh is denser than all other
US cities except for New York but
less dense than many cities in India.
Seattle is slightly less dense than most large US cities and noticeably less dense than
Fig. 46. Decadal Population Growth Comparison
Fig. 45. Total Population Comparison

49
most Indian cities. Even compared to
other similar sized cities in the US
west, Seattle is still not that dense
�'HPRJUDSKLD���������
Fig. 47. Population Density Comparison
Fig. 48. Population densities of cities around the world
Graphic adapated from cija.ca
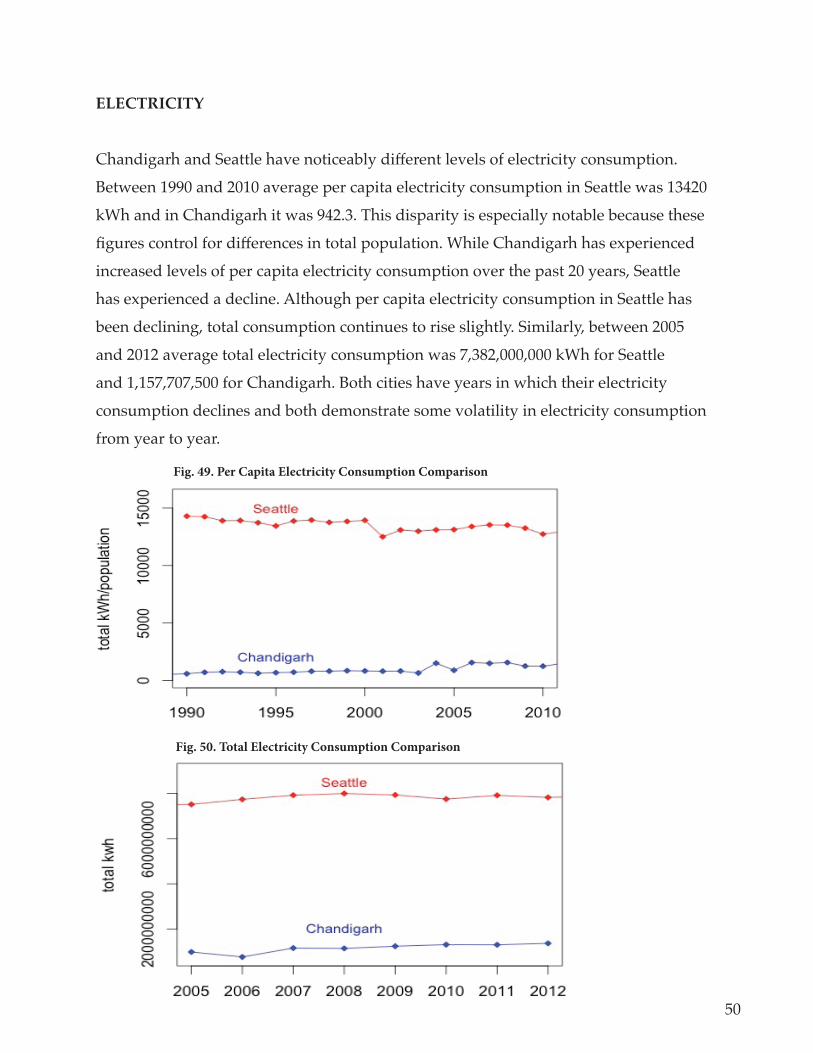
50
ELECTRICITY
&KDQGLJDUK�DQG�6HDWWOH�KDYH�QRWLFHDEO\�GLͿHUHQW�OHYHOV�RI�HOHFWULFLW\�FRQVXPSWLRQ��Between 1990 and 2010 average per capita electricity consumption in Seattle was 13420
kWh and in Chandigarh it was 942.3. This disparity is especially notable because these
ÀJXUHV�FRQWURO�IRU�GLͿHUHQFHV�LQ�WRWDO�SRSXODWLRQ��:KLOH�&KDQGLJDUK�KDV�H[SHULHQFHG�increased levels of per capita electricity consumption over the past 20 years, Seattle
has experienced a decline. Although per capita electricity consumption in Seattle has
been declining, total consumption continues to rise slightly. Similarly, between 2005
DQG������DYHUDJH�WRWDO�HOHFWULFLW\�FRQVXPSWLRQ�ZDV���������������N:K�IRU�6HDWWOH�DQG���������������IRU�&KDQGLJDUK��%RWK�FLWLHV�KDYH�\HDUV�LQ�ZKLFK�WKHLU�HOHFWULFLW\�consumption declines and both demonstrate some volatility in electricity consumption
from year to year.
Fig. 50. Total Electricity Consumption Comparison
Fig. 49. Per Capita Electricity Consumption Comparison
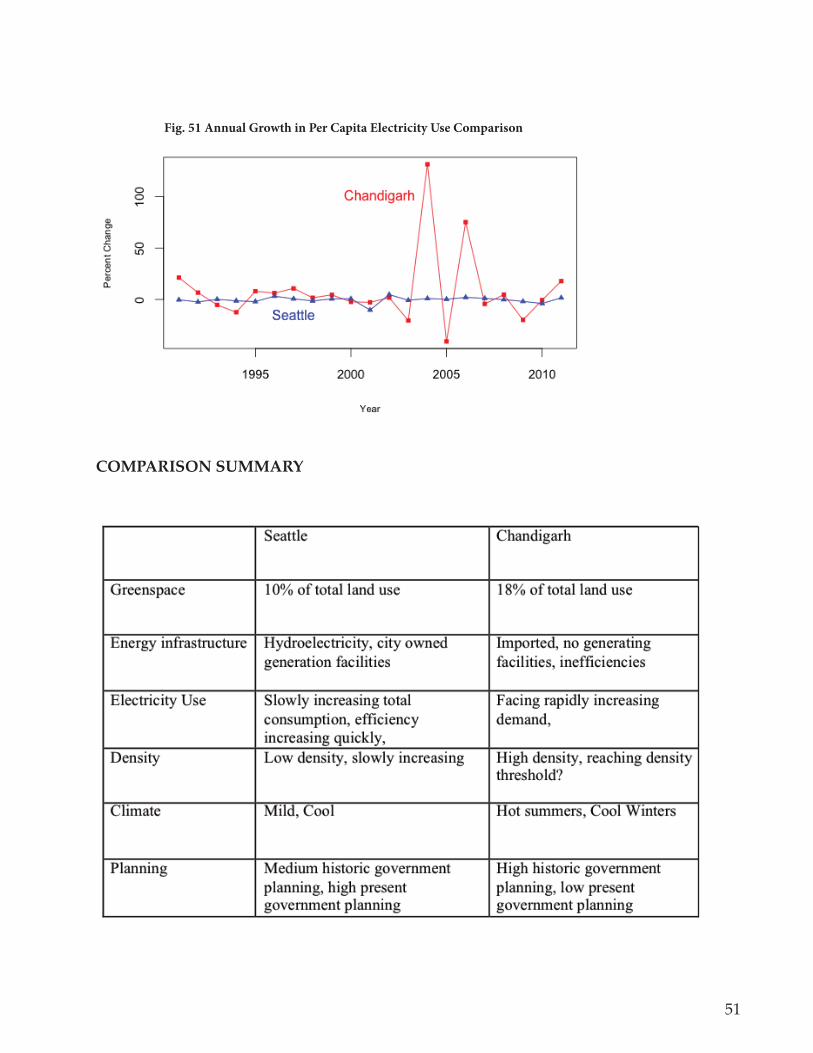
51
COMPARISON SUMMARY
Fig. 51 Annual Growth in Per Capita Electricity Use Comparison
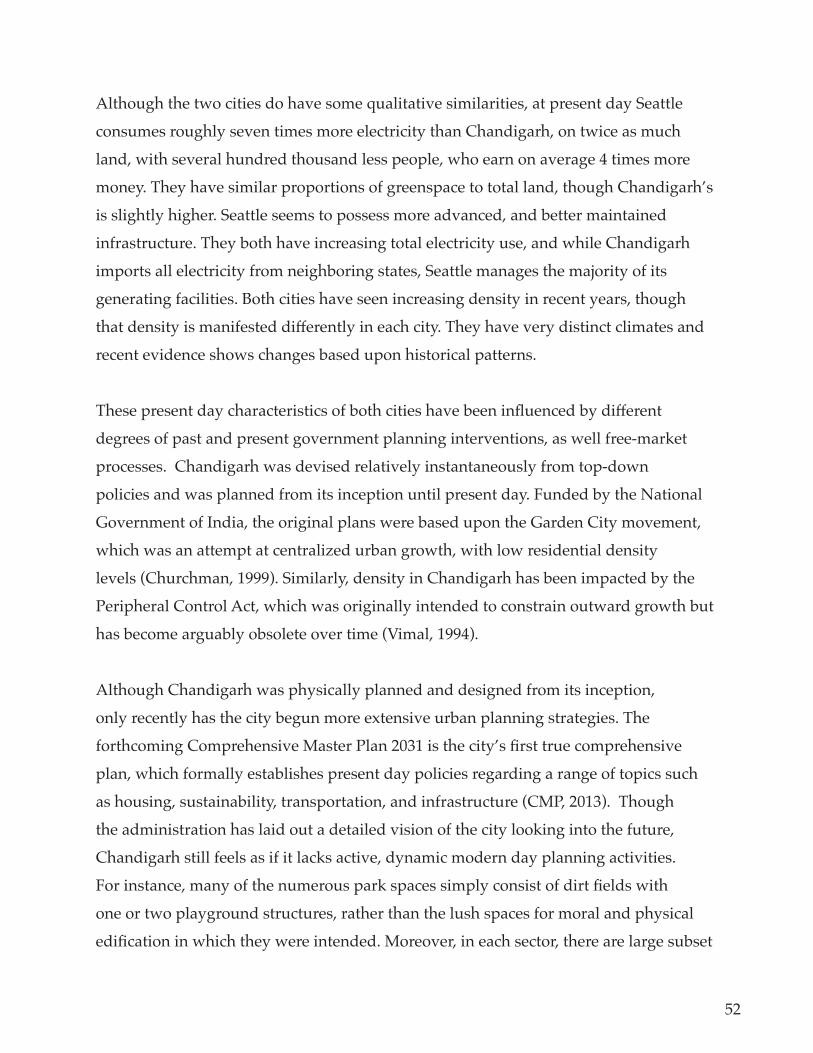
52
Although the two cities do have some qualitative similarities, at present day Seattle
consumes roughly seven times more electricity than Chandigarh, on twice as much
land, with several hundred thousand less people, who earn on average 4 times more
money. They have similar proportions of greenspace to total land, though Chandigarh’s
is slightly higher. Seattle seems to possess more advanced, and better maintained
infrastructure. They both have increasing total electricity use, and while Chandigarh
imports all electricity from neighboring states, Seattle manages the majority of its
generating facilities. Both cities have seen increasing density in recent years, though
WKDW�GHQVLW\�LV�PDQLIHVWHG�GLͿHUHQWO\�LQ�HDFK�FLW\��7KH\�KDYH�YHU\�GLVWLQFW�FOLPDWHV�DQG�recent evidence shows changes based upon historical patterns.
7KHVH�SUHVHQW�GD\�FKDUDFWHULVWLFV�RI�ERWK�FLWLHV�KDYH�EHHQ�LQÁXHQFHG�E\�GLͿHUHQW�degrees of past and present government planning interventions, as well free-market
processes. Chandigarh was devised relatively instantaneously from top-down
policies and was planned from its inception until present day. Funded by the National
Government of India, the original plans were based upon the Garden City movement,
which was an attempt at centralized urban growth, with low residential density
OHYHOV��&KXUFKPDQ���������6LPLODUO\��GHQVLW\�LQ�&KDQGLJDUK�KDV�EHHQ�LPSDFWHG�E\�WKH�Peripheral Control Act, which was originally intended to constrain outward growth but
KDV�EHFRPH�DUJXDEO\�REVROHWH�RYHU�WLPH��9LPDO���������
Although Chandigarh was physically planned and designed from its inception,
only recently has the city begun more extensive urban planning strategies. The
IRUWKFRPLQJ�&RPSUHKHQVLYH�0DVWHU�3ODQ������LV�WKH�FLW\·V�ÀUVW�WUXH�FRPSUHKHQVLYH�plan, which formally establishes present day policies regarding a range of topics such
DV�KRXVLQJ��VXVWDLQDELOLW\��WUDQVSRUWDWLRQ��DQG�LQIUDVWUXFWXUH��&03����������7KRXJK�the administration has laid out a detailed vision of the city looking into the future,
Chandigarh still feels as if it lacks active, dynamic modern day planning activities.
)RU�LQVWDQFH��PDQ\�RI�WKH�QXPHURXV�SDUN�VSDFHV�VLPSO\�FRQVLVW�RI�GLUW�ÀHOGV�ZLWK�one or two playground structures, rather than the lush spaces for moral and physical
HGLÀFDWLRQ�LQ�ZKLFK�WKH\�ZHUH�LQWHQGHG��0RUHRYHU��LQ�HDFK�VHFWRU��WKHUH�DUH�ODUJH�VXEVHW�
53
maps of the city’s sectors, which are intended to assist pedestrians traversing between
sectors. Yet, based upon the conditions of these signs, it literally appears as if they
have not been maintained since they were installed. They are rusted, bent, and at times
completely illegible due to apparent attrition. Although these signs are substantively
trivial compared to other planning outcomes, they seem to encapsulate the state
of modern day city planning in Chandigarh, at least compared to how planning is
manifested in Seattle.
Conversely, Seattle slowly burgeoned into autonomous city through myriad free
market processes, while government planning was relegated to designing parks and
roads. Seattle began as a small collection of sellers and manufacturers along the central
Puget Sound waterfront and over time burgeoned into large urban agglomeration.
6HDWWOH·V�ÀUVW�FRPSUHKHQVLYH�SODQ�ZDV�DGRSWHG�LQ�������IRXU�\HDUV�DIWHU�WKH�SDVVDJH�RI�WKH�:DVKLQJWRQ�6WDWH�*URZWK�0DQDJHPHQW�$FW��)R[����������*URZWK�LQ�6HDWWOH�LV�LQÁXHQFHG�E\�PXOWLSOH�GLͿHUHQW�SODQV��VXFK�DV�LWV�RZQ�FRPSUHKHQVLYH�SODQ��FRXQW\ZLGH�planning principles, regional growth plans, and state plans. Regional planning policies
LPSDFW�PXQLFLSDO�HOHFWULFLW\�XVH�E\�LQÁXHQFLQJ�WKH�ÁRZ�RI�SHRSOH�LQWR�DQG�RXW�RI�FLWLHV��&XUUHQW�GHQVLW\�LQ�6HDWWOH�LV�LQÁXHQFHG�E\�WKH�:DVKLQJWRQ�6WDWH�*URZWK�0DQDJHPHQW�$FW��*0$���ZKLFK�ZDV�HQDFWHG�LQ������DQG�UHTXLUHG�6HDWWOH�WR�HVWDEOLVK�DQ�XUEDQ�JURZWK�ERXQGDU\��8*$��WR�IRFXV�QHZ�JURZWK�LQ�DUHDV�WKDW�KDYH�H[LVWLQJ�LQIUDVWUXFWXUH��preserve regional open spaces, and prevent worsening suburban sprawl. In sum,
Chandigarh was planned heavily at its inception but has less current planning, while
Seattle had less planning during its formative years but is characterized by extensive
planning at present day.
54
CHAPTER 5: DISCUSSION
INTRODUCTION
In the previous section I presented the analysis of the dataset I gathered and the
observations I collected regarding energy-growth patterns for Chandigarh and Seattle.
In this chapter, I discuss the inferences and potential conclusions that may be drawn
from the analysis.
ENERGY GROWTH PATTERNS
One of the primary questions of my research is whether we can identify similar trends
between the growth of city size and electricity use in Seattle and Chandigarh. The
À�UVW�DQG�PRVW�REYLRXV�REVHUYDWLRQ�LV�WKH�VWDUN�GLVSDULWLHV�LQ�OHYHOV�RI�HOHFWULFLW\�XVH�EHWZHHQ�&KDQGLJDUK�DQG�6HDWWOH�RYHU�WLPH��HYHQ�WKRVH�WKDW�DFFRXQW�IRU�GLͿ�HUHQFHV�in total population. This could be interpreted as either Chandigarh is deprived of
HOHFWULFLW\�RU�WKDW�6HDWWOH�LV�SURÁ�LJDWH�LQ�LWV·�XVH�RI�HQHUJ\��7KRXJK�WKHUH�DUH�OLNHO\�truths in both, the energy disparity can be explained by myriad factors, including
SURIRXQG�HFRQRPLF�GLͿ�HUHQFHV��7DNLQJ�LQWR�DFFRXQW�SXUFKDVLQJ�SRZHU�SDULW\��SHU�FDSLWD�LQFRPH�LQ������ZDV��������86'�LQ�6HDWWOH��FRPSDUHG�WR�������86'�LQ�&KDQGLJDUK���Moreover, there appears to be a roughly linear relationship between annual per capita
LQFRPH�DQG�SHU�FDSLWD�HOHFWULFLW\�XVH�LQ�&KDQGLJDUK��)LJ�������7KLV�LQIHUV�D�SRVLWLYH� Fig. 52. Chandigarh Income and Electricity Consumption
55
relationship, indicating that electricity consumption may be directly tied to levels of per
capita income, which helps to explain the observed chasm in electricity use in the two
cities.
The analysis also showed that during the past several decades growth in total
HOHFWULFLW\�FRQVXPSWLRQ�KDV�FKDQJHG�LQ�ERWK�FLWLHV��EXW�IRU�GLͿHUHQW�DSSDUHQW�UHDVRQV��In Chandigarh, recent growth in total electricity consumption has been led by the
residential sector, while the majority of growth in Seattle is accounted for by non-
residential sectors. Yet, regardless of recent trends, the domestic sector is still the
highest contributor to total electricity consumption in both cities. This indicates that
both the form of residential buildings and the behavior of the occupants of those
buildings are the principle determinants of electricity use in both cities. The corollary
LV�WKDW�HQHUJ\�HFLHQF\�LQ�UHVLGHQWLDO�EXLOGLQJ�GHVLJQ�VKRXOG�EH�D�SULRULW\�LQ�SXUVXLQJ�municipal energy conservation programs in both cities.
Furthermore, economic growth is usually viewed as a positive trend, but it may increase
household electricity consumption as people acquire more disposable income to
SXUFKDVH�KRXVHKROG�DSSOLDQFHV��$V�6HDWWOH�KDV�EHFRPH�PRUH�DXHQW��LW�KDV�UHFRJQL]HG�the pertinence of residential sector energy use. Today, the city has a Conservation
5HVRXUFH�'LYLVLRQ�RI�WKHLU�SXEOLF�XWLOLW\�WKDW�SDUWO\�ZRUNV�WR�UHGXFH�HQHUJ\�XVH�LQ�the residential sector. As Chandigarh experiences further economic growth, it would
EH�ZLVH�WR�KHHG�6HDWWOH�DQG�SXUVXH�HQHUJ\�HFLHQF\�LQ�WKHLU�GRPHVWLF�VHFWRU��<HW��Chandigarh can also provide insight for Seattle in regards to household electricity
consumption. For instance, residents in Chandigarh commonly use sunlight to dry
clothes and wash dishes by hand rather than use electricity appliances, which helps to
dampen residential electricity consumption. Both behavior within the residential sector
DQG�WKH�GHVLJQ�RI�WKH�UHVLGHQWLDO�VHFWRU�DUH�RVWHQVLEO\�WKH�WZR�PRVW�VLJQLÀFDQW�YDULDEOHV�in assessing municipal electricity use.
'XULQJ�WKH�VDPSOH�WLPH�SHULRG��GHQVLW\�LQ�ERWK�FLWLHV�KDV�EHHQ�LQFUHDVLQJ��,Q�Chandigarh, both population density and total population have been increasing but

56
during the past census, Chandigarh experienced a decrease in population density
IRU�WKH�ÀUVW�WLPH��)URP�D�VWULFWO\�TXDQWLWDWLYH�SHUVSHFWLYH��WKLV�FRXOG�EH�LQWHUSUHWHG�as a threshold, where the city was not able to accommodate more density. But as the
numerous vacant lots and open space in Chandigarh indicate, there is clearly enough
VSDFH�IRU�LQFUHDVHG�GHQVLW\�VLPSO\�WKURXJK�LQÀOO�GHYHORSPHQW��,W�LV�SRVVLEOH�WKDW�GHQVLW\�decreased for reasons similar to what happened to Seattle in the mid twentieth century,
when there was an exodus of urban residents to the suburbs. As Chandigarh becomes
PRUH�DXHQW��LW�LV�SRVVLEOH�WKDW�UHVLGHQWV�ZLOO�VHHN�PRUH�VSDFLRXV��DͿRUGDEOH�ORWV�DQG�homes, which are more available in peripheral areas. Car ownership in Chandigarh has
become extremely high over the last several decades and transporting from ‘suburban’
area to the city has become less of an impediment.
When compared to levels of density in Chandigarh, Seattle is a sparsely populated city.
Although population density in Chandigarh is much higher than Seattle, it does not feel
that much more dense. Part of the challenge with achieving higher densities in Seattle
is that it has such a high proportion of detached, single-family residential land use.
At the same time, there currently is a contentious debate in Seattle regarding policies
that increase density in and around single-family neighborhoods. This opposition
to increased density may hinder Seattle from reaching higher levels of aggregate
population density. As a result density becomes congregated in certain neighborhoods
manifested in the form of high-rise apartments. The upshot is that these high rise
neighborhoods create ample shading that prevents solar gains and mitigates energy
HFLHQFLHV�IURP�SDVVLYH�VRODU�GHVLJQ��,I�GHQVLW\�ZDV�LQWHJUDWHG�LQWR�GHWDFKHG�VLQJOH�family neighborhoods, then there may be more opportunities for gains in energy
HFLHQF\�WKURXJK�SDVVLYH�VRODU�GHVLJQ��7KH�OHVVRQ�LV�WKDW�GHQVLW\�GRHV�QRW�KDYH�WR�WDNH�the form of high rise buildings but there must be ample land available dedicated to
medium density.
Today, both Chandigarh and Seattle currently face pressures to accommodate
DGGLWLRQDO�SRSXODWLRQV�ZLWKLQ�WKHLU�À[HG�DUHD�RI�FLW\�ODQG��6HDWWOH�LV�H[SHFWHG�WR�accommodate an additional 150,000 people by 2040 (Seattle Post Intelligencer, 2008
��
���*URZWK�LQ�WKH�VXUURXQGLQJ�DUHDV�RI�&KDQGLJDUK�LV�ERRPLQJ��EXW�LW�LV�XQFHUWDLQ�WR�what extend Chandigarh will accept additional growth. Chandigarh’s status as a
historic city presents challenges for accommodating additional population growth. In
fact, Chandigarh has been under consideration for World Heritage City status. For
instance, just north of the Capital Complex lies an area of land that has been designed
agricultural land, though its productivity is dubious. Le Corbusier envisioned the
capitol complex with an unimpeded sightline towards the shivalik foothills, with this
land existing as a rural landscape. Therefore, any plans for high density development
in this area are often scrutinized because they would interrupt this aesthetic element
of the original plan. Given projections for immense urban growth in India as a whole,
what is Chandigarh’s responsibility to accommodate a share of this growth in a
sustainable fashion? If it does not open its doors to new urban residents, then they
ZLOO�VLPSO\�JR�WR�D�GLͿHUHQW�FLW\�WKDW�PD\�RU�PD\�QRW�DELGH�E\�VXVWDLQDEOH�SULQFLSOHV��What will Chandigarh’s role be in the evolution of Indian urban growth and thus the
future of global energy use and climate change? Will it reject growth and remain a
modernist urban museum or will it accept its responsibility to accommodate growth in
a sustainable way?
SIZE AND EFFICIENCY
Another pertinent discussion point is what the analysis reveals about whether
ODUJHU�FLWLHV�DUH�PRUH�HFLHQW�WKDQ�VPDOOHU�FLWLHV���,W�LV�JHQHUDOO\�XQGHUVWRRG�WKDW�WKH�FRQFHQWUDWLQJ�RI�SHRSOH�LQ�FLWLHV�HQDEOHV�HFRQRPLHV�RI�VFDOH�WKDW�HQJHQGHUV�WKH�HFLHQW�XVH�RI�LQIUDVWUXFWXUH�DQG�HQHUJ\��)UDJLDV���������8VLQJ�D�ELRORJLFDO�DQDORJ\�WR�DVVHVV�FLW\�VL]H�DQG�HFLHQF\��WKH�FRQFHSW�RI�XUEDQ�PHWDEROLVP�LV�D�ZHOO�HVWDEOLVKHG�FRQFHSW�WKDW�helps explain how cities depend upon a variety of energy inputs in order to maintain
their core functions. This is based upon “Kleiber’s Law”, which states that organisms
with a larger mass consume more total energy than smaller ones but as organism size
increases, the rate of energy consumption is proportionately less than the rate of growth
LQ�PDVV��,ELG����7KLV�VHHPV�WR�LPSO\�WKDW�EHWZHHQ�WZR�FLWLHV�ZLWK�WKH�VDPH�SRSXODWLRQ�density, the city with the greater total population will have less per capita electricity
58
use. The biological analogy is especially intriguing when considering the physiological
origins of Chandigarh’s original master plan. Le Corbusier envisioned the original
master plan of Chandigarh as analogous to the human body, with the head as the
Capitol Complex, the heart as the central commercial district, the lungs as the green
spaces, the mind as the educational institutions, and the circulatory system as the roads
�&03���������
Based upon the data analysis, annual per capita electricity consumption in Seattle
shows a decreasing trend since 1990, while total consumption has been increasing
marginally each year. Given that population continues to increase, this indicates that
6HDWWOH�LV�EHFRPLQJ�PRUH�HQHUJ\�HFLHQW��&RQYHUVHO\��ERWK�SHU�FDSLWD�FRQVXPSWLRQ�DQG�WRWDO�FRQVXPSWLRQ�LQ�&KDQGLJDUK�KDV�EHHQ�ULVLQJ��LQGLFDWLQJ�WKDW�HFLHQFLHV�DUH�not being achieved. We can also see that Chandigarh is larger than Seattle in total
population and has lower levels of per capita electricity consumptions. This is an
LQGLFDWLRQ�WKDW�&KDQGLJDUK��DV�D�ODUJHU�FLW\��LV�PRUH�HQHUJ\�HFLHQW��7KH�GDWD�DQDO\VLV�shows that Chandigarh surpassed Seattle in total population between 1980 and 1990
and since that time has demonstrated lower levels of per capita electricity use. In order
to begin assessing the congruence of the aforementioned urban metabolism analogy
to this analysis, we would need to analyze whether there were notable changes in the
GLVSDULW\�LQ�HQHUJ\�HFLHQF\�EHIRUH�&KDQGLJDUK�VXUSDVVHG�6HDWWOH�LQ�WRWDO�SRSXODWLRQ�size. Unfortunately, continuous electricity data for both Seattle and Chandigarh was
only available for the period after Chandigarh became larger than Seattle.
CLIMATE CHANGE
Another prominent research question is how climate change may impact energy use in
HDFK�FLW\��*HQHUDOO\��GLͿHUHQFHV�LQ�FOLPDWH�OLNHO\�SOD\�D�VLJQLÀFDQW�UROH�LQ�LQÁXHQFLQJ�electricity use patterns in Seattle and Chandigarh. While Seattle has a relatively mild
climate, Chandigarh is characterized by extreme contrasts between hot summers,
where temperatures can reach 45C and cold winters that reach the freezing level. These
FOLPDWLF�GLͿHUHQFHV�DUH�UHOHYDQW�IRU�VHYHUDO�UHDVRQV��6HDWWOH·V�PLOG�FOLPDWH�PHDQV�WKDW�
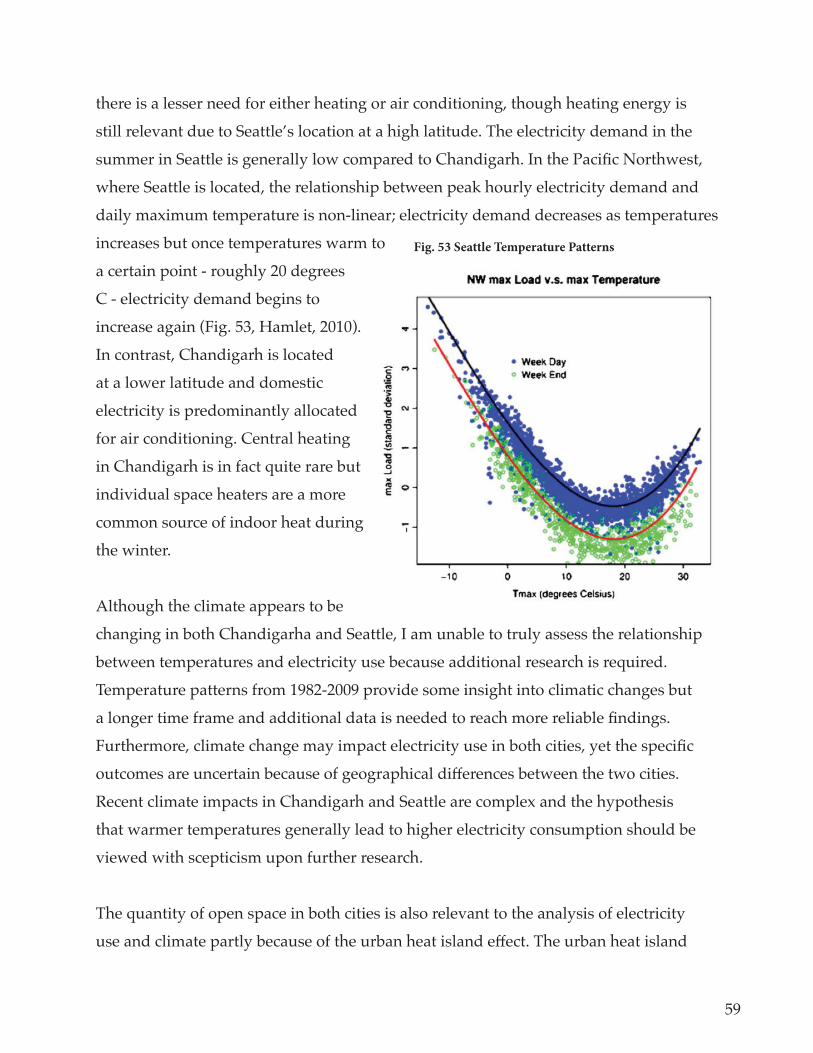
59
there is a lesser need for either heating or air conditioning, though heating energy is
still relevant due to Seattle’s location at a high latitude. The electricity demand in the
VXPPHU�LQ�6HDWWOH�LV�JHQHUDOO\�ORZ�FRPSDUHG�WR�&KDQGLJDUK��,Q�WKH�3DFLÀ�F�1RUWKZHVW��where Seattle is located, the relationship between peak hourly electricity demand and
daily maximum temperature is non-linear; electricity demand decreases as temperatures
increases but once temperatures warm to
a certain point - roughly 20 degrees
C - electricity demand begins to
LQFUHDVH�DJDLQ��)LJ������+DPOHW����������In contrast, Chandigarh is located
at a lower latitude and domestic
electricity is predominantly allocated
for air conditioning. Central heating
in Chandigarh is in fact quite rare but
individual space heaters are a more
common source of indoor heat during
the winter.
Although the climate appears to be
changing in both Chandigarha and Seattle, I am unable to truly assess the relationship
between temperatures and electricity use because additional research is required.
Temperature patterns from 1982-2009 provide some insight into climatic changes but
D�ORQJHU�WLPH�IUDPH�DQG�DGGLWLRQDO�GDWD�LV�QHHGHG�WR�UHDFK�PRUH�UHOLDEOH�À�QGLQJV��)XUWKHUPRUH��FOLPDWH�FKDQJH�PD\�LPSDFW�HOHFWULFLW\�XVH�LQ�ERWK�FLWLHV��\HW�WKH�VSHFLÀ�F�RXWFRPHV�DUH�XQFHUWDLQ�EHFDXVH�RI�JHRJUDSKLFDO�GLͿ�HUHQFHV�EHWZHHQ�WKH�WZR�FLWLHV��Recent climate impacts in Chandigarh and Seattle are complex and the hypothesis
that warmer temperatures generally lead to higher electricity consumption should be
viewed with scepticism upon further research.
The quantity of open space in both cities is also relevant to the analysis of electricity
XVH�DQG�FOLPDWH�SDUWO\�EHFDXVH�RI�WKH�XUEDQ�KHDW�LVODQG�HͿ�HFW��7KH�XUEDQ�KHDW�LVODQG�
Fig. 53 Seattle Temperature Patterns
60
HͿHFW�LV�D�SKHQRPHQRQ�LQ�ZKLFK�DUHDV�ZLWK�VLJQLÀFDQW�LPSHUYLRXV�VXUIDFH�ODQG�FRYHU�absorb radiation from the sun, which increases the ambient temperature of those areas
FRPSDUHG�WR�DGMDFHQW�DUHDV��<RXQJ���������7KH�UHVXOW�LV�ZDUPHU�XUEDQ�WHPSHUDWXUHV��ZKLFK�LQÁXHQFHV�HQHUJ\�FRQVXPSWLRQ�SDWWHUQV��&KDQGLJDUK�ZDV�KLVWRULFDOO\�GHVLJQHG�ZLWK�D�VLJQLÀFDQW�TXDQWLW\�RI�JUHHQVSDFHV��7RGD\�WKHVH�VSDFHV�FDQ�EH�REVHUYHG�extensively throughout the city and comprising approximately eighteen percent of
the total existing city land use. Similarly, Seattle has ample parks, open spaces, and
YHJHWDWLYH�FRYHU���7KLV�VLJQLÀFDQW�FRPSRVLWLRQ�RI�SHUYLRXV�VXUIDFH�FRYHU�PD\�KHOS�WR�PLWLJDWH�XUEDQ�KHDW�LVODQG�HͿHFW�LQ�ERWK�FLWLHV��<HW�GXH�WR�WKH�GLͿHULQJ�FOLPDWH�LQ�6HDWWOH�DQG�&KDQGLJDUK��WKH�UHVXOWLQJ�HQHUJ\�RXWFRPHV�ZLOO�GLͿHU��)RU�LQVWDQFH��OHVV�XUEDQ�KHDW�LVODQG�HͿHFW�LQ�&KDQGLJDUK�ZLOO�UHGXFH�HOHFWULFLW\�IRU�FRROLQJ�EXW�LQ�6HDWWOH�LW�PD\�increase electricity for heating.
Chandigarh is experiencing rapidly growing electricity consumption, much of it that is
enabled through the burning of coal for power generation, which contributes to global
climate change. Hydroelectric power supplies in Seattle are currently being impacted
by climate change and changes will likely continue far into the future. Therefore,
there seems to be an intuitive interest for Seattle in how growth in Chandigarh
DQG�RWKHU�,QGLD�FLWLHV�SURFHHG��%XW�DQRWKHU�NH\�ÀQGLQJ�LV�WKDW�&KDQGLJDUK·V�IXWXUH�contribution to climate-induced changes in Seattle’s electricity supply will likely be
minor, compared to other cities in India because of its history and heritage. Chandigarh
was nominally designed by arguably the most renowned architect of the 20th century
and has been considered as a UNESCO World Heritage City. As a result, growth and
development seem to proceed in a more cautious manner, compared to other Indian
cities. For instance, a high density, purportedly sustainable housing proposal just north
of Chandigarh has repeated challenged in the courts, partly because it disrupts the
sightline to the mountains, which was an essential element of Corbusier’s original city
plan. Such considerations clearly constrain growth and design policies in Chandigarh,
which directly impacts energy, and will likely continue to do so into the future.
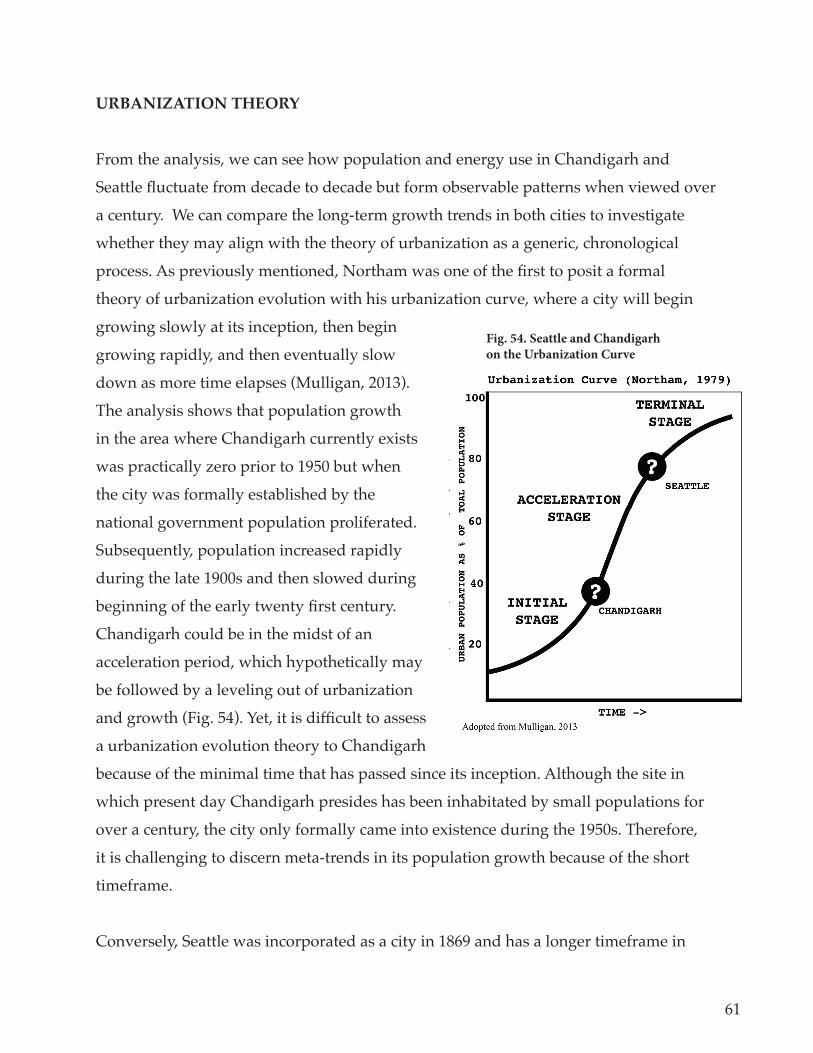
61
URBANIZATION THEORY
From the analysis, we can see how population and energy use in Chandigarh and
6HDWWOH�ÁXFWXDWH�IURP�GHFDGH�WR�GHFDGH�EXW�IRUP�REVHUYDEOH�SDWWHUQV�ZKHQ�YLHZHG�RYHU�a century. We can compare the long-term growth trends in both cities to investigate
whether they may align with the theory of urbanization as a generic, chronological
SURFHVV��$V�SUHYLRXVO\�PHQWLRQHG��1RUWKDP�ZDV�RQH�RI�WKH�ÀUVW�WR�SRVLW�D�IRUPDO�theory of urbanization evolution with his urbanization curve, where a city will begin
growing slowly at its inception, then begin
growing rapidly, and then eventually slow
GRZQ�DV�PRUH�WLPH�HODSVHV��0XOOLJDQ����������The analysis shows that population growth
in the area where Chandigarh currently exists
was practically zero prior to 1950 but when
the city was formally established by the
national government population proliferated.
Subsequently, population increased rapidly
during the late 1900s and then slowed during
EHJLQQLQJ�RI�WKH�HDUO\�WZHQW\�ÀUVW�FHQWXU\��Chandigarh could be in the midst of an
acceleration period, which hypothetically may
be followed by a leveling out of urbanization
DQG�JURZWK��)LJ�������<HW��LW�LV�GLFXOW�WR�DVVHVV�a urbanization evolution theory to Chandigarh
because of the minimal time that has passed since its inception. Although the site in
which present day Chandigarh presides has been inhabitated by small populations for
over a century, the city only formally came into existence during the 1950s. Therefore,
it is challenging to discern meta-trends in its population growth because of the short
timeframe.
Conversely, Seattle was incorporated as a city in 1869 and has a longer timeframe in
Fig. 54. Seattle and Chandigarh on the Urbanization Curve
62
which to assess its growth as an urban entity in time. From the analysis, you can see that
Seattle grew rapidly in the early 1900s before slowing down from 1920-1940, which may
have been related to the great depression. But growth picked up speed again from 1940-
1960 before slowing down from 1960-1980 and from 1980 to present the population has
been growing steadily. Seattle’s growth since 1900 is characterized by periods of slower
JURZWK�DQG�DFFHOHUDWLRQ��\HW�LW�LV�GLFXOW�WR�JHQHUDOL]H�D�VSHFLÀF�VKDSH��VXFK�DV�DQ�6��to describe its evolution of growth. Although we have a longer time frame to assess
growth patterns, it is possible that this is still not enough time.
2QH�H[SODQDWLRQ�RI�WKH�GLFXOWO\�RI�SODFLQJ�ERWK�6HDWWOH�DQG�&KDQGLJDUK�RQ�D�VLQJOH�curve is that they began growing during distinct periods in history. The S curve
was hypothesized in reference to the initial group of urbanizing regions in the west
during the twentieth century. But for regions in India that are only now experiencing
urbanization, growth is particularly rapid, potentially resulting in a steep J shaped
XUEDQL]DWLRQ�FXUYH��0XOOLJDQ���������7KHUHIRUH��UDWKHU�WKDQ�DWWHPSWLQJ�WR�SODFH�6HDWWOH�and Chandigarh on one urbanization curve, there should be multiple curves. For
instance, it is possible that there are urbanization cohorts, based upon levels of country
XUEDQL]DWLRQ�GXULQJ�WKH���WK�DQG���WK�FHQWXULHV��,ELG����%DVHG�XSRQ�WKLV�WKHRU\��WKH�8�6��LV�OXPSHG�LQWR�WKH�ÀUVW�FOXE�RI�KLJKO\�XUEDQL]HG�FRXQWULHV��WRGD\�WKH�SHUFHQWDJH�of the population in the United States who reside in urban areas is over 80 percent.
Conversely, India is part of the 4th club of least urbanized countries; its urbanization
level is just over 30 percent. There may be typologies of urbanization processes, in
ZKLFK�FLWLHV�FDQ�EH�FODVVLÀHG�LQWR�GLͿHUHQW�JURXSV��(DFK�JURXS�IROORZV�WKH�VDPH�JHQHUDO�SDWWHUQ�EXW�KDV�GLͿHUHQW�DEVROXWH�OHYHOV�RI�GHQVLW\�DQG�HOHFWULFLW\�XVH��
9LHZLQJ�XUEDQL]DWLRQ�DV�D�WHPSRUDO�SURFHVV�KHOSV�H[SODLQ�WKH�GLͿHUHQFHV�EHWZHHQ�WKH�WZR�FLWLHV��6HDWWOH�JUHZ�GXULQJ�WKH�ÀUVW�VSDWH�RI�XUEDQL]DWLRQ�WKDW�RFFXUUHG�GXULQJ�WKH�West during the 19th and 20th century, while Chandigarh is growing amongst a second
phase of urbanization that is currently occurring in many developing countries in
Asia. A common perspective is that urban growth in Indian cities is occurring under
conditions that are incomparable to urbanization in the western world during the
63
WZHQWLHWK�FHQWXU\��0XOOLJDQ����������)RU�LQVWDQFH��WKH�XUEDQL]DWLRQ�WKDW�RFFXUUHG�LQ�WKH�West during the 20th century was practically synonymous with economic development.
Conversely, the current urbanization processes in much of the developing world are
RIWHQ�QRW�HTXDOO\�DFFRPSDQLHG�ZLWK�HTXLWDEOH�GLVWULEXWLRQV�RI�ZHDOWK��0DGOHQHU���������0\�UHVHDUFK�VHHPV�WR��FRQÀUPV�WKH�EHOLHI�WKDW�&KDQGLJDUK�LV�DPLG�D�QHZ�SKDVH�RI�urbanization that is unlike what occurred in Seattle in the 20th century. Given structural
VRFLRHFRQRPLF�GLͿHUHQFHV�EHWZHHQ�WKH�FRQWH[W�LQ�ZKLFK�6HDWWOH�DQG�&KDQGLJDUK�DUH�XUEDQL]LQJ��LW�VHHPV�OLNHO\�WKDW�WKHLU�WUDMHFWRULHV�ZLOO�GLͿHU��ZLWK�WKH�ODWHU�XUEDQL]LQJ�DW�D�faster rate.
An ancillary purpose of this paper is to assess whether this form of research
methodology can contribute to the further development of an urbanization science,
by attempting to compare urbanization among distinct cities using a mixed-methods
approach. At this point in the development of urbanization science as a distinct
paradigm, quantitative analysis of large data sets seems to be the predominant
methodology. For example, recent research has explored urbanization from the
standpoint of complexity theory, using immense datasets to explore scaling and
HPHUJHQW�SURSHUWLHV�RI�FLWLHV��%HWWHQFRXUW���������,Q�WKHVH�VWXGLHV��FLWLHV�DUH�XVXDOO\�distilled into a few general variables and then aggregated into datasets with hundreds
or thousands of other city’s variables. Researchers aggregate a plethora of cities and
demonstrate universal relationships amongst them. Although this type of analysis is
immensely interesting, I wonder to what extent this type of methodology can actually
helps us understand what is happening on the ground and therefore devise necessary
responses.
There are several methodology approaches to investigating whether there are universal
characteristics of cities. Using population density as an example, one approach would
be to identify the population density of myriad international cities and observe
the statistical patterns that exist through quantitative analysis. Once patterns were
observed, one could then research each city individually to assess the idiosyncratic
causes of the empirical trends from a qualitative perspective.The methodology
64
employed in this paper is a mixed methods approach, employing both quantitative
analysis and qualitative observations. Therefore, the challenge is to assess the
contributions to urbanization science of a mixed methods approach.
One characteristic of urbanization science is a rigorously interdisciplinary analytic
SHUVSHFWLYH��6ROHFNL���������ZKHUHDV�SDVW�XUEDQL]DWLRQ�VWXGLHV�DUH�RIWHQ�DSSURDFKHG�IURP�P\ULDG�GLͿHUHQW�GLVFLSOLQHV��UHVXOWLQJ�LQ�VSHFLDOL]HG�EXW�LVRODWHG�DQDO\VLV�RI�complex, connected processes. My research intentionally attempts an interdisciplinary
SHUVSHFWLYH�E\�JDWKHULQJ�GDWD�IURP�PXOWLSOH�GLͿHUHQW�SHUVSHFWLYHV��)RU�H[DPSOH��,�ORRN�DW�WHPSHUDWXUH��FOLPDWRORJ\���XUEDQ�IRUP��XUEDQ�SODQQLQJ���SRSXODWLRQ��GHPRJUDSK\���LQFRPH��HFRQRPLFV���DQG�HOHFWULFLW\��HQJLQHHULQJ���&RDOHVFLQJ�QXPHURXV�GLͿHUHQW�GLVFLSOLQHV�LQWR�D�TXDQWLWDWLYH�DQDO\VLV�LV�SUREOHPDWLF�EHFDXVH�WKH�GLVWLQFW�assumptions in which each is founded upon fade into the background, though they are
likely extremely pertinent. A mixed-methods approach is better able to identify and
account for the idiosyncracies and asusmptions of each discipline when attempting
interdiscplinary analysis.
Moreoever, the contribution of a mixed methods approach to urbanization science,
compared to a strictly quantitative approach, is a deeper understanding of trends
that are observed among multiple cities. Since the ultimate goal of urbanization
science is to respond to contemporary issues in society, it is useful to know the context
EHKLQG�WKH�JUDSKV�DQG�GDWD�SRLQWV��:LWKRXW�FRQGXFWLQJ�ÀHOG�UHVHDUFK��LW�ZRXOG�EH�nearly impossible to truly understand the reasons behind the disparities in electricity
use between Chandigarh and Seattle. A mixed methods approach contributes to
urbanization science by vetting and testing theories by acquiring thorough contextual
LQIRUPDWLRQ�LQ�WKH�ÀHOG��)RU�LQVWDQFH��D�TXDOLWDWLYH�SHUVSHFWLYH�LV�QHHGHG�WR�KHOS�H[SODLQ�WKH�VWDUN�FRQWH[WXDO�GLͿHUHQFHV�LQ�ZKLFK�&KDQGLJDUK�DQG�6HDWWOH�GHYHORSHG�DQG�ZKLFK�LQÁXHQFHG�SUHVHQW�GDWD�FKDUDFWHULVWLFV��:KLOH�6HDWWOH�EXUJHRQHG�IURP�D�WUDGLWLRQDO�bottom-up perspective, Chandigarh was seemingly created from strictly top-down
state intervention. This disparity between their historical development challenges
XUEDQL]DWLRQ�WKHRU\�IURP�D�TXDQWLWDWLYH�SHUVSHFWLYH�DQG�LQGLFDWHV�WKH�EHQHÀWV�RI�
65
more thorough descriptions of past and present city structures. Although quantitative
analysis lends itself well to developing theory, urbanization science needs descriptive
analysis to test emerging theories.
My research also helps expose some dubious assumptions of a strictly quantitative
approach to comparing cities. By delving deeper into the contextual and historical
DVSHFWV�RI�FLW\�JURZWK��LW�EHFRPHV�FOHDU�WKDW�WKH�GHÀQLWLRQ�RI�D�VLQJOH�FLW\�FKDQJHV�RYHU�WLPH�DQG�WKLV�GHÀQLWLRQ�LV�FUHDWHG�UDWKHU�DUELWDULO\��)RU�LQVWDQFH��RQH�GLOHPPD�ZLWK�DWWHPSWLQJ�WR�DVVHVV�WKH�HYROXWLRQ�RI�XUEDQL]DWLRQ�LV�GHFLGLQJ�KRZ�WR�GHÀQH�D�FLW\�IURP�a temporal perspective. Chronologically, when does a city as a distinct entity begin
and end? Chandigarh was essentially a collection of small villages until Nehru and the
national government of India decided to intervene to create a new city on top of what
already existed. Seattle expanded its administrative urban area numerous times after
it was incorporated as a city, yet it has maintained every expansionary area as part of
the original city. But what if each expansion was not included as part of Seattle but
HVWDEOLVKHG�DV�VHSDUDWH��XQLTXH�FLW\"�7KHVH�DPELJXRXV�GHÀQLWLRQV�FOHDUO\�LPSDFW�KRZ�we evaluate the evolution of urbanization in both cities and should be explicitly stated.
It seems that a qualitative perspective can better account for such assumptions.
Although urbanization evolution and scaling analysis both contribute to urbanization
science, there seems to be a tension between the two. For instance, the claim that there
is a scaling relationship between population size and electricity use is based upon
REVHUYDWLRQV�IURP�RQH�FDOHQGDU�\HDU���7KHUHIRUH��WKH�VSHFLÀF�FRQFOXVLRQ�LV�WKDW�DW�WKLV�VSHFLÀF�SRLQW�LQ�WLPH��WKHUH�DSSHDUHG�WR�EH�JHQHULF�FKDUDFWHULVWLFV��%XW�WKLV�FODLP�does not necessarily apply to past or future periods of time. Although there are likely
universal tendencies of cities at points in time, these characteristics will change over
WLPH��$GGLWLRQDOO\��VFDOLQJ�RQO\�DSSOLHV�WR�FLWLHV�RI�WKH�VDPH�XUEDQ�V\VWHP��%HWWHQFRXUW���6R�KRZ�GR�ZH�GHÀQH�XUEDQ�V\VWHP"�,QGLD�DQG�6HDWWOH�DUH�RVWHQVLEO\�FRPSRQHQWV�RI�GLͿHUHQW�XUEDQ�V\VWHPV��RQH�LQ�WKH�QRUWKZHVW�8QLWHG�6WDWHV�DQG�WKH�RWKHU�LQ�QRUWKZHVW�India.
66
Lastly, urbanization science is an incipient discipline that has yet to be formally
HPEUDFHG�E\�WKH�VFLHQWLÀF�FRPPXQLW\��7KH�HVWDEOLVKPHQW�RI�D�QHZ�ÀHOG�RI�VFLHQFH�UHTXLUHV�D�GLVWLQFW�FKDQJH��RU�UHYROXWLRQ��ZLWKLQ�WKH�JHQHUDO�VFLHQWLÀF�FRPPXQLW\��where researchers cease to work within ‘normal science’, but instead use a distinct
VHW�RI�PHWKRGV��SURFHVV��DQG�WKHRU\��.XKQ���������7KH�UHVXOW�RI�VXFFHVVIXOO\�ZRUNLQJ�outside of ‘normal science’ is the creation of a new paradigm. The establishment of
D�QHZ�SDUDGLJP�PD\�RFFXU�ZKHQ�VFLHQWLÀF�SURJUHVV�LQ�D�VSHFLÀF�DUHD�LV�VXFLHQWO\�XQSUHFHGHQWHG�WR�DWWUDFW�D�VFLHQWLÀF�FRKRUW�DZD\�IURP�WKH�VWDWXV�TXR��$GGLWLRQDOO\��WKDW�SURJUHVV�VKRXOG�VWLOO�EH�RSHQ�HQGHG�HQRXJK�WR�HQDEOH�DPSOH�VFLHQWLÀF�DFWLYLW\�WR�IROORZ��LELG���7R�EHFRPH�D�SDUDGLJP��D�WKHRU\�PXVW�EH�EHWWHU�WKDQ�WKH�H[LVWLQJ�WKHRU\��\HW�LW�QHHG�QRW�EH�RPQLVFLHQW��LELG���0RUHRYHU��LQ�RUGHU�WR�HVWDEOLVK�D�XUEDQL]DWLRQ�VFLHQFH�DV�D�GLVWLQFW�SDUDGLJP��LWV�IRXQGDWLRQDO�WKHRU\�PXVW�EH�IDOVLÀDEOH��3RSSHU���������3RSSHU�argues that science progresses by invalidating possible causes for observed phenomena
UDWKHU�WKDQ�FRQÀUPLQJ�WKH�H[LVWHQFH�RI�UHODWLRQVKLSV��3HWHUV���������$WWHPSWLQJ�WR�HVWDEOLVK�D�GLVWLQFW�VFLHQWLÀF�ÀHOG�LV�D�GDXQWLQJ�WDVN�DQG�ZLOO�UHTXLUH�UHSHDWHG�DWWHPSWV�DQG�IDLOXUHV��LQ�RUGHU�WR�UHYHDO�SRWHQWLDO�FKDUDFWHULVWLFV��,Q�RUGHU�WR�HQJHQGHU�D�VFLHQWLÀF�revolution in the science of cities, researchers should not become siloed within certain
methodologies, but rather should consider a wide range of approaches that help test
their theories.
��
CHAPTER 6: REFLECTIONS
In this section, I discuss my experience conducting cross-national case study research
for several reasons. An ancillary purpose of my thesis research is to increase the
share of methodological knowledge across borders by physically conducting research
in a foreign environment. I hope that by describing my experience doing so, other
researchers attempting similar comparative studies will gain insight from my successes
and failures. There are many obstacles to conducting research in a foreign place and it is
important that these are acknowledged, in order to enhance future research.
DATA ACQUISITION
The process to request data from the Chandigarh administration was often lengthy and
laborious. The administration maintains minimal online information regarding what
type of data is available and who one should contact to inquire about a data request.
7KHUHIRUH��,�KDG�WR�VLPSO\�VKRZ�XS�DW�DGPLQLVWUDWLYH�RFHV�DQG�DVN�WR�VSHDN�WR�YDULRXV�SHRSOH��0RVW�RIWHQ��,�VLPSO\�ORFDWHG�WKH�RFH�LQ�ZKLFK�,�VXVSHFWHG�WKH�GDWD�ZRXOG�be housed and then asked around in order to connect with the appropriate manager
or employee. On several occasions, I was required to provide a signed letter from my
professor, which outlined the data that I was requesting and providing approval of my
UHVHDUFK�LQWHQWLRQV��$GPLQLVWUDWLYH�RFLDOV�VRPHWLPHV�DSSHDUHG�OHHU\�DQG�VXVSLFLRXV�of my intentions, as if my research had ulterior motives. My experience pursuing data
within Chandigarh administrative agencies was generally characterized by ample wait
WLPHV��FRQYHUVDWLRQV�ZLWK�PXOWLSOH�GLͿHUHQW�HPSOR\HHV��QXPHURXV�FXSV�RI�&KDL��DQG�ultimately being provided with a small, limited sample of data. Pursuing data from
governmental agencies was time intensive and, although it was not completely fruitless,
resulted in a quite modest collection of data.
DATA PROCESSING
In Chandigarh I was practically always provided data in hard copy form, in which I
68
then needed to scan and convert to a format suitable for data analysis. This process
introduced potential error into the data because I would occasionally have to manually
vet and adjust the data if it did not convert accurately. For instance, I usually scanned
WKH�KDUG�FRS\�GDWD�WDEOHV�LQWR�3')V�DQG�WKHQ�FRQYHUWHG�WKHP�WR��FVY��XVLQJ�RQH�RI�several free programs available online. When using research libraries I used my digital
camera to physically take pictures of data tables that were embedded within various
student dissertations, reference books, and other documents. I did so because digital
scanning was usually prohibited. Again, I then converted the resulting pictures of data
tables from JPEG to .csv format. For the temperature data, I was forced to convert jpeg
graphs of data tables into raw data using another free, online program. Again, this
introduced a great amount of additional error into the data.
ANECDOTES
,�YLVLWHG�WKH�&KDQGLJDUK�(OHFWULFLW\�'HSDUWPHQW�VHYHUDO�WLPHV��DV�HOHFWULFLW\�GDWD�is a core element of my thesis. After several, long conversations with multiple
employees regarding the existence and availability of data regarding annual electricity
consumption, I was provided several pieces of paper containing a few data points. Yet,
I knew that this department maintained much more data because I had read a written
UHSRUW�WKDW�VXPPDUL]HG�D�ODUJH�GDWDVHW��ZKLFK�FLWHG�WKH�(OHFWULFLW\�'HSDUWPHQW�DV�WKH�source. This was one of several instances in which I suspected that much more data
was available but that the department was unwilling to share it with me. From my
conversation with several people, I got the feeling that access to a larger dataset may
KDYH�EHHQ�DYDLODEOH�DW�D�GLͿHUHQW�WLPH�RU�E\�VLPSO\�WDONLQJ�WR�D�GLͿHUHQW�SHUVRQ��7LPH�FRQVWUDLQWV�GLG�QRW�SHUPLW�PH�WR�H[SDQG�WKH�HͿRUW�QHHGHG�SXUVXH�WKH�DGGLWLRQDO�GDWD�
0\�H[SHULHQFH�FROOHFWLQJ�WHPSHUDWXUH�GDWD�SURYLGHV�D�ÀWWLQJ�H[DPSOH�RI�P\�JHQHUDO�experience collecting data in India. I attempted to acquire temperature data from the
&KDQGLJDUK�0HWHRURORJLFDO�&HQWUH��&0&���ZKR�LQGLFDWHG�WKH�H[LVWHQFH�RI�D�GDWDVHW�RQ�forty years of climatic data for Chandigarh. The dataset consists of temperature data
JDWKHUHG�E\�WKH�,QGLD�$LU�)RUFH��,$)��IURP�WKHLU�&KDQGLJDUK�$LUSRUW�REVHUYDWRU\�IURP�
69
����������DQG�&KDQGLJDUK·V�PHWHRURORJLFDO�REVHUYDWRU\�IURP������������8QIRUWXQDWHO\��I was not provided access to the full temperature dataset because of proprietary
concerns of IAF. Therefore, the data used in this paper was estimated based upon Paul’s
SDSHU��ZKLFK�SURYLGHV�D�VXPPDU\�DQDO\VLV�RI�WKH�RULJLQDO�GDWDVHW��3DXO��������3DXO·V�paper contained dozens of graphs that summarized the desired dataset. I extracted this
data by digitizing the graphs, which were in jpeg format, using another free program
available online. This required calibrating the axes and then manually clicking on each
data point, whether the point is on a line or the top of a bar graph. As a result of this
somewhat crude process, the temperature data are rough estimates, rather than precise
ÀJXUHV��
My experience collecting data at Panjab University was another notable and
HQOLJKWHQLQJ�H[SHULHQFH��,�YLVLWHG�WKH�3DQMDE�8QLYHUVLW\�*HRJUDSK\�'HSDUWPHQW�because their website advertises courses in geographic information systems and I
hoped to acquire spatial data for Chandigarh. I met with the chair of the department
DQG�DIWHU�UHTXHVWLQJ�EDVLF�VSDWLDO�GDWD��LH�FLW\�DGPLQLVWUDWLYH�ERXQGDULHV���,�ZDV�WROG�WKDW�WKH�GDWD�GRHV�QRW�UHDGLO\�H[LVW��WKRXJK�,�FRXOG�VSHDN�ZLWK�D�VWXGHQW�WR�KHOS�ÀQG�RU�GHYHORS�VXFK�GDWD��:H�ZHUH�VXEVHTXHQWO\�LQWURGXFHG�WR�D�3K'�VWXGHQW�ZKR�DJUHHG�WR�DVVLVW�ZLWK�RXU�UHTXHVW��UHTXLULQJ�D�VPDOO�SD\PHQW�RI�5V�������������7KH�VWXGHQW�FUHDWHG�WKH�VSDWLDO�GDWD�KLPVHOI�E\�UHIHUHQFLQJ�IRXU�GLͿHUHQW�PDSV�WR�LGHQWLI\�WKH�¶OLNHO\�accurate’ administrative boundaries. Using the edit features in ArcGIS he then traced
the boundaries manually and created the line features. In general, I was noticeably
surprised that a large university department that has academic programs in GIS and
UHPRWH�VHQVLQJ�ZRXOG�QRW�KDYH�DQ�HDVLO\�DFFHVVLEOH�ÀOH�RI�WKH�FLW\�ERXQGDULHV��)URP�this experience and others, I learned to jettison any basic assumptions I previously had
regarding the existence and accessibility of data in India.
Language and culture created additional barriers to research. In Chandigarh, I often
KDG�GLFXOWO\�FRPPXQLFDWLQJ�ZLWK�WKH�DGPLQLVWUDWLYH�HPSOR\HHV�ZKR�ZHUH�DVVLVWLQJ�ZLWK�P\�GDWD�UHTXHVWV��'HWHUPLQHG�PHHWLQJ�WLPHV�ZHUH�RIWHQ�IUXVWUDWLQJO\�ÁH[LEOH�and resulted in ample wait times. There were also technological discrepancies between
��
the research process in Chandigarh and Seattle. In India I was only provided data as
hard copies, while in Seattle it was already in digital form. The data in hard copy form
slowed down the research process because I needed to convert the data to digital form
XVLQJ�VHYHUDO�GLͿHUHQW�WHFKQLTXHV��,W�PD\�KDYH�DOVR�LQWURGXFHG�VRPH�HUURU�LQ�WKH�GDWD�from this manual conversion process. In general, I think the lack of digital storage of
data inhibited Chandigarh from being able to provide ample data. The slow internet in
India also hindered online research.
In the end, I was able to develop a modest but viable dataset that was the result of
piecing together a variety of small pieces of data that I gathered from government
agencies and research libraries. Conversely, in Seattle, I acquired some data as hard
copies but the majority of the data was already in digital format. The data acquisition
processes in Chandigarh and Seattle were quite distinct and provided lessons for future
research.
LIMITATIONS
7KHUH�DUH�VHYHUDO�QRWDEOH�OLPLWDWLRQV�WR�WKLV�SDSHU��ZKLFK�KDYH�LQÁXHQFHG�WKH�VFRSH�RI�WKH�UHVHDUFK�DQG�WKH�LQWHUSUHWDWLRQ�RI�WKH�ÀQGLQJV��:KHQHYHU�FRQGXFWLQJ�FRPSDUDWLYH�UHVHDUFK�WKHUH�DUH�WUDGHRͿV�EHWZHHQ�DFFRXQWLQJ�IRU�WKH�FRPSOH[LW\�RI�LQGLYLGXDO�SODFHV�DQG�PDNLQJ�JHQHUDOL]DWLRQV�EHWZHHQ�PXOWLSOH�SODFHV��3HWHUV���������6XFK�WUDGHRͿV�DUH�PDQLIHVWHG�ZKHQ�WDNLQJ�D�FDVH�VWXG\��RU�FRQÀJXUDWLYH�DSSURDFK��YHUVXV�HPSOR\LQJ�D�strictly statistical method. The former focuses on a thorough description of a particular
place, accounting for as many and all variables as possible. The statistical method
LGHQWLÀHV�FHUWDLQ�YDULDEOHV�DQG�FRPSDUHV�WKRVH�DFURVV�V\VWHPV��7KXV�WKH�FDVH�VWXG\�approach is more capable of assessing the complexities of a certain place but less
DEOH�WR�SURGXFH�JHQHUDOL]DWLRQV�DERXW�PXOWLSOH�SODFHV��'XH�WR�FRQVWUDLQWV�LQ�WLPH�DQG�UHVRXUFHV��WKLV�SDSHU�IDYRUV�WKH�FRQÀJXUDWLYH�RYHU�WKH�VWDWLVWLFDO��7KHUHIRUH��WKH�ÀQGLQJV�DUH�OLPLWHG�WR�GHVFULSWLRQV�RI�WKH�GDWD�DQG�REVHUYDWLRQV��ZLWKRXW�WKH�DELOLW\�WR�PDNH�ÀUP�JHQHUDOL]DWLRQV�ZLWK�VWDWLVWLFDO�EDFNLQJ��7KH�SXUSRVH�RI�WKLV�SDSHU�ZDV�WR�SURYLGH�D�FRQÀJXUDWLYH�DQDO\VLV�RI�WZR�FLWLHV�DQG�FUHDWH�D�IUDPHZRUN�IRU�D�VXEVHTXHQW�
��
VWDWLVWLFDO�DQDO\VLV��,Q�FRPSDUDWLYH�VWXGLHV��WKHUH�LV�DOVR�D�WUDGHRͿ�EHWZHHQ�LQWHUQDO�DQG�H[WHUQDO�YDOLGLW\��,ELG����,Q�P\�UHVHDUFK��LQWHUQDO�YDOLGLW\�LV�WKH�GHJUHH�WR�ZKLFK�SRSXODWLRQ�GHQVLW\�RU�FOLPDWH�FKDQJH�KDV�LQÁXHQFHG�HOHFWULFLW\�FRQVXPSWLRQ�RYHU�WLPH�DQG�H[WHUQDO�YDOLGLW\�LV�WKH�H[WHQW�WR�ZKLFK�WKH�ÀQGLQJV�IRU�6HDWWOH�DQG�&KDQGLJDUK�FDQ�be generalized to other cities in the US or India respectively. Because of the limits of my
research design and use of data, internal validity is ostensibly greater than the external
validity.
There also may be inherent limitations to comparing across political systems,
JHRJUDSKLFDO�ERXQGDULHV��DQG�FXOWXUHV��,ELG����,W�FDQ�EH�DUJXHG�WKDW�FLWLHV�VXFK�DV�Chandigarh and Seattle are unique places whose patterns of growth and decline are
the result of idiosyncratic processes and events that are endemic to their respective
geopolitical environments. Conversely, structural-functionalism argues that all political
systems can be compared, albeit according to generously broad concepts, because they
PXVW�PDLQWDLQ�VLPLODU�FRUH�IXQFWLRQV��,ELG����$V�P\�GLVFXVVLRQ�RI�XUEDQL]DWLRQ�VFLHQFH�and scaling indicates, I believe that it is possible and useful to compare Chandigarh
DQG�6HDWWOH��UHJDUGOHVV�RI�WKHLU�DSSDUHQW�GLͿHUHQFHV��$OWKRXJK�WKHVH�WZR�FLWLHV�PD\�seem entirely disparate, they have several important similarities that may help mitigate
extraneous variance and help justify comparison. For example, they have similar
SRSXODWLRQ�VL]HV����������������������UHODWLYH�OHYHOV�RI�HFRQRPLF�SURVSHULW\��DQG�ERWK�UHO\�XSRQ�JODFLDO�UXQRͿ�IRU�HOHFWULFLW\�JHQHUDWLRQ�DQG�ZDWHU�VXSSO\��1RQHWKHOHVV��DV�I approached these case studies from a comparative perspective, I understood and
DFNQRZOHGJHG�WKH�IXQGDPHQWDO�GLͿHUHQFHV�EHWZHHQ�WKH�GLVSDUDWH�FRQWH[WV�LQ�ZKLFK�ERWK�FLWLHV�H[LVW��*LYHQ�WKH�VWDUN�GLͿHUHQFHV�EHWZHHQ�WKH�WZR��DQ\�REVHUYHG�VLPLODULWLHV�may be especially notable.
$FFHVV�WR�UHOLDEOH�GDWD�DOVR�OLPLWHG�WKH�VFRSH�RI�UHVHDUFK�DQG�GHSWK�RI�DQDO\VLV��'XULQJ�the data gathering process I encountered a paucity of data in Chandigarh and a few
data limitations in Seattle. Therefore, I was not able to include as many variables into
the analysis. As a result, my ability to comprehensively discuss the determinants of
electricity consumption in both cities is limited. Although population density, per
��
capita income, and electricity use may demonstrate similar trends over the observed
SHULRG��WKHUH�PD\�EH�RWKHU�YDULDEOHV��VXFK�DV�SULFH�RI�HOHFWULFLW\��WKDW�KDYH�LQÁXHQFHG�these trends but were not included in the analysis because the data was not available.
Furthermore, my analysis is limited by the quality of the data; in particular the precision
and accuracy of the data that I acquired in India. The problem of data quality in India is
not unique to my research. Other authors have previously cited the existence of dubious
data in India; “many authors have underlined the problem of comparing over time and
space the urban census data in India. They point out mainly the fuzziness of criteria
that designate statutory town and census town as well as the lack of homogeneity
LQ�WKHLU�DSSOLFDWLRQ�E\�GLͿHUHQW�,QGLDQ�VWDWHV�DQG�IURP�RQH�FHQVXV�WR�WKH�QH[W�VLQFH�����µ��6ZHUWV���������$OWKRXJK�,�FDQQRW�GHÀQLWHO\�FRPPHQW�RQ�WKH�TXDOLW\�RI�WKH�GDWD�,�gathered, I surmise from my experience gathering data and from other researchers, that
more accurate and precise data could be gathered for these variables.
Comparing Chandigarh and Seattle is also complicated by the way that variables may
EH�PHDVXUHG�GLͿHUHQWO\�LQ�,QGLD�DQG�WKH�86��)RU�LQVWDQFH��HVWDEOLVKLQJ�UHOLDEOH�HVWLPDWHV�IRU�SRSXODWLRQ�GHQVLW\�DQG�HQHUJ\�XVH�LQ�&KDQGLJDUK�LV�GLFXOW�EHFDXVH�RI�LQIRUPDO�residences scattered throughout the city. In addition to disparate shacks and tents, there
are approximately 18 larger-scale slum settlements in the city, with total population
reaching tens of thousands. This increases population density that is not accounted for
LQ�RFLDO�VWDWLVWLFV�DQG�WKHVH�DUHDV�GUDZ�HOHFWULFLW\�LOOHJDOO\��,OOHJDO�HOHFWULFLW\�KRRNXSV�DUH�DOVR�QRW�ZHOO�GRFXPHQWHG��$V�D�UHVXOW�WKHUH�PD\�EH�VLJQLÀFDQW�HOHFWULFLW\�XVH�WKDW�LV�not necessarily associated with any particular use sector.
My sampling methodology also presents an additional limitation. For instance,
my sample contains selection bias because I chose Seattle and Chandigarh out of
convenience and expediency, rather than selecting cities randomly. Furthermore, any
conclusions I make are limited by the ability of my samples to representation their
populations; to what extent do Seattle and Chandigarh represent a typical city in the
United States and India respectively? If my samples are not representative of their
SRSXODWLRQV��WKHQ�LW�LV�GLFXOW�WR�H[WUDSRODWH�WKH�UHVXOWV�RI�P\�DQDO\VLV�RXWVLGH�RI�
��
the case studies that I examined. With that in mind, Chandigarh is a unique city in
the Indian context. Chandigarh was essentially designed from scratch, though there
previously existed several small villages on the site in which the city was established,
and was master planned based upon garden city principles by multiple planners,
including the French architect Le Corbusier. In that sense, Chandigarh is rather unique
and not representative of the majority of rapidly growing Indian cities. Nonetheless,
regardless of its origins, Chandigarh still faces the same present day urbanization
pressures that are being observed throughout India.
SUMMARY
This chapter presented a discussion of the results of my data analysis, based upon the
FRQFHSWV�H[DPLQHG�LQ�&KDSWHU����/LWHUDWXUH�5HYLHZ����7KH�DQDO\VLV�GHPRQVWUDWHV�D�YDULHW\�RI�VLPLODULWLHV�DQG�GLͿHUHQFHV�EHWZHHQ�HQHUJ\�JURZWK�WUHQGV�EHWZHHQ�6HDWWOH�DQG�&KDQGLJDUK�RYHU�WLPH��%DVHG�XSRQ�WKHVH�SDWWHUQV��,�GLVFXVVHG�HQHUJ\�HFLHQF\��WKH�evolution of urbanization, the applicability of contributing to an urbanization science,
climate change, and lessons gained from international research.
��
CHAPTER 6: CONCLUSION
7KLV�FKDSWHU�FRQFOXGHV�WKH�SDSHU�E\�VXPPDUL]LQJ�NH\�ÀQGLQJV��IXWXUH�UHVHDUFK��DQG�providing closing remarks. As outlined in the introductory chapter, my research
TXHVWLRQV�DVN�����+RZ�FDQ�FRPSDULQJ�FLWLHV�FRQWULEXWH�WR�D�VKDUHG�XQGHUVWDQGLQJ�RI�WKH�UHODWLRQVKLS�EHWZHHQ�FLW\�VL]H�DQG�HQHUJ\�XVH�DPLG�D�FKDQJLQJ�FOLPDWH"�����$UH�WKHUH�JHQHULF�SDWWHUQV�WKDW�FDQ�EH�REVHUYHG�LQ�VHHPLQJO\�GLVVLPLODU�FLWLHV"��DQG����What methodological approaches are useful for developing a theory of urbanization
science? In order to investigate the original research questions, I hypothesized that
as cities become bigger and warmer, their electricity use will rise as well. Moreover,
I hypothesized that this relationship between city size, temperature, and electricity
consumption over time in Seattle, Washington and Chandigarh, India is fundamentally
GLͿHUHQW��$GGLWLRQDOO\��,�K\SRWKHVL]HG�WKH�H[LVWHQFH�RI�WKUHVKROGV��ZKHUH�WKH�LPSDFW�RI�urban density and size eventually ceases to contribute to increased energy savings or
HFLHQFLHV��7R�D�YDULRXV�GHJUHH��P\�UHVHDUFK�ZDV�DEOH�WR�VKHG�OLJKW�RQ�WKHVH�LQTXLULHV��7KH�RXWFRPH�LV�VHYHUDO�NH\�ÀQGLQJV�WKDW�DUH�ERWK�SUDFWLFDO�DQG�WKHRUHWLFDO�
FINDINGS
0\�UHVHDUFK�KDV�KLJKOLJKWHG�VHYHUDO�ÀQGLQJV�WKDW�DUH�XVHIXO�IRU�SUDFWLFDO�SODQQLQJ�purposes. Based upon the initial analysis, there appear few similarities between
energy-growth patterns in each city and these are outnumbered by the ostensible
GLͿHUHQFHV��)RU�LQVWDQFH��WKH�UHVLGHQWLDO�VHFWRU�LV�D�SULPDU\�FRQVXPHU�RI�HOHFWULFLW\�LQ�both cities, although the growth of this sector in Seattle has plateaued while residential
consumption in Chandigarh is rising. As Chandigarh experiences increased economic
SURVSHULW\�LW�ZRXOG�EH�ZLVH�WR�LQYHVW�LQ�HQHUJ\�HFLHQW�EXLOGLQJ�GHVLJQ�DQG�UHVLGHQWLDO�HQHUJ\�FRQVHUYDWLRQ�LQFHQWLYHV���$OWKRXJK�6HDWWOH�LV�EHFRPLQJ�PRUH�HQHUJ\�HFLHQW�than Chandigarh over the observed period, I have not found any levels of density that
HQJHQGHU�DQ�LGHDOO\�HQHUJ\�HFLHQW�FLW\��$OWKRXJK�XUEDQ�SODQQHUV�JHQHUDOO\�HVSRXVH�FRPSDFW�FLWLHV�DV�SDUDJRQV�RI�VXVWDLQDELOLW\��LW�LV�VWLOO�KLJKO\�XQFHUWDLQ�KRZ�HͿHFWLYH�WKDW�SODQQLQJ�PRGHO�ZLOO�EH�LQ�DGGUHVVLQJ�JOREDO�FOLPDWH�FKDQJH��0DUFRWXOOLR���������
��
:H�VKRXOG�EH�OHHU\�RI�LPSOHPHQWLQJ�DQ\�SODQQLQJ�SROLFLHV�WKDW�DVVXPH�D�RQH�VL]H�ÀWV�DOO�UHODWLRQVKLS�EHWZHHQ�GHQVLW\�DQG�HQHUJ\�HFLHQF\��$GGLWLRQDOO\��FOLPDWH�FKDQJH�ZLOO�OLNHO\�LPSDFW�HOHFWULFLW\�XVH�LQ�ERWK�FLWLHV��WKRXJK�WKH�VSHFLÀF�RXWFRPHV�ZLOO�GLͿHU�because of their disparate geographical locations. Moreover, Chandigarh’s literal impact
on climate and energy in Seattle will likely be minor, partly due to Chandigarh’s unique
heritage. Although energy use in Chandigarh is rising quickly, which contributes to
global climate change, additional city growth will likely be constrained by the city’s
XQLTXH�SODFH�LQ�XUEDQ�KLVWRU\��$V�D�UHVXOW��HQHUJ\�XVH�LQ�&KDQGLJDUK�ZLOO�EH�VWLÁHG�DQG�growth will be accomodated by adjacent cities.
0\�UHVHDUFK�DOVR�XQHDUWKV�VHYHUDO�ÀQGLQJV�ZKLFK�DUH�UHOHYDQW�WR�WKHRU\�DQG�FRQWULEXWH�WR�WKH�JURZLQJ�ÀHOG�RI�XUEDQL]DWLRQ�VFLHQFH��7KH�SURFHVV�RI�XUEDQL]DWLRQ�WKDW�LV�currently occurring in and around Chandigarh currently appears unlike that which
SURSHOOHG�LQLWLDO�JURZWK�LQ�6HDWWOH��7KHUHIRUH��LW�LV�GLFXOW��LI�QRW�LPSRVVLEOH��WR�generalize an urbanization curve in which both cities follow. More time is needed
to observe growth patterns, especially in Chandigarh, to develop reliable theories
of urbanization trajectories. It is possible to compare cities characterized by distinct
socioeconomic and cultural contexts but such comparison presents a variety of
methodological challenges. For example, this type of research faces ample impediments
in acquiring comprehensive and accurate data. Attempting cross-country case study
comparison on electricity use in cities is a challenging but tractable endeavor. These
obstacles are indicative of the general challenge of attempting to contribute to an
urbanization science. Recent research on complexity studies of cities has contributed
PXFK�WR�WKH�JURZLQJ�ÀHOG�RI�XUEDQL]DWLRQ�VFLHQFH��EXW�LW�KDV�HVFKHZHG�D�WKRURXJK�FRQWH[WXDO�XQGHUVWDQGLQJ�LQ�IDYRU�RI�JHQHUDOL]DELOLW\��7KHUH�DUH��WUDGHRͿV�WR�WDNLQJ�D�strictly statistical approach versus a descriptive approach. By exposing the importance
RI�ÀHOG�REVHUYDWLRQV��P\�UHVHDUFK�VKRZV�WKDW�PL[HG�PHWKRGV�UHVHDUFK�LV�D�QHFHVVDU\�component of urbanization science because quantitative theory needs to be tested in
real world situations.
��
FUTURE RESEARCH
My research improves upon the existing literature in several ways and points towards
the need for ample future research. First, my research explicitly addressing energy
in terms of electricity use, whereas previous studies employed energy quite broadly.
Considering that power generation accounts for the highest proportion of global
GHG emissions out of all energy sectors, this is an important distinction to make
�0RQWJRPHU\���������$OVR��PRVW�VWXGLHV�KDYH�DQDO\]HG�HQHUJ\�XVH�E\�LQFRUSRUDWLQJ�transportation into their model. Therefore, most results indicate a positive relationship
between energy and urban density because higher densities limit the distances that
must be traveled using traditional transportation fuels. Future research should continue
to disaggregate fuel types when studying urban growth in order to produce more
nuanced analysis of urbanization-energy use patterns.
Secondly, I use the city as the unit of analysis, rather than taking a national or state
perspective. Other studies that exclude transportation fuels and look solely at electricity
have not used the city as the unit of analysis. Using the city as the unit of analysis
is important because it empowers urban planners to directly use research results in
practice. By taking this perspective, I intend my research outcomes to be directly
applicable to city planners as they make decisions regarding future urban form and
infrastructure in their jurisdiction. Moreoever, my research attempts to increase the
DPRXQW�RI�NQRZOHGJH�ÁRZ�EHWZHHQ�FLWLHV�DPRQJVW�GLͿHUHQW�VWDJHV�RI�XUEDQL]DWLRQ�E\�comparing the dynamics of energy and urbanization between an American and Indian
city. There are minimal studies that attempt to compare electricity-urbanization patterns
RI�FLWLHV�EHWZHHQ�GLͿHUHQW�FRXQWULHV��HVSHFLDOO\�WKRVH�FRQVLGHUHG�PRUH�GHYHORSHG�DQG�less developed. Other comparative research of this type generally compares cities
within a country, or it compares entire nations on a global scale. Although research
has analyzed this topic on the national scales, there is a need to study subnational
VFDOHV��VXFK�DV�PHWURSROLWDQ�DUHDV��/LGGOH���������7KH�PDMRULW\�RI�FRPSDUDWLYH�UHVHDUFK�is conducted at the country level, where there is ample data available from national
governments and international institutions but city level data is less available. Future
��
work should expand the scope of the case studies research presented here and include
additional cities from India and the US. I recommend additional collection of similar
data on cities adjacent to both Seattle and Chandigarh to assist in further understanding
the spatial factors that may be in play. Adding additional cities would increase the
OLNHOLKRRG�WKDW�WKH�VWDWLVWLFDO�ÀQGLQJV�ZRXOG�EH�UHSUHVHQWDWLYH�RI�PRUH�FLWLHV�LQ�,QGLD�and the US, rather than only representative of each city individually.
This paper serves as starting point for comparing the energy-growth patterns in two
GLVWLQFW�SODFHV�WKDW�PD\�ERWK�EHQHÀW�IURP�FRPSDUDWLYH�DQDO\VLV��'XH�WR�D�YDULHW\�RI�constraints and limitations, the conclusions of this paper point to ample future research.
7KLV�SURMHFW�ZDV�LQWHQGHG�DV�D�ÀUVW�DWWHPSW�DW�LQYHVWLJDWLQJ�HQHUJ\�JURZWK�SDWWHUQV�LQ�WZR�VHHPLQJO\�XQLTXH�FLWLHV��XVLQJ�D�PL[HG�PHWKRGV�DSSURDFK��'XH�WR�GLVFUHSDQFLHV�LQ�data availability, I was not able to perform much statistical analysis. A next step would
be to gather additional data, which would enable more reliable statistical analysis. Non-
stationary time series analysis is one advanced statistical technique that would likely
be appropriate for this type of dataset. I recommend gathering additional quantitative
GDWD�WR�ÀOO�KROHV�LQ�WKH�H[LVWLQJ�GDWDVHW��DV�ZHOO�DV�DGGLQJ�DGGLWLRQDO�YDULDEOHV�WR�WKH�dataset. For example, there is general need to connect growth patterns within individual
electricity sectors, such as residential, commercial, or industry, with other metropolitan
JURZWK�YDULDEOHV��6RODULQ���������$VVHVVLQJ�WKH�GHWHUPLQDQWV�RI�PXQLFLSDO�HOHFWULFLW\�consumption at one point in time is a challenging endeavor because of the myriad
variables that must be considered. Thus, attempting to explain the origin of municipal
electricity consumption over time is even more daunting. Cities are complex entities
that we are just beginning to understand. Examining this relationship is a messy and
challenging endeavor due to the myriad variables that may play both direct and indirect
UROHV�LQ�LQÁXHQFLQJ�HOHFWULFLW\�FRQVXPSWLRQ��2QFH�WKH�GDWDVHW�EHFRPHV�PRUH�FRPSOHWH��,�suggest advanced statistical analysis to bolster more reliable conclusions.
Existing, research on the relationship between a changing climate and electricity use
is nascent and deserves further exploration, using case studies from cities in unique
geographical areas. At this point in time, there is a near consensus that climate change
��
is impacting energy use patterns in cities but the exact relationship between geography
and energy outcomes is unclear. This was demonstrated by comparing Seattle and
Chandigarh. Changes in annual and seasonal temperatures impact electricity use
for heating and cooling buildings, but the net energy impact is dependent on local
JHRJUDSK\��6RPH�FLWLHV�PD\�DFWXDOO\�XVH�OHVV�HQHUJ\�XQGHU�GLͿHUHQW�FOLPDWH�FRQGLWLRQV�while others will use more. More research is needed on electricity use in geographically
diverse cities that control for numerous climatic variables over an extended period of
time.
Lastly, more research is needed, using multiple methodological approaches, to assist
in establishing a coherent urbanization science and to resolve any existing tensions
between theory and reality. For instance, there is a tension between claiming that there
are universal characteristics of cities and examining urbanization as an evolutionary
process. Such tensions arise from the complexity of the urbanization process and can
EH�EHWWHU�XQGHUVWRRG�WKURXJK�D�FRPELQDWLRQ�RI�ÀHOG�UHVHDUFK�DQG�TXDQWLWDWLYH�DQDO\VLV��Though advanced analysis of large datasets contribute much to theory, future research
should needs to integrate qualitative observations for a science of cities to become
established as a paradigm.
SUMMARY
In conclusion, this type of research is useful and is needed in the face of growing global
challenges pertaining to climate change, energy use, and urbanization. Looking into the
SDVW�LV�WKH�ÀUVW�VWHS�LQ�EHJLQQLQJ�WR�FRPSUHKHQG�ZKDW�PD\�RFFXU�LQ�D�KLJKO\�XQFHUWDLQ�future. This paper showed that comparing cities from particularly unique international
settings is challenging, but can yield useful insights. Both Chandigarh and Seattle
IDFH�LPSHQGLQJ�FKDOOHQJHV�WKDW�FDQ�EHQHÀW�IURP�LQVLJKWV�JDLQHG�WKURXJK�FRPSDUDWLYH�research. Lastly, because of western society’s primary contribution to present day
changes in climate, we should lead the way in research and knowledge creation that
will help engender more benign forms of future urban growth.
��
REFERENCES
Al-mulali, Usama, Hassan Gholipour Fereidouni, Janice Y. M. Lee, and Che Normee Binti Che Sab. 2013. “Exploring the relationship between urbanization, energy consumption, and CO2 emission in MENA countries.” Renewable & Sustainable (QHUJ\�5HYLHZV�������������GRL����������M�UVHU�������������
Asadoorian, M. O., R. S. Eckaus, and C. A. Schlosser. 2008. “Modeling climate feedbacks WR�HOHFWULFLW\�GHPDQG��7KH�FDVH�RI�&KLQD�µ��(QHUJ\�(FRQRPLFV�������������������GRL����������M�HQHFR�������������
Berner, Richard C., Seattle 1921-1940: From Boom to Bust, Seattle in the 20th Century, Vol 2., Charles Press, Seattle Washington, 1992
Berner, Richard C., Seattle Transformed: World War II to Cold War, Seattle in the 20th Century, Vol 3., Charles Press, Seattle Washington, 1999
%HWWHQFRXUW��/XLV�0��$��������´7KH�2ULJLQV�RI�6FDOLQJ�LQ�&LWLHV�µ��6FLHQFH�����������������1441. doi: 10.1126/science.1235823.
%HWWHQFRXUW��/XÏV�0��$���-RVË�/RER��'LUN�+HOELQJ��&KULVWLDQ�.ÞKQHUW��DQG�*HRͿUH\�%��:HVW��������´*URZWK��LQQRYDWLRQ��VFDOLQJ��DQG�WKH�SDFH�RI�OLIH�LQ�FLWLHV�µ��3URFHHGLQJV�RI�WKH�1DWLRQDO�$FDGHP\�RI�6FLHQFHV�RI�WKH�8QLWHG�6WDWHV�RI�$PHULFD���������������������GRL����������SQDV������������
&HQWHU�IRU�,VUDHO�DQG�-HZLVK�$ͿDLUV��&,-$���´,V�*D]D�WKH�0RVW�'HQVHO\�3RSXODWHG�3ODFH�on Earth?”, http://www.cija.ca/issues/whats-the-situation-in-gaza/gaza-infographic-is-gaza-the-most-densely-populated-place-on-earth/
City of Seattle, 2014, “Moving the Needle: Seattle’s Environmental Progress Report, 6HDWWOH�2FH�RI�6XVWDLQDELOLW\��(QYLURQPHQW
City of Seattle, 2014, “2011-2012 Seattle Building Energy Benchmarking Analysis 5HSRUWµ��6HDWWOH�2FH�RI�6XVWDLQDELOLW\
City of Seattle, Comprehensive Plan, <http://www.seattl e.gov/dpd/city planning /completep rojectslist/comprehensiveplan/doc uments/default.htm>
Chalana, Manish, and Tyler S. Sprague. 2013. “Beyond Le Corbusier and the modernist FLW\��UHIUDPLQJ�&KDQGLJDUK·V�¶:RUOG�+HULWDJH·�OHJDF\µ��3ODQQLQJ�3HUVSHFWLYHV����������199-222.
&KXUFKPDQ��$]UD��'LVHQWDQJOLQJ�WKH�&RQFHSW�RI�'HQVLW\��-RXUQDO�RI�3ODQQLQJ�/LWHUDWXUH�May 1999 13:389-411,
80
&KHQJ��9LFN\����������8QGHUVWDQGLQJ�GHQVLW\�DQG�KLJK�GHQVLW\��,1��(��1J��HG���'HVLJQLQJ�high-density cities: for social and environmental sustainability, London: Earthscan.
&ODUN��7KRPDV�$��������´0HWURSROLWDQ�GHQVLW\��HQHUJ\�HFLHQF\�DQG�FDUERQ�HPLVVLRQV��0XOWL�DWWULEXWH�WUDGHRͿV�DQG�WKHLU�SROLF\�LPSOLFDWLRQVµ��(QHUJ\�3ROLF\������������������
Considine, T. J. 2000. “The impacts of weather variations on energy demand and FDUERQ�HPLVVLRQV�µ��5HVRXUFH�DQG�(QHUJ\�(FRQRPLFV�����������������GRL����������V���������������������
Cowan, Wendy N., Tsangyao Chang, Roula Inglesi-Lotz, and Rangan Gupta. 2014. “The nexus of electricity consumption, economic growth and CO2 emissions in the BRICS countries.” Energy Policy 66:359-368. doi: 10.1016/j.enpol.2013.10.081.
'HPRJUDSKLD��&DQDGD��:HVWHUQ�86$�8UEDQ�$UHDV��&RUH��6XEXUEDQ�'HQVLW\�Analysis, http://www.demographia.com/db-canwusua.htm
Filippini, M., and S. Pachauri. 2004. “Elasticities of electricity demand in urban Indian KRXVHKROGV�µ��(QHUJ\�3ROLF\�����������������GRL����������V���������������������
)RUV\WK��$QQ��0HDVXULQJ�'HQVLW\��:RUNLQJ�'HÀQLWLRQV�IRU�5HVLGHQWLDO�'HQVLW\�DQG�%XLOGLQJ�,QWHQVLW\��'HVLJQ�&HQWHU�IRU�$PHULFDQ�8UEDQ�/DQGVFDSH��'HVLJQ�%ULHI��Number 8/ July 2003
)R[��'����������+DOWLQJ�8UEDQ�6SUDZO��6PDUW�*URZWK�LQ�9DQFRXYHU�DQG�6HDWWOH��%RVWRQ�&ROOHJH�,QWHUQDWLRQDO��&RPSDUDWLYH�/DZ�5HYLHZ��������������
)UDJNLDV��0���-��/RER��'��6WUXPVN\��DQG�.��&��6HWR��������´'RHV�6L]H�0DWWHU"�6FDOLQJ�RI�&2��(PLVVLRQV�DQG�86�8UEDQ�$UHDV�µ��3ORV�2QH��������GRL����������MRXUQDO�SRQH���������
Hamlet, Alan F., Se-Yeun Lee, Kristian E. B. Mickelson, and Marketa M. Elsner. 2010. ´(ͿHFWV�RI�SURMHFWHG�FOLPDWH�FKDQJH�RQ�HQHUJ\�VXSSO\�DQG�GHPDQG�LQ�WKH�3DFLÀF�1RUWKZHVW�DQG�:DVKLQJWRQ�6WDWH�µ��&OLPDWLF�&KDQJH��������������������GRL����������V���������������\�
,QWHUQDWLRQDO�3DQHO�RQ�&OLPDWH�&KDQJH��,3&&����������WK�$VVHVVPHQW��$5��-RQHV��'��:��������´+2:�85%$1,=$7,21�$))(&76�(1(5*<�86(�,1�'(9(/23,1*�&28175,(6�µ��(QHUJ\�3ROLF\�����������������GRL�������������������������������
Kolbert, Elizbeth, The Sixth Extinction: An Unnatural History, p 61, Bloomsbury Publishing, 2014
.XKQ��7KRPDV�6���������´7KH�6WUXFWXUH�RI�6FLHQWLÀF�5HYROXWLRQV�µ�8QLYHUVLW\�RI�&KLFDJR�Press, Second Edition, Enlarged

81
.UH\��9���%��&��2·1HLOO��%��YDQ�5XLMYHQ��9��&KDWXUYHGL��9��'DLRJORX��-��(RP��/��:��-LDQJ��1��G. Yu, S. Pachauri, and X. L. Ren. 2012. “Urban and rural energy use and carbon dioxide HPLVVLRQV�LQ�$VLD�µ��(QHUJ\�(FRQRPLFV����6����6�����GRL����������M�HQHFR�������������
/DPVDO��/��1���5��9��0DUWLQ��'��'��3DUULVK��DQG�1��$��.URWNRY��������´6FDOLQJ�5HODWLRQVKLS�for NO2 Pollution and Urban Population Size: A Satellite Perspective.” Environmental 6FLHQFH��7HFKQRORJ\��������������������GRL����������HV������J�
/DQNDR�35��-/�7ULEELD��DQG�'�1\FKND��������´7HVWLQJ�WKHRULHV�WR�H[SORUH�WKH�GULYHUV�RI�FLWLHV·�DWPRVSKHULF�HPLVVLRQVµ��$PELR�����������������
Lariviere, I., and G. Lafrance. 1999. “Modelling the electricity consumption of FLWLHV��HͿHFW�RI�XUEDQ�GHQVLW\�µ��(QHUJ\�(FRQRPLFV���������������GRL����������V���������������������
Liddle, B. 2013. “The Energy, Economic Growth, Urbanization Nexus Across 'HYHORSPHQW��(YLGHQFH�IURP�+HWHURJHQHRXV�3DQHO�(VWLPDWHV�5REXVW�WR�&URVV�6HFWLRQDO�'HSHQGHQFH�µ��(QHUJ\�-RXUQDO�����������������GRL��������������������������
Liddle, Brantley. 2013. “Urban density and climate change: a STIRPAT analysis using city-level data.” Journal of Transport Geography 28:22-29. doi: 10.1016/j.jtrangeo.2012.10.010.
Madlener, Reinhard, and Yasin Sunak. 2011. “Impacts of urbanization on urban structures and energy demand: What can we learn for urban energy planning and XUEDQL]DWLRQ�PDQDJHPHQW"µ�6XVWDLQDEOH�&LWLHV�DQG�6RFLHW\���������������
Marcotullio, Peter John, Andrea Sarzynski, Jochen Albrecht, Niels Schulz, and Jake Garcia. 2013. “The geography of global urban greenhouse gas emissions: an exploratory DQDO\VLV�µ��&OLPDWLF�&KDQJH������������������GRL����������V���������������]�
0RQWJRPHU\��6FRWW�/��������7KH�SRZHUV�WKDW�EH��JOREDO�HQHUJ\�IRU�WKH�WZHQW\�ÀUVW�century and beyond. Chicago: University of Chicago Press.
0RWH��3���$��.��6QRYHU��6��&DSDOER��6��'��(LJHQEURGH��3��*OLFN��-��/LWWHOO��5��5D\PRQGL��DQG�S. Reeder, 2014: Ch. 21: North- west. Climate Change Impacts in the United States: The 7KLUG�1DWLRQDO�&OLPDWH�$VVHVVPHQW��-��0��0HOLOOR��7HUHVH��7�&���5LFK��PRQG��DQG�*��:��<RKH��(GV���8�6��*OREDO�&KDQJH�5HVHDUFK�3URJUDP�����������GRL���������-��4�5:;�
Mulligan, Gordon F. 2013. “Revisiting the urbanization curve.” Cities 32:113-122. doi: 10.1016/j.cities.2013.03.014.
Newman, P., Kenworthy, J., 1999. Sustainability and Cities: Overcoming Auto- mobile 'HSHQGHQFH��,VODQG�3UHVV��:DVKLQJWRQ��'�&�

82
Newton, Chad, 2011, “Census 2010: City of Seattle population density map”, http://buildthecity.wordpress.com/2011/03/19/census-2010-city-of-seattle-population-density-map/
2·1HLOO��%��&���;��/��5HQ��/��:��-LDQJ��DQG�0��'DOWRQ��������´7KH�HͿHFW�RI�XUEDQL]DWLRQ�RQ�energy use in India and China in the iPETS model.” Energy Economics 34:S339-S345. doi: 10.1016/j.eneco.2012.04.004.
Parikh, Jyoti, and Vibhooti Shukla. 1995. “Urbanization, energy use and greenhouse HͿHFWV�LQ�HFRQRPLF�GHYHORSPHQWµ��*OREDO�(QYLURQPHQWDO�&KDQJH����������������
Paul, Surender, Singh, S.S., Kaur, Karanjot, Chandel, Viswa, 2013, “Analysis of Precipitation and Temperature Variability in Chandigarh”, India Meteorological 'HSDUWPHQW��&KDQGLJDUK��,QGLD�0HWHRURORJLFDO�'HSDUWPHQW��1HZ�'HOKL��3DQMDE�University Chandigarh
Paul, Surender, Wg. Cdr. R. Jain and S.C. Bhan, 2011, “Climate of the Union Territory of Chandigarh” Government of India, Minstry of Earth Sciences, India Meteorological 'HSDUWPHQW��0HWHRURORJLFDO�&HQWUH��&KDQGLJDUK�
Peters, Guy B., 1998, “Comparative Politics: Theory and Methods,” New York University Press, New York, New York
3RSSHU��.DUO�5��������7KH�ORJLF�RI�VFLHQWLÀF�GLVFRYHU\��/RQGRQ��5RXWOHGJH�
3RXPDQ\YRQJ��3KHWNHR��DQG�6KLQML�.DQHNR��������´'RHV�XUEDQL]DWLRQ�OHDG�WR�OHVV�energy use and lower CO2 emissions? A cross-country analysis.” Ecological Economics ����������������GRL����������M�HFROHFRQ�������������
Ratti, C., N. Baker, and K. Steemers. 2005. “Energy consumption and urban texture.” (QHUJ\�DQG�%XLOGLQJV�����������������GRL����������M�HQEXLOG�������������
6DGRUVN\��3��������´'R�XUEDQL]DWLRQ�DQG�LQGXVWULDOL]DWLRQ�DͿHFW�HQHUJ\�LQWHQVLW\�LQ�GHYHORSLQJ�FRXQWULHV"µ��(QHUJ\�(FRQRPLFV�����������GRL����������M�HQHFR�������������Sale, Roger, Seattle: Past to Present, University of Washington Press, Seattle and /RQGRQ�������
Samet, R. H. 2013. “Complexity, the science of cities and long-range futures.” Futures ����������GRL����������M�IXWXUHV�������������
Schmid, Calvin F., Social Trends in Seattle, University of Washington Publications in Social Sciences, Vol 14. October 1944, University of Washington Press, Seattle Washington 1944.
6HDWWOH�3RVW�,QWHOOLJHQFHU��6HDWWOH�3,����������´6HDWWOH·V�JURZWK�SURMHFWLRQ�UHÁHFWV�D�FLW\�pushing limits”, Aubrey Cohen, http://www.seattlepi.com/local/article/Seattle-s-
83
JURZWK�SURMHFWLRQ�UHÁHFWV�D�FLW\���������SKS
Solarin, S. A., and M. Shahbaz. 2013a. “Trivariate causality between economic growth, urbanisation and electricity consumption in Angola: Cointegration and causality DQDO\VLV�µ��(QHUJ\�3ROLF\�������������GRL����������M�HQSRO�������������
Solarin, Sakiru Adebola, and Muhammad Shahbaz. 2013b. “Trivariate causality between economic growth, urbanisation and electricity consumption in Angola: Cointegration DQG�FDXVDOLW\�DQDO\VLV�µ��(QHUJ\�3ROLF\�������������GRL����������M�HQSRO�������������
Solecki, William, Seto, Karen C., Marcotullio, Peter J., “It’s Time for An Urbanization Science, Environment Magazine, Vol 55, Number 1, January/February 2013
Steemers, K. 2003. “Energy and the city: density, buildings and transport.” Energy and %XLOGLQJV��������������GRL����������V���������������������6ZHUWV��(���'��3XPDLQ��DQG�(��'HQLV��������´7KH�IXWXUH�RI�,QGLD·V�XUEDQL]DWLRQµ��Futures.56: 43-52.
Swan, L.G., and V.I. Ugursal. 2009. “Modeling of end-use energy consumption in the residential sector: A review of modeling techniques”. Renewable and Sustainable (QHUJ\�5HYLHZV�������������������
6ZHUWV��(���'��3XPDLQ��DQG�(��'HQLV��������´7KH�IXWXUH�RI�,QGLD·V�XUEDQL]DWLRQµ��)XWXUHV��56: 43-52.
TERI, 2009, “Master Plan to Make Chandigarh a Solar City”, Prepared for Chandigarh 5HQHZDEOH�(QHUJ\�6FLHQFH�DQG�7HFKQRORJ\�3URPRWLRQ�6RFLHW\��&5(67���)LQDO�5HSRUW
7XUQHU��.��������´CC5HERXQG··�(ͿHFWV�IURP�,QFUHDVHG�(QHUJ\�(FLHQF\��$�7LPH�WR�3DXVH�DQG�5HÁHFWµ��(1(5*<�-2851$/��&$0%5,'*(�0$�7+(1�&/(9(/$1'�2+�����������25-42.
8EDQL��2ELQQD��������´'HWHUPLQDQWV�RI�WKH�G\QDPLFV�RI�HOHFWULFLW\�FRQVXPSWLRQ�LQ�1LJHULD�µ��23(&�(QHUJ\�5HYLHZ�����������������GRL����������RSHF�������
86�(QHUJ\�,QIRUPDWLRQ�$VVRFLDWLRQ��(,$���������,QWHUQDWLRQDO�(QHUJ\�2XWORRN�������Highlights, http://www.eia.gov/forecasts/ieo/more_highlights.cfm
Utkarsh Anand, SC stops Tata housing project near Chandigarh, Financial Times, ������KWWS���ZZZ�ÀQDQFLDOH[SUHVV�FRP�QHZV�VF�VWRSV�WDWD�KRXVLQJ�SURMHFW�QHDU�FKDQGLJDUK��������
Vimal, Bindia, 1994, “The Planned City of Chandigarh: A Geographical Appraisal, 'HSDUWPHQW�RI�*HRJUDSK\��3DQMDE�8QLYHUVLW\��&KDQGLJDUK��7KHVLV
:ROIUDP��&DWKHULQH��2ULH�6KHOHI��DQG�3DXO�*HUWOHU��������´+RZ�:LOO�(QHUJ\�'HPDQG�

84
'HYHORS�LQ�WKH�'HYHORSLQJ�:RUOG"µ�-RXUQDO�RI�(FRQRPLF�3HUVSHFWLYHV������������������
WRCC, 2013, Climate of Washington, http://www.wrcc.dri.edu/narratives/WASHINGTON.htm
<RXQJ��6WHSKDQLH�������´8UEDQ�+HDW�,VODQG��8+,��(ͿHFW�LQ�WKH�3XJHW�6RXQG�5HJLRQ��$GDSWDWLRQ�DQG�%LRPLPHWLF�6WUDWHJLHV�WR�0LWLJDWH�WKH�(ͿHFWV�RI�&OLPDWH�&KDQJH�µ�University of Washington Thesis