Embed Size (px)
Citation preview
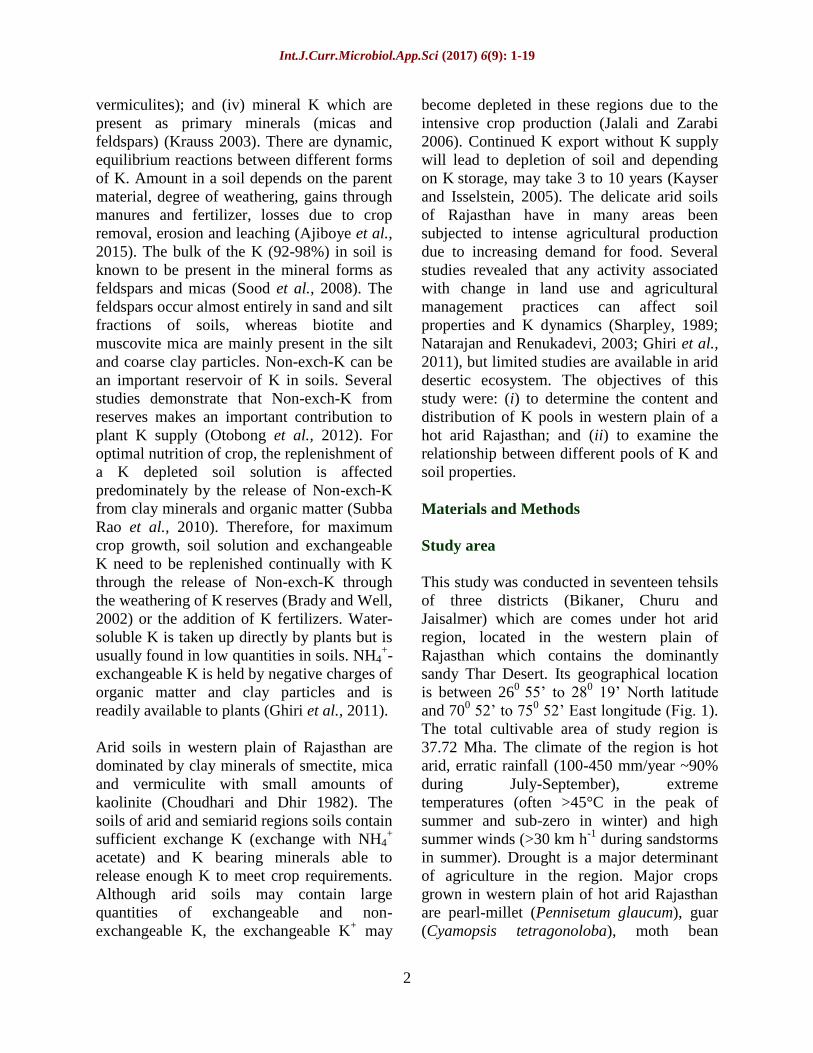
Int.J.Curr.Microbiol.App.Sci (2017) 6(9): 1-19
1
Original Research Article https://doi.org/10.20546/ijcmas.2017.609.001
Assessing of Potassium Reserve and their Relationship with
Soil Properties in Western Plain of Arid India
Sunil Kumar1*
, I.J. Gulati2, S.R. Yadav
2, Manisha
2, P.C. Moharana
1,
R.L. Meena1, M. Nogiya
1 and R.S. Singh
1
1ICAR-National Bureau of Soil Survey and Land Use Planning, Regional Centre,
Udaipur 313001, India 2Swami Keshwanand Rajasthan Agricultural University, Bikaner, Rajasthan 334001, India
*Corresponding author
A B S T R A C T
Introduction
Potassium (K) is a major constituent of the
earth crust contained more in igneous rocks
than the sedimentary rocks. K comprise on an
average of 1.9 % of the earth crust, making it
the seventh most abundant element and fourth
most abundant mineral nutrient in the
lithosphere but only a very small proportion
of it become available to plants (Tisdale et al.,
1985). Because of large differences in soil
parent materials and the effect of weathering
of these materials, the amount of K supplied
by soils varies. However, actual soil
concentrations of this nutrient vary widely
ranging from 0.04 to 3.0 % (Sparks and
Huang, 1985). Plants can take up K only from
the soil solution and its availability is
dependent upon the K dynamics as well as on
total K content. K is present in soil in four
main forms (Jalali, 2007). These are: (i) water
soluble K (solution K) which is dissolved in
the soil solution; (ii) exchangeable K is the
form that is electrostatically retained by
negatively charged soil colloids (clays,
organic matter, sesquioxides); (iii) Non-exch-
K is temporarily trapped between the
interlayers of clay minerals (illites,
International Journal of Current Microbiology and Applied Sciences ISSN: 2319-7706 Volume 6 Number 9 (2017) pp. 1-19 Journal homepage: http://www.ijcmas.com
In order to investigate changes of potassium (K) status in western plain of Rajasthan, two
hundred nine surface (0-15cm depth) soil samples were collected from seventeen tehsils of
three districts (Bikaner, Churu and Jaisalmer). Soils were in general light in texture and
neutral to slightly alkaline in reaction. The OC content of the soils varied from 0.1 to 2.5 g
kg-1
. H2O-K and NH4OAc-K ranged from 2.9 to 47.1 (mean value 18.3) mg kg-1
and 13.8
to 202.7 (mean value 91.2) mg kg-1
, respectively. The HNO3-K and HCl-K varied from
154.4 to 635.5 (mean value 318.7) mg kg-1
and 8.1 to 99.3 (mean value 40.8) mg kg-1
,
respectively. Highly significant positive relationships amongst various fractions of soil K
indicated existence of a dynamic equilibrium between different forms of K. The studied
soils had major portion of their K fraction content in lattice-K it contributed about 87.0 to
90.3 % of total-K because of rich K bearing minerals of soils followed by 6.7 to 9.9 % of
Non-exch-K and 2.3 to 3.3 % of Exch-K towards total-K. On the basis of nutrient index
mostly soils were found medium (68.4 %) in available K.
K e y w o r d s
K fractions, Soil
properties, Arid
India.
Accepted:
04 July 2017
Available Online:
10 September 2017
Article Info
Int.J.Curr.Microbiol.App.Sci (2017) 6(9): 1-19
2
vermiculites); and (iv) mineral K which are
present as primary minerals (micas and
feldspars) (Krauss 2003). There are dynamic,
equilibrium reactions between different forms
of K. Amount in a soil depends on the parent
material, degree of weathering, gains through
manures and fertilizer, losses due to crop
removal, erosion and leaching (Ajiboye et al.,
2015). The bulk of the K (92-98%) in soil is
known to be present in the mineral forms as
feldspars and micas (Sood et al., 2008). The
feldspars occur almost entirely in sand and silt
fractions of soils, whereas biotite and
muscovite mica are mainly present in the silt
and coarse clay particles. Non-exch-K can be
an important reservoir of K in soils. Several
studies demonstrate that Non-exch-K from
reserves makes an important contribution to
plant K supply (Otobong et al., 2012). For
optimal nutrition of crop, the replenishment of
a K depleted soil solution is affected
predominately by the release of Non-exch-K
from clay minerals and organic matter (Subba
Rao et al., 2010). Therefore, for maximum
crop growth, soil solution and exchangeable
K need to be replenished continually with K
through the release of Non-exch-K through
the weathering of K reserves (Brady and Well,
2002) or the addition of K fertilizers. Water-
soluble K is taken up directly by plants but is
usually found in low quantities in soils. NH4+-
exchangeable K is held by negative charges of
organic matter and clay particles and is
readily available to plants (Ghiri et al., 2011).
Arid soils in western plain of Rajasthan are
dominated by clay minerals of smectite, mica
and vermiculite with small amounts of
kaolinite (Choudhari and Dhir 1982). The
soils of arid and semiarid regions soils contain
sufficient exchange K (exchange with NH4+
acetate) and K bearing minerals able to
release enough K to meet crop requirements.
Although arid soils may contain large
quantities of exchangeable and non-
exchangeable K, the exchangeable K+ may
become depleted in these regions due to the
intensive crop production (Jalali and Zarabi
2006). Continued K export without K supply
will lead to depletion of soil and depending
on K storage, may take 3 to 10 years (Kayser
and Isselstein, 2005). The delicate arid soils
of Rajasthan have in many areas been
subjected to intense agricultural production
due to increasing demand for food. Several
studies revealed that any activity associated
with change in land use and agricultural
management practices can affect soil
properties and K dynamics (Sharpley, 1989;
Natarajan and Renukadevi, 2003; Ghiri et al.,
2011), but limited studies are available in arid
desertic ecosystem. The objectives of this
study were: (i) to determine the content and
distribution of K pools in western plain of a
hot arid Rajasthan; and (ii) to examine the
relationship between different pools of K and
soil properties.
Materials and Methods
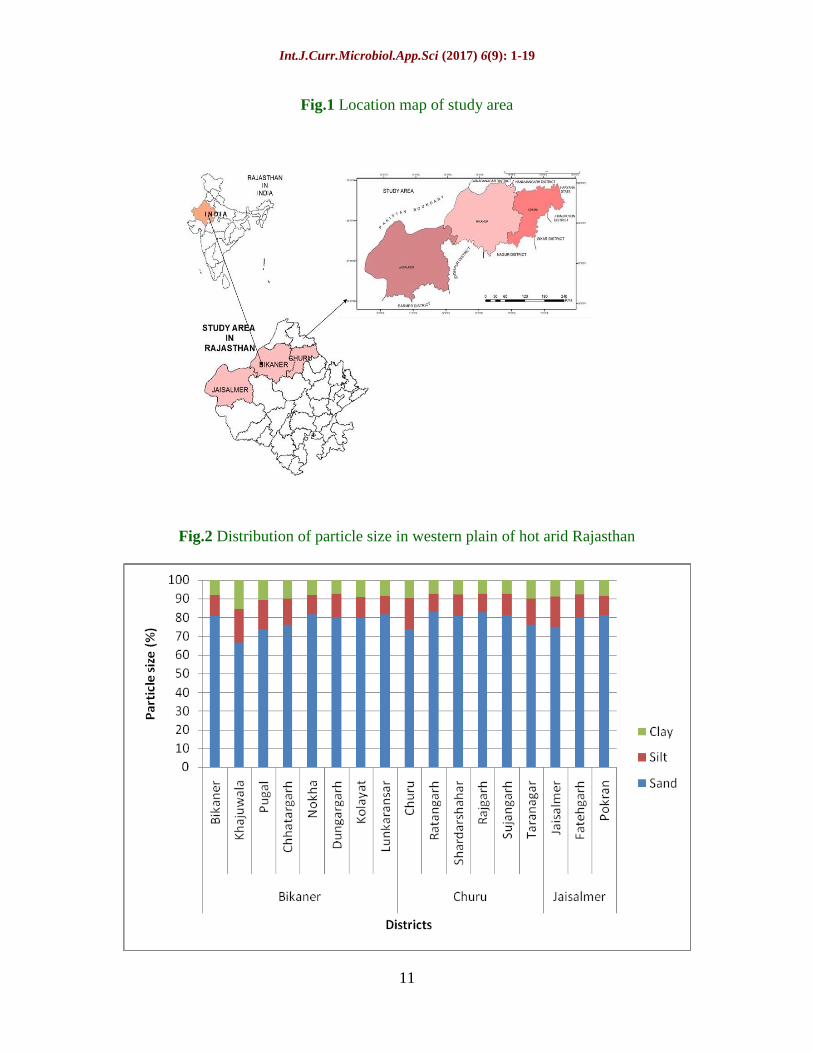
Study area
This study was conducted in seventeen tehsils
of three districts (Bikaner, Churu and
Jaisalmer) which are comes under hot arid
region, located in the western plain of
Rajasthan which contains the dominantly
sandy Thar Desert. Its geographical location
is between 260
55’ to 280 19’ North latitude
and 700 52’ to 75
0 52’ East longitude (Fig. 1).
The total cultivable area of study region is
37.72 Mha. The climate of the region is hot
arid, erratic rainfall (100-450 mm/year ~90%
during July-September), extreme
temperatures (often >45°C in the peak of
summer and sub-zero in winter) and high
summer winds (>30 km h-1
during sandstorms
in summer). Drought is a major determinant
of agriculture in the region. Major crops
grown in western plain of hot arid Rajasthan
are pearl-millet (Pennisetum glaucum), guar
(Cyamopsis tetragonoloba), moth bean
Int.J.Curr.Microbiol.App.Sci (2017) 6(9): 1-19
3
(Vigna aconitifolia), green gram (Vigna
radiata), chickpea (Cicer arietinum), mustard
(Brassica juncea), wheat (Triticum aestivum)
and groundnut (Arachis hypogaea).
Soil
The soils are mainly derived through aeolian
activity prevailing in the area. The dominant
soils are deep to very deep, calcareous to non-
calcareous and sandy in nature. The
windblown sand of recent to sub recent period
is mainly consists of quartz, with minor
biotite and magnetite. Gypsite rich beds are
found in shallow depression surrounded by
sand dunes. The clay mineralogical suites
were predominantly of illite with small
amounts of chlorite, vermiculite, mixed layer
minerals and kaolinite. Thickness of soil
ranged between 115 to 140 cm. Colour was
10 YR hue, 4 to 6 value and 3 to 4 chroma.
Texture varied from sandy to loam with weak
to moderate prismatic structure. The soil was
moderately saline and sodic; organic C and
CaCO3 contents were 0.27 and 2.6%,
respectively. The soil moisture control section
remains dry throughout the year. These soils
are classified as Typic Torripsamments. The
other less extensive soils occupying relatively
lower topographic position in the interdunal
plains are classified under Typic Calciorthids,
Typic paleorthid and Typic salorthid
(Shyampura et al., 1995).
Soil sampling and analysis
The surface soil samples (n= 209) were
collected from irrigated and non-irrigated
fields covering three districts (Bikaner, Churu
and Jaisalmer) in western plain of hot arid
Rajasthan. The samples were air-dried in
shade, grind to pass through a 2 mm sieve and
used for the estimation of soil properties and
potassium fractions. Particle size distribution
was determined by the suspension procedure
using the hydrometer method after dispersing
the soil with sodium hexa metaphosphate
(Bouyoucos, 1927). The pH was determined
using 1:2.5 soil and water suspension by a
glass electrode (Jackson, 1973) and EC was
determined using standard precision
conductivity bridge (Jackson, 1973). The
CaCO3 in soil was determined by a rapid
titration method (Puri, 1930). Organic matter
was determined by Walkley and Black’s wet
digestion method (Walkley and Black, 1934).
Cation exchange capacities of the soils were
determined by the procedure described by
(Jackson, 1973). The water soluble potassium
(WSK) was determined by shaking air-dried
soil (5 g) with distilled water (25 mL)
overnight, followed by centrifugation and
filtration. Plant available potassium
(NH4AOc-extractable K) was measured by
shaking soil with ammonium acetate for 5
min in an end-over-end shaker; it was then
centgrifuged and filtered, and potassium was
analysed using flame photometer (Hanway
and Heidel, 1952). The HNO3-extractable K
(HNO3-K) was determined by boiling soil (<2
mm, 2.5 g) with HNO3 (1 mol/L, 25 mL) for
10 min and analysing the extracted potassium
using flame photometer (Knudsen et al.,
1982). The HCl soluble potassium (HCl-K)
was determined by using Garman (1957)
method with some modifications made by Pal
and Mukhopadhyaya (1992). Five gm soil
was transferred in centrifuged tube, 50 ml of
0.01 N HCl was added, shaken for 15 minutes
centrifuged at 2000 rpm and potassium was
determined by flame photometrically in the
supernatant liquid. To same soil, another 50
ml 0.01N HCl was added and the same
procedure was repeated 15 times or till the
amount of potassium released, attained a
constant value or zero. The cumulative
potassium releasing power of soil was
calculated by adding all the values of
potassium extracted by the successive
extractions. Total potassium (Total K) was
determined using the method of (Knudsen et
al., 1982). One gram of soil was completely
Int.J.Curr.Microbiol.App.Sci (2017) 6(9): 1-19
4
digested in hydrofluoric (HF) and perchloric
(HClO4) acid mixtures under a fume hood.
The filtrate was brought to volume in a 100
mL volumetric flask, and total potassium was
content determined with a flame photometer.
The exchangeable potassium (Exch K), non-
exchangeable potassium (Non-exch K) and
lattice potassium (Lattice K) were obtained
according to the mathematical procedures
used by (Samadi et al., 2008), which are
described below:
Exch K= NH4AOc extractable K - WSK -- (i)
Non-exch K= HNO3 extractable K - Exch K -
------- (ii)
Lattice K= Total K - HNO3 extractable K -----
------- (iii)
Statistical analysis
Statistical analysis was carried out for data
calculation using Microsoft Excel (Microsoft
Corporation, USA) and Pearson’s correlation
matrix for different pools of potassium and
soil properties was computed by the SPSS 16
(Statistical Package for the Social Science,
SPSS, Inc., Chicago, USA, window version
16.0).
Results and Discussion
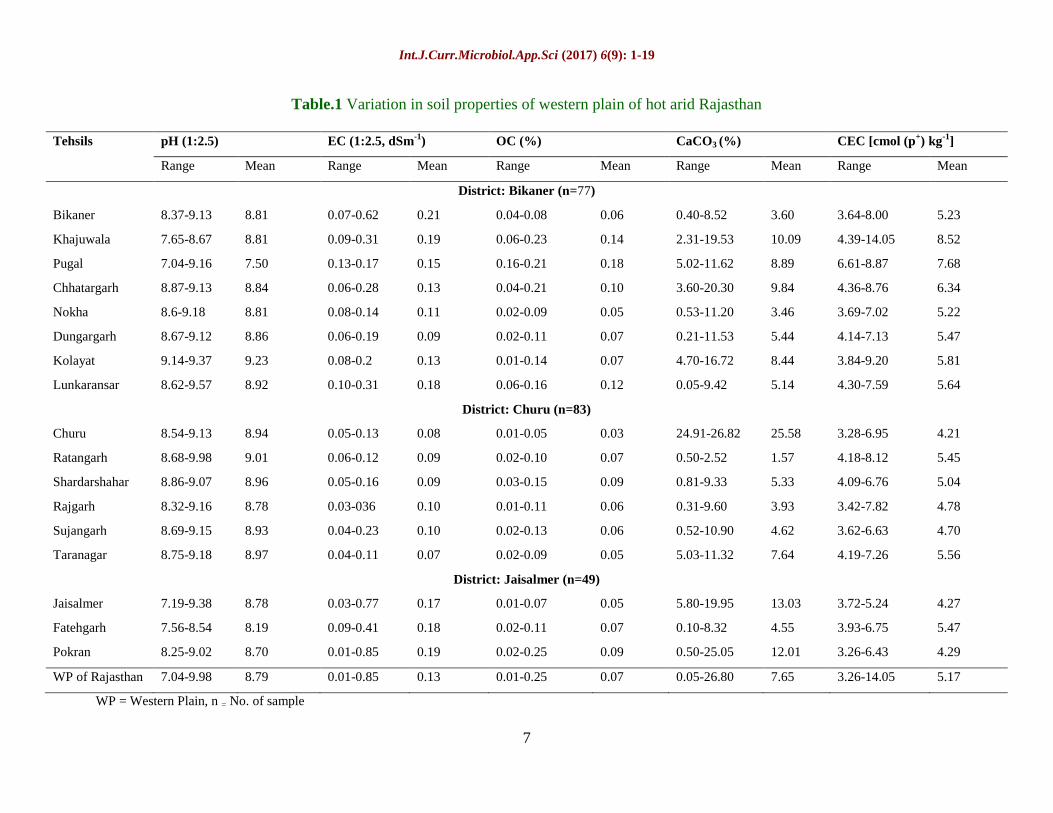
Variation in soil properties
Selected important physical and chemical
properties of the soil studied are given in
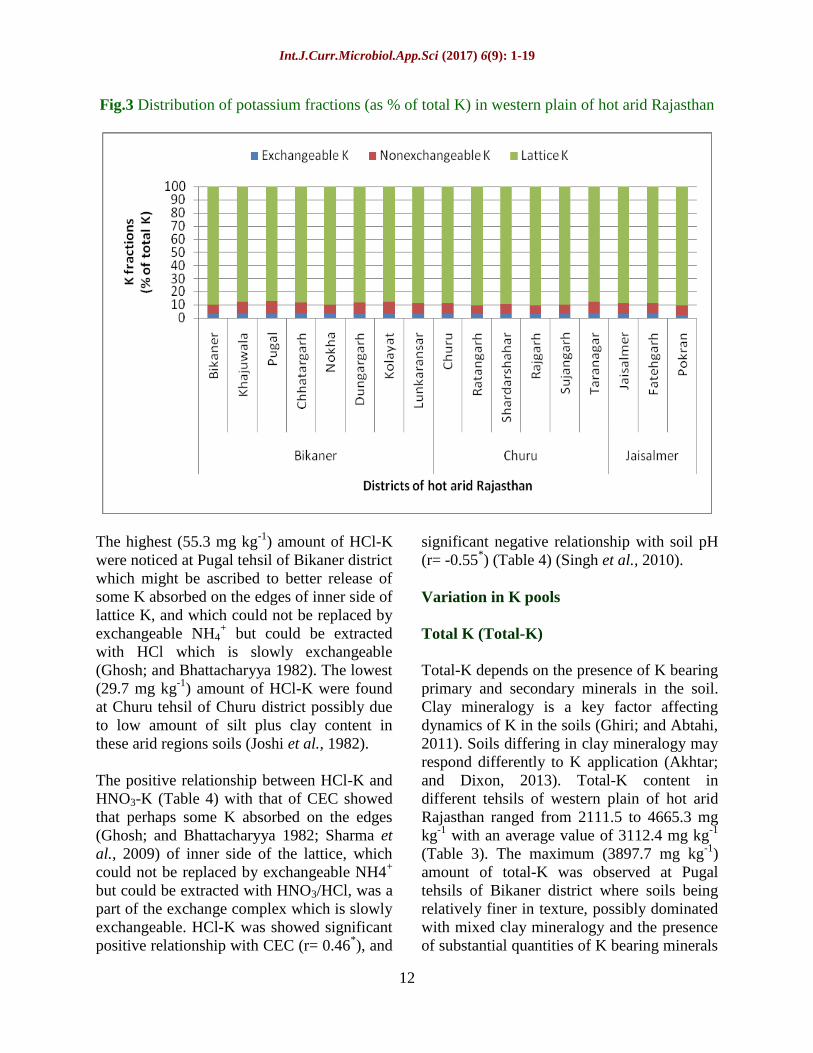
(Table 1). The particle size analysis gives the
percentage of sand, silt and clay fractions in
soils and there by textural class. The texture
class of western plain of hot arid Rajasthan
varied from loam to loamy sand in nature
indicating dominance of sand fraction in the
studied area (Fig. 2). The recorded particle
size analysis of soils indicated that these soils
might have been formed from alluvial
material and are thus have characteristic
coarse texture due to poor profile
development which subscribed to same as
(Jalali, 2005). The pH value of studied soil
varied from 7.04 to 9.98 with an average
value of 8.79 which shows that the mojority
of soil is alkaline in nature (Table 1). The
highest (9.23) mean value of pH were found
in Kolayat tehsils of Bikaner district hot arid
region because of there is no effective
vegetation grown and the lowest (7.50) mean
value of pH were observed in pugal tehsils of
Bikaner district (Table 1). The relatively high
pH of these soils might be due to medium to
high degree of sodium saturation which on
hydrolysis imparted OH-
ions and high
carbonate and bicarbonate (Singh et al.,
2010). The electrical conductivity (EC) of
these soils varied from 0.01 to 0.85 dsm-1
with an average value of 0.13 dsm-1
(Table 1)
and the highest (0.21 dsm-1
) mean value of
EC were noticed in Bikaner tehsil of Bikaner
district possibly because of basic parent
materials from which soil have been formed
and may be due to high temperature, low
rainfall and low application of organic
manures (Abu-Zahra et al., 2008; and Sarwar
et al., 2010). The lowest (0.07 dsm-1
) mean
value of EC was observed at Taranagar tehsil
of Churu district it may be due to applying
organic manures higher than those from the
mineral fertilizer (Singh et al., 2010). Low
mean value of electrical conductivity in soil
samples showed that the presence of salts in
these soils was negligible. The organic carbon
(OC) is ranged from 0.01 to 0.25 % with
mean value of 0.07 % (Table 1). Among the
seventeen tehsils of western plain of hot arid
Rajasthan the highest (0.18 %) mean value of
OC were found at Pugal tehsil of Bikaner
district it may be due to the native residue of
crops and addition of farm yard manure
(Singh et al., 2007). The lowest (0.03 %)
mean value was noticed at Churu tehsil of
Churu district because there is lack of natural
vegetation, poor decomposition due to low
Int.J.Curr.Microbiol.App.Sci (2017) 6(9): 1-19
5
rainfall, high oxidation due to high summer
temperature and wind erosion. No farm yard
manure (FYM) has been applied to most of
the soils for last many years which might be
another reason for low OC status of these
soils (Meena and Biswas, 2014). The calcium
carbonate (CaCO3) content in western plain of
Rajasthan varied from 0.05 to 26.80 % with
an average value of 7.65 % (Table 1)
indicating that most of the soil is calcareous
in nature. The highest (25.58 %) mean value
of CaCO3 was observed in Churu tehsil of
Churu district of western plain of Rajasthan it
may be due to the basic parent material; low
rainfall and high temperature are found
(Singh et al., 2006). The lowest (1.57 %)
mean value of CaCO3 was noticed at
Ratangarh tehsil of Churu district of western
Rajasthan. Such a type of variations in CaCO3
content in the studied area might be due to
variation in the parent material and pedogenic
processes by which soils have developed. The
cation exchange capacity (CEC) from western
plain of hot arid region soils varied from 3.26
to 14.05 cmol (p+) kg
-1 with an average value
of 5.17 cmol (p+) kg
-1 (Table 1). The highest
(8.52 cmol (p+) kg
-1) mean value of CEC was
observed at Khajuwala tehsils of Bikaner
district which could be ascribed to using input
as organic manure and inorganic fertilizers
that lead to amount of OC content and clay
content in the soils of arid region
(Srinivasarao et al., 2014). Whereas the
lowest mean value of CEC was observed at
Churu tehsil of Churu district in western plain
of arid Rajasthan which might be due to low
OC content, coarse texture, low rainfall, and
no addition of manures and fertilizers (Dan et
al., 2004).
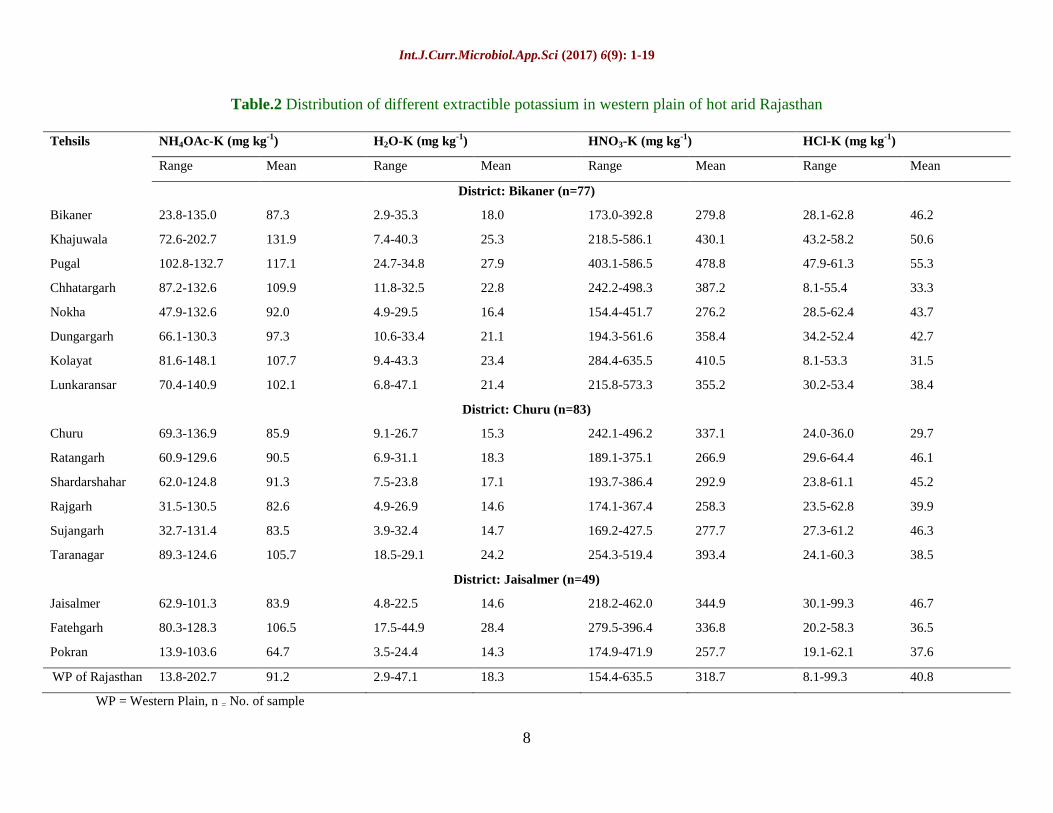
Variation in extractable K
NH4OAc-extractible K (NH4OAc-K)
NH4OAc-K plays a very important role in the
growth of plants because exchangeable and
solution K are only sources of K which are
readily available to plants. The content of
NH4OAc- K ranged from 13.8 to 202.7 mg
kg-1
with mean value of 91.2 mg kg-1
in soils
of arid region (Table 2). The highest amount
(131.9 mg kg-1
) of NH4OAc-K was recorded
at Khajuwala tehsil of Bikaner district where
being relatively finer in texture have clay
fraction consisting of mica (illite), smectite
and vermiculite soils. Further, mica being the
most dominant clay mineral in the coarse clay
fraction might have contributed in available K
Besides, due to better cropping history of the
area to the fact that with increase in organic
matter in soils, the clay-humus increases
organic matter and clay-humus complex’s
possibly have provided more exchange sites
and access to K (Joshi et al., 1978; Sharma et.
al., 2009). The lowest (64.7 mg kg-1
) mean
value of NH4OAc-K was recorded in at
Pokran tehsil of Jaisalmer district which could
be ascribed to low amount of OC, coarse
texture of soils and no application of manures
and K fertilizers (Dovalti et al., 2010).
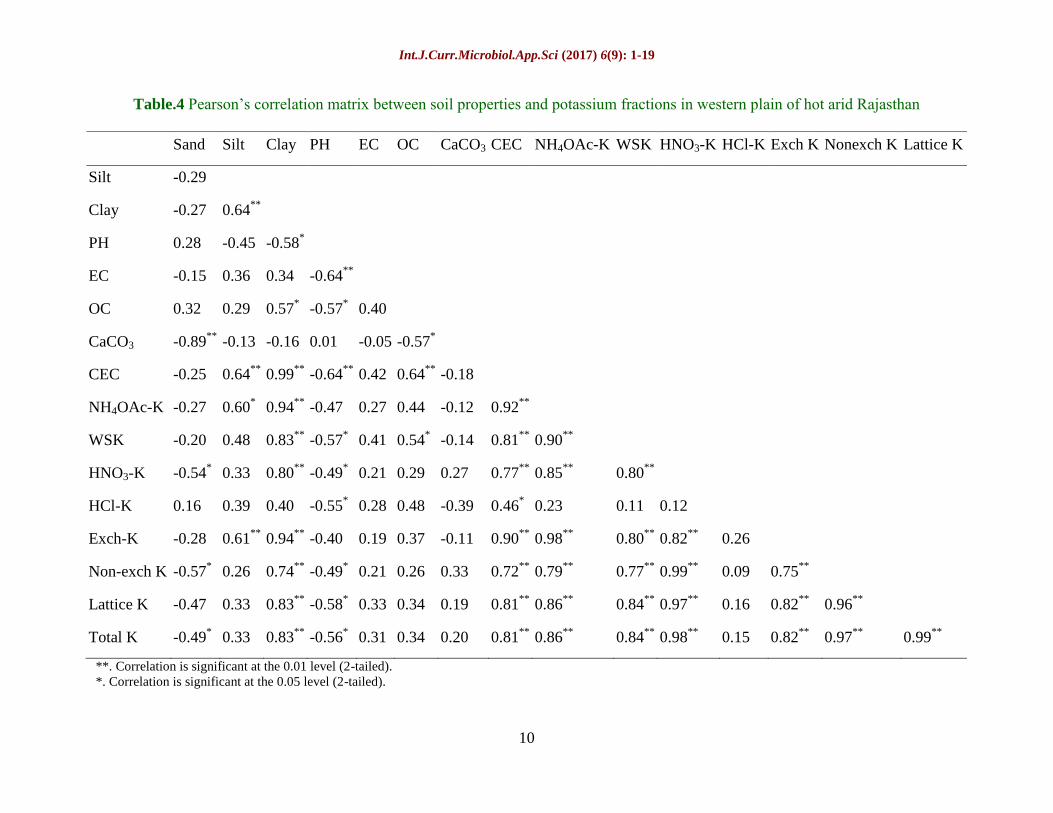
NH4OAc-K showed highly significant and
positive relationship with clay fraction
(r=0.94**), and CEC (r=0.92**) (Table 4)
which is very much expected because of the
fact that higher content of OC in the soil leads
to higher CEC resulting in higher adsorption
of the cations including K (Shankhayan et al.,
1996; Sharma et. al., 2009).
Water soluble K (WS-K)
WS-K is the major source of plant nutrients,
nutrient cycling in ecosystems, and pollutant
transformation and transport in soil (Agbenin,
2003). WS-K is taken up directly by plants,
although amounts found in the soils are
generally small. The K concentration in soil
solution influences the rates of K diffusion
and mass flow towards the root and therefore
the uptake of K by plants (Mengel and Kirkby
1982). The water soluble K is the pool of soil
K that can be readily absorbed by growing
Int.J.Curr.Microbiol.App.Sci (2017) 6(9): 1-19
6
plants. However this is very small pool of
total K and even in the fertile soil this pool
cannot supply the major requirements of the
crops (Arnon, 1975). The data on WS-K of
soils in the studied area have been presented
in (Table 2) and the content of WS-K ranged
from 2.9 to 47.1 mg kg-1
with mean value of
18.3 mg kg-1
in tehsils of western arid region
soils.
Among the different tehsils, the highest
amount (28.4 mg kg-1
) of WS-K was recorded
at Fatehgarh tehsil of Jaisalmer district could
be ascribed to better release of K due to some
addition of FYM and low order removal of K
by the crop because of less intensive cropping
(Singh and Bansal, 2009). Whereas on the
other hand the lowest (14.3 mg kg-1
) amount
of WS-K were found at Pokran tehsil of
Jaisalmer district because of higher removal
of K as compare to addition comparatively or
may be leach down to lower layers because of
faulty irrigation through canal water
(Yaduvanshi; and Swarup, 2006).
The data presented in (Table 4) reveal that
water soluble K has significant and positive
correlation with OC (r=0.54*) which may be
attributed to rapid release of K ions from the
decayed part of organic manures and its
subsequent transport to exchange sites
(Ammal; and Muthiah, 1996). WS-K also had
highly significant and positive correlation
with CEC (r =0.81**
) (Sonar and Patil, 1996).
The positive and highly significant
correlations of WS-K with the clay (r =
0.83**
) fraction indicated that clay fraction
had higher amount of WS-K (Sahoo and
Gupta, 1995). However water soluble K has
negative and significant correlation with soil
pH (r = -0.57*) (Prasad 2010). WS-K has
highly significant and positively correlated
with exch-K (r=0.80**
), Non-exch-K
(r=0.77**
), HNO3 -K (r=0.80**
), lattice-K
(r=0.84**
) and total-K (r = 0.84**
) (Table 4)
indicating that rapid establishment of
equilibrium between these forms (Prasad,
2010).
Nitric acid extractible K (HNO3-K)
HNO3-K is most frequently used as a measure
of Non-exch-K which constitutes major part
of the total-K. It has ranged from 154.4 to
635.5 mg kg−1
with mean value of 318.7 mg
kg−1
in different tehsils of hot arid western
plain soils (Table 2). The highest (478.8 mg
kg−1
) amount HNO3-K were recorded in pugal
tehsil of Bikaner district which could be due
to having slightly better amount of silt and
clay content (Tomar et al., 1997) and enriched
through fertilization and biocycling (Thakur
et al., 1994). The lowest amount of (257.7 mg
kg−1
) HNO3-K was found at Pokran tehsil of
Jaisalmer due to more removal of K then
input, and soils having lower amount of silt
plus clay contents (Choudhary; and Pareek,
1976). It has been seen that most soils formed
on basement complex materials and alluvial
sediments contain some amount of weathered
mica and thus high values of fixed K reserve
(Al-Zubaidi et al., 2008).
In contrast to this, the soils of the sedimentary
sandstones origin were found to be greater
than those of the basement complex origin.
The correlation matrix showed significant
positive relationship between HNO3-K with
OC (r= 0.29), CEC (r= 0.77**
), and clay
(r=0.80**
) (Sharma et al., 2009) (Table 4).
HNO3-K was highly significant and positive
correlation with lattice-K (r=0.97**
) and total-
K (0.98**
) indicating that there exists an
equilibrium between these forms of potassium
and with the depletion of one is replenished
(Das et al., 1997).
Hydrochloric acid extractible K (HCl-K)
The HCl-K in studied soils varied from 8.1 to
99.3 mg kg-1
with a mean value of 40.84 mg
kg-1
in western plain of Rajasthan (Table 2).
Int.J.Curr.Microbiol.App.Sci (2017) 6(9): 1-19
7
Table.1 Variation in soil properties of western plain of hot arid Rajasthan
Tehsils pH (1:2.5) EC (1:2.5, dSm
-1) OC (%) CaCO3 (%) CEC [cmol (p
+) kg
-1]
Range Mean Range Mean Range Mean Range Mean Range Mean
District: Bikaner (n=77)
Bikaner 8.37-9.13 8.81 0.07-0.62 0.21 0.04-0.08 0.06 0.40-8.52 3.60 3.64-8.00 5.23
Khajuwala 7.65-8.67 8.81 0.09-0.31 0.19 0.06-0.23 0.14 2.31-19.53 10.09 4.39-14.05 8.52
Pugal 7.04-9.16 7.50 0.13-0.17 0.15 0.16-0.21 0.18 5.02-11.62 8.89 6.61-8.87 7.68
Chhatargarh 8.87-9.13 8.84 0.06-0.28 0.13 0.04-0.21 0.10 3.60-20.30 9.84 4.36-8.76 6.34
Nokha 8.6-9.18 8.81 0.08-0.14 0.11 0.02-0.09 0.05 0.53-11.20 3.46 3.69-7.02 5.22
Dungargarh 8.67-9.12 8.86 0.06-0.19 0.09 0.02-0.11 0.07 0.21-11.53 5.44 4.14-7.13 5.47
Kolayat 9.14-9.37 9.23 0.08-0.2 0.13 0.01-0.14 0.07 4.70-16.72 8.44 3.84-9.20 5.81
Lunkaransar 8.62-9.57 8.92 0.10-0.31 0.18 0.06-0.16 0.12 0.05-9.42 5.14 4.30-7.59 5.64
District: Churu (n=83)
Churu 8.54-9.13 8.94 0.05-0.13 0.08 0.01-0.05 0.03 24.91-26.82 25.58 3.28-6.95 4.21
Ratangarh 8.68-9.98 9.01 0.06-0.12 0.09 0.02-0.10 0.07 0.50-2.52 1.57 4.18-8.12 5.45
Shardarshahar 8.86-9.07 8.96 0.05-0.16 0.09 0.03-0.15 0.09 0.81-9.33 5.33 4.09-6.76 5.04
Rajgarh 8.32-9.16 8.78 0.03-036 0.10 0.01-0.11 0.06 0.31-9.60 3.93 3.42-7.82 4.78
Sujangarh 8.69-9.15 8.93 0.04-0.23 0.10 0.02-0.13 0.06 0.52-10.90 4.62 3.62-6.63 4.70
Taranagar 8.75-9.18 8.97 0.04-0.11 0.07 0.02-0.09 0.05 5.03-11.32 7.64 4.19-7.26 5.56
District: Jaisalmer (n=49)
Jaisalmer 7.19-9.38 8.78 0.03-0.77 0.17 0.01-0.07 0.05 5.80-19.95 13.03 3.72-5.24 4.27
Fatehgarh 7.56-8.54 8.19 0.09-0.41 0.18 0.02-0.11 0.07 0.10-8.32 4.55 3.93-6.75 5.47
Pokran 8.25-9.02 8.70 0.01-0.85 0.19 0.02-0.25 0.09 0.50-25.05 12.01 3.26-6.43 4.29
WP of Rajasthan 7.04-9.98 8.79 0.01-0.85 0.13 0.01-0.25 0.07 0.05-26.80 7.65 3.26-14.05 5.17
WP = Western Plain, n = No. of sample
Int.J.Curr.Microbiol.App.Sci (2017) 6(9): 1-19
8
Table.2 Distribution of different extractible potassium in western plain of hot arid Rajasthan
Tehsils NH4OAc-K (mg kg
-1) H2O-K (mg kg
-1) HNO3-K (mg kg
-1) HCl-K (mg kg
-1)
Range Mean Range Mean Range Mean Range Mean
District: Bikaner (n=77)
Bikaner 23.8-135.0 87.3 2.9-35.3 18.0 173.0-392.8 279.8 28.1-62.8 46.2
Khajuwala 72.6-202.7 131.9 7.4-40.3 25.3 218.5-586.1 430.1 43.2-58.2 50.6
Pugal 102.8-132.7 117.1 24.7-34.8 27.9 403.1-586.5 478.8 47.9-61.3 55.3
Chhatargarh 87.2-132.6 109.9 11.8-32.5 22.8 242.2-498.3 387.2 8.1-55.4 33.3
Nokha 47.9-132.6 92.0 4.9-29.5 16.4 154.4-451.7 276.2 28.5-62.4 43.7
Dungargarh 66.1-130.3 97.3 10.6-33.4 21.1 194.3-561.6 358.4 34.2-52.4 42.7
Kolayat 81.6-148.1 107.7 9.4-43.3 23.4 284.4-635.5 410.5 8.1-53.3 31.5
Lunkaransar 70.4-140.9 102.1 6.8-47.1 21.4 215.8-573.3 355.2 30.2-53.4 38.4
District: Churu (n=83)
Churu 69.3-136.9 85.9 9.1-26.7 15.3 242.1-496.2 337.1 24.0-36.0 29.7
Ratangarh 60.9-129.6 90.5 6.9-31.1 18.3 189.1-375.1 266.9 29.6-64.4 46.1
Shardarshahar 62.0-124.8 91.3 7.5-23.8 17.1 193.7-386.4 292.9 23.8-61.1 45.2
Rajgarh 31.5-130.5 82.6 4.9-26.9 14.6 174.1-367.4 258.3 23.5-62.8 39.9
Sujangarh 32.7-131.4 83.5 3.9-32.4 14.7 169.2-427.5 277.7 27.3-61.2 46.3
Taranagar 89.3-124.6 105.7 18.5-29.1 24.2 254.3-519.4 393.4 24.1-60.3 38.5
District: Jaisalmer (n=49)
Jaisalmer 62.9-101.3 83.9 4.8-22.5 14.6 218.2-462.0 344.9 30.1-99.3 46.7
Fatehgarh 80.3-128.3 106.5 17.5-44.9 28.4 279.5-396.4 336.8 20.2-58.3 36.5
Pokran 13.9-103.6 64.7 3.5-24.4 14.3 174.9-471.9 257.7 19.1-62.1 37.6
WP of Rajasthan 13.8-202.7 91.2 2.9-47.1 18.3 154.4-635.5 318.7 8.1-99.3 40.8
WP = Western Plain, n = No. of sample
Int.J.Curr.Microbiol.App.Sci (2017) 6(9): 1-19
9
Table.3 Distribution of different potassium pools in western plain of hot arid Rajasthan
Tehsils Total K (mg kg
-1) Exch K (mg kg
-1) Non-exch K (mg kg
-1) Lattice K (mg kg
-1)
Range Mean Range Mean Range Mean Range Mean
District: Bikaner (n=77)
Bikaner 2194.4-3517.0 2935.1 20.9-102.1 69.6 130.0-293.1 208.6 2040.6-3086.4 2638.9
Khajuwala 2701.1-4705.4 3729.8 65.3-162.4 129.1 153.2-463.6 329.2 2475.1-4038.9 3245.6
Pugal 3647.7-4356.1 3897.7 78.1-100.7 89.4 314.5-488.5 388.5 3230.3-3731.9 3391.6
Chhatargarh 2798.4-4237.3 3495.8 75.5-103.4 87.5 166.7-402.1 300.3 2544.3-3699.2 3085.1
Nokha 2354.8-3710.2 2920.3 43.1-103.0 75.6 111.3-354.3 200.9 2195.3-3223.2 2627.1
Dungargarh 2475.8-4424.7 3296.6 52.9-100.9 76.3 138.8-460.4 282.3 2273.3-3829.8 2916.8
Kolayat 2834.3-4599.9 3555.6 71.1-115.2 84.8 212.9-530.6 326.2 2540.7-3910.7 3121.1
Lunkaransar 2719.0-4200.1 3309.5 63.6-96.9 80.9 144.3-476.7 273.7 2504.2-3579.3 2933.3
District: Churu (n=83)
Churu 2733.9-3663.6 3093.0 59.2-110.1 70.4 182.6-386.0 266.6 2482.0-3140.6 2740.5
Ratangarh 2570.4-3322.8 2915.3 49.8-106.2 72.4 127.1-268.9 193.4 2298.0-3097.4 2631.0
Shardarshahar 2570.0-3322.8 2917.9 49.9-107.3 73.5 139.2-307.9 220.6 2373.3-2883.7 2606.6
Rajgarh 2048.4-3521.3 2807.2 25.5-103.6 67.9 126.8-263.8 189.4 1891.0-3126.9 2535.1
Sujangarh 2314.4-3399.6 2900.1 26.2-101.7 68.8 121.2-344.6 208.7 2163.0-2920.7 2607.8
Taranagar 2808.6-4121.4 3354.2 70.8-95.6 81.6 183.2-423.8 311.7 2536.0-3572.7 2936.6
District: Jaisalmer (n=49)
Jaisalmer 2497.3-4231.6 3266.0 58.0-78.8 69.3 154.3-383.1 275.3 2280.1-3747.0 2906.7
Fatehgarh 2592.8-4492.9 3342.0 62.8-108.1 80.2 216.7-313.2 258.6 2295.7-4026.5 2974.6
Pokran 2260.1-4343.0 2877.8 5.5-79.1 50.2 128.7-392.7 205.6 2022.2-3846.6 2607.6
WP of Rajasthan 2111.5-4665.3 3112.4 5.5-162.4 72.9 111.3-530.6 245.6 1891.0-4038.9 2775.0
WP = Western Plain, n = No. of sample
Int.J.Curr.Microbiol.App.Sci (2017) 6(9): 1-19
10
Table.4 Pearson’s correlation matrix between soil properties and potassium fractions in western plain of hot arid Rajasthan
Sand Silt Clay PH EC OC CaCO3 CEC NH4OAc-K WSK HNO3-K HCl-K Exch K Nonexch K Lattice K
Silt -0.29
Clay -0.27 0.64**
PH 0.28 -0.45 -0.58*
EC -0.15 0.36 0.34 -0.64**
OC 0.32 0.29 0.57* -0.57
* 0.40
CaCO3 -0.89**
-0.13 -0.16 0.01 -0.05 -0.57*
CEC -0.25 0.64**
0.99**
-0.64**
0.42 0.64**
-0.18
NH4OAc-K -0.27 0.60* 0.94
** -0.47 0.27 0.44 -0.12 0.92
**
WSK -0.20 0.48 0.83**
-0.57* 0.41 0.54
* -0.14 0.81
** 0.90
**
HNO3-K -0.54* 0.33 0.80
** -0.49
* 0.21 0.29 0.27 0.77
** 0.85
** 0.80
**
HCl-K 0.16 0.39 0.40 -0.55* 0.28 0.48 -0.39 0.46
* 0.23 0.11 0.12
Exch-K -0.28 0.61**
0.94**
-0.40 0.19 0.37 -0.11 0.90**
0.98**
0.80**
0.82**
0.26
Non-exch K -0.57* 0.26 0.74
** -0.49
* 0.21 0.26 0.33 0.72
** 0.79
** 0.77
** 0.99
** 0.09 0.75
**
Lattice K -0.47 0.33 0.83**
-0.58* 0.33 0.34 0.19 0.81
** 0.86
** 0.84
** 0.97
** 0.16 0.82
** 0.96
**
Total K -0.49* 0.33 0.83
** -0.56
* 0.31 0.34 0.20 0.81
** 0.86
** 0.84
** 0.98
** 0.15 0.82
** 0.97
** 0.99
**
**. Correlation is significant at the 0.01 level (2-tailed).
*. Correlation is significant at the 0.05 level (2-tailed).
Int.J.Curr.Microbiol.App.Sci (2017) 6(9): 1-19
11
Fig.1 Location map of study area
Fig.2 Distribution of particle size in western plain of hot arid Rajasthan
Int.J.Curr.Microbiol.App.Sci (2017) 6(9): 1-19
12
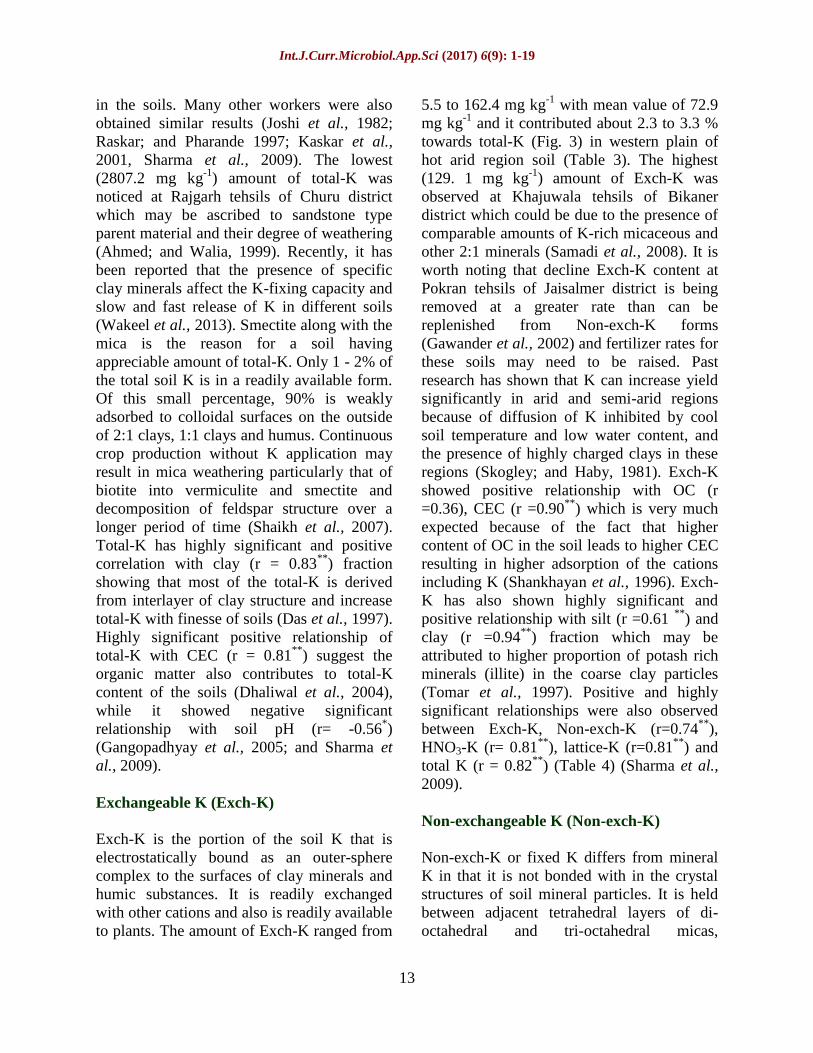
Fig.3 Distribution of potassium fractions (as % of total K) in western plain of hot arid Rajasthan
The highest (55.3 mg kg-1
) amount of HCl-K
were noticed at Pugal tehsil of Bikaner district
which might be ascribed to better release of
some K absorbed on the edges of inner side of
lattice K, and which could not be replaced by
exchangeable NH4+ but could be extracted
with HCl which is slowly exchangeable
(Ghosh; and Bhattacharyya 1982). The lowest
(29.7 mg kg-1
) amount of HCl-K were found
at Churu tehsil of Churu district possibly due
to low amount of silt plus clay content in
these arid regions soils (Joshi et al., 1982).
The positive relationship between HCl-K and
HNO3-K (Table 4) with that of CEC showed
that perhaps some K absorbed on the edges
(Ghosh; and Bhattacharyya 1982; Sharma et
al., 2009) of inner side of the lattice, which
could not be replaced by exchangeable NH4+
but could be extracted with HNO3/HCl, was a
part of the exchange complex which is slowly
exchangeable. HCl-K was showed significant
positive relationship with CEC (r= 0.46*), and
significant negative relationship with soil pH
(r= -0.55*) (Table 4) (Singh et al., 2010).
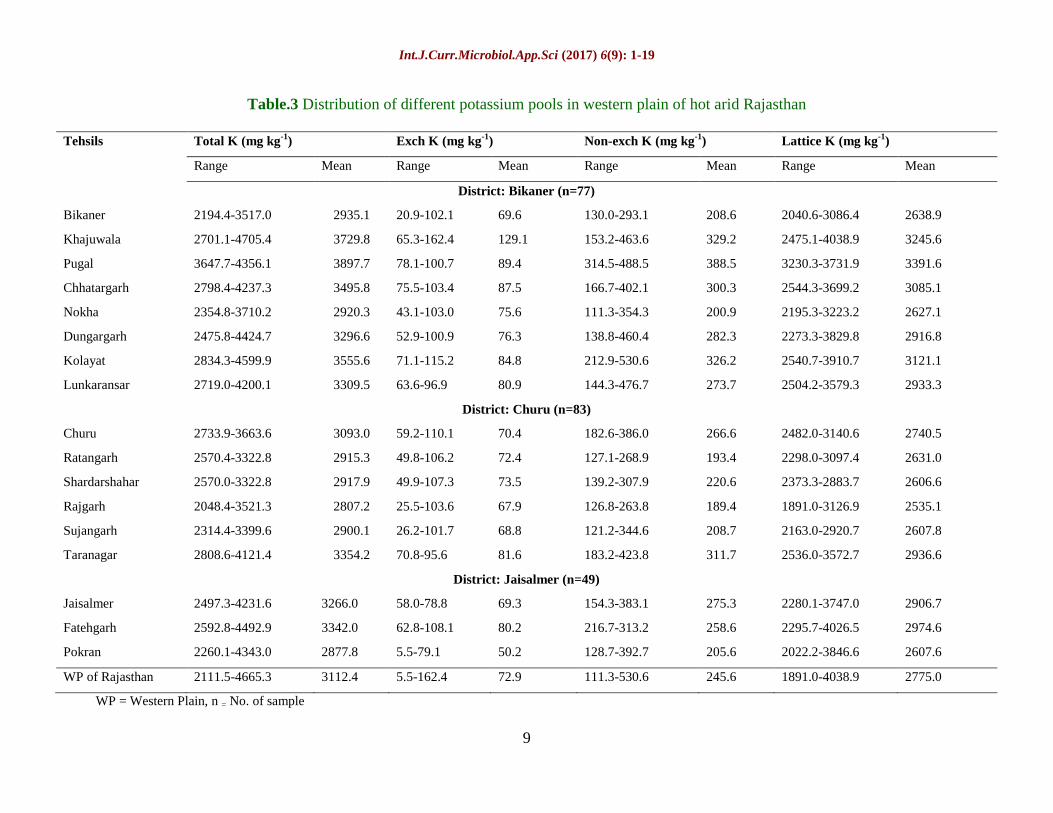
Variation in K pools
Total K (Total-K)
Total-K depends on the presence of K bearing
primary and secondary minerals in the soil.
Clay mineralogy is a key factor affecting
dynamics of K in the soils (Ghiri; and Abtahi,
2011). Soils differing in clay mineralogy may
respond differently to K application (Akhtar;
and Dixon, 2013). Total-K content in
different tehsils of western plain of hot arid
Rajasthan ranged from 2111.5 to 4665.3 mg
kg-1
with an average value of 3112.4 mg kg-1
(Table 3). The maximum (3897.7 mg kg-1
)
amount of total-K was observed at Pugal
tehsils of Bikaner district where soils being
relatively finer in texture, possibly dominated
with mixed clay mineralogy and the presence
of substantial quantities of K bearing minerals
Int.J.Curr.Microbiol.App.Sci (2017) 6(9): 1-19
13
in the soils. Many other workers were also
obtained similar results (Joshi et al., 1982;
Raskar; and Pharande 1997; Kaskar et al.,
2001, Sharma et al., 2009). The lowest
(2807.2 mg kg-1
) amount of total-K was
noticed at Rajgarh tehsils of Churu district
which may be ascribed to sandstone type
parent material and their degree of weathering
(Ahmed; and Walia, 1999). Recently, it has
been reported that the presence of specific
clay minerals affect the K-fixing capacity and
slow and fast release of K in different soils
(Wakeel et al., 2013). Smectite along with the
mica is the reason for a soil having
appreciable amount of total-K. Only 1 - 2% of
the total soil K is in a readily available form.
Of this small percentage, 90% is weakly
adsorbed to colloidal surfaces on the outside
of 2:1 clays, 1:1 clays and humus. Continuous
crop production without K application may
result in mica weathering particularly that of
biotite into vermiculite and smectite and
decomposition of feldspar structure over a
longer period of time (Shaikh et al., 2007).
Total-K has highly significant and positive
correlation with clay (r = 0.83**
) fraction
showing that most of the total-K is derived
from interlayer of clay structure and increase
total-K with finesse of soils (Das et al., 1997).
Highly significant positive relationship of
total-K with CEC (r = 0.81**
) suggest the
organic matter also contributes to total-K
content of the soils (Dhaliwal et al., 2004),
while it showed negative significant
relationship with soil pH (r= -0.56*)
(Gangopadhyay et al., 2005; and Sharma et
al., 2009).
Exchangeable K (Exch-K)
Exch-K is the portion of the soil K that is
electrostatically bound as an outer-sphere
complex to the surfaces of clay minerals and
humic substances. It is readily exchanged
with other cations and also is readily available
to plants. The amount of Exch-K ranged from
5.5 to 162.4 mg kg-1
with mean value of 72.9
mg kg-1
and it contributed about 2.3 to 3.3 %
towards total-K (Fig. 3) in western plain of
hot arid region soil (Table 3). The highest
(129. 1 mg kg-1
) amount of Exch-K was
observed at Khajuwala tehsils of Bikaner
district which could be due to the presence of
comparable amounts of K-rich micaceous and
other 2:1 minerals (Samadi et al., 2008). It is
worth noting that decline Exch-K content at
Pokran tehsils of Jaisalmer district is being
removed at a greater rate than can be
replenished from Non-exch-K forms
(Gawander et al., 2002) and fertilizer rates for
these soils may need to be raised. Past
research has shown that K can increase yield
significantly in arid and semi-arid regions
because of diffusion of K inhibited by cool
soil temperature and low water content, and
the presence of highly charged clays in these
regions (Skogley; and Haby, 1981). Exch-K
showed positive relationship with OC (r
=0.36), CEC (r =0.90**
) which is very much
expected because of the fact that higher
content of OC in the soil leads to higher CEC
resulting in higher adsorption of the cations
including K (Shankhayan et al., 1996). Exch-
K has also shown highly significant and
positive relationship with silt (r =0.61 **
) and
clay (r =0.94**
) fraction which may be
attributed to higher proportion of potash rich
minerals (illite) in the coarse clay particles
(Tomar et al., 1997). Positive and highly
significant relationships were also observed
between Exch-K, Non-exch-K (r=0.74**
),
HNO3-K (r= 0.81**
), lattice-K (r=0.81**
) and
total K (r = 0.82**
) (Table 4) (Sharma et al.,
2009).
Non-exchangeable K (Non-exch-K)
Non-exch-K or fixed K differs from mineral
K in that it is not bonded with in the crystal
structures of soil mineral particles. It is held
between adjacent tetrahedral layers of di-
octahedral and tri-octahedral micas,
Int.J.Curr.Microbiol.App.Sci (2017) 6(9): 1-19
14
vermiculites, and intergrade clay minerals
such as chloritized vermiculite (Rich, 1972;
Sparks and Huang, 1985; Sparks, 1987). The
amount of Non-exch-K ranged from 111.3 to
530.6 mg kg-1
with mean value of 245.6 mg
kg-1
(Table 3) and it contributed about 6.7 to
9.9 % towards total-K (Fig. 3). Concerning
the magnitude of the Non-exch-K the highest
(388.5 mg kg-1
) amount were found at Pugal
tehsil of Bikaner district probably because
their found high contents of illite clay
mineral, low order removal of K through
cropping system, and the presence of higher
clay and OC content (Bhaskar et al., 2001).
Whereas on the other hand the lowest (189.4
mg kg-1
) amount of Non-exch-K was found at
Rajgarh tehsil of Churu district due to crop
removal and soil pH, and may be attributed to
preponderance of 2:2 type clay mineral rather
than micas, might be due to the release of
fixed K to compensate the removal of WS-K
and Exch-K by planting and leaching losses,
moreover, it obvious that the clay soil contain
higher levels of this form than the calcareous
sandy soil. The difference between Exch-K
and Non-exch-K was very narrow, indicating
the low weathering status of K minerals,
particularly micaceous which are relatively
less prone to acid attack (Datta; and Sastry,
1993; Bedrossian; and Singh, 2004). Non-
exch-K was shown positively correlated with
OC (r = 0.26) and CEC (r = 0.71**
) this may
be ascribed to increase Exch-K with increases
in OC content which by means of dynamic
equilibrium between exch-K and Non-exch-K
forms of K slowly shifts towards the later
form resulting in its higher amount with
increase in the OC content. Similarly with the
increase in CEC due to dynamic equilibrium
between Exch-K and Non-exch-K
(Shankhayan et al., 1996). Non-exch-K
showed significant positive relationship with
CaCO3 (r = 0.33) which could be attributed to
change in rate of release of K due to presence
of high free CaCO3 (Tomar et al., 1997).
Positive and significant relationship between
Non-exch-K with silt (r = 0.26) and clay (r=
0.74**
) fractions (Raskar; and Pharande,
1997). The non-exch-K of soils showed
positive and highly significant correlation
with HNO3-K (r = 0.99**
), lattice-K (r=0.97**
)
and total-K (r = 0.98**
) (Table 4) indicating
that Non-exch-K serves as a good index for
the K supplying capacity to the soils
(Gangopadhyay et al., 2005).
Lattice K (Lattice-K)
The lattice-K fraction of the soils is
considered as difficultly available to the
plants and it represents the largest portion of
soil K. This pool of K varied from 1891.0 to
4038.9 mg kg-1
(Table 3) and it contributed
about 87.1 to 90.3 % towards total-K in
western plain of hot arid Rajasthan (Fig. 3). It
has been observed that highest (3391.6 mg kg-
1) content of lattice or mineral K at Pugal
tehsil of Bikaner district indicates that these
soils have been developed from mica-rich
parent material and much of K is present in
the mica lattice (Gangopadhyay et al., 2005).
The lowest (2535.1 mg kg-1
) content of
lattice-K were noticed at Rajgarh tehsil of
Churu district due to course texture in nature
and low application of manures and fertilizers
with high intensive cropping (Singh; and
Bansal, 2009). Lattice-K has highly
significant and positive correlation with CEC
(r =0.81**)
and clay (r =0.83**
) fraction but
negative correlation with soil pH (r = -0.58*)
and sand (r = -47) fraction indicating that
sizable fraction of lattice-K is present in the
coarse clay and silt fraction containing
minerals such as mica and illite. Rich
relationship between lattice-K and soil
properties could be attributed to the more
reactive nature of lattice-K (Table 4) (Sharma
et al., 2009). Lattice-K has also shown highly
significant and positive correlation with total-
K (r=0.99**
). These results have indicated the
existence of dynamic equilibrium between
forms of K in soils of western plain of
Int.J.Curr.Microbiol.App.Sci (2017) 6(9): 1-19
15
Rajasthan (Table 4) (Dixit et al., 1993; Chand
and Swami, 2000; Prasad, 2010).
Hot arid region soils needed more information
on the nature and K status in alkali and
calcareous soils. Most of studied soils contain
low to medium Non-exch-K and other forms
of K due to low weathering status of K
minerals, particularly micaceous minerals,
crop removal and high soil pH, and may be
attributed to preponderance of 2:2 type clay
mineral rather than micas, might be due to the
release of fixed K to compensate the removal
of water soluble and Exch-K by planting and
leaching losses. K uptake during plant growth
is a dynamic process with periods of K
depletion in the root zone and release of Non-
exch- K to exchange and solution phases by K
bearing soil minerals. It should be also
considered that depletion of interlayer K
reduces K release rates, and over a long
period of time, these rates may become
insufficient for optimum K nutrition of crops.
Therefore, permanent cropping without K
fertilizer application may lead to a
degradation of 2:1 phylosilicates.
References
Abu-Zahra, T. R., Tahboub, A. B. 2008.
Effect of organic matter sources on
chemical properties of the soil and yield
of strawberry under organic farming
conditions. World Appl. Sci. J., 5:383-
388.
Agbenin, J. O., 2003. Soil saturation extract
composition and sulphate solubility in a
tropical semiarid soil. Soil Sci. Soc. Am.
J., 67: 1133–1139.
Ahmed, N., Walia, C.S. 1999. Profile
distribution of various forms of
potassium in some landforms of
Bundelkhand region. J. of pot. Res. 15:
1-4.
Ajiboye, A. G., Jamiu, O., Azeez and
Akinwande, J., Omotunde. 2015
Potassium forms and quantity intensity
relationships in some wetland soils of
Abeokuta, Southwestern Nigeria. Archi.
Agro. And Soil Sci., 61(10): 1393e140.
Akhtar, M.S., Dixon. J.B., 2013.
Mineralogical characteristics and
potassium quantity/intensity relation in
three indus river basin soils. Asian J. of
Chem., 21: 3427-3442.
Al-Zubaidi, A., Yanni, S., Bashour, I. 2008.
Potassium status in some Lebanese
soils. Lebanese Sci. J. 9:81-97.
Ammal, B., Muthiah, D. 1994. Potassium
release characteristics in soil as
influenced by Inorganic and organic
manuring. J. of Pot. Res. 10 (3): 223-
228.
Arnon, I., 1975. Mineral nutrition of maize.
IPI Berne, Switzerland.
Bedrossian, S., Singh, B. 2004. Potassium
adsorption characteristics and potassium
forms in soils of New South Wales soils
in relation to early senescence in cotton.
Australian J. of Soil Res. 42: 747- 753.
Bhaskar, B.P., Vadivelu, S., Baruah, U.,
Bhutte, P.S., Dutta, D.P. 2001.
Distribution of potassium forms and
chars and marshy soils of Brahmaputra
valley, Jorhat district, Assam. J of Pot.
Res. 17(1-4): 39-47.
Bouyoucos, G.J., 1927. The hydrometer as a
new method for the mechanical analysis
of soils. Soil Sci. 23: 343-350.
Brady, N.C., Weil, R.R. 2002. The Nature and
Properties of Soils, 13th Ed.
Pearson,Delhi.
Chand, S., Swami, B.N. 2000. Different forms
of potassium in some important soil
association of Bharatpur district of
Rajasthan. J. of pot. Res. 16: 59-61.
Chaudhary, J.S., Pareek, B.L. 1976.
Exchangeable and reserve potassium in
soils of Rajasthan. J.of the Indian Soc.
of Soil Sci. 24 (1): 57-61.
Choudhari, J.S., Dhir, R.P., 1982. Clay
mineralogy of dune and associated
Int.J.Curr.Microbiol.App.Sci (2017) 6(9): 1-19
16
sandy plain soils of western Rajasthan.
J. of the Indian Soc. of Soil Sci. 30: 342-
347.
Dan, S., Khurana, H.S., Thind, S.S., 2004.
Forms of soil potassium and their
contributions to plant potassium in typic
ustipsament loamy sand soil under
potato. J. of pot. Res., 20: 28-33.
Das, P.K., Sahu, G.S., Das, N. 1997. Vertical
distribution and release characteristics
of potassium in some lateritic soils of
Orrisa. J. of pot. Res. 13: 105-110.
Datta, S.C., Sastry, T.G. 1993. Potash release
in relation to mineralogy of silt and
clays. J. of the Indian Soc. of Soil Sci.
41: 452-458.
Dhaliwal, A.K., Gupta, R.K., Singh, Y.,
Sharma, B.D., Singh, B. 2004.
Distribution of different forms of
potassium in Benchmark soil series
under rice-wheat cropping system in
Punjab. J. of pot. Res. 20: 12-21.
Dixit, A.R., Sachan, R.S., Srivastava, P.C.,
Mishra, M.K. 1993. Distribution of
different forms of potassium in some
soil series of western Uttar Pradesh. J.
of pot. Res. 9: 295-314.
Dovalti, B., Samadi, A., Oustan, S., 2010.
Effects of long-term continuous
cropping of sunflower on potassium
forms in calcareous soils of western
Azerbaijan Province Iran. J.of Agri.Sci.
71-82.
Gangopadhyay, S.K., Sarkar, D., Sahoo,
A.K., Das, K., 2005. Forms and
distribution of potassium in some soils
of Ranchi plateau. J. of the Indian Soc.
of Soil Sci. 53 (3) 413-416.
Garman, W.L., 1957. Potassium release
characteristics of several soils from
Ohio and New York. Soil Sci. Soc.
America Proceedings 21: 52-58.
Gawander, J.S., Gangaiya, P., Morrison, R.J.
2002. Potassium studies on some
sugarcane growing soils in Fiji. South
Pacific J. of Natural Sci. 20, 15–21.
Ghiri, M.N., Abtahi, A. 2011. Potassium
dynamics in calcareous vertisols of
southern Iran. Arid Land Res. and
Manag. 25: 257-274.
Ghiri, M.N., Abtahi, A., Owliaie, H., Sadat,
S., Hashemi, Koohkan, H. 2011. Factors
Affecting Potassium Pools Distribution
in Calcareous Soils of Southern Iran,
Arid Land Res. and Manag. 25:4, 313-
327.
Ghosh, S.K., Bhattacharyya, T., 1982.
Mineralogy of soils of Bihar, Uttar
Pradesh and Rajasthan. Mineralogy of
soil potassium, Potash institute of India,
Gurgaon, Haryana, India. 15-29.
Hanway, J.J., Heidel. H. 1952. Soil analysis
methods as used in Iowa State College
Soil Testing Laboratory. Iowa
Agriculture 54:1–31.
Jackson, M.L., 1973. Methods of chemical
analysis. New Delhi: Prentice Hall of
India.
Jalali, M., 2005. Release kinetics of non-
exchangeable potassium in calcareous
soils. Commun. Soil Sci. Plant Anal. 36,
1903–1917.
Jalali, M., 2007. Site-specific potassium
application based on the fertilizer
potassium availability index of soil.
Precis. Agric. 8(3–4): 199–221.
Jalali, M., Zarabi, M., 2006. Kinetics of non-
exchangeable-potassium release and
plant response in some calcareous soils.
J. Plant Nutr. Soil Sci. 169, 194–204.
Joshi, D.C., Johari, S.N., Sharma, V.C. 1978.
Studies in the forms of potassium and
potassium fixing capacity in some arid
soils of Jodhpur region. Annals of Arid
Zon. 17: 273-278.
Kaskar, D.R., Salvi, V.G., Mayekar, B.S.,
Dabke, D.J. 2001. Forms of potassium,
their interrelationship and relationships
with other soil properties of Inceptisols
of West coast of Maharashtra. J. of pot.
Res. 17: 23-27.
Kayser, M., Isselstein, J. 2005. Potassium
Int.J.Curr.Microbiol.App.Sci (2017) 6(9): 1-19
17
cycling and losses in grassland systems:
a review. Grass Forage Sci. 60, 213–
224.
Knudsen, D., Peterson, G.A., Pratt, P.F. 1982.
Lithium, sodium, and potassium. In
Methods of soil analysis. Chemical and
microbiological properties. Soil Science
Society of America. 2(2) 225–246.
Krauss, A., 2003. Assessing soil potassium in
view of contemporary crop production.
Paper presented at Regional IPI-LIA-
LUA Workshop on Balanced
fertilization in contemporary plant
production, Lithuania, Kaunas –
Marijampol, September 30 – October 1,
2003. Available from:
http://www.ipipotash.org/en/presentn/as
pivoccp.php.
Meena, M. D., Biswas, D. R. 2014.
Phosphorus and potassium
transformations in soil amended with
enriched compost and chemical
fertilizers in a wheat–soybean cropping
system. Communi. In Soil Sci. and Plant
Anal. 45:624–652.
Mengel, K., Kirkby, E. A., 1982. Principles of
Plant Nutrition. 3rd Edition.
International Potash Institute, Berne.
Natarajan, S., Renukadevi, A. 2003. Vertical
distribution of forms of potassium in
major soil series of Tamil Nadu. Acta
Agronomica Hungarica 51(3): 339–346.
Otobong, B., Iren, Uche, C., Amalu. 2012.
Forms and Status of Potassium in Some
Soils Supporting Oil Palm (Elaeis
guineensis, Jacq) Plantations in Cross
River State, Nigeria. Communi. In Soil
Sci. and Plant Anal. 43:1949–1962.
Pal, S.K., Mukhopadhyay, A.K. 1992.
Potassium releasing power of soils as a
tool to assess its supplying power. J. of
the Indian Soc. of Soil Sci. 40: 266-270.
Prasad, J., 2010. Forms of potassium in
shallow soils of different origin and
land uses in Nagpur district of
Maharashtra. J. of the Indian Soc. of
Soil Sci. 58(3) 327-330.
Puri, A.N., 1930. A new method for
estimating total carbonates in soils. Imp.
Agri. Res. Pusa Bull.
Raskar, B.N., Pharande, A.L. 1997. Different
Forms of Potassium and their
Distribution in Some Important Soil
Series of Vertisol and Alfisol of
Western Maharastra. J. of Pot. Res., 13
(1): 21-30.
Rich, C.I., 1972. Potassium in minerals.
Procee of Colloquim of Intern.Potash
Inst. 9: 15-31.
Sahoo, A.K., Gupta, S.K. 1995. Potassium
distribution in some Mangrove soils of
the Sunderbans. J. of Pot. Res., 11(1): 1-
7.
Samadi, A., Dovlati, B., Barin, M. 2008.
Effect of continuous cropping on
potassium forms and potassium
adsorption characteristics in calcareous
soils of Iran. Australian J. of Soil Res.
46, 265–272.
Sarwar, G.H., Schmeisky, M. A., Tahir, Y.,
Iftikhar, Sabah, N. U. 2010. Application
of green compost for improvement in
soil chemical properties and fertility
status. J. Anim. & Plant Sci., 20: 258-
260.
Shaikh, K., K.S., Memon, Akhtar, M.S. 2007.
Changes in mineral composition and
bioavailability of potassium under long-
term fertilizer use in cotton-wheat
system. Soil and Environ. 26(1): 1-9.
Shankhayan, S.D., Sharma, H.R., Bhardwaj,
S.K. 1996. Response of wheat to
potassium application in soils of una
and paonta valleys of Himachal
Pradesh. J.of Pot. Res. 12(3): 290-297.
Sharma, A., Jalali, V.K., Vivek, M., Arya,
Rai, P. 2009. Distribution of various
forms of potassium in soils representing
intermediate zone of Jammu region. J.
of the Indian Soc. of Soil Sci. 57(2):
205-207.
Sharpley, A.N., 1989. Relationship between
Int.J.Curr.Microbiol.App.Sci (2017) 6(9): 1-19
18
soil potassium forms and mineralogy.
Soil Sci. Soci of America J. 52: 1023-
1028.
Shyampura, R. L., 1995. Soils of Rajasthan
for optimising land use. NBSS Publ.
(Soil of India Series). J. Sehgal. 76+6
sheet soil map Nagpur, India: National
Bureau of Soil Survey and Land Use
Planning.
Singh, J.P., Singh, S., Singh, V. 2010. Soil
potassium fractions and response of
cauliflower and onion to potassium. J.
of the Indian Soc. of Soil Sci. 58(4) 384-
387.
Singh, K., Bansal, S. K. 2009. Different
fractions of soil potassium, olsen
phosphorus, and available sulfur status
of intensively cultivated berpura soil
series of India and nutrient indexing of
rice crop. Communi. In Soil Sci. and
Plant Anal. 40: 1983–1994.
Singh, R.S., Dubey, P.N., Sen, T.K., and
Maji, A.K. 2006. Distribution of
potassium in soils of Manipur
encompassing physiographic and
hydrothermal variations. J, of the Indian
Soci, of Soil Sci. 54 (2) 197-202.
Singh, S. K., Kumar, M., Sharma, B. K.,
Tarfadar, J. C. 2007. Depletion of
organic carbon, phosphorus and
potassium stock under pearl millet
based cropping sequence in arid
environment of India. Arid Land Res.
and Manag. 21: 119–131.
Skogley, E.O., Haby, V.A. 1981. Predicting
crop responses on high-potassium soils
of frigid temperature and ustic moisture
regimes. Soil Sci. Soci. of America J.
45, 533–536.
Sonar, K.R., Patil, Y.M. 1996. Forms of
potassium as influenced by geology and
physiography of soils in Maharashtra. J.
of Pot. Res. 12 (3): 230-236.
Sood, B., Subehia, S.K., Sharma, S.P. 2008.
Potassium fractions in acid soil
continuously fertilized with mineral
fertilizers and amendments under
maize-wheat cropping system. J. of the
Indian Soci. of Soil Sci, 56(1): 56-58.
Sparks, D.L., 1987. Potassium dynamics in
soils. Advan. in Soil Sci.6,1e63.
Sparks, D.L., Huang, P.M. 1985. Physical
chemistry of soil potassium. p. 201-276.
In R.D. Munson (ed.) Potassium in
agriculture. American Soci of Agro,
Madison, WI.
Sparks, D.L., Huang, P.M. 1985. Physical
chemistry of soil potassium. American
Society of Agron. Madison,
WI.201e276. In R.D. Munson (ed.)
Potassium in agriculture.
Srinivasarao, C. S., Kundu, B. K.,
Ramachandrappa, S., Reddy, R., Lal,
B., Venkateswarlu, K. L., Sahrawat,
Naik, R. P. 2014. Potassium release
characteristics, potassium balance, and
finger millet (Eleusine coracana G.)
yield sustainability in a 27- year long
experiment on an Alfisol in the semi-
arid tropical. Plant and Soil 374:315-
330.
Subba Rao, Srinivasarao, C., Srivastava, S.
2010. Potassium status and crop
response to potassium on the soils of
agroecological regions of India. IPI Res.
Topics 20. International Potash
Institute, Horgen, 185.
Thakur, D.S., Dubey, D.D., Sharma, O.P.
1994. Effect of parent material and
climate on forms of potassium in two
Usterts of central India. J. of Pot. Res.,
10(4): 312-322.
Tisdale, S.L., Nelson, W.L., Beaton, J.D.,
1985. Soil fertility and fertilizer (4th
edn.) Macmillan.
Tomar, R.A.S., Verma, R.S., Tomar, P.S.,
Bansal, K.N., 1997. Vertical
distribution of forms of potassium in
some normal and salt-affected soil
series of Gird region of Madhya
Pradesh. J, of Pot, Res. 13 (3&4): 203-
208.
Int.J.Curr.Microbiol.App.Sci (2017) 6(9): 1-19
19
Wakeel, A. M., Gul, M., Sanaullah. 2013.
Potassium dynamics in three alluvial
soils differing in clay contents. Emirates
J. of Food and Agri. 25: 39-44.
Walkley, A., Black, I. A. 1934. An
examination of the Degtijariff method
for determining soil organic matter and
a proposed modification of the chromic
acid titration method. Soil Sci.37:29–38.
Yaduvanshi, N.P.S., Swarup, A. 2006. Effect
of long-term fertilization and manuring
on potassium balance and non-
exchangeable K release in a reclaimed
sodic soil. J. of the Indian Soci of Soil
Sci. 54(2): 203-207.
How to cite this article:
Sunil Kumar, I.J. Gulati, S.R. Yadav, Manisha, P.C. Moharana, R.L. Meena, M. Nogiya and Singh,
R.S. 2017. Assessing of Potassium Reserve and their Relationship with Soil Properties in Western
Plain of Arid India. Int.J.Curr.Microbiol.App.Sci. 6(9): 1-19.
doi: https://doi.org/10.20546/ijcmas.2017.609.001