Embed Size (px)
Citation preview
ASSESSING THE JOB POLARIZATION EXPLANATION OF GROWING WAGE INEQUALITY
Lawrence Mishel John Schmitt
Heidi Shierholz
Presented at the Labor Economics Seminar at the
University of California, Berkeley
March 7, 2013
Lawrence Mishel is the president of Economic Policy Institute. Heidi Shierholz is an economist at the institute. John Schmitt is a senior economist with the Center for Economic and Policy Research.
We thank Hilary Wething for outstanding research assistance. We are grateful to David Autor for generously making his data and programs available, and for an ongoing lively and helpful discussion. We thank Dean Baker, Annette Bernhardt, Michael Handel, David Howell, Frank Levy, Ben Sand and participants at the panel “Inequality in America: Contending Theories” at the 2013 ASSA annual meeting for many helpful comments.
1
I. Introduction
Skill-biased technological change (SBTC) has been a leading explanation for the rise in wage inequality almost since economists first noticed the increase in wage inequality that began at the end of the 1970s. A recent wave of research, however, has questioned important aspects of the standard version of SBTC models of wage inequality (Autor, Levy, Murnane, 2003; Autor, Katz, and Kearney, 2006, 2008; Acemoglu and Autor, 2011, 2012; and others), frequently invoking arguments made in an earlier round of criticism of SBTC-based explanations (Mishel and Bernstein, 1994, 1998; Howell, 1994, 1999; Mishel, Bernstein, and Schmitt, 1997; Howell and Wieler, 1998; Card and DiNardo, 2002, 2006). The new research rejects key features of the long-standing SBTC models, but is itself closely tied to an alternative, technology-based explanation of rising wage inequality. This new "tasks framework" grows out of important insights about the role of technology in production that were first discussed by Autor, Levy, and Murnane (2003) and has had its most formal presentation in a model developed by Acemoglu and Autor (2011, 2012). This paper seeks to assess the usefulness of the "tasks framework" as implemented in a growing body of empirically oriented papers. Elsewhere, we have offered an alternative explanation of widening wage inequality since the late 1970s, which does not appeal to technology as an important explanatory factor.1 Here, however, we make a narrower argument that current models of SBTC --either what Acemoglu and Autor call the "canonical model" or the more recent tasks framework offered to replace it-- do not adequately account for key wage trends over the last three decades. We largely concur with Acemoglu and Autor's critique of the canonical model (we have been making similar arguments since at least the mid-1990s). As a theoretical exercise, we also find Acemoglu and Autor's formal modeling of the task framework elegant and much richer than the canonical model it seeks to supplant. But, we argue here that, its insights and elegance notwithstanding, the tasks framework fails to explain the most important developments in wage trends observed since the end of the 1970s.
1See Mishel et al (2012.)
2
A central empirical feature of the tasks framework is the concept of "job polarization," usually defined as stronger employment growth in jobs at the top and bottom of the wage distribution than in the middle. Job polarization is closely linked to the argument that the last several decades have seen a "hollowing out" of the middle of the wage distribution. To be clear from the outset, we have no strong views about whether or not job polarization has taken place over the last three decades. In what follows, we comment extensively on the timing, direction, and magnitude of changes in occupational employment patterns, but our purpose is not to suggest that job polarization did or did not take place. Instead, our interest lies in whether any employment polarization that did take place is consistent with predictions made by the tasks framework and, more importantly, whether any observed changes in occupational employment can contribute to our understanding of changes in the overall wage distribution, which is the ultimate goal of the canonical SBTC model, the tasks framework, and other competing models. To preview our main findings, we believe that the tasks framework fails as an explanation of rising wage inequality. Technological forces may be behind observed changes in the wage distribution, but, if so, current versions of the tasks framework do not adequately represent those forces. Our critique of the tasks framework has several elements. We begin by demonstrating that "job polarization" has been taking place since at least 1950. We label this occupational upgrading since it primarily consists of a shrinkage of middle wage occupations and a corresponding expansion of high wage occupations. This enduring decline in "middle-wage jobs" --most typically in manufacturing and administrative and clerical work-- makes "job polarization" a weak candidate for explaining the rise in wage inequality that only began at the end of the 1970s. Focusing on just the period since the late 1970s, the continued smooth decline in employment in middle-wage occupations, combined with the continued smooth rise in employment in higher-wage occupations and the relative stability of lower-wage occupations (until the 2000s) makes these employment changes an unlikely driver of the sharp rise (from about 1979) and the subsequent fall (from about 1986-1987) in the 50-10 differential. The inability of the tasks framework to provide an empirical accounting of the decline in the 50-10 differential after 1986-87 is particularly problematic because the need to explain
3
differences in the path of the 90-50 and 50-10 differentials after the late 1980s was an important motivation for the theoretical innovations first proposed by Autor, Levy, Murnane (2003) and Autor, Katz, and Kearney (2006, 2008) and formalized in Acemoglu and Autor (2011, 2012). We also demonstrate significant problems with the evidence that is most commonly used to establish the existence of job polarization --the U-shaped plots of changes in occupational employment against the initial occupational wage level. In reality, these plots do not always take the posited U-shape and in all cases the lines traced out fit the data poorly, obscuring large variations in employment growth across occupational wage levels.2 When, as is often done, these plots lump together the experience of the last two or three decades, they also mask substantial differences in occupational employment patterns for the 1980s, 1990s, and 2000s. Most importantly, the now-standard plots show no signs of job polarization in the 2000s. In the 2000s, relative employment expanded at the bottom, but was flat at both the middle and the top of the occupational wage distribution. The lack of job polarization in the 2000s is a phenomenon visible in both the Decennial Census / American Community Survey and our analysis here of the Current Population Survey (CPS). Thus, the standard techniques applied to the data for the 2000s do not establish even a prima facie case for the existence of job polarization in the most recent decade. This leaves the job polarization story, at best, as an account of wage inequality in the 1990s. We also document that data from the CPS --unexpectedly-- reveal occupational employment polarization the 1980s. In earlier empirical work using the Decennial Census, occupational employment rises monotonically with initial occupational wage, which is consistent with the monotonic rise in overall wages by initial position in the wage distribution. But, using the CPS data, occupational employment shows almost as much of a tendency toward job polarization in the 1980s as it did in the 1990s. As a
2 Our findings using the Current Population Survey (CPS) corroborate similar results first described by Lefter and Sand (2011) using Decennial Census and ACS data.
4
result, and contrary to the conventional interpretation of the tasks framework, we have two cases (the 1980s and the 2000s) in which rising occupational employment shares at the bottom were associated with falling wages at the bottom; and only one case --the 1990s-- when rising occupational employment shares at the bottom were associated with rising relative wages. More generally, we find little evidence consistent with the causal story of the tasks framework. In the most commonly told version of the story, technology drives changes in the demand for tasks (increasing demand at the top and bottom relative to the middle) and this change in demand for tasks drives changes in occupational employment (increasing employment at the top and the bottom relative to the middle). The change in occupational employment is then supposed to drive changes in overall wages by operating through occupational wages. The literature, however, has neglected to examine the intervening dynamic of changing the occupational wage structure (raising wages more at the top and the bottom than at the middle).We demonstrate that there is little or no connection between decadal changes in occupational employment shares and occupational wage growth, and little or no connection between decadal changes in occupational wages and overall wages. We also question the view that differences in returns to occupations are an increasingly important determinant of wage dispersion, possibly even exceeding in statistical importance differences in the returns to education. Informally, we show that the goodness-of-fit of the standard plots of occupational employment changes against initial occupational wage level declines steadily and sharply between the 1980s, 1990s, and 2000s, suggesting that occupations have substantially less explanatory power in recent years. More formally, our regression analysis of the contribution of education and occupation categories shows that 1) the importance of occupations in wage determination slowed dramatically in the 1990s and declined in the 2000s for both men and women and 2) the slowdown and reversal of the importance of occupations in wage determination in the 1990s and 2000s was actually more pronounced than the slowdown of the importance of educational attainment in wage determination over this period.
5
We are also skeptical of recent efforts that ask the typically low-wage "service occupations" to carry much or all of the weight of the tasks framework. First, the magnitude of employment changes in the service occupations make them poor candidates for explaining overall wage trends. The service occupations remain a relatively small share of total employment. In 2007, for example, these occupations (excluding workers in public safety occupations, which are generally much better paid) accounted for less than 13 percent of total employment, and just over half of employment in the bottom quintile of the occupations ranked by wages. Moreover, they have expanded only modestly in recent decades, increasing their employment share by 2.1 percentage points between 1979 and 2007. The small size and the slow, relatively steady, growth of the service occupations suggest significant limitations on their ability to explain the large and contradictory changes in wage growth at the bottom of the distribution, let alone movements at the middle or the top of the wage distribution. Second, the timing of the most important changes in employment shares and wage levels in the service occupations is not compatible with conventional interpretations of the tasks framework. Seen over a long period --say, 1980 to 2005, as in Autor and Dorn (2012)-- both employment and wages in the service occupations increased, which they interpret as suggestive that increasing demand for service occupations drove up, first, employment and, then, wages in these occupations. Essentially all of the wage growth in the service occupations over this period, however, occurred in the second half of the 1990s, when the employment share in these occupations was flat. The observed wage increases preceded almost all of the total growth in service occupation over the period, which took place in the 2000s, when wages in service occupations were falling, in clear contradiction to the usual interpretation of the tasks framework. Structure of the paper The next section of the paper reviews key elements of the tasks framework, including the basis for its compelling critique of the "canonical" SBTC model. Section 3 provides an overview of long-term trends in occupational employment and wage inequality, showing that job polarization, broadly defined, is a long-standing feature of the US labor market, while rising wage inequality is strictly a phenomenon of the last three decades or so.
6
Section 4 takes a closer look at changing patterns of occupational employment, occupational wage, and overall wages. We use the CPS data both to provide an independent test of earlier results based primarily on the Decennial Census and the American Community Survey and to take advantage of the annual nature of the CPS in order to examine more closely the timing and magnitude of occupational employment changes relative. Section 5 continues the analysis in the preceding section, focusing on the chain of causality that runs from changes in occupational employment, through changes in occupational wages, and finally to changes in the overall wage distribution. Section 6 focuses on the role of service occupations and low-wage occupations in job polarization and wage trends.
I. Theory, Claims, and Data
In two recent important papers, Acemoglu and Autor (2011, 2012) raise significant concerns about the ability of the "canonical model" of skill-biased technical change (SBTC) to explain rising wage inequality. The canonical model argues that the main cause of the increase in wage dispersion since the late 1970s is the rise in skill-biased production technologies that place a premium on the skills of more-educated and better-paid workers at the expense of less-educated and lower-paid workers. Acemoglu and Autor propose a ‘tasks framework’ that subsumes the canonical model as a special case and can explain key wage patterns and rising wage inequality over the last three decades. This section reviews their critique of the canonical model, and lays out the basics and key empirical claims of their ‘tasks framework’. The "canonical model" For the last two decades, the standard explanation for rising wage inequality has relied heavily on a fairly simple model of the interplay of supply and demand. Daron Acemoglu and David Autor (2012) have succinctly summarized the main workings of what they refer to as the "canonical model" as follows: "In this model, technological progress raises the demand for skill and human capital investments slake that demand. When demand
7
moves outward faster than does the supply of human capital, inequality rises, and vice versa when supply outpaces demand." (p. 428) Claudia Goldin and Lawrence Katz build on the prior literature and offer a comprehensive theoretical and empirical description of the canonical model in The Race Between Education and Technology (2010). In the "canonical model," the primary driver of labor demand is "skill-biased technological change" (SBTC) in the production of goods and services, which leads employers to hire more high-skilled workers whose skills complement new production technologies (including, especially, computers). In most empirical implementations of the model, the key indicator of the supply of skills is the share of college-educated workers in the labor force. As Acemoglu and Autor (2011, 2012) stress, the canonical model features two types of workers: college graduates—or, more precisely ‘college equivalents’, which includes all those with a college degree or further degree and half of those with ‘some college’, and non-college graduates—not-college equivalents. The level of computerization is the most common empirical measure on the demand side, but SBTC is often simply inferred from a time trend or the pattern of employment and wages (a key figure is in Acemoglu and Autor 2012, reproduced here as Figure B, see also Katz and Murphy, 1992).3 Almost since its inception, the canonical model has been subject to two distinct critiques. The first, in chronological terms, questioned the connection between technological change and inequality. As Lawrence Mishel and Jared Bernstein (1994, 1998) argued, technological change has been a constant feature of the economy throughout the entire twentieth century, with no obvious associated increase in wage or income inequality for much of that period. David Howell (1994) noted that the timing of the microcomputer revolution, which was widely believed to be a key source of the skill-bias, was also off: the largest increase in wage inequality took place in the few years between 1979 and 3The canonical model's supply-and-demand framework has sometimes been augmented by a consideration of labor-market institutions (most typically, the minimum wage and unions), but as Goldin and Katz (2009) have argued: "The rise and decline of unions plays a supporting role in the story [of wage inequality], as do immigration and outsourcing. But not much of a role. Stripped to essentials, the ebb and flow of wage inequality is all about education and technology." (p. 28)
8
1982, well before personal computers, let alone the Internet, had transformed work places. Consistent with this critique, the pace of growth in inequality declined even as computerization spread steadily in the late 1980s and 1990s (Mishel, Bernstein, and Schmitt 1997; Card and DiNardo, 2002). David Card and DiNardo (2002) expanded the critique, noting that "puzzles and problems for the [SBTC] theory in nearly every dimension of the wage structure" including the failure to explain important dimensions of wage inequality by gender, race, and age. One common feature of both Mishel, Bernstein and Schmitt (1997) and the Card and DiNardo (2002) critiques was the failure of the 50/10 wage gap to expand after the late 1980s and its subsequent fall in the 1990s. These movements in the bottom half of the wage distribution were inconsistent with the canonical claim that the rising price of skills (reflected in wage levels) in all its dimensions was driving wage inequality: since it was clear that low- wage workers were seeing wage gains as large or larger than middle -wage workers. The second, and later, critique of the canonical model (by Autor, Katz, Kearney 2006, and Acemoglu and Autor (2011, 2012)) did not seek to replace the canonical model, so much to use it as the foundation for a more general skill-biased technological change framework, which essentially subsumed the canonical approach.4 Acemoglu and Autor (2011, 2012), who provide the most articulate and comprehensive discussion, identify three key shortcomings of the standard account and offer a formal, task-based, rather than skills-based, model that is explicitly an extension of the canonical model.5 The first shortcoming identified by Autor, Katz and Kearney (2006)6 and later by Acemoglu and Autor is that even though the simple supply-and-demand framework can 4 The tasks model "...nests the canonical model as one parametric case; thus, this model builds upon rather than dispenses with the many strengths of the canonical model." (Acemoglu and Autor 2012, p. 445) 5 As we note below, all three of these shortcomings were identified by Mishel, Bernstein and Schmitt (1997). Acemoglu and Autor (2011, 2012) build on task-based models proposed by Autor, Levy, and Murnane (2003).
6 � The abstract of the article (Autor, Katz and Kearney 2008) that grew from the initial job polarization paper (Autor, Katz and Kearney, 2006) presented at the 2006 AEA meetings says “The
9
account well, in their view, for the rising wage differential between college and high school educated workers from the 1970s through the early 1990s, the same model substantially overstates the rise in the college premium thereafter (as shown by Figure C, reproduced from Acemoglu and Autor (2011)).The deceleration in the college premium, they note, would suggest that relative demand for high-skilled workers decelerated after about 1992, which in their judgment "does not accord with common intuitions regarding the nature or pace of technological changes occurring in this era." (2012, p. 437) The second shortcoming noted by Acemoglu and Autor is the canonical model's inability to explain the divergence in the pattern of wage behavior of inequality between the top and bottom halves of the wage distribution in the early 1990s relative to that of the 1980s.7 In the 1980s, wage growth was a smoothly increasing function of the initial wage level. From the early 1990s (or slightly earlier) onward, however, inequality continued to grow in the top half of the distribution (the 90-50 differential widened), but inequality was flat or falling in the bottom of the distribution (the 50-10 differential declined somewhat).8 Since the canonical model is usually framed around two kinds of workers --more- and less-skilled workers, often operationalized as college- and non-college-educated workers-- these non-monotonic movements in the wage distribution in the 1990s are difficult to explain in that framework.
slowing of the growth of overall wage inequality in the 1990s hides a divergence in the paths of upper-tail (90/50) inequality—which has increased steadily since 1980, even adjusting for changes in labor force composition—and lower-tail (50/10) inequality, which rose sharply in the first half of the 1980s and plateaued or contracted thereafter…. Models emphasizing rapid secular growth in the relative demand for skills—attributable to skill-biased technical change— and a sharp deceleration in the relative supply of college workers in the 1980s do an excellent job of capturing the evolution of the college/high school wage premium over four decades. But these models also imply a puzzling deceleration in relative demand growth for college workers in the early 1990s…" 7Our reading of the data is that the key inflection point occurred somewhat earlier, in 1987 or 1988.
8Acemoglu and Autor, characterizing the difference in wage patterns between the 1980s and 1990s, focus on the shift in the 50/10 wage gap trend: “During the initial period of 1974 through 1988, the monotonicity of wage changes by percentile is evident. Equally visible is the U-shaped (or ‘polarized’) growth of wages by percentile in the 1988 through 2008 period. Interestingly, the steep gradient of wage changes above the median is nearly parallel for these two time intervals. “Thus, the key difference between these periods turns on the evolution of the lower tail, which fell steeply in the 1980s and then regained ground relative to the median thereafter” (Acemoglu and Autor 2012, page 15, emphasis added).
10
The final shortcoming noted by Acemoglu and Autor is the canonical model's inability to explain how technological progress could produce stagnant and, especially, declining real wages for middle- and less-skilled workers over long periods, even as technology was increasing average productivity.9 All three of these critiques were made by Mishel, Bernstein and Schmitt (1997), ten years earlier: “...the experience since the mid- to late- 1980s does not accord with a technology explanation, whose imagery is of computer-driven technology bidding up the wages of "more-skilled" and "more-educated" workers, leaving behind a small group of ''unskilled'' workers with inadequate skills. The facts are hard to reconcile with the notion that technological change grew as fast or faster in the 1990s than in earlier periods. If technology were adverse for ''unskilled'' or "less-educated" workers, then we would expect a continued expansion of the wage differential between middle-wage and low-wage workers (the 50/10 differential). “Yet, the 50/10 differential has been stable or declining among both men and women since 1986 or 1987. Instead, we are seeing the top earners pulling away from nearly all other earners. Therefore, there seem to be factors driving a wedge between the top 10% and everyone else, rather than a single factor aiding the vast majority but leaving a small group of unskilled workers behind. Further confirmation of the breadth of those left behind is that wages have been stable or in decline for the bottom 80% of men and the bottom 70% of women over the 1989-95 period, with wages falling for the entire non-college-educated workforce (roughly 75% of the workforce). Of course, even high-wage, white-collar, or college-graduate men have failed to see real wage growth in 10 years. “The flattening of the growth of education differentials in the late 1980s and 1990s among men also does not easily fit a technology story. Since the wages of college-
9As they observe: "The canonical model of factor-augmenting technical change robustly predicts that demand shifts favoring skilled workers will raise the skill premium and boost the real earnings of all skill groups (e.g., college and high school workers)... This prediction appears strikingly at odds with the data..." (2012, p. 439; emphasis added)
11
graduate men are not being "bid up" relative to others at the same pace as in the early and mid-1980s, one can only conclude that there has been a deceleration of the relative demand for education (given that the supply of college workers did not accelerate).” We also note that Autor and Acemoglu do not consider several additional critiques of the canonical model, particularly: (1) the failure of education wage differentials to capture much, if not the majority, of the growth of wage inequality, which happened among workers with similar education and experience (so called’ “within-group” wage inequality); (2) the failure to explain the extraordinary rise of wages among the top one percent of earners; and (3) the possibility that observed education wage gaps could be driven by factors other than changes in the price of skills, including changes in the minimum wage and unionization, industry deregulation and globalization, all of which could affect relative wages by education but have nothing to do with technological change. The tasks framework To address these three shortcomings10, Acemoglu and Autor (2012, Section 4) construct a formal model, which builds on the framework originally developed by Autor Levy, and Murnane (2003), where the fundamental units of the production process are job "tasks," rather than workers' skills. Probably the most important feature of the model is that it defines three kinds of tasks: non-routine cognitive tasks (high-skilled), non-routine manual tasks (low-skilled), and routine tasks (middle-skilled). The second important feature of their model is that it separates tasks from skills. Workers of different skill
10Acemoglu and Autor (2012, p. 17) are very explicit that the motivation for developing the task framework is to overcome the deficiencies of the canonical model, “We believe that these discrepancies between the data and the predictions of the canonical model-- specifically, the heterogeneous behavior of the top, middle and bottom of the earnings distribution, falling real wages of some skill groups, polarization of earnings growth, and polarization of occupational growth are sufficiently important to warrant enriching the canonical model to gain leverage on these trends.” And, “We do not wish to suggest that this model resolves the puzzles posed above; to some degree, it was purpose-built to interpret them. Our claim --or at least our hope --is that this framework is a productive conceptual tool for confronting key facts that currently lie beyond the canonical model’s scope." (p. 22)
12
levels (and different mixes of workers of different skill levels) can perform any of the tasks.11 The driving force in this framework is computerization. Computers have the capacity to compete directly with workers who perform routine tasks, such as those performed by clerical and administrative workers or production workers in manufacturing. Computers, however, are poor substitutes for workers performing non-routine cognitive jobs, such as managers, lawyers, or doctors. In practice, computers are likely to be strong complements to such workers. Nor are computers effective substitutes for workers performing non-routine manual tasks, including many personal services, such as food preparation and cleaning. The introduction of tasks and of three kinds of labor (low-, middle-, and high-skilled), however, allows the new model to overcome the three shortcomings of the standard approach mentioned earlier. Most prominently, by allowing for three types of tasks, their model can potentially explain the divergent inequality trends after the 1980s between the top and middle, on the one hand, and the middle and the bottom, on the other hand --something that the canonical model, with only two types of labor cannot. Key empirical claims
Economists working in this framework have made several empirical claims, which are the focus of the empirical work in the remainder of this paper.
11Acemoglu and Autor (2012): "Many of the shortcomings of the canonical model can, we believe, be overcome by relaxing the implicit equivalence between workers’ skills and their job tasks in the model. In our terminology, a task is a unit of work activity that produces output. A skill is a worker’s stock of capabilities for performing various tasks. Workers apply their skills to tasks in exchange for wages. Thus, the task-based approaches emphasize that skills are applied to tasks to produce output—skills do not directly produce output. The distinction between skills and tasks is irrelevant if workers of a given skill always perform the same set of tasks. The distinction becomes important, however, when the assignment of skills to tasks is evolving with time, either because shifts in market prices mandate reallocation of skills to tasks or because the set of tasks demanded in the economy is altered by technological developments, trade, or offshoring." (pp. 444-45)
13
Claim 1: In the 1990s, employment growth was polarized, with the employment share of high-skilled and low-skilled occupations expanding and the employment share of middle-skilled occupations contracting. This pattern marked a stark change relative to the 1980s when, across occupational skill levels, employment grew least at the bottom, more in the middle, and most at the top. Autor and various co-authors argue that sometime after the late 1980s, employment growth became polarized, with a simultaneous increase in the employment shares of high-skilled and less-skilled occupations coinciding with declining employments shares for middle-skill occupations.12 This pattern was in stark contrast to the 1980s, when employment fell at the bottom of the skills distribution, whether skill was measured by education level or using the occupational wage rankings used in the task models. Simply put, the first claim is that job polarization occurred in the 1990s but not in the 1980s, when occupational employment at the bottom contracted, rather than expanded. For the 1990s, Autor, Katz, and Kearney (2008, Figure 11, covering 1990-2000), Autor (2010, Figure 1, covering 1989-1999), and Acemoglu and Autor (2011 Figure 10, covering 1989-1999, reproduced here as Figure A) find an increase in the employment share for low-skill occupations up to roughly the 10th percentile of the occupational skill distribution.13 These same estimates show contemporaneous increases in the employment share of high-skill occupations from about the 75th percentile of the occupational skill distribution (though, perhaps about as low as the 65th percentile in the case of Acemoglu and Autor, 2011). Since employment shares must add to 100 percent, increases in employment shares at the bottom and the top imply declining employment shares for occupations in the middle.
12 See, most recently, Acemoglu and Autor (2012), Figure 5, covering 1990-2007; as well as, Autor, Katz, and Kearney (2008), Figure 11, covering 1990-2000; Autor (2010), Figure 1, covering 1989-1999; and Acemoglu and Autor (2011),Figure 10, covering 1989-1999. In all cases, occupational skill level is measured by the mean occupational wage in 1980, except Autor, Katz, and Kearney, who use the median occupational wage in 1980. 13 There is relative polarization (a term further elaborated below) further up the distribution to the 20th percentile, meaning employment shares among low-wage occupations expanding greater (falling less) than that in middle wage occupations.
14
Most discussions of job polarization have emphasized the change in employment patterns between the 1980s and the 1990s. Researchers, however, have paid almost no attention to a similarly stark break in employment patterns between the 1990s and the 2000s. For the period 2000-2007, Autor (2010, Figure 1) and Acemoglu and Autor (2011, Figure 10) show employment gains for the bottom 30 percent or so of the occupational skill distribution, but no increase in relative employment for workers above that level in the distribution. These results suggest that by the 2000s, job polarization had ceased to be a factor in the US labor market. This is acknowledged only indirectly, unfortunately, in the literature, but this finding undercuts the claim that occupational employment patterns correspond to key wage patterns, a topic explored below. Claim 2: This switch in occupational employment patterns in the 1990s caused corresponding shifts in wage patterns. Specifically occupational employment polarization in the 1990s can explain the shift in the 50/10 wage gap trends that the canonical model fails to explain: after wage inequality at the top and the bottom of the distribution grew symmetrically in the 1980s, wage inequality in the 1990s was distinctly asymmetric, with growing inequality in the top half (90/50 wage gap)of the distribution and declining inequality in the bottom half (50/10 wage gap).14 If the first claim is essentially ‘job polarization occurred in the 1990s but not in the 1980s’ then the second claim is that ‘the change in occupational employment patterns in the 1990s to job polarization explains changes in wage inequality at the bottom of the wage scale.’ Claim 3: Autor and Dorn (2012) argue that a "key fact" is that "rising employment and wages in service occupations account for a substantial share of aggregate polarization
14 The tasks framework also is said to address two other shifts in wage patterns: (1) from the early 1990s, education wage differentials stabilized among the non-college educated (that is, those with some college, a high school degree, or no high school degree); and (2) from the mid-1990s, the college premium decelerated sharply and grew at a rate well below what would have been predicted by the canonical model. This paper does not examine these empirical claims. Our research, not included here, does lend support to the second claim—occupation employment-driven changes in educational requirements do correspond to the deceleration of the college wage premium. Thus, the tasks framework and the data contradict “common intuitions regarding the nature or pace of technological changes occurring in this era”, meaning that SBTC actually did slow in the late 1990s, just like the canonical model suggests.
15
and growth of the lower tail of the U.S. employment and earnings distributions between 1980 and 2005." The most recent research in the tasks framework has focused strongly on the role that the "service occupations" have played in the process of both employment polarization and wage polarization. The service occupations (excluding public safety workers, as Autor and Dorn do) are usual low-wage, non-routine manual jobs that accounted for less than 13 percent of total employment in 2007. Typical occupations in this category include food preparation, security guards, and janitorial services, but unless explicitly excluded from the analysis, the formal "service occupations" category also includes police and fire-fighters, who earn substantially more and are on average much better educated than other service occupations. The emphasis on the service occupations represents a methodological break with much of the earlier research in this area, which focused on much finer occupational categories (typically three-digit occupations) where the skill ordering was determined by the initial average wage in the narrow occupation group.
II. An introductory look at wage inequality and occupation
employment trends The ‘tasks framework’ attempts to explain the patterns of wage inequality over the last thirty years by examining changes in the occupational employment mix. This section provides an introductory look at occupational employment and wage trends with two key goals. The first is to put the post-1979 occupation trends in a longer historical context. The second is to examine the correspondence of occupation shifts since 1979 to the evolution of key wage gaps—particularly the 50/10 and 90/50 wage gaps using the annual data available from the CPS. The Long View of Occupation Employment Trends As discussed above, the original motivation for the tasks framework was to explain the shift in wage patterns in the 1990s that differed from those of the 1980s, patterns which are not readily explained by the canonical two type of worker (college/non-college)
16
model. This shift in wage patterns is thought to be driven by changes in occupational employment patterns, from monotonicity in the 1980s to polarization in the 1990s. This section examines occupational employment trends over the post-war period to put each decades’ trends in historical context. The focus is on the expansion and contraction of high, middle and low-wage occupations (categories defined by Acemoglu and Autor 2011 and in other papers). Acemoglu and Autor (2011) provide a long look back at the occupational composition of ten occupations since 1959, which is reproduced in Table 1 and supplemented by showing changes in the aggregate categories of low, middle and high wage occupations and the percentage-point change in occupation employment shares for each decade and the most recent time period (2000-07, adjusted to a ten-year rate of change). The Acemoglu and Autor data are derived from decennial Census data except for the latest year which is derived from the American Community Survey. The trend in these aggregate occupation shares are shown in Figure C. These figures also include comparable trends for the 1979-2007 period based on our tabulations of the Current Population Survey.15 Acemoglu (2010), in a newspaper column, summarized their view of these historical trends:
“US employment and demand for labour have been undergoing profound changes over the last 30 years. While the demand for high skill workers, who can perform complex, often non-production tasks, has increased, manufacturing jobs and other "middling occupations" have been in decline. Also noteworthy is that over the last 10-15 years, many relatively low-skill, low-pay service occupations have been expanding rapidly.”
Table 1 and Figure Ca show that "middling occupations" declined at a comparable pace in each of the last three periods dating back to 1979, eroding by roughly 4.5 percentage points per decade. A critically important observation, however, is that "middling occupations" have been declining throughout the entire period covered by their data, 1959-2007, periods where wage inequality was stable as well as ones where wage 15These are hours-weighted employment trends ‘adjusted’ to remove the inconsistencies generated by occupation coding changes in 1983 and 2003. We employ the consistent occupation coding developed by Autor and Dorn. The Appendix has greater detail.
17
inequality grew. The decline in the ‘middle’ highlighted in the discussion of job polarization is not unique at all to the 1990s. Moreover, the blue-collar occupations, ‘Production, craft and repair’ and ‘Operators, fabricators and laborers’, eroded more quickly in the 1960, 1970s and 1980s than in the 1990s or 2000s, so any notion that job polarization represents some new technological turn against blue-collar middle-wage jobs is not accurate. Although discussions of occupational employment trends in the job polarization literature always assumes that these occupation shifts are solely a reflection of technological change, this is clearly false since globalization trends and, in particular, the rise of trade deficits over the last three decades has also changed the occupational composition of employment. We hope to address the impact of trade on these occupational employment trends in further work. Table 1 and Figure Cb also show the high wage occupations have expanded over the entire 1959-2007 period, though faster in the 1980s and 1990s. An important development is that the growth of high wage occupational employment in the 2000s was slower than in the 1990s and grew comparably to the slow trend in the 1960s. Analysis of occupation employment growth by wage percentile, presented by Autor (2010), shows that employment in high wage occupations grew no faster than employment in middle wage occupations in the 2000s.This dramatic slowdown in relative demand for workers in high wage occupations in the 2000s relative to that of the 1980s and 1990s is an important observation with implications for wage trends. The slowdown in the growth in top occupations was due to the failure of technician employment to expand (which also occurred in the 1990s), a remarkable slowdown in management occupations (up only 0.4 percentage points, about a fifth as fast as in the 1980s and 1990s), and a deceleration in the growth of professional employment. This overall slowdown in high-wage occupations in the 2000s is consistent with the slower growth of the 90/50 wage gap. The slower expansion of high-wage employment is consistent with recent technological change generating more modest growth in the demand for college graduates and could help explain the flattening of the growth of college wages and the college wage premium. Given the continuing trends in both the middle- and high-wage occupations, an explanation of a changed pattern in the 50/10 wage gap rests heavily on the expansion of low-wage occupations in the 1990s, relative to the 1980s: such an expansion can explain the differing pattern of low-wage (10th percentile) and 50/10 trends in each decade as
18
demand for low-wage workers expanded in the 1990s relative to the 1980s, with the result that low-wage workers fared better and the 50/10 wage gap stopped expanding and even fell in the 1990s. In the job polarization literature, such as Autor and Dorn (2012) low-wage occupations are equated to the aggregate of the three service occupations. However, service occupations represent roughly half of the occupational employment of the bottom fifth (in terms of lowest-paying occupations) of occupational employment. A section below provides a more in depth analysis of employment trends in service occupations and in low-wage occupations. For our purposes here our analysis focuses only on the aggregate of service occupations. As shown in Table 1 and Figure Cb, service occupations were relatively stable in size over the 1970s and 1980s, then expanded modestly in the 1990s (up 1.0 percentage point over the full decade), and then grew far faster in the 2000s (up 3.0 percentage points at a ten-year rate). Acemoglu and Autor (2011), citing Autor and Dorn (2010), suggest a sharper change in trend in the 1990s than seen in Table 1, indicating “the employment share of service occupations was essentially flat between 1959 and 1979. Thus, their rapid growth since 1980, marks a sharp trend reversal [emphasis added].” More importantly, they note: “Indeed, Autor and Dorn (2010) show that rising service occupation employment accounts almost entirely for the upward twist of the lower tail ... during the 1990s and 2000s. All three broad categories of service occupations, protective service, food preparation and cleaning services, and personal care, expanded by double digits in the both the 1990s and the pre-recession years of the past decade (1999-2007). Protective service and food preparation and cleaning occupations expanded even more rapidly during the 1980s.” Our reading of these initial data suggests that the scale and timing of the changes in service occupations does not correspond to Acemoglu and Autor’s interpretation. The key empirical issue is whether there was a substantial expansion of demand for low-wage workers in the 1990s relative to the 1980s as indicated by trends in service occupations. Such an expansion actually needs to have occurred in the late 1980s (the specific timing depends on whether the analysis is of all workers, men or women).
19
The appropriate metric, in our view, is the change in employment shares rather than (percent) growth in employment because the issue is changes in relative demand. In our reading of Acemoglu and Autor’s data, displayed in Table 1, there was growth in service occupations in the 1990s (up 1.0 percentage point) that exceeded that of the 1980s (up just 0.3 percentage points). On first glance, however, this 1990s expansion does not seem sufficient to explain why a major increase of the 50/10 wage gap in the 1980s failed to continue in the 1990s.This is especially the case since measurement issues—the occupation coding change that occurs between the 1990 and 2000 decennial Censuses— artificially expands service occupation employment in the Acemoglu and Autor series. This is examined in greater detail in the data appendix. The largest change in employment in service occupations appears to have taken place in the 2000s, when the service-occupation employment share increased at a 3.0 percentage point ten-year rate. These observed employment (share) trends in the service occupations raise some important questions. One is whether a modest expansion of the low-wage occupation expansion in the 1990s relative to the 1980s is sufficient to explain a sharp change in wage patterns at the bottom. A second question is whether the timing of the change in service occupation employment occurred coincident with the change in wage patterns, i.e., in the late 1980s or early 1990s. An even bigger question: if one believes the modest 1990s change in service occupation employment was sufficient to dramatically alter wage patterns in the 1990s, then why didn’t a doubling of that rate of expansion in low-wage occupations in the 2000s lead to an acceleration of wage growth at the bottom and a sharp contraction in the 50/10 wage gap from 2000 to 2007? This is the first of many instances where the story which is said to explain the 1990s is clearly inconsistent with the trends in the 2000s (which is not adequately acknowledged, in our view, by the task framework/job polarization literature). We have also examined the occupation shifts presented in Autor and Dorn (2012, Table 1) for 1950, 1970, 1980, 1990, 2000 and 2005 based on shares of total hours worked and including farming (excluded from the Acemoglu and Autor 2011 data). The Autor and Dorn data confirm that the shrinkage of middle wage occupation employment and expansion of high wage occupation employment also occurred in the 1950-70 period, though at a slower pace than in later periods.
20
This ongoing shrinking of middle-wage occupations and expansion of high-wage occupations over the last sixty years represents the occupational upgrading associated with technological change (but also the trade impact in the last few decades). It should not be surprising to any labor economists and has long been noted (Spenner, 1988; Mishel and Bernstein, 1994; Mishel, Bernstein and Schmitt, 1997; Handel, 2005; and Howell and Wolff, 1991). These data allow us to characterize ways in which technology has affected the labor market (shaping the occupational employment structure) and ways it has not affected the labor market (causing wage inequality). Some analysts have mistakenly asserted that if an analysis suggests that technological change has not greatly affected wage inequality that this is equivalent to saying that technology has had no impact on the labor market. We have just documented a longstanding trend of occupational upgrading—more white-collar and less blue- and pink- collar work—for many decades. These changes in the occupation structure are primarily technology-driven and have increased the skills and education employers seek in the labor market which, in turn, necessitates an educational upgrading of the workforce. This is what Claudia Goldin and Lawrence Katz refer to as the “race between technology and skills.” We believe there has been such a race, technology has had a major effect and that the education and skills have greatly improved and satisfied that increased demand. There has also been an increase in so-called “skill premiums,” such as the college wage premium. We view that increase as reflecting other factors such as deregulation of industries, globalization, an eroded minimum wage, excessive unemployment and declining unionization rather than the product of technologically-driven skill shortages. That is, in the race between skills and technology since 1979 there has been roughly a tie. This has especially been the case since 1995 after which the college premium has barely grown. Moreover, as shown in Mishel et al, (2012), over the last ten years real wages have been flat or falling for a majority of college graduates, including those in nearly every occupation group (e.g., business occupations). In these circumstances where technology and skills have run neck and neck technology has had a large impact on the labor market but it has not generated wage inequality. We have faced a “wage deficit” rather than a “skills deficit,” meaning that jobs at every education and skill level have not
21
seen appropriate wage growth. This is evident in the failure of wages of both high school and college-educated workers to keep pace with productivity, and in the extraordinary share of profits in the economy, especially in the 2000s. Occupation employment shifts and wage gap shifts
This section continues the analysis of occupational employment shifts and focuses on their correspondence to key wage gap trends. The starkest shift in wage patterns was for the 50/10 wage gap which substantially expanded in the 1980s, stopped expanding in the late 1980s and then stabilized and contracted somewhat in the 1990s. This pattern indicates that in the 1990s wage growth for low-wage workers was as good or better than it was for middle-wage workers in the same period --exactly the reverse of what occurred in the 1980s. The shift in wage patterns was most stark among women: the 50/10 wage gap grew from 1.47 in 1979 to 1.91 in 1988, a gap generated by a 17 percent decline at the 10th percentile and an 8 percent gain at the median. The 50/10 wage gap grew far less among men (from 2.04 in 1979 to 2.28 in 1986) because wages fell less at the 10th percentile wage and wages also fell at the median. The second wage gap, the 90/50 gap continued to grow throughout the 1980s and the 1990s but rose more slowly among men after 1993 and among women after 1994. Table 2 and Figure D employ annual data from the CPS to portray the timing of occupation employment and wage gap shifts. The 1973-2010 annual trend in the key occupation employment shares (hours-weighted) and the corresponding wage gap are presented in Figure D for all workers, and separately for men and women. This figure allows us to see whether the shifts in occupational employment (e.g., changes in the size of service occupations) correspond to the shifting pattern of wages (e.g., the flattening in the 50/10 wage gap after the late 1980s). The 50/10 wage gap is displayed along with the employment shares in middle and low wage occupation and, likewise, the 90/50 wage gap is displayed alongside the employment shares in high and middle wage occupations. Table 2 uses the same data to present the trends in particular time periods: business cycle periods such as 1979-89, 1989-2000 and 2000-07 plus the two distinct sub-periods of the 1990s, 1989-95 and 1995-2000.
22
Two metrics for assessing the occupational shifts are used. The first is the simplest, the annual percentage-point change in an occupation’s employment share in each period. The percentage-point change, however, is not scaled at all to the size of the occupation group and since the occupation groups vary tremendously in size—the middle group represents roughly 60% of employment in 1979 while service occupation represented about 14%. Given differing sizes the same percentage-point change means a larger expansion or contraction for service occupations than it would for middle-wage occupations. The second metric, therefore, divides the percentage-point change in a period by the starting share and thereby reflects the degree to which that occupation expanded or contracted. Using the CPS ORG for both the occupational employment trends and the wage trends has several advantages. One is that the CPS occupational employment trends have not yet been used in an analysis of job polarization, so they provide new information and an additional test of the robustness of the finding of job polarization.16 Second, using the CPS allows us to examine annual trends and test whether shifts in employment patterns are coincident with shifts in the 50/10 and 90/50 wage gaps. A third reason to use annual CPS data is that we can make an adjustment for the coding changes that occurred in 1983 and 2003. The annual data series we employ eliminates the change in occupation shares in the year of the coding changes, 1982-83 and 2002-03 by substituting the average of the change in share in the preceding and subsequent two years.17 Last, the CPS ORG is the acknowledged best source for examining hourly wages. Figure D displays the trends in low, middle, and high wage occupation employment shares. Employment shares for all three groups move smoothly over the entire 1973-2010 period. Meanwhile, wage patterns show abrupt changes, particularly the sharp growth in the 1980s in the 50/10 wage gap and the subsequent shrinkage (among all and men) or flattening (among women) thereafter.
16Acemoglu and Autor (2011) use CPS ORG data for computing wage trends for the ten broad occupation groups Table 2) based on their consistent occupation coding but do not use these data for annual employment trends. 17That is, the change in 1982 to 1983 is the average of the changes from 1980 to 1982 and from 1983 to 1985. Comparably, the change in 2002-03 is the average of the change from 2000-02 and from 2003-05. The changes from 1983 to 2002 are the 1983 occupation share obtained this way plus the change in each year’s occupation share change in the CPS. Similarly, the changes from 2003 to 2010 are based on the actual percentage point change in occupation shares in the CPS.
23
The prima facie evidence, therefore, is not supportive of the claim that occupational employment polarization emerged in the late 1980s and early 1990s and caused a change in wage patterns. For instance, the trend in the employment share of service occupations, which Autor and Dorn (2010) and Acemoglu and Autor (2011) claim drives the 50/10 wage gap, has been smoothly changing over nearly forty years. Similarly, the shrinkage of middle-wage occupations has been steady as well. Steady trends in occupational employment composition cannot cause discontinuous shifts in key wage gaps. Table 2 provides the detailed data that confirm the lack of correspondence between low-wage (service) occupation share trends and trends in the 50/10 wage gap. Our reading of the task framework literature is that it postulates that the expansion of service occupations should lead to a falling 50/10 wage gap as the demand for low-wage workers expands relative to workers in the middle. In the 1980s, service occupations expanded employment overall and among men, but, contrary to expectations built into the task framework literature, the 50/10 wage gap expanded. Nor was there any shift to a faster expansion of service occupations overall or among men in the early 1990s (1989-95), when the 50/10 wage gap flattened among men and declined overall. Thus, shifts in occupational employment shares for service occupations do not appear to have any influence on the development of the 50/10 differential, raising doubts about a key claim of the task framework literature. Our analysis of the broader low-wage occupation group presented below affirms this finding. The corresponding data for women are also inconsistent with the standard task framework analysis. In the 1980s, service occupation employment shares for women fell modestly (-.03 percentage points per year), which does not tightly correspond to a stark widening of the 50/10 wage gap. Service occupation employment shares fell at a faster pace in the first half of the 1990s (-0.09 percentage points per year) but the 50/10 gap declined (0.56 log points per year). The abrupt change in the trend of the 50/10 differential for women was the largest change in wage patterns between the 1980s and 1990s. Yet, low-wage service occupation employment trends among women can not explain this key shift in wage patterns among women, a major failure of the tasks framework.
24
The trends in the wage gap in the top, the 90/50 wage gap, are not tightly linked to shifts in occupation employment shares either. Among men, the 90/50 wage gap grew more strongly in the early 1990s than in the 1980s even though the high-wage occupation growth slowed. The 90/50 wage gap grew far more slowly in the late 1990s (0.67 log points per year) though the growth of high-wage occupations did not slow at all. In the 2000s the growth of high-wage occupations among men was minimal (0.05 percentage points per year) but the 90/50 wage gap did continue to grow (0.51 log points per year) though at a reduced pace compared to the 1980s and or 1990s. Among women, there was a clear deceleration in the growth of the 90/50 wage gap in the late 1990s and 2000s, but it is difficult to see how the trajectory of high-wage occupations could explain this pattern. The growth of high-wage occupations was slowed somewhat between the first and second halves of the 1990s (falling from 0.68 to 0.59 percentage points per year) while the 90/50 wage gap grew only a third as fast in the second half of the 1990s as it had in the first half of the decade. In the 2000s, the 90/50 wage gap grew a bit faster than in the second half of the 1990s, but high-wage occupations grew more slowly. The decline in middle-wage occupations among women was similar in the 1980s and the entire 1990s, which does not help resolve this puzzle. The faster shrinkage of middle-wage occupations in the 2000s, however, can help explain the pickup in 90/50 wag gap growth.
III. What does the CPS tell us about occupational employment trends
In this section, we first use data from the Current Population Survey Outgoing Rotations Group (CPS-ORG) to replicate a key figure in the job polarization literature -- a figure that was created using data from the Decennial Census and the American Community Survey -- Figure 10 in Acemoglu and Autor (2011) (which is also Figure 1 in Autor (2010)). Though the CPS-ORG has smaller sample sizes, its key advantages, as mentioned above, are that it has a better hourly wage measure, and data are available for each year. This exercise is also useful simply to see how robust this key finding in the job polarization literature is to changing the data source. Our treatment of the CPS-ORG data is described in the Data Appendix.
25
In this discussion, we find it helpful to distinguish between what we call “absolute” job polarization and “relative” job polarization. Absolute polarization is both what the job polarization literature conveys and what is most commonly referred to in popular discussions of this topic: employment share growth at both the top and bottom of the occupational distribution, with losses in the middle. Relative polarization refers to growth across the occupational distribution that has a U-shape, whether or not both ends see absolute growth in shares. So, for example, employment share growth across the occupational distribution where the middle loses substantial employment share, the bottom loses employment share but not as much as the middle, and the top gains employment share would represent relative but not absolute polarization. Of course, it is relative employment growth that is the relevant concept in discussions of relative wage trends. Another important issue is the impact of changes in occupation coding over time. As described in the Data Appendix, we employ the same occupation crosswalk used in, among other papers on this topic, Acemoglu and Autor (2011), to attempt to obtain a consistent series across several coding changes in the CPS over the 1979-2007 period. As shown in Appendix Figure A.A, using this crosswalk, we are able to almost exactly replicate the underlying major occupation employment shares in each year used in Figure 12 of Acemoglu and Autor (2011 (who do not show annual data but do have them in their publicly available program). There are ten occupations and this graph shows trends for each of these ten occupations from both our tabulations and Acemoglu and Autor’s. The fact that only ten lines are observable means that the lines based on our tabulations almost exactly duplicate their tabulations. An examination of Figure A.A reveals that the major changes in occupation coding between 1982 and 1983 and between 2002 and 2003 are difficult to bridge. Even with the careful crosswalk used in Acemoglu and Autor (2011), there are large, visible discontinuities in employment shares between 1982 and 1983 and between 2002 and 2003. For detailed information about the impact of the coding break, see the data appendix. The consistency problems associated with the Autor-Dorn occupational classification system are also discussed in Foot and Ryan (2012). Figure E shows our initial replication of Figure 10 in Acemoglu and Autor (2011) (which is also Figure 1 in Autor (2010)). The data in this figure are not adjusted for the major 1982/1983 and 2002/2003 coding breaks, since the empirical work in this literature
26
does not makes these adjustments. Figure F shows our replication of the same figure using data that are adjusted for the coding breaks using the simple adjustment procedure described in the Appendix (note that the line for the 1989-2000 period is the same in figures E and F because no major coding break occurs in the CPS in this period). We believe the adjusted series provides a more accurate portrayal of underlying trends, so we will focus on this figure. Figure F fairly closely replicates the Acemoglu and Autor (2011) figure, with some notable differences. While Acemoglu and Autor (2011) find monotonic increases in employment across occupational percentiles in the 1980s, we find relative (though not absolute) job polarization, with less job loss for the bottom of the occupational ranking than the middle during this period. The finding of relative job polarization in the 1980s is inconsistent with the Acemoglu and Autor framing that there was a stark shift in occupational employment patterns between the 1980s and the 1990s that can explain the shift in the 50/10 wage gap at the end of the 1980s (specifically, the observation that the 50/10 differential substantially expanded in the 1980s, stopped expanding in the late 1980s, and then contracted in the 1990s). For the 1990s, we replicate the Acemoglu and Autor (2011) job polarization finding, though here too we find no absolute job polarization, only relative polarization, with less job loss for the bottom of the occupational ranking than the middle during this period18. Between 2000 and 2007, Acemoglu and Autor (2011) find much more employment growth at the bottom of the occupational employment distribution than we do using CPS data; of the bottom half of the distribution we find that only the first five percentiles saw any employment share growth. Most discussions of job polarization have emphasized the change in employment patterns between the 1980s and the 1990s. Researchers, however, have paid almost no attention to the stark break in employment patterns between the 1990s and the 2000s. For the period 2000-2007, Autor (2010, Figure 1) and Acemoglu and Autor (2011, Figure 10) show employment gains for the bottom 30 percent or so of the occupational skill distribution, but no increase in relative employment for workers above that level in the distribution.
18This difference may reflect the fact that the occupational coding change that occurs between 2002 and 2003 in the CPS occurs between 1990 and 2000 in the Census data, used by Acemoglu and Autor (2010). We find, for instance, that the 2002-03 coding change artificially inflated service occupation (excluding public safety) growth by 1.0 percentage points.
27
Our CPS results confirm that there was little or no employment expansion of occupations in the upper half of the wage scale. These results suggest that by the 2000s, job polarization had ceased to be a factor in the US labor market. This is acknowledged only indirectly, unfortunately, in the literature.19 These descriptions fail to acknowledge how different the trends in the 2000s are from those of the 1990s and how those differences are at variance with the tasks framework interpretation of wage inequality trends. First, the failure to find a sizeable difference in the employment share growth of middle and high wage occupations in the 2000s means that one key dimension of job polarization that was present in the 1990s (and 1980s) is absent in the 2000s. This has the important implication that occupational employment trends cannot explain continued growth in the 90/50 wage gap in the 2000s. Second, the faster (than 1990s) expansion of low-wage occupation employment in the 2000s generates an additional puzzle for the job polarization interpretation of wage inequality: a smaller expansion of low-wage occupation employment in the early 1990s is said to have narrowed the 50/10 wage gap over that decade, yet, a larger expansion of low-wage occupations in the 2000s generates no contraction in the 50-10 differential in the 2000s. An important and unspoken implication is that "job polarization," which features in many popular and policy discussions of the contemporary economy, is in fact, at best, only a theory of developments in the 1990s and does not contribute to our understanding of more recent trends. The smoothing typically used in this context masks substantial variation 19Acemoglu and Autor (2010, page 17): “In contrast, during the most recent decade for which Census/ACS data are available, 1999-2007, employment growth was heavily concentrated among the lowest three deciles of occupations. In deciles four through nine, the change in employment shares was negative, while in the highest decile, almost no change is evident. Thus, the disproportionate growth of low-education, low-wage occupations became evident in the 1990s and accelerated thereafter.” And Autor (2010, page 3) describes the 1997-2007 trends in the upper sixty percent as ‘flat’, which better accords with our read of the facts: “Fast forward to the period 1999 to 2007. In this interval, the growth of low-skill jobs comes to dominate the figure. Employment growth in this period was heavily concentrated among the lowest three deciles of occupations. In deciles four through nine, growth in employment shares was negative. In the highest decile of occupations, employment shares were flat. Thus, the disproportionate growth of low-education, low-wage occupations becomes evident in the 1990s and accelerates thereafter.”.
28
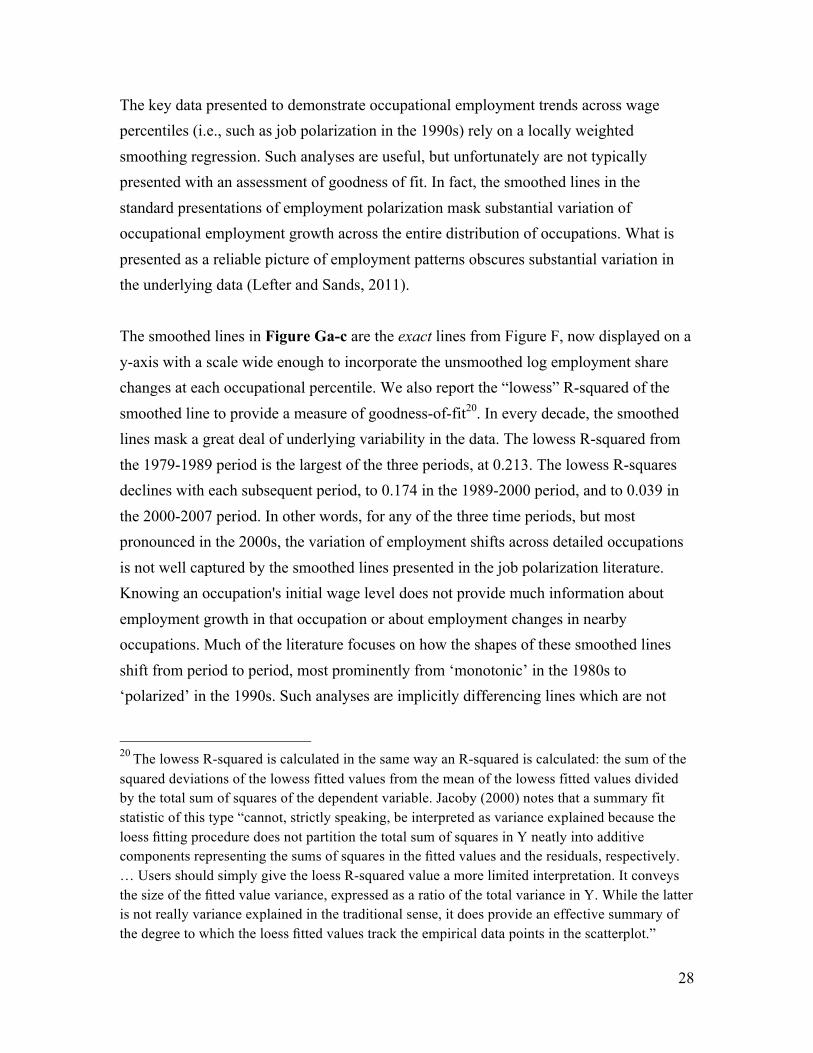
The key data presented to demonstrate occupational employment trends across wage percentiles (i.e., such as job polarization in the 1990s) rely on a locally weighted smoothing regression. Such analyses are useful, but unfortunately are not typically presented with an assessment of goodness of fit. In fact, the smoothed lines in the standard presentations of employment polarization mask substantial variation of occupational employment growth across the entire distribution of occupations. What is presented as a reliable picture of employment patterns obscures substantial variation in the underlying data (Lefter and Sands, 2011). The smoothed lines in Figure Ga-c are the exact lines from Figure F, now displayed on a y-axis with a scale wide enough to incorporate the unsmoothed log employment share changes at each occupational percentile. We also report the “lowess” R-squared of the smoothed line to provide a measure of goodness-of-fit20. In every decade, the smoothed lines mask a great deal of underlying variability in the data. The lowess R-squared from the 1979-1989 period is the largest of the three periods, at 0.213. The lowess R-squares declines with each subsequent period, to 0.174 in the 1989-2000 period, and to 0.039 in the 2000-2007 period. In other words, for any of the three time periods, but most pronounced in the 2000s, the variation of employment shifts across detailed occupations is not well captured by the smoothed lines presented in the job polarization literature. Knowing an occupation's initial wage level does not provide much information about employment growth in that occupation or about employment changes in nearby occupations. Much of the literature focuses on how the shapes of these smoothed lines shift from period to period, most prominently from ‘monotonic’ in the 1980s to ‘polarized’ in the 1990s. Such analyses are implicitly differencing lines which are not
20 The lowess R-squared is calculated in the same way an R-squared is calculated: the sum of the squared deviations of the lowess fitted values from the mean of the lowess fitted values divided by the total sum of squares of the dependent variable. Jacoby (2000) notes that a summary fit statistic of this type “cannot, strictly speaking, be interpreted as variance explained because the loess fitting procedure does not partition the total sum of squares in Y neatly into additive components representing the sums of squares in the fitted values and the residuals, respectively. … Users should simply give the loess R-squared value a more limited interpretation. It conveys the size of the fitted value variance, expressed as a ratio of the total variance in Y. While the latter is not really variance explained in the traditional sense, it does provide an effective summary of the degree to which the loess fitted values track the empirical data points in the scatterplot.”
29
well estimated, suggesting that any claims about differences are subject to a substantial margin of error. As mentioned, our preferred use of the data in this context is to adjust for the major occupational coding breaks in 1982/1983 and 2002/2003. However, in Figure E we presented the replication of the main job polarization figure without adjusting for coding breaks because the empirical work in this literature typically has not made those adjustments. The lowess R-squared for the unadjusted 1979-1989 line in Figure E, at .043, is substantially lower than for the adjusted data (which was 0.213). The lowess R-squared for the unadjusted 2000-2007 line in Figure E, also at .043, is slightly higher than for the adjusted data (which was 0.039). Of course, the 1989-2000 lines are the same in both figures. We also note that whether we use the adjusted or the unadjusted data, the ability of initial occupational wage levels to predict employment changes declines over the three decades. This appears to contradict the claim in Acemoglu and Autor (2011) that the explanatory power of occupations has increased since the 1980s21.
IV. Occupation employment shifts and wage determination
We now leave behind issues regarding the shape of occupational employment patterns and ask how occupational employment trends have affected wages, assessing Claim #2 above. As noted earlier, the literature has not offered direct evidence of how occupation shifts shape wage patterns: rather, the only evidence presented has been circumstantial, merely showing that when job polarization occurred in the 1990s there was also a polarization of wages (the 90/50 gap expanding and the 50/10 gap closing).
21 Acemoglu and Autor (2011) “The explanatory power of occupation reaches a nadir in 1979 and then, like the education measures, rises over the subsequent three decades. Distinct from the education measures, however, the explanatory power of the occupation variables rises less rapidly than education in the 1980s and more rapidly than education thereafter – overtaking education by 2007. Thus, as hypothesized, occupation appears to gain in importance over time. This is most pronounced starting in the 1990s, when the monotone growth of employment and earnings gives way to polarization.” (pp 31)
30
This section examines the relationship between occupation employment shifts and wages. We do so by first examining the main channel through which occupation shifts can be expected to affect wages: occupational employment shifts affect the wage patterns across occupations which, in turn, drive overall wage patterns. We find only weak empirical links between occupational employment changes, occupational wage changes, and changes in the overall wage distribution. We then move from observing the weak underlying relationship between wage changes at various parts of the wage distribution and changes in employment in occupations at different "skill" percentiles to an assessment in a regression framework of how much the variance of wages can be explained by occupations. We find that the importance of occupations in explaining wage variance slowed in the 1990s and reversed somewhat in the 2000s. Occupation employment shifts, occupation wage differentials and overall wage differentials and wage determination In the tasks framework, first, technology changes occupational employment, then, changes in occupational employment drive changes in occupational wages, and finally, changes in occupational wages drive changes in the overall wage distribution. The poor fit of the smoothed occupational employment lines already seen in Figure Ga-b suggests a weak link between technology and the occupational employment structure. The three panels of Figure H, however, take those occupational employment changes as real and examine their possible impact on occupational wages and then take the changes in occupational wages as given, and examine their possible impact on overall wages. The poor links between changes in occupational employment, occupational wages, and overall wages are evident in Figure Hb, which presents data for the 1990s, the period when the occupational employment patterns best fit the tasks framework predictions. The blue, roughly U-shaped, line is the same fitted occupational employment line in Figure F and Figure Gb. The black line shows the corresponding (smoothed) change in occupational wages—using the same occupations in each percentile as the employment share line but portraying the change in mean log real hourly wages for those occupations. Occupational wages grew fastest at the bottom (through about the 30th percentile) and grew at the same --slower-- rate through the rest of the occupational wage distribution. Rising occupational employment at the bottom could plausibly have driven rising
31
occupational wages at the bottom, but rapidly rising occupational employment shares did not lead to higher occupational wage shares among higher-skilled occupations. The red line in the figure traces the (smoothed) wage change at the percentiles of the overall wage distribution. Again, the rise in occupational wages at the bottom of the occupational skill distribution could plausibly explain the more rapid rise at the bottom of the overall wage distribution. But, for the top half, growth in the occupational wage distribution was inconsistent with growth in the overall wage distribution. Wage growth rose steadily from the about the median of the overall distribution, but was basically flat over the corresponding range of the occupational distribution. In fact, the biggest increases in overall wages were at the very top of the distribution, while the very top of the occupational wage distribution experienced among the smallest wage increases across all occupations.22 Based on the data for the 1990s, then, occupational employment changes appear to be poor predictors of occupational wage changes, which are, in turn, poor predictors of changes in the overall wage distribution. The empirical links are also weak for the 1980s and the 2000s. Figure HA shows the same set of lines for the period 1979-1989. As we saw in Figure F and Figure Ga, the occupational employment shows a slight U-shaped relationship for the 1980s (in contrast with Autor's work, using the Decennial Census, which shows a smooth rise in employment growth by occupational skill level). Occupational wage changes in the CPS, however, increase monotonically. The increase in the occupational employment shares for lower-waged occupations did not translate into more rapid wage growth for these occupations. The overall wage distribution also increases monotonically in the initial wage percentile, though much more steeply than the relationship followed by occupational wages.23 Figure Hc repeats the analysis using CPS data covering 2000-2007. Again, the occupational employment line is the same as the one in Figure F and Figure Gc. In the 22 An obvious implication of the divergence between the occupational wage distribution and the overall wage distribution is that an important part of the changes in the overall wage distribution are taking place within occupations, not between them.
23Again, this suggests that much of what is happening to wages is happening within not between occupations.
32
bottom occupational quintile, occupational employment and occupational wages move in opposite directions, with occupational employment growth declining through the bottom quintile, while occupational wage growth increased through the bottom quintile. As noted in earlier sections, the expansion of employment among low-wage occupations was the greater in the 2000s than in prior decades but this does not appear to have translated into faster wage growth at the bottom. Occupational wages grew at essentially the same rate over the rest of the distribution. The overall wage distribution increased monotonically, with somewhat larger increases in the top quintile, inconsistent with the occupational wage patterns. As with the prior two plots, we find here that occupational employment changes, occupational wage changes, and changes in the overall wage distribution do not generally follow similar trends. The tasks framework attempts to move from changes in production technologies to changes in occupational employment to changes in the overall wage distribution without pausing to examine the intervening changes in occupational wages. The initial, and still most common, empirical implementation of this framework operationalizes tasks as (roughly three-digit) occupations and then groups these tasks into ‘skill’ percentiles based on the mean occupational wage. A review of the published evidence and our own analysis of the CPS data, however, demonstrate that the relationship between tasks and employment change is fragile (as suggested by the poor fit between employment changes and occupational skill levels), inconsistent over time, and does not appear to hold at all in the 2000s. More importantly, occupational employment changes are not tightly linked to changes in the wage structure and the channel through which occupational employment shifts affect the wage structure—changes in the occupational wage structure—doesn’t match up. Occupational employment changes are poor predictors of occupational wage changes and occupational wage changes are poor predictors of changes in overall wages. Role of Occupations in Explaining Wage Variation In the tasks framework, differences in changes in demand for different tasks are posited to be driving relative wage trends. Empirically, detailed occupations are used as a proxy for tasks. We have shown above that changes in the relative wages across occupations (as ranked by their 1979 mean wage) depart from changes in the overall wage distribution in
33
critical ways. This casts doubt on whether occupational employment shifts are driving changes in the wage distribution since this would happen through changes in the wage distribution across occupations. Here, we look at the direct link between occupations and wages using a regression analysis. A key result in this section is that we do not find that occupations explain an increasing share of wage variation over time, contradicting the claim in Acemoglu and Autor (2011) that occupations are becoming more important in wage determination. Table 3 presents, by gender, R-squares from cross-sectional OLS regressions of log hourly wages on a set of either education dummies, major occupation dummies, or detailed occupation dummies, along with (in all cases) a quartic in age, and dummies for region of the country (using the four major Census regions), marital status, and race/ethnicity (using mutually exclusive categories of white nonhispanic, black nonhispanic, Hispanic any race, and other). In each case, we also calculate the partial R-squares of the set of control variables of interest – either the education dummies, major occupation dummies, or detailed occupation dummies – net of the remaining controls (i.e. net of the quartic in age and the dummies for region, marital status, and race/ethnicity)24. The partial R-squares are equivalent to the explanatory power of the respective variable group in the log hourly wage regressions. The partial R-squares are also plotted in Figure Ia-b25. Columns (4) and (10) of Table 3, along with Figure Ia-b, show how the importance of educational attainment in wage determination has evolved over time for men and women. Column (10) shows that for men, the increase in the share of wage variation explained by educational attainment slowed from the 1980s to the 1990s and slowed even further in the
24 In particular, the log hourly wage and each control variable of interest (the education dummies, major occupation dummies, or detailed occupation dummies) is separately regressed on the remaining controls (the quartic in age and the dummies for region, marital status, and race/ethnicity), and using the residuals from each of these regressions, residual log hourly wages are regressed separately on the residuals from the variable groups of interest. The partial R-squares are the R-squares from these regressions. 25 Though the specifications differ slightly, Figure Ia-b here is similar in spirit to Figure 17a-b in Acemoglu and Autor (2011). One key difference is that we calculate the partial R-squares using the 250+ detailed occupations. The Acemoglu/Autor figure shows rising partial R-squares of occupation dummies since 1989, while we do not.
34
2000s. In particular, between 1979 and 1989, the share of wage variation explained by education increased by 5.8 percentage points, whereas it increased by 4.6 percentage points between 1989 and 2000 and by just 0.2 percentage points between 2000 and 2007. Column (4) shows that for women, the increasing importance of education in wage determination also slowed and then reversed. The increase in the share of wage variation explained by education dropped from 7.5 percentage points between 1979 and 1989 to 3.6 percentage points between 1989 and 2000, and declined by 1.2 percentage points between 2000 and 2007. Columns (6) and (12) of Table 3, along with Figure Ia-b, show that the slowdown in importance of detailed (250+) occupations was more pronounced than the slowdown in the importance of education. Column (12) shows that for men, the increase in the share of wage variation explained by detailed occupations slowed dramatically from the 1980s to the 1990s and then declined in the 2000s. Between 1979 and 1989, the share of wage variation explained by detailed occupations increased by 6.3 percentage points, whereas it increased by just 0.5 percentage points between 1989 and 2000. Between 2000 and 2007, the share of wage variation explained by detailed occupations dropped by 0.8 percentage points. Column (6) shows that for women, the importance of occupations in wage determination dropped in both the 1990s and the 2000s; the share of wage variation explained by detailed occupations dropped by 2.8 percentage points between 1989 and 2000, and dropped 2.7 percentage points further between 2000 and 2007. In other words, contrary to claims in Acemoglu and Autor (2011), differences across occupations accounted for a smaller share of rising wage inequality in the 1990s and 2000s than they did in the 1980s26. These findings also run counter to Acemoglu and Autor’s (2011)
26 It should be noted in Figure Ia-b that there is a visible drop between 1993 and 1994 in the partial R-squared values associated with the occupation dummies. This drop coincides with major changes in the CPS survey, however it does not coincide with occupational coding breaks (as can be seen in Appendix Figure A.A). Interestingly, however, this drop only occurs in the partial R-squared values associated with the occupation dummies, not the education dummies. This merits further investigation. Further, there is a noticeable rise in the partial R-squared values associated with the detailed occupation dummies, particularly for women, between 1982 and 1983. This is unsurprising since, as noted in the appendix, there are 63 more occupation dummies in 1983 than there are in 1982. To test whether these breaks may affect the finding in Table 3 of a slowdown in the importance of occupations between the 1980s and the 1990s, we simply subtract off the changes associated with these two “break” years (1982/1983 and 1993/1994). We find the following: for men, the increase in the share of wage variation explained by detailed occupations drops from 5.6 percentage points between 1979 and 1989 to 3.0 percentage points between
35
contention that education was more important than occupations in the 1980s but the roles switched in the 1990s. Starting in the early 1990s, tasks (as operationalized by detailed occupations) have done a worse job than educational attainment of explaining changes in overall wage variation. One implication of the results in Figure Ia-b and Table 3 is that a small share of the total increase in wage variance between 1989 and 2007 can be explained by even detailed occupations. For men, the variance of wages was 0.327 in 1989 and 0.384 in 2007. The partial R-squared values imply that 0.088 of the wage variance was attributable to detailed occupations in 1989 and 0.102 in 2007. This means that only 24.6 percent of the increase in wage variance between 1989 and 2007 was attributable to detailed occupations. For women, the variance of wages grew from 0.273 in 1989 to 0.338 in 2007. Similar calculations imply that only 8.2 percent of that increase is attributable to detailed occupations. This underscores the limited capacity of occupational shifts to be considered as a key driver increasing wage inequality over this period.
V. Service and low-wage occupations
In the latest iteration of the polarization literature, Autor and Dorn (2012) focus on the role of service occupation employment, offering “an integrated explanation and empirical analysis of the polarization of U.S. employment and wages between 1980 and 2005, and the concurrent growth of low skill service occupations.” Autor and Dorn claim that the ‘rapid rise of employment and wages in service occupations’ (page 4) is tightly linked to the overall polarization of employment and wages from 1980 to 2005. Specifically, they conclude that:
1989 and 2000 (instead of dropping from 6.3 percentage points to 0.5 percentage points). For women, the increase in the share of wage variation explained by detailed occupations drops from 5.2 percentage points between 1979 and 1989 to 1.5 percentage points between 1989 and 2000 (instead of dropping from 7.5 percentage points to -2.8 percentage points). Thus, after removing the effect of these breaks, the slowdown in the importance of occupations between the 1980s and the 1990s is somewhat smaller, but it remains pronounced. Of course, the finding also remains that for both men and women the partial R-squared values associated with detailed occupations declines between 2000 and 2007.
36
“Between 1980 and 2005, the share of hours worked in service occupations among non-college workers rose by more than 50 percent. Simultaneously, real hourly wages of non-college workers in service occupations increased by 11 log points, considerably exceeding wage growth in other low skill occupations. This phenomenon is broadly important because it offers insight into the polarization of employment and earnings in the U.S. and, potentially, other industrialized countries. Indeed, a key fact documented by this paper is that rising employment and wages in service occupations account for a substantial share of aggregate polarization and growth of the lower tail of the U.S. employment and earnings distributions between 1980 and 2005.” And, their bottom line is:
“Our results suggest a critical role for changes in labor specialization, spurred by automation of routine task activities, as a driver of rising employment and wage polarization in the U.S. and potentially in other countries.”
The key claim then is that workplace technological change eroded middle-class routinized jobs and simultaneously increased demand for tasks done in service occupations and that this higher relative demand for service-occupation work boosted wage growth in these occupations. This increase in service-occupation employment and wages, in turn, boosted low-wage occupational employment and wages at the bottom, and largely explains wage and employment polarization at the bottom end. This new line of research suffers from many of the weaknesses of the earlier research. First, and most fundamentally, over the period Autor and Dorn study, there was no wage polarization between service occupations and the middle of the overall wage distribution. As shown in Table 7, between 1979 and 2007, the median hourly wage grew faster (7.8 percent in real terms) than wages in service occupations (3.9 percent) and faster than the tenth percentile wage in the overall wage distribution (down 0.9 percent).27 These wage trends make it difficult to use the pattern of growth in service occupations to explain a compression between the bottom and the middle of the overall wage distribution that did not occur. Second, all of the data and the regression analyses presented focus on decadal
27Mishel et al (2012,Table 4.4)
37
periods (1980s, 1990s and sometimes the 2000s) and the key analysis of the wage impact of employment changes is examined for changes over the entire 1979-2005 period, thus ignoring annual patterns and failing to examine the issue of the precise timing of trends.28 The timing is important because the increase in real wages of service occupations (primarily a late 1990s trend) preceded the expanded employment share of service occupations (primarily a 2000s trend). Third, by focusing on changes over the long period 1980-2005, the Autor and Dorn analysis papers over the earlier literature’s findings that wage and employment polarization did not occur in either the 1980s or the 2000s. That is, the discussion presumes that the research is explaining job polarization over the entire 1980-2005 period, a phenomenon that did not occur throughout that time period and was notably absent in the most recent period (2000-05 or 2000-07). Fourth, job polarization over the 1980-2005 is not well rooted in the data. When, following Autor and Dorn (their Figure 1), we estimate the smoothed changes in employment shares across occupations ranked by wages we find evidence of polarization but the Lowess R-squared for our fitted line is just .111.29 Using the smoothed or unsmoothed data for the entire period there is only a small absolute employment share expansion for low-wage occupations and only for those in the bottom decile—occupations in the second decile actually saw their employment share decline. Finally, although Autor and Dorn attempt to provide insights into the growth of wage inequality due to technological change, they never present any metric for assessing technology’s impact on wages nor compare any such estimates to changes in the overall growth of wage inequality. Therefore, it is not possible to assess the quantitative significance of the findings. The Autor and Dorn research on the role of service occupations shifts the focus of attention in three important ways. First, the focus is almost exclusively on the bottom of the occupational ladder, the low-wage service occupations. It therefore avoids the topic of
28 Though Autor and Dorn refer to the decennial Census data in terms of the year the data were collected (1980, 1990, or 2000) we refer to the data for the year the data capture (1979, 1989 and 1999) since those are the years we use in our CPS analysis. 29 This follows the same procedures as the estimates explained in an earlier section. We did not adjust the employment shares to account for the inconsistencies resulting from coding changes in 1983 and 2003 since we are seeking to replicate Autor and Dorn’s finding. Our analysis uses hours-weighted employment data from the CPS ORG data for 1979 and 2005, the same years as the 1980-2005 presented by Autor and Dorn.
38
why high wage occupations expanded relative to middle-wage occupations in the 1980s and 1990s but not in the 2000s. Second, the focus is no longer on explaining the change in the trend of the 50/10 wage gap between the 1980s (when it grew) and the 1990s (when it stabilized and fell). In fact, nothing in the paper helps explain these 50/10 wage gap trends even though doing so was the key motivator in earlier work (Autor, Katz and Kearney 2006 and 2008, and Acemoglu and Autor 2011, 2012). Last, research focuses on the share of non-college educated workers (specifically, those with a high school degree or less) in service occupations rather than on the share of all workers in service occupations. This appears to muddy the water in our view because, as shown below, the share of workers with a high school or less education working in service occupations has not been primarily driven by technological (and other) trends affecting the share of total employment in these occupations but by the educational upgrading that has depleted the share of workers with such education (from 58.4 percent in 1979 to just 38.9 percent in 2007). The service occupation intensity among workers with a ‘high school or less education’ is:
⎟⎟⎠
⎞⎜⎜⎝
⎛⎥⎦
⎤⎢⎣
⎡⎟⎟⎠
⎞⎜⎜⎝
⎛∗⎟⎟⎠
⎞⎜⎜⎝
⎛TT
HST
TT
TS
TS
HSS
HST
HSS
NN÷
NN
NN=
NN
where N stands for employment, subscripts refer to occupation and superscripts refers to the education category of the workforce: HS stands for those workers with a high school degree or less, T stands for the total, and S stands for service occupation. Thus, this ratio, on which Autor and Dorn focus, is determined by three distinguishable factors:
1. The share of ‘high school or less’ workers among all workers; 2. Service occupation employment’s share in total employment; and
3. The share of ‘high school or less’ workers among those working in service occupations.
Although Autor and Dorn treat the share of those with a ‘high school or less’ education in service occupations as being driven by technological change this clearly depends upon

39
the relative importance of these factors. The first factor reflects labor supply and has declined in recent decades because of the ‘educational upgrading’ of the workforce as more workers attend at least some college. The second factor, the share of employment in service occupations, is most clearly the result of technology.30 The third factor is ambiguous, potentially reflecting the decreased use of ‘less educated’ workers in the production process (a result of technology) but also possibly reflecting underemployment of those with more education who are forced to work in lower paying service occupations. We present a decomposition of the role of these three factors in driving changes in the share of those with a ‘high school or less’ education in service occupations below. Before doing so it is worth explore trends in the first two factors. We have earlier shown that the main technological driver in the Autor-Dorn framing, the service occupation share of employment, has remained low and relatively stable over the last three decades, with some expansion occurring in the 2000s. As such it would seem that technological change has played an inconsequential role in concentrating ‘high school or less’ in service employment. Table 4 gathers an array of measures of the service occupation employment to further assess trends in service occupations’ employment share. We draw on three source of information: our tabulations of the CPS ORG data; published tabulations of decennial Census and American community Survey data from Acemoglu and Autor (2011) and Autor and Dorn (2012); and published data from the BLS Occupational Employment Statistics (OES) program. Some of the data reflect shares of employment while other data reflect share of total work hours. Last, Autor and Dorn present trends for service occupation employment that excludes public safety employment (e.g., police and firefighters) and the table presents comparable results from the CPS. All of the CPS tabulations— service occupations’ employment and work hours shares and the hours share of service occupations excluding public safety occupations— show service occupations’ importance to have remained relatively low (12 to 14 percent) and
30 Of course, globalization and consumer preferences also matter here.
40
stable over the 1980s and 1990s with some expansion in the 1980s but stability in the 1990s. A faster growth in the 1980s than the 1990s is inconsistent with a story of expanded service occupation employment shifting the 50/10 wage gap pattern in the 1990s. In contrast, the decennial Census data indicate a modest expansion of service occupations in the 1980s and a somewhat larger expansion in the 1990s. There is a measurement problem, however, in the decennial Census comparisons for the 1990s since the coding change that occurs in the CPS data between 2002 and 2003 occurs in comparisons of the 1990s and 2000 decennial census data. The CPS annual data for 2002-03 indicate that this coding change, using Autor and Dorn’s occupational coding crosswalk, generates an artificial 1.0 percentage point increace, equivalent to the entire expansion of service occupations in the 1990s.31 If the effect of the coding changes between the Censuses in 1990 and 2000 is similar to the impact of the same change in the CPS between 2002 and 2003, then it is possible that the entire service occupations expansion in the 1990s shown by Census data reflects the coding change implemented between the two Censuses.32 Data from BLS employment projections (Albert and Auyer 2003) provide another estimate of the growth of service occupations in the 1990s, showing a growth of 0.5 percentage points from 1988 to 2000. Other employment projections provide reads on earlier periods, with expansion over 1983-94, 1986-96, and 1988-98 of, respectively, 0.7, 0.5 and 0.5 percentage points.33 In these various BLS series there appears to be little, if any, expansion of service occupation employment between
31The appendix presents this analysis.
32David Autor, in correspondence, has provided a more detailed breakdown of the 1.1 percentage point growth in service occupations in the Autor/Dorn data analysis: ‘food occupations’ (0.4 ppt.); health aides (0.4 ppt.); child care (0.3 ppt.); janitors (-0.2 ppt.) and recreation (0.2 ppt.). Our CPS analysis shows a 0.1 ppt. decline, a gap of 1.2 ppt. with the Autor and Dorn analysis. To gauge the correspondence of our CPS analysis and the impact of the coding change (judged by the 2002-03 impact) we computed the detailed change of the sum of the CPS change plus the coding impact and find: ‘food occupations’ (0.5 ppt.); health aides (0.4 ppt.); child care (0.1 ppt.); janitors (-0.3 ppt.) and recreation (0.3 ppt.) which sum to a 0.8 ppt. change. The relatively close correspondence by detailed service occupation sub-group indicates that the impact of the coding change represents most of the difference between the Autor and Dorn and our CPS computations of the growth of service occupations in the 1990s. 33See Silvestri(1995), Silvestri(1997) and Braddock(1999).
41
1994 and 2000 and the fastest expansion shown is from 1983 to 1994. All the data series available indicate that there was not any sizeable expansion of service occupation employment or hours, including or excluding public safety workers, in the 1980s and 1990s, and no evidence of any sizeable acceleration of service occupation growth in the 1990s. This relative stability of the share of service occupation employment goes back to 1959 and of service occupation hours share goes back to 1949. Given this stability, it is difficult to explain how any technologically-driven change in service occupations could have materially affected wage patterns and wage inequality in the 1980s or 1990s. By contrast, all of these same data series (including data from the establishment survey based OES) show a sizeable expansion in service occupations in the short period from 1999 to 2005. The last line in Table 4 presents Autor and Dorn’s tabulation of the service employment share among those with a ‘high school or less’ education, rising from 12.9 percent in 1979 to 19.8 percent in 2005. This is the only indicator to show a substantial expansion of service occupations. Given the relative stability of the more inclusive measures, it follows that the expansion highlighted in the table reflects the focus on a limited subset of the workforce. This previews our results below, which show that it is educational upgrading that is driving this trend, not a technologically-driven change in the importance of service occupations in the economy. Last, we would note that Autor and Dorn characterize the roughly seven percentage point expansion (12.9 to 19.8) over the twenty-six years from 1979 to 2005 as a ‘50 percent’ increase. That description, in our view, exaggerates the roughly 2.8 percentage points per decade expansion and is not the best description of these trends. In the literature, service occupations are frequently equated with ‘low-wage occupations’. However, service occupations comprise about half the employment in the bottom fifth of occupational employment ranked by wage level. Autor and Dorn (2012, footnote 7) report that service occupations share of employment in the bottom fifth rose from 47 to 55 percent between 1979 and 2005, suggesting this indicates their rising importance. In fact, these same data indicate that service occupations (in the bottom fifth) rose from 9.4 to 11.0 percent of total employment between 1979 and 2005, another indication
42
confirming the low and relatively stable role of low-wage service occupation employment—a rise of only 1.6 percentage points over twenty-six years. We use the CPS data to examine the Autor and Dorn claim that service occupations are responsible for the expansion of employment in low-wage occupations. The CPS data suggest the opposite conclusion, showing that low-wage occupational employment actually contracted both in the 1980s and the 1990s before expanding modestly in the 2000s: the modest expansion of service occupation employment was offset by a larger contraction among other low-wage occupations. Table 5 provides CPS tabulations of the breakdown of the hours-weighted employment shares of the lowest-wage occupations, separating service (excluding public safety occupations) and other occupations, in key years over the 1979-2007 period. This analysis uses the Autor-Dorn occupational coding crosswalk but adjusts for the coding breaks in 1983 and 2003. These ‘decile’ breakdowns are ‘lumpy’ –not being exact deciles —because the analysis relies on the actual cumulative shares of detailed occupations.34 The data in Table 5 are, in other terms, displaying growth in the unsmoothed occupational employment share for the bottom two deciles of occupations (defined by wage level); the numbers in Table 5 directly correspond to the growth in the smoothed occupation shares portrayed in the graphical analysis used by Autor and Dorn to examine job polarization trends.35 These data indicate that service occupations comprise the vast majority of the bottom decile of occupations and roughly half of the bottom fifth of occupational employment. Service occupation employment in each of the lowest two deciles was relatively stable in the 1980s and 1990s and expanded in the 2000s in the lowest decile but remained stable
34� There are eighteen occupations in the first decile with 1979 average wages of $4.04 or less and another twenty-six occupations in the second decile with 1979 average wages of greater than $4.04 but less than or equal to $4.84. The cutoffs for the first and second decile occupational employment groups in 2012 dollars are $11.91 and $14.27. These cutoffs are dramatically different than the first and second decile wage cutoffs for the overall wage distribution in 1979—$8.71 and $9.93, another indication of how different the occupational and actual wage structure are. 35The data in Table 5 show changes in employment shares while the ‘polarization graphs’ show log changes in employment shares.
43
in the second decile. The lowest wage occupations (as determined by 1979 wage levels) expanded modestly over the entire 1979-2007 period in the first decile (rising to 10.8 from 10.2 percent). In the second decile, however, the lowest-wage occupations shrank over the same period (from 10.9 to 9.3 percent). As a consequence, on net, among the lowest-paying fifth of occupations there was no employment expansion over the last three decades. A direct implication of this result is that there was no employment polarization at the bottom to speak of over this period. The service occupations at the low end did expand modestly (from 9.6 to 11.0 percent) but this was offset by employment shrinkage in other (meaning ‘non-service”) low-paying occupations. This analysis of CPS employment data, therefore, contradicts the Autor and Dorn claim that service occupation trends have generated employment polarization at the bottom end of the occupation wage scale since 1979. As noted earlier, Autor and Dorn focus much of their discussion on service occupation employment among a subset of the workforce, those with no more than a high school education. This metric is partially driven by the eroded share of the workforce in this education category, what we refer to as educational upgrading. Figure J displays the educational upgrading of the workforce over the 1973 to 2007 period, showing the share of employment represented by those with less than a high school degree, those with a high school degree (or GED) and those with some college but not a four-year college degree (including those with associate degrees). In contrast to the stability of the service occupations’ share of employment and hours, Figure J shows a rapidly declining share of those in each of these educational categories. Autor and Dorn do not explain their selection of ‘high school or less’ as their focus rather than those lacking a four-year college degree when analyzing ‘non-college’ employment. They label their category as ‘non-college’ which invites confusion because it excludes those who have no degree past a high school credential, the fifth of the workforce that has ‘some college’ but no further degree (including not having an associates degree). The ‘some college’ group’s wage levels and wage behavior mirror those of high school graduates much more than it does those with college degrees. We choose to label the Autor and Dorn category as ‘high school or less’ rather than ‘non-college’ to avoid any confusion about the category. The share of the non-college when defined as those lacking
44
a four-year college degree comprised 69 percent of all workers in 2007 (down from 85.4 percent in 1973), a large share of the workforce. In contrast, the share of workers that have ‘high school or less’ educations in 2007 was just 39.4 percent (down from 66.9 percent in 1973). Table 6 presents a formal decomposition of the changes in the share of ‘high school or less’ workers employed in service occupations. This is done by using the equation shown above, taking logs in each relevant year and differencing across time periods. Our focus is on the role of the increased share of employment in service occupations since that is the factor clearly identifiable as being driven by technological change. The decomposition shows that only about thirty percent (29.8) of the growth of the service occupation employment intensity among workers with a ‘high school or less education’ from 1979 to 1999 was due to a growth of service occupation employment in the economy. In contrast, the growing importance of service occupation employment among ‘high school or less’ workers in the 1980s and 1990s was heavily driven by educational upgrading. This group comprised 58.4 percent of all workers in 1979 but just 42.4 percent twenty years later. Consequently, movement in the share of ‘high school or less’ workers employed in service occupations, at least over the 1980s and 1990s, hardly seem to reflect technological developments regarding routinization of middle wage occupations or the expansion of low-wage service occupation employment. The 2000s, on the other hand, is the only period when service occupation employment’s expansion drove its importance among ‘high school or less’ workers. What role has service occupation employment played in wage patterns? We have already seen that service occupations did not expand at a notably different pace in the 1990s than in the 1980s (in the CPS there was no expansion). Even among workers with a ‘high school or less’ education there was not a greater expansion of service employment in the 1990s relative to the 1980s.36 In our view, the similar expansion of service occupation employment in both the 1980s and 1990s should have produced similar wage trends for workers at the bottom of the wage distribution in the two decades. That the same employment patterns were associated with workers at the bottom of the wage distribution 36 This is true in the Census data presented by Autor and Dorn and the CPS data show a much smaller expansion in the 1990s than in the 1980s.
45
losing relative to the middle of the 1980s, but gaining relative to the middle in the 1990s suggests that forces other than occupational employment patterns are the main drivers of shifting wage inequality. What of the Autor and Dorn claim that “real hourly wages of non-college workers in service occupations increased by 11 log points, considerably exceeding wage growth in other low skill occupations. This phenomenon is broadly important because it offers insight into the polarization of employment and earnings in the U.S.”? First, the wage polarization between 1979 and 2005 evident in their Figure 1 shows wage growth for each of the percentiles in the bottom third of occupations greater than that of each percentile in the middle third of occupations, something that probably cannot be explained by service occupation employment which comprised less than 13 percent of employment in 2005. Second, Autor and Dorn’s empirical analysis examines differences between 1979 and 2005 across local labor markets in order to identify the role of service occupation employment on wages. Their key finding is that “A 7 percentage point higher routine share in 1980, equal to the gap between the 80th and 20th percentile commuting zones, predicts approximately 3 log points greater wage growth in service occupations between 1980 and 2005.” So, the technological process on which Autor and Dorn focus yields at most a modest change --3 log points-- in wages over twenty-six years, which does not get us that far in explaining wage polarization. Last, and most importantly, an examination of the timing of trends within the 1979-2005 period indicates that rising service occupation employment occurred after the notable real wage growth. The key data are presented in Table 7 and in Figure K for the 1979-2007 period.37 The median hourly wage grew faster than wages in service occupations between 1979 and 2007, 7.8 versus 3.9 percent, indicating that there was not any polarization between the middle and bottom wages over the period of interest to Autor and Dorn. The premise of that research is incorrect since there isn’t any wage polarization over the longer 1979-2007 period to explain. Most damaging to this framework, however, is that wage growth in service occupations only occurred in the late 1990s (up 15.2 percent), a period when service occupation employment did not expand relative to other occupations.
37Extending the analysis to 2007 from 2005 does not change any conclusions.
46
Moreover, the during the period from 2000 to 2007, when service occupation employment did expand, real wages for service occupations fell 6.2 percent This pattern of stable employment shares with rising wages followed by rising employment shares with falling wages runs completely counter to the idea that the demand for service occupation work has been lifting wages at the bottom of the wage distribution relative to the middle and that such a dynamic provides insight into the evolution of overall wage inequality. Put in other terms, service occupation wages rose relative to the median wage in the late 1990s (see the column on the ratio) when service occupation employment wasn’t expanding and fell relative to the median wage over 2000-07 when service occupation was expanded in seven years more than it had over the preceding twenty one years. The timing just does not work for the service occupation variation of the tasks framework analysis. (See Figure K, which shows the annual data.) The trend in service occupation wages is certainly disappointing, rising only 3.9 percent over twenty eight years. Productivity in the economy as a whole rose 59 percent over that same period, so service occupation workers clearly have not gained correspondingly. Note also that Table 7 demonstrated that workers in service occupations had substantially more education in 2007 than in 1979 (the share with more than a high school education grew from 30 to 43 percent from 1979 to 2007). It seems at least as plausible to attribute the wage gains for service occupations in the second half of the 1990s to persistently low unemployment and 20 percent boost in the minimum wage enacted in 1996 and 1997.
VI. Conclusion As Acemoglu and Autor (2011, 2012) and others before them have argued, the canonical model of SBTC fails to explain important developments in the US wage distribution. The most notable of these gaps are the inability to explain: the reversal of the 50-10 differential after 1986-87; the deceleration in the college premium after the mid-1990s; and the decline over long periods in the real wage for important segments of the wage distribution. The tasks framework that Acemoglu and Autor develop to replace the canonical model is a distinct improvement over the canonical model, not simply because

47
it can account for these three key developments, but also because it provides a richer description of the labor market and the production process. The tasks framework, however, suffers from its own empirical failings. Central among these are: the relatively smooth, long-standing nature of job polarization, which appears poorly suited to explaining the abrupt rise in inequality at the end of the 1970s or, more importantly, the sharp change in the path of the 50-10 differential after 1986-87; the failure of the most conventional measure of job polarization (plots of occupational employment change against occupational wage level) to show any signs of occupational employment polarization in the 2000s, even as wage inequality continued to grow; and, the consistent lack of correspondence across the 1980s, 1990s, and 2000s between changes in occupational employment, occupational wages, and the overall wage distribution. Recent research that has focused on the role of typically low-wage service occupations has not rescued the tasks framework from these shortcomings. Over the last three decades, service occupations comprised only about one-tenth of the workforce and increased their total employment share by less than two percentage points. A group of occupations that is small to begin with and that grows only slightly over the course of three decades seems unlikely to be a major driver of the overall wage distribution, and almost by definition can tell us nothing about developments at the middle and the top of the occupational or overall wage distributions. More importantly, the timing of employment and wage changes in this sector is the exact opposite of what is suggested by the tasks framework. Service occupation wages grew first (in the boom of the late 1990s), while employment in the sector was basically flat; when service occupation employment finally grew (after the boom went bust), wages in the sector actually fell. The tasks framework offers a theoretical model that can, in principle, account for wage and employment trends that the canonical model cannot. In practice, however, the tasks framework suffers from its own empirical failings. Technology may be a factor in widening wage inequality, but, if so, the tasks framework is not the model that captures those dynamics.
48
Data Appendix Unless otherwise noted, data used throughout this analysis are from the Outgoing Rotation Groups of the Current Population Survey (CPS-ORG). Our sample includes all public or private sector (unincorporated self-employed excluded) wage and salary workers who are age 18-64 and have valid wage and hour data. A detailed description of our treatment of the data, including calculation of hourly wages and treatment of top-coded earnings, is available in Appendix B of Mishel, et al, 2012 (http://stateofworkingamerica.org/files/book/Appendices.pdf). Throughout this paper, unless otherwise noted, data are weighted by hours, in particular using CPS person weights multiplied by usual hours worked. To obtain a consistent series across several occupation coding changes in the CPS over the 1973-2007 period, we employ the same occupation crosswalk as was used to create Figure 12 in Acemoglu and Autor (2011) (which is also Figure 3 in Autor, 2010). In particular, we use the programs generously available for download on David Autor’s MIT website under Acemoglu and Autor (2010), May/ORG Wage Prep, http://economics.mit.edu/~dautor/hole-vol4/morg/morg-wage-prep.zip. We document that we are able to implement this occupation crosswalk successfully by replicating the underlying occupation employment shares over time used to make Figure 12 in Acemoglu and Autor (2011), the programs and data for which are also available for download under Acemoglu and Autor (2011), Figure 12 – Percent Change in Employment by Occupation, 1979-2009, http://economics.mit.edu/~dautor/hole-vol4/figs/fig-12-rev.zip. Figure A.A shows these occupation employment shares over time. There are ten major occupations and this graph shows trends for each of these ten occupations from both our tabulations (in light grey) and Acemoglu and Autor’s tabulations (in dashed dark blue). The fact that only ten lines are observable means that the lines based on our tabulations exactly duplicate their tabulations. It should be noted that in order to replicate the Acemoglu and Autor employment shares, the sample we used is slightly different that the sample we use for the rest of this paper. In particular, it includes workers age 16 and 17, includes all non-agriculture, non-military workers who report having worked and report
49
an occupation, not just those with valid wage and hour data, and the data are person-weighted instead of hours-weighted. One finding from looking at the year-by-year data is that there are discontinuities in 1983 and 2003, when major occupation coding changes are implemented. That is, despite ‘consistent’ occupation coding schemes used by Acemoglu and Autor (2011) and Autor and Dorn (2012) there inconsistencies remain. These do not surface in the job polarization literature because all of the analysis covers changes across multiple years and no data are presented on an annual basis. We now turn to assessing the quantitative impact of the discontinuities in the occupation employment data due to coding changes. In Table A.1 we compare the changes in employment shares for each of the ten major occupation groups using both our CPS data with the occupation crosswalk described above, and an ‘adjusted series’ (which substitutes the average of the trends in 1980-1982 and 1983-1985 for the 1982-1983 change and the average of the trends in 2000-02 and 2003-05 for the 2002-03 change). Table A.2 compares the changes in the unadjusted and adjusted series for 1982-83 and 2002-03 and presents the changes in the adjusted series over the business cycle, 1979-89 or 2000-07. We consider the difference between the two series a measure of the error introduced by the coding changes. The last column measures the scale of that error relative to the longer period trend—the periods for which occupation employment trends are presented in the literature. It turns out that the distortions due to the coding changes are large relative to the trends presented in the literature. Most prominent is that the increase in the employment share for low-wage service occupations between 2000 and 2007 in the unadjusted series was 2.3 percentage points, substantially higher than the 1.3 percentage point growth in the adjusted series. This implies that the coding change was responsible for 42 percent of the observed expansion of low wage service occupations in the consistently coded analyses employed in the job polarization literature. Also, the unadjusted data series seriously understates the erosion of middle wage occupational employment in the 1980s, showing only half that of the adjusted series. Correspondingly, the unadjusted understates the expansion of high wage occupations in the 1980s. (It should be noted that the employment shares in these tables are calculated from the subsample described in the first paragraph of this data appendix and used throughout this paper, not the somewhat expanded subsample used in Figure A.A that matches the data used in Acemoglu and Autor (2011), Figure 12.)
50
Table A.3 explores the effect of the coding change using both person-weighted employment shares and hours-weighted employment shares. The adjusted 2002-2003 series for the two types of weights are essentially the same; we find no difference between the two types of weights in the middle occupations, and a 0.1% change between low and high occupation shares. The differences in the adjusted 1982-1983 series for the two types of weights are slightly larger; we find a 0.1% difference between the two types of weights in the middle occupations, and a 0.4% change between low and high occupation shares. An important issue with the 1982/1983 coding break is that there are many occupations in 1983 and later that do not exist in the earlier data. In particular, of the 318 occupations that have workers in them with valid CPS wage data in 1983, 63 do not exist in 1982. They are relatively small occupations on average, but altogether 9.1 percent of workers in 1983 are in occupations that do not exist in the 1982 coding. This is a concern because in Acemoglu and Autor (2010), occupations are ranked prior to this coding break, and any occupations that don’t exist in the year occupations are ranked are, for obvious reasons, dropped from the analysis. This means that a nontrivial chunk of the post-1982 data are dropped. Table A.4 shows the distribution across the major occupations of employment in 1983 by whether or not the worker is classified into an occupation that exists in 1982. Workers that are in occupations that do not exist in prior to 1983 are necessarily dropped from any analyses in which occupations are ranked prior to 1983. Dropping these occupations meaningfully increases the share of personal care and personal service workers, operators, fabricators, and laborers, and professionals, and meaningfully decreases the share of workers in sales, management, and production, craft and repair. Finally, Table A.5 provides our complete annual data of our aggregate occupations shares, with the adjustments made for the 1982/1983 and 2002/2003 coding breaks, between the years 1973 and 2010 for all workers and by gender. Means vs. Medians: In most of the job polarization research, occupations are ranked by their mean wage in 1979. However, since the idea of the ranking is to capture wages paid for the typical set of tasks associated with each occupation, arguably one would want to rank occupations by their median wage to ensure that the occupational rankings are not distorted by atypical wages within occupations. In any event, ideally the results would be

51
robust to ranking by either means or medians. We find that the broad contours of Figure F – which, consistent to what is typically done in this literature, is generated with occupations ranked using means -- are indeed quite similar when ranking occupations by either their means or medians.
52
Bibliography Acemoglu, Daron. 2010. “Yes the labour force hasn’t responded to shifting demand for skills.” A response to, “Is America facing an increase in structural unemployment?” The Economist: Economics, by invitation. July 25, 2010.
Acemoglu, Daren and David Autor. 2012. What Does Human Capital Do? A Review of Goldin and Katz’s The Race between Education and Technology. National Bureau of Economic Research, Working Paper No. 17820.
Acemoglu, Daron and David Autor. 2011 “Skill, Tasks and Technologies: Implications for Employment Earnings.” In: Ashenfelter, O., Card, D. (Eds.), The Handbook of Labor Economics, vol. 4b, Elsevier, Amsterdam, 1043-1171.
Alpert, Andrew and Jill Auyer. 2003. "Evaluating the BLS 1988–2000 employment projections." Monthly Labor Review, 126(10),13-37.
Autor, David. 2010. “The Polarization of Job Opportunities in the U.S. Labor Market, Implications for Employment and Earnings”. Center for American Progress and Brookings Institution: The Hamilton Project.
Autor, David and David Dorn, 2012. “The Growth of Low-Skill Service Jobs and the Polarization of the U.S. Labor Market.” American Economic Review. Forthcoming.
Autor, David H. and David Dorn. 2010. Inequality and specialization: the growth of low-skilled service employment in the United States. MIT Working Paper, April. Autor, David H. and David Dorn. 2009. “This Job is Getting Old: Measuring Changes in Job Opportunities using Occupational Age Structure.” American Economic Review: Papers and Proceedings 99(2), 45-51 Autor, David H., Levy, Frank and Richard J. Murnane. 2002. “Upstairs Downstairs: Computers and Skills on Two Floors of a Large Bank.” Industrial and Labor Relations Review 55 (3), 432–447. Autor, David H., Levy, Frank, and Richard J. Murnane. 2003. “The skill content of recent technological change: an empirical exploration.” Quarterly Journal of Economics 116 (4), 1279-1333. Autor, David, Alan Manning, and Christopher Smith. 2010. “The Contribution of the Minimum Wage to U.S. Wage Inequality over Three Decades: A Reassessment.” NBER Working Paper No. 16533, November. Autor, David, David Dorn and Gordon H. Hanson. 2013.“The China Syndrome: Local Labor Market Impacts of Import Competition in the United States.” American Economic Review, forthcoming
53
Autor, David, Lawrence F. Katz, and Melissa Kearney. 2008. “Trends in US Wage Inequality: Re-Assessing the Revisionists.” Review of Economics and Statistics 90(2), 300-323.
Autor, David. Lawrence F. Katz, and Melissa S. Kearney. 2006. “The polarization of the U.S. labor market.” NBER Working Paper 11986, January.
Baker, Dean. 2007. The United States since 1980. Cambridge University Press, New York.
Bakija, Jon, Adam Cole and Bradley T. Heim. 2012. “Jobs and Income Growth of Top Earners and the Causes of Changing Income Inequality: Evidence from U.S. Tax Return Data.” Working paper: http://web.williams.edu/Economics/wp/BakijaColeHeimJobsIncomeGrowthTopEarners.pdf
Berman, Eli, Bound, John and Stephen Machin. 1998 “Implications of Skill Biased Technological Change: International Evidence.” Quarterly Journal of Economics. 113(4), 1245-1279.
Berman, Eli, Bound, John and Zvi Griliches. 1994. "Changes in the Demand for Skilled Labor within U.S. Manufacturing: Evidence from the Annual Survey of Manufactures." The Quarterly Journal of Economics, 109(2), 367-397.
Bivens, Josh. 2008. Everybody Wins, Except for most of us: What Economics Teaches about Globalization. Washington, D.C.: Economic Policy Institute.
Bivens, Josh. 2011. Failure By Design: A Story behind America’s Broken Economy. Economic Policy Institute book. Cornell University Press. Ithica.
Blinder, Alan S and Alan B. Krueger. 2009. “Alternative Measures of Offshorability: A Survey Approach.” NBER Working Paper No. 15287, August.
Borjas, Goerge J. Richard B. Freeman and Lawrence F. Katz. 1992. “On the Labor Market Effects of Immigration and Trade”. Immigration and the Workforce: Economic Consequences for the United States and Source Areas. University of Chicago Press, Chicago, 213-244.
Braddock, Douglas. 1999. “Occupational employment projections to 2008,” Monthly Labor Review: Employment outlook: 1998-2008. Office of Employment Projections, Bureau of Labor Statistics.
Card, David and John DiNardo. 2002. “Skill Biased Technological Change and Rising Wage Inequality: Some Problems and Puzzles.” Journal of Labor Economics 20(4), 733-783.
54
Card, David and John DiNardo. 2006. The Impact of Technological Change on Low Wage Workers: A Review. Working and Poor: How Economic and Policy Changes are Affecting Low-wage workers. Russell Sage Foundation, New York, 113-140.
DiNardo, John and Jorn-Steffen Pischke. 1997. The Returns to Computer Use Revisited: Have Pencils Changed the Wage Structure too? The Quarterly Journal of Economics. 112(1), 291-303. DiNardo, John, Nicole M Fortin and Thomas Lemieux. 1996. “Labor Market Institutions and the Distribution of Wages, 1973-1992: A Semiparametric Approach.” Econometrica. 64(5), 1001-1044. Firpo, Sergio, Nicole M. Fortin and Thomas Lemieux. 2011. “Occupational Tasks and Changes in the Wage Structure.” IZA Discussion Paper No. 5542. Foote, Christopher L. and Richard W. Ryan. 2012. “Labor-Market Polarization Over the Business Cycle.” Federal Reserve Bank of Boston. Public Policy Discussion Papers No. 12-8. Fortin, Nicole M. and Thomas Lemieux. 1997. “Institutional Changes and Rising Wage Inequality: Is there a Linkage?” The Journal of Economic Perspectives. 11(2), 75-96. Freeman, Richard B. 1992. How Much Has De-unionization Contributed to the Rise in Male Earnings Inequality? Uneven Tides. Danziger, Sheldon and Peter Gottschalk (eds.) Sage Press, New York.
Goldin, Claudia and Lawrence F. Katz. 2009. The Future of Inequality: The Other Reason Education Matters So Much. The Milken Institute. Washington D.C. Goldin, Claudia and Lawrence Katz. 2010. The Race between Education and technology. Belknap Press of Harvard University Press. Cambridge: Mass.
Handel, Michael. 2005. Worker Skills and Job Requirements: Is There a Mismatch? Economic Policy Institute. Washington, DC. Handel, Michael. 1999. “Computers and the Wage Structure.” Levy Institute Working Paper No. 285. Howell, David. 1994. “The collapse of low-skill male earnings in the 1980s: Skill mismatch or shifting wage norms?” Levy Institute Working Paper. No 105.
Howell, David. 2002. “Increasing Earnings Inequality and Unemployment in Developed Countries: Markets, Institutions, and the “Unified Theory.” Politics and Society. 30(2), 193-243.
Howell, David. 1999. “Theory Driven Facts and the Growth of Earnings Inequality.” Review of Radical Political Economics. 31(1), 54-86.
55
Howell, David R. and Susan S. Wieler. 1998. “Skill-biased demand shifts and wage collapse in the United States, A Critical Perspective.” Eastern Economic Journal. 24(3), 343-366.
Howell, David R. and Edward N. Wolff. 1991. “Skills Bargaining Power and Rising Interindustry Wage Inequality Since 1970.” Review of Radical Political Economics. 23(1 & 2), 30-37.
Jacoby, William. 2000. “Loess: A nonparametric, graphical tool for depicting relationships between variables.” Electoral Studies. 19(4), 577-613.
Juhn, Chinhui, Kevin M. Murphy, and Brooks Pierce. 1993. “Wage Inequality and the Rise in Returns to Skill.” Journal of Political Economy. 101(3), 410-442.
Kaplan, Greg. 2012. “Moving Back Home: Insurance against Labor Market Risk.” Journal of Political Economy. 120(3), 446-512.
Katz Lawrence F, and Alan B. Krueger. 1992. “The Effect of the Minimum Wage on the Fast Food Industry.” Industrial and Labor Relations Review. 46(1)6-21.
Katz, Lawrence F. and Kevin M. Murphy. 1992. “Changes in Relative Wages 1963-1987: Supply and Demand Factors.” Quarterly Journal of Economics 107(1), 35-78.
Katz, Lawrence F., and Alan B. Krueger. 1999. “The High Pressure U.S. Labor Market of the 1990s.” Brookings Papers on Economic Activity. 1999(1), 1-87.
Kopczuk, Wojciech, Emmanuel Saez, and Jae Song. 2010. “Earnings inequality and mobility in the United States: Evidence from Social Security Data since 1937.” Quarterly Journal of Economics. 125(1): 91–128.
Krugman, Paul. 1995. “Growing World Trade: Causes and Consequences.” Brookings Papers on Economic Activity, 26(1), 327-377.
Lee, David. 1999. “Wage Inequality in the United States during the 1980s: Rising Dispersio nor Falling Minimum Wage?” Quarterly Journal of Economics. 114(3), 977-1023. Lefter, Alexandru and Benjamin M. Sand. 2011. “Job Polarization in the U.S.: A Reassessment of the Evidence from the 1980s and 1990s.” University of St. Gallen Discussion Paper No. 2011-03. Lemieux, Thomas. 2006. “Post-Secondary Education and Increasing Wage Inequality,” American Economic Review. 96(2), 195-99. Levy, F and R.J. Murnan. 1994. “Skills, demography and the economy: Is there a mismatch?” Labor Markets, Employment Policy and Job Creation. ed. Lewis C. Solomon
56
and Alec R. Levenson. Milkin Institute Series in Economics and Education. Westview Press, Boulder, 361-376. Levy, Frank and Peter Temin. 2007. “Inequality and Institutions in 20th Century America.” NBER Working Paper No. 13106, May.
Maarten Goos & Alan Manning, 2007. "Lousy and Lovely Jobs: The Rising Polarization of Work in Britain," The Review of Economics and Statistics, MIT Press, 89(1), 118-133.
Meyer, Peter and Anasastiya Osborne. 2005. “Proposed Category System for 1960-2000 Census Occupations.” U.S. Bureau of Labor Statistics. Working Paper No. 383
Mishel, Lawrence and Jared Bernstein. 1994. “Is the technology black box empty?: An empirical examination of the impact of technology on wage inequality and the employment structure.” Economic Policy Institute. Technical Paper.
Mishel, Lawrence and Jared Bernstein. 1998. “Technology and the wage structure: Has technology’s impact accelerated since the 1970’s?” Research in Labor Economics 17: 305-356.
Mishel, Lawrence and R.A. Teixeira. 1991. “The myth of the coming labor shortage: Jobs, skills and incomes of America’s workforce 2000.” Economic Policy Institute Mishel, Lawrence, Jared Bernstein and John Schmitt. 1997. The State of Working America 1996-1997. Economic Policy Institute. M.E. Sharpe. Pp. 160-167, 214-227. Mishel, Lawrence, Josh Bivens, Elise Gould and Heidi Shierholz. 2012. The State of Working America, 12th Edition. Economic Policy Institute. ILR Press: Cornell University: Ithica
Murphy, Kevin M. and Finis Welch. 1992. “The Structure of Wages.” The Quarterly Journal of Economics. 107(1), 285-326.
Schmitt, John. 2002. “Supply, demand, and the wages of recent college graduates in the 1990s.” http://www.noapparentmotive.org/papers/RCG_III.pdf Schmitt, John. 2009. “Inequality as Policy”. Center for Economic and Policy Research. Washington D.C
Silvestri, George. 1995. “Occupational employment to 2005.” Monthly Labor Review: Employment outlook: 1994-2005. Office of Employment Projections, Bureau of Labor Statistics.
Silvestri, George. 1997. “Occupational employment projections to 2006.” Monthly Labor Review: Employment outlook: 1996-2006. Office of Employment Projections, Bureau of Labor Statistics.

57
Spenner, Kenneth. I. “Technological Change, Skill Requirements and Educations: The Case for Uncertainty.” R.M. Cyert and D.C. Mowery, eds, The Impact of Technological Change on Employment and Economic Growth. Cambridge, MA: Ballinger Books, 1988.
Western, Bruce and Jake Rosenfeld. 2011. “Unions, Norms, and the Rise in the U.S. Wage Inequality,” American Sociological Review. 76(4), 513-537.
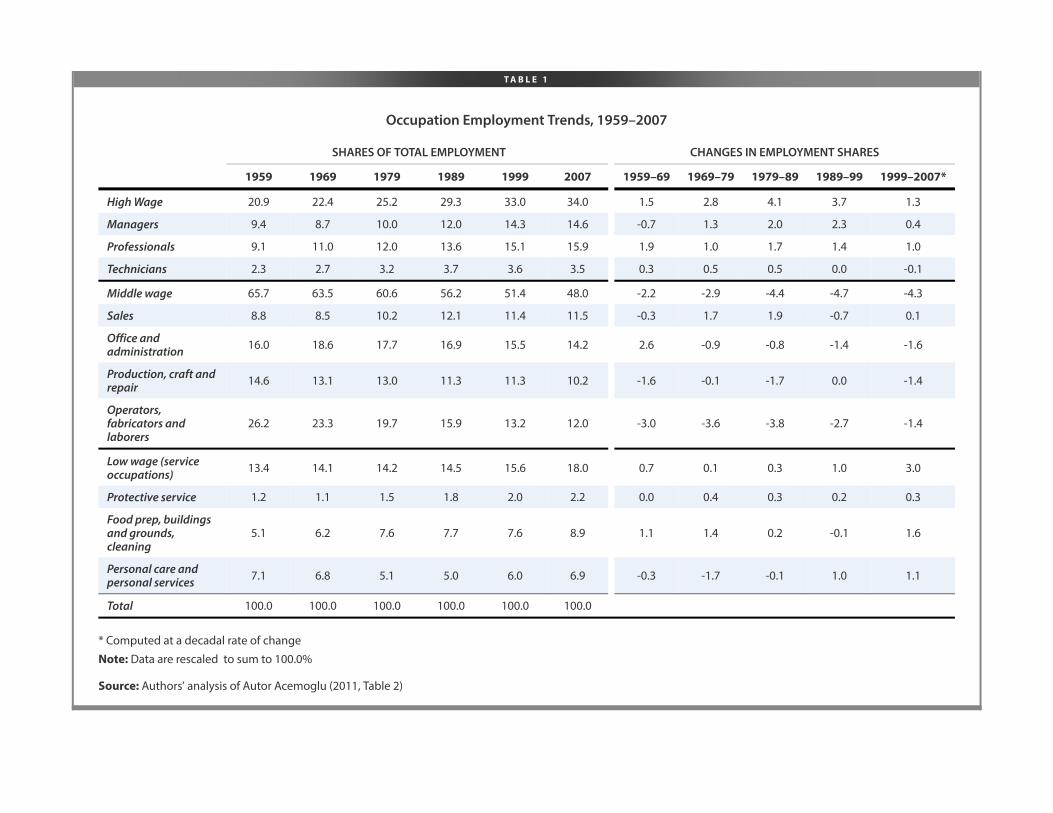
T A B L E 1
Occupation Employment Trends, 1959–2007
SHARES OF TOTAL EMPLOYMENT CHANGES IN EMPLOYMENT SHARES
1959 1969 1979 1989 1999 2007 1959–69 1969–79 1979–89 1989–99 1999–2007*
High Wage 20.9 22.4 25.2 29.3 33.0 34.0 1.5 2.8 4.1 3.7 1.3
Managers 9.4 8.7 10.0 12.0 14.3 14.6 -0.7 1.3 2.0 2.3 0.4
Professionals 9.1 11.0 12.0 13.6 15.1 15.9 1.9 1.0 1.7 1.4 1.0
Technicians 2.3 2.7 3.2 3.7 3.6 3.5 0.3 0.5 0.5 0.0 -0.1
Middle wage 65.7 63.5 60.6 56.2 51.4 48.0 -2.2 -2.9 -4.4 -4.7 -4.3
Sales 8.8 8.5 10.2 12.1 11.4 11.5 -0.3 1.7 1.9 -0.7 0.1
Office andadministration 16.0 18.6 17.7 16.9 15.5 14.2 2.6 -0.9 -0.8 -1.4 -1.6
Production, craft andrepair 14.6 13.1 13.0 11.3 11.3 10.2 -1.6 -0.1 -1.7 0.0 -1.4
Operators,fabricators andlaborers
26.2 23.3 19.7 15.9 13.2 12.0 -3.0 -3.6 -3.8 -2.7 -1.4
Low wage (serviceoccupations) 13.4 14.1 14.2 14.5 15.6 18.0 0.7 0.1 0.3 1.0 3.0
Protective service 1.2 1.1 1.5 1.8 2.0 2.2 0.0 0.4 0.3 0.2 0.3
Food prep, buildingsand grounds,cleaning
5.1 6.2 7.6 7.7 7.6 8.9 1.1 1.4 0.2 -0.1 1.6
Personal care andpersonal services 7.1 6.8 5.1 5.0 6.0 6.9 -0.3 -1.7 -0.1 1.0 1.1
Total 100.0 100.0 100.0 100.0 100.0 100.0
* Computed at a decadal rate of change
Note: Data are rescaled to sum to 100.0%
Source: Authors’ analysis of Autor Acemoglu (2011, Table 2)

T A B L E 2 A
Occupation shifts, occupation expansion and contraction and wage gaps, all workers, 1973–2007
ANNUALIZED
1973–79 1979–89 1989-00 2000–07
1989–95 1995–00 Total
Occupation shifts (percentage point change)
High 0.40 0.51 0.46 0.44 0.45 0.27
Middle -0.34 -0.58 -0.45 -0.45 -0.45 -0.46
Low: Service occupations -0.06 0.07 -0.01 0.01 0.00 0.19
Expansion/Contraction: Change in share over beginning share (annual)
High 0.016 0.019 0.014 0.012 0.014 0.007
Middle -0.005 -0.010 -0.008 -0.009 -0.008 -0.009
Low: Service occupations -0.005 0.006 -0.001 0.001 0.000 0.015
Annual log percent change in wage gap
90/50 0.34 0.72 0.84 0.19 0.54 0.57
50/10 -1.18 1.52 -0.60 -0.61 -0.61 0.01
Source: Authors’ analysis of Current Population Survey Outgoing Rotation Group microdata
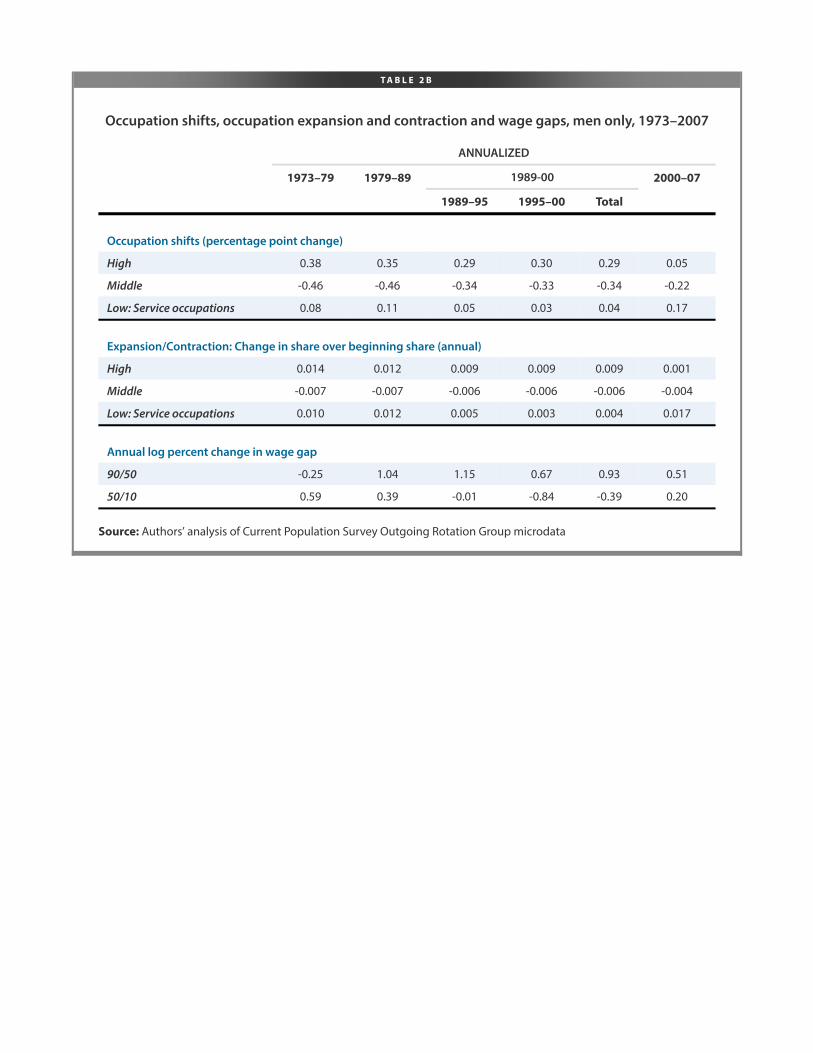
T A B L E 2 B
Occupation shifts, occupation expansion and contraction and wage gaps, men only, 1973–2007
ANNUALIZED
1973–79 1979–89 1989-00 2000–07
1989–95 1995–00 Total
Occupation shifts (percentage point change)
High 0.38 0.35 0.29 0.30 0.29 0.05
Middle -0.46 -0.46 -0.34 -0.33 -0.34 -0.22
Low: Service occupations 0.08 0.11 0.05 0.03 0.04 0.17
Expansion/Contraction: Change in share over beginning share (annual)
High 0.014 0.012 0.009 0.009 0.009 0.001
Middle -0.007 -0.007 -0.006 -0.006 -0.006 -0.004
Low: Service occupations 0.010 0.012 0.005 0.003 0.004 0.017
Annual log percent change in wage gap
90/50 -0.25 1.04 1.15 0.67 0.93 0.51
50/10 0.59 0.39 -0.01 -0.84 -0.39 0.20
Source: Authors’ analysis of Current Population Survey Outgoing Rotation Group microdata
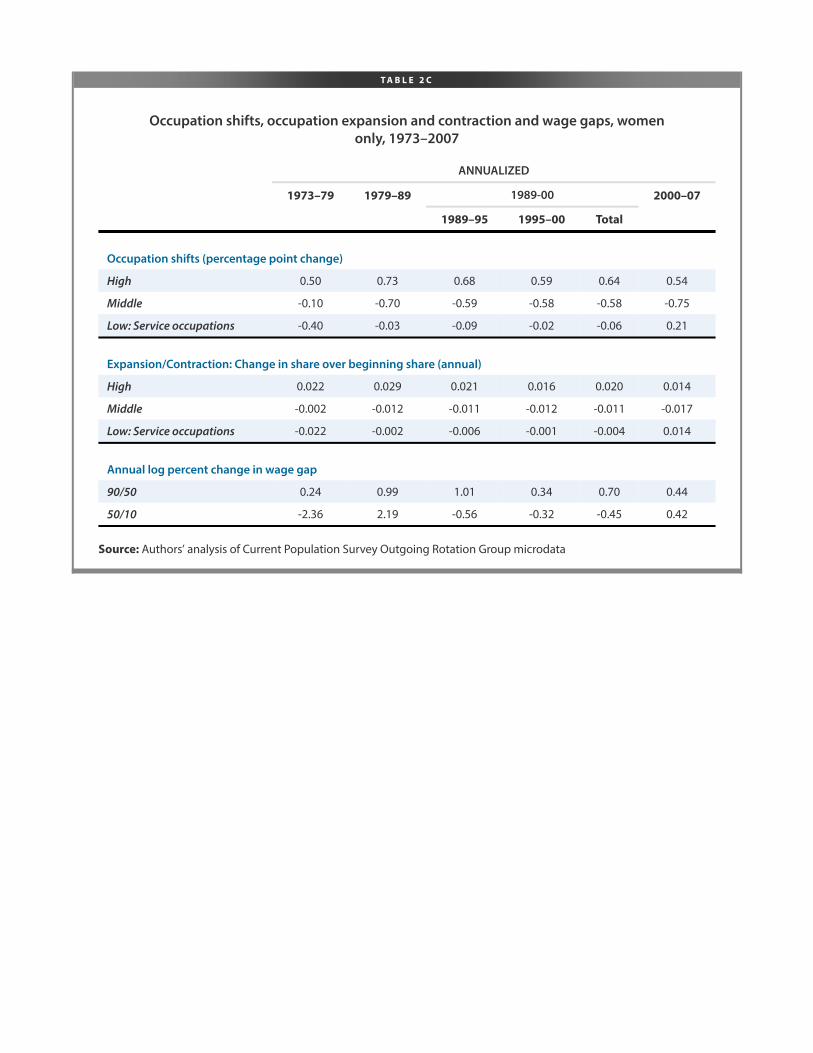
T A B L E 2 C
Occupation shifts, occupation expansion and contraction and wage gaps, womenonly, 1973–2007
ANNUALIZED
1973–79 1979–89 1989-00 2000–07
1989–95 1995–00 Total
Occupation shifts (percentage point change)
High 0.50 0.73 0.68 0.59 0.64 0.54
Middle -0.10 -0.70 -0.59 -0.58 -0.58 -0.75
Low: Service occupations -0.40 -0.03 -0.09 -0.02 -0.06 0.21
Expansion/Contraction: Change in share over beginning share (annual)
High 0.022 0.029 0.021 0.016 0.020 0.014
Middle -0.002 -0.012 -0.011 -0.012 -0.011 -0.017
Low: Service occupations -0.022 -0.002 -0.006 -0.001 -0.004 0.014
Annual log percent change in wage gap
90/50 0.24 0.99 1.01 0.34 0.70 0.44
50/10 -2.36 2.19 -0.56 -0.32 -0.45 0.42
Source: Authors’ analysis of Current Population Survey Outgoing Rotation Group microdata
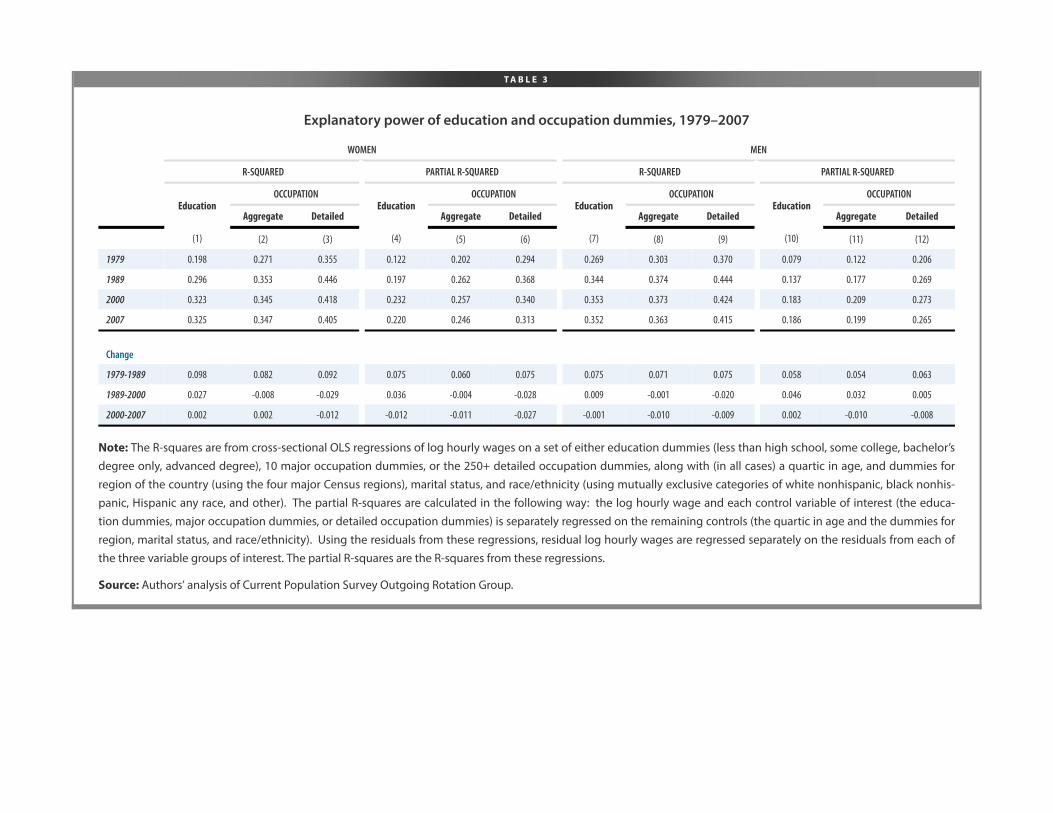
T A B L E 3
Explanatory power of education and occupation dummies, 1979–2007
WOMEN MEN
R-SQUARED PARTIAL R-SQUARED R-SQUARED PARTIAL R-SQUARED
OCCUPATION OCCUPATION OCCUPATION OCCUPATIONEducation
Aggregate DetailedEducation
Aggregate DetailedEducation
Aggregate DetailedEducation
Aggregate Detailed
(1) (2) (3) (4) (5) (6) (7) (8) (9) (10) (11) (12)
1979 0.198 0.271 0.355 0.122 0.202 0.294 0.269 0.303 0.370 0.079 0.122 0.206
1989 0.296 0.353 0.446 0.197 0.262 0.368 0.344 0.374 0.444 0.137 0.177 0.269
2000 0.323 0.345 0.418 0.232 0.257 0.340 0.353 0.373 0.424 0.183 0.209 0.273
2007 0.325 0.347 0.405 0.220 0.246 0.313 0.352 0.363 0.415 0.186 0.199 0.265
Change
1979-1989 0.098 0.082 0.092 0.075 0.060 0.075 0.075 0.071 0.075 0.058 0.054 0.063
1989-2000 0.027 -0.008 -0.029 0.036 -0.004 -0.028 0.009 -0.001 -0.020 0.046 0.032 0.005
2000-2007 0.002 0.002 -0.012 -0.012 -0.011 -0.027 -0.001 -0.010 -0.009 0.002 -0.010 -0.008
Note: The R-squares are from cross-sectional OLS regressions of log hourly wages on a set of either education dummies (less than high school, some college, bachelor’s
degree only, advanced degree), 10 major occupation dummies, or the 250+ detailed occupation dummies, along with (in all cases) a quartic in age, and dummies for
region of the country (using the four major Census regions), marital status, and race/ethnicity (using mutually exclusive categories of white nonhispanic, black nonhis-
panic, Hispanic any race, and other). The partial R-squares are calculated in the following way: the log hourly wage and each control variable of interest (the educa-
tion dummies, major occupation dummies, or detailed occupation dummies) is separately regressed on the remaining controls (the quartic in age and the dummies for
region, marital status, and race/ethnicity). Using the residuals from these regressions, residual log hourly wages are regressed separately on the residuals from each of
the three variable groups of interest. The partial R-squares are the R-squares from these regressions.
Source: Authors’ analysis of Current Population Survey Outgoing Rotation Group.
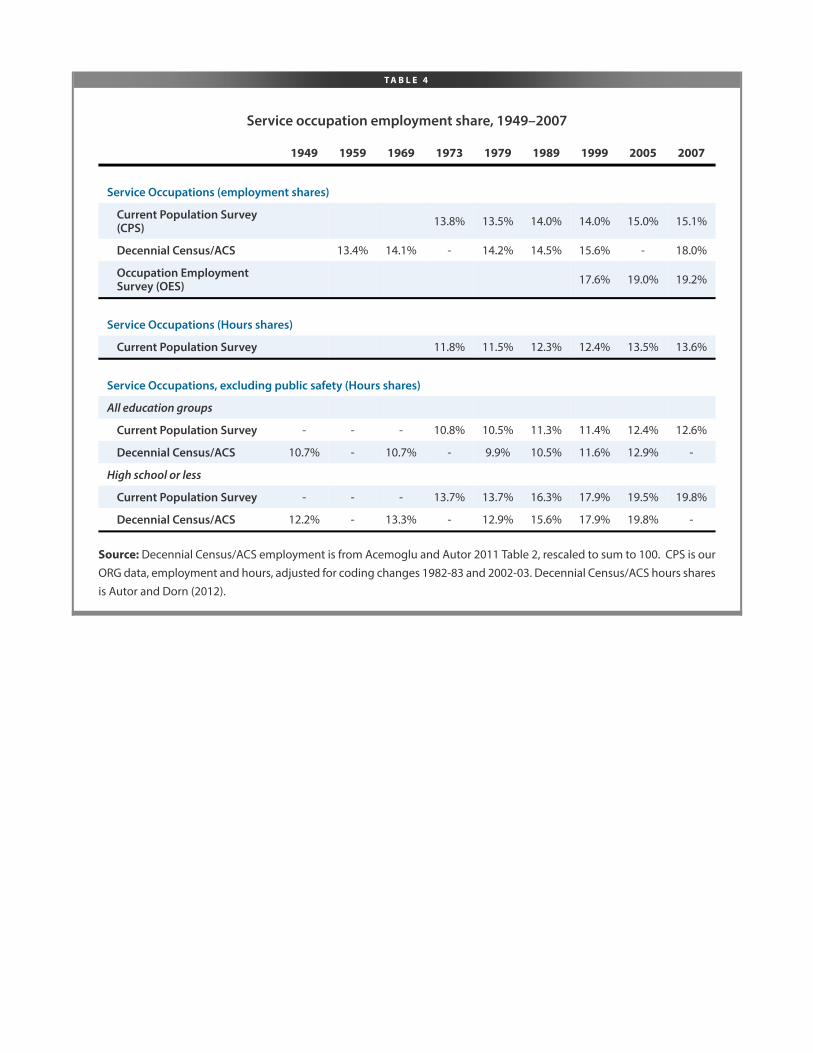
T A B L E 4
Service occupation employment share, 1949–2007
1949 1959 1969 1973 1979 1989 1999 2005 2007
Service Occupations (employment shares)
Current Population Survey(CPS) 13.8% 13.5% 14.0% 14.0% 15.0% 15.1%
Decennial Census/ACS 13.4% 14.1% - 14.2% 14.5% 15.6% - 18.0%
Occupation EmploymentSurvey (OES) 17.6% 19.0% 19.2%
Service Occupations (Hours shares)
Current Population Survey 11.8% 11.5% 12.3% 12.4% 13.5% 13.6%
Service Occupations, excluding public safety (Hours shares)
All education groups
Current Population Survey - - - 10.8% 10.5% 11.3% 11.4% 12.4% 12.6%
Decennial Census/ACS 10.7% - 10.7% - 9.9% 10.5% 11.6% 12.9% -
High school or less
Current Population Survey - - - 13.7% 13.7% 16.3% 17.9% 19.5% 19.8%
Decennial Census/ACS 12.2% - 13.3% - 12.9% 15.6% 17.9% 19.8% -
Source: Decennial Census/ACS employment is from Acemoglu and Autor 2011 Table 2, rescaled to sum to 100. CPS is our
ORG data, employment and hours, adjusted for coding changes 1982-83 and 2002-03. Decennial Census/ACS hours shares
is Autor and Dorn (2012).
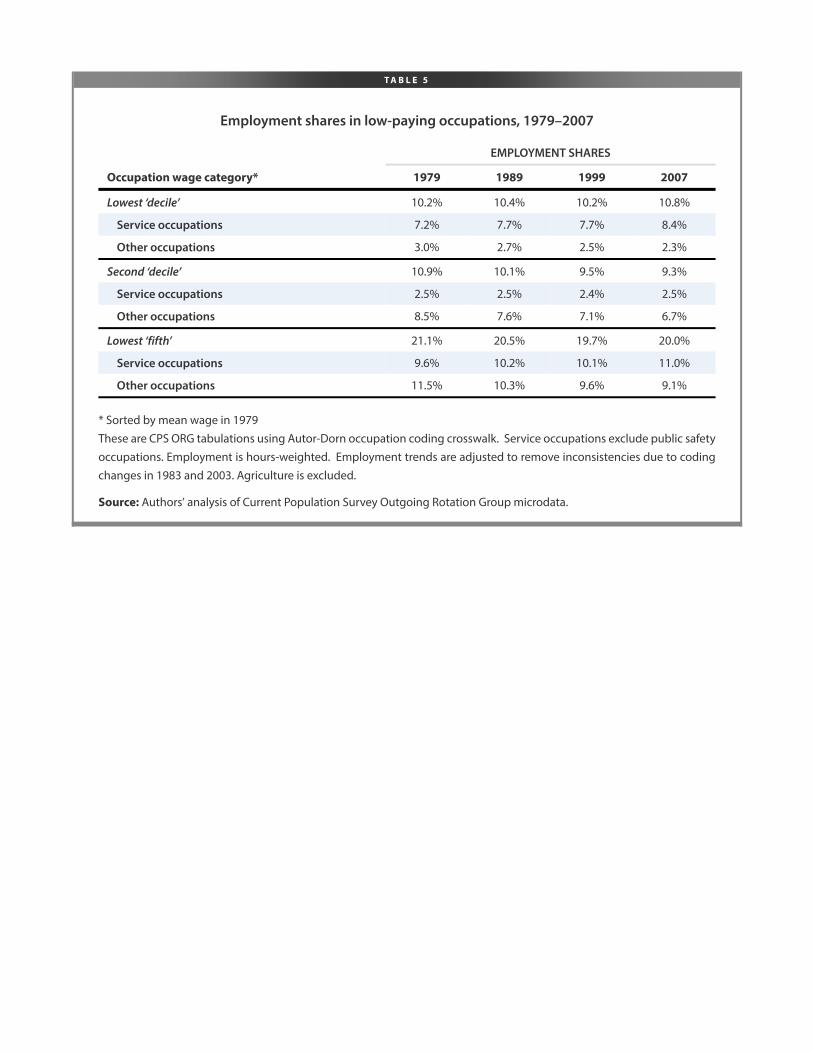
T A B L E 5
Employment shares in low-paying occupations, 1979–2007
EMPLOYMENT SHARES
Occupation wage category* 1979 1989 1999 2007
Lowest ‘decile’ 10.2% 10.4% 10.2% 10.8%
Service occupations 7.2% 7.7% 7.7% 8.4%
Other occupations 3.0% 2.7% 2.5% 2.3%
Second ‘decile’ 10.9% 10.1% 9.5% 9.3%
Service occupations 2.5% 2.5% 2.4% 2.5%
Other occupations 8.5% 7.6% 7.1% 6.7%
Lowest ‘fifth’ 21.1% 20.5% 19.7% 20.0%
Service occupations 9.6% 10.2% 10.1% 11.0%
Other occupations 11.5% 10.3% 9.6% 9.1%
* Sorted by mean wage in 1979
These are CPS ORG tabulations using Autor-Dorn occupation coding crosswalk. Service occupations exclude public safety
occupations. Employment is hours-weighted. Employment trends are adjusted to remove inconsistencies due to coding
changes in 1983 and 2003. Agriculture is excluded.
Source: Authors’ analysis of Current Population Survey Outgoing Rotation Group microdata.
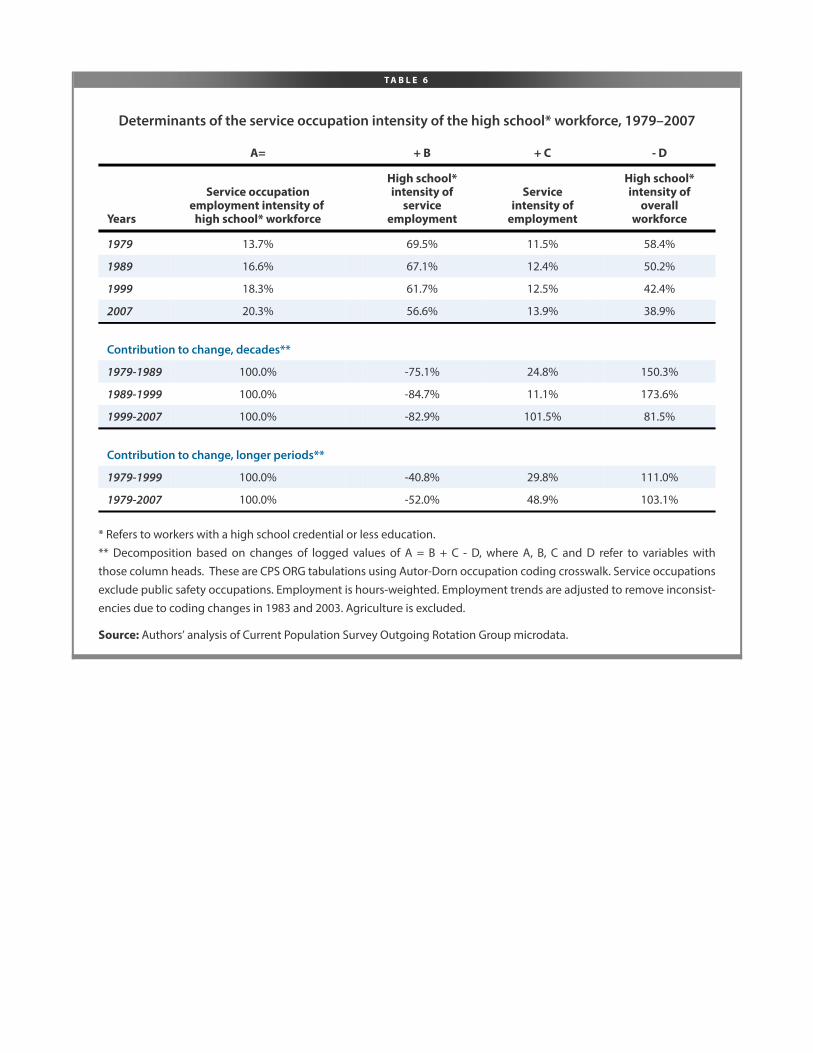
T A B L E 6
Determinants of the service occupation intensity of the high school* workforce, 1979–2007
A= + B + C - D
Years
Service occupationemployment intensity of
high school* workforce
High school*intensity of
serviceemployment
Serviceintensity of
employment
High school*intensity of
overallworkforce
1979 13.7% 69.5% 11.5% 58.4%
1989 16.6% 67.1% 12.4% 50.2%
1999 18.3% 61.7% 12.5% 42.4%
2007 20.3% 56.6% 13.9% 38.9%
Contribution to change, decades**
1979-1989 100.0% -75.1% 24.8% 150.3%
1989-1999 100.0% -84.7% 11.1% 173.6%
1999-2007 100.0% -82.9% 101.5% 81.5%
Contribution to change, longer periods**
1979-1999 100.0% -40.8% 29.8% 111.0%
1979-2007 100.0% -52.0% 48.9% 103.1%
* Refers to workers with a high school credential or less education.
** Decomposition based on changes of logged values of A = B + C - D, where A, B, C and D refer to variables with
those column heads. These are CPS ORG tabulations using Autor-Dorn occupation coding crosswalk. Service occupations
exclude public safety occupations. Employment is hours-weighted. Employment trends are adjusted to remove inconsist-
encies due to coding changes in 1983 and 2003. Agriculture is excluded.
Source: Authors’ analysis of Current Population Survey Outgoing Rotation Group microdata.
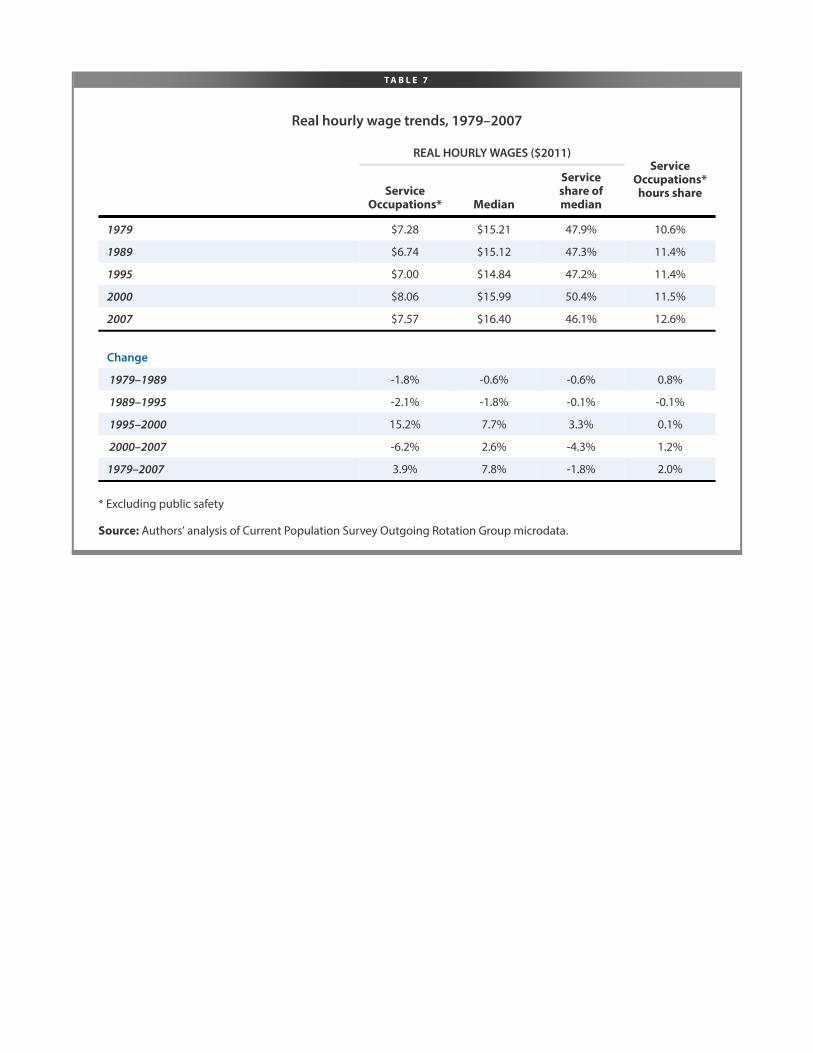
T A B L E 7
Real hourly wage trends, 1979–2007
REAL HOURLY WAGES ($2011)
ServiceOccupations* Median
Serviceshare ofmedian
ServiceOccupations*hours share
1979 $7.28 $15.21 47.9% 10.6%
1989 $6.74 $15.12 47.3% 11.4%
1995 $7.00 $14.84 47.2% 11.4%
2000 $8.06 $15.99 50.4% 11.5%
2007 $7.57 $16.40 46.1% 12.6%
Change
1979–1989 -1.8% -0.6% -0.6% 0.8%
1989–1995 -2.1% -1.8% -0.1% -0.1%
1995–2000 15.2% 7.7% 3.3% 0.1%
2000–2007 -6.2% 2.6% -4.3% 1.2%
1979–2007 3.9% 7.8% -1.8% 2.0%
* Excluding public safety
Source: Authors’ analysis of Current Population Survey Outgoing Rotation Group microdata.
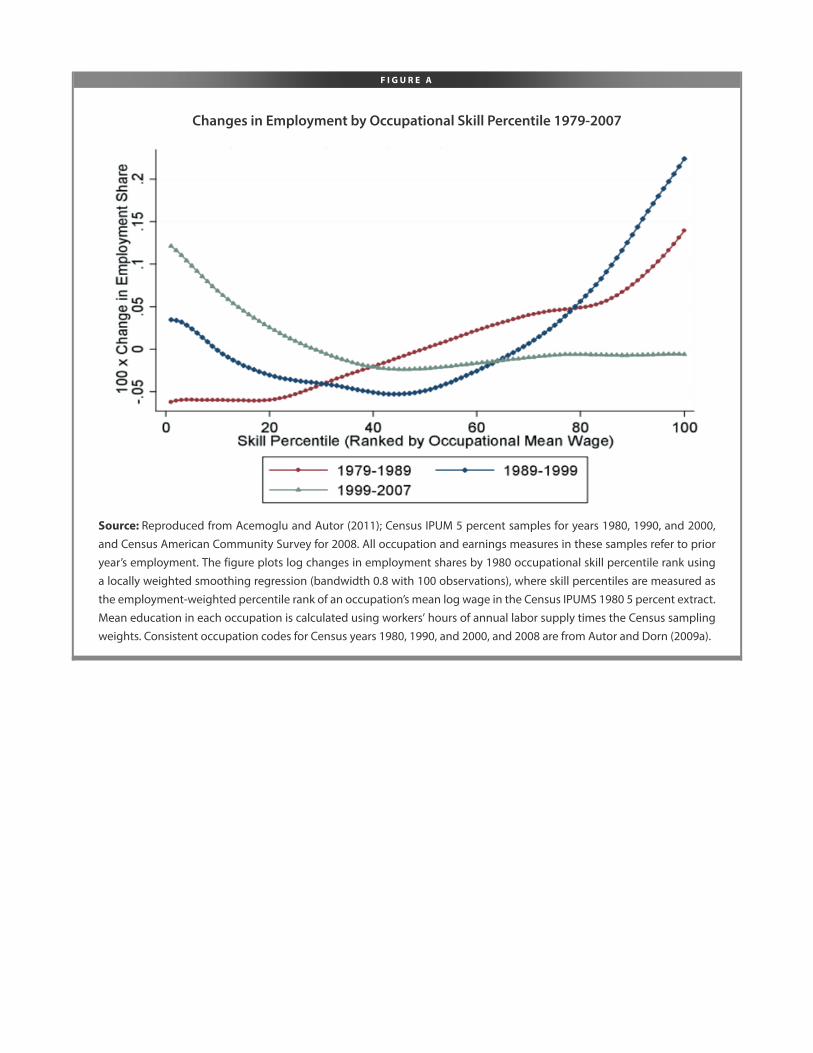
F I G U R E A
Changes in Employment by Occupational Skill Percentile 1979-2007
Source: Reproduced from Acemoglu and Autor (2011); Census IPUM 5 percent samples for years 1980, 1990, and 2000,
and Census American Community Survey for 2008. All occupation and earnings measures in these samples refer to prior
year’s employment. The figure plots log changes in employment shares by 1980 occupational skill percentile rank using
a locally weighted smoothing regression (bandwidth 0.8 with 100 observations), where skill percentiles are measured as
the employment-weighted percentile rank of an occupation’s mean log wage in the Census IPUMS 1980 5 percent extract.
Mean education in each occupation is calculated using workers’ hours of annual labor supply times the Census sampling
weights. Consistent occupation codes for Census years 1980, 1990, and 2000, and 2008 are from Autor and Dorn (2009a).
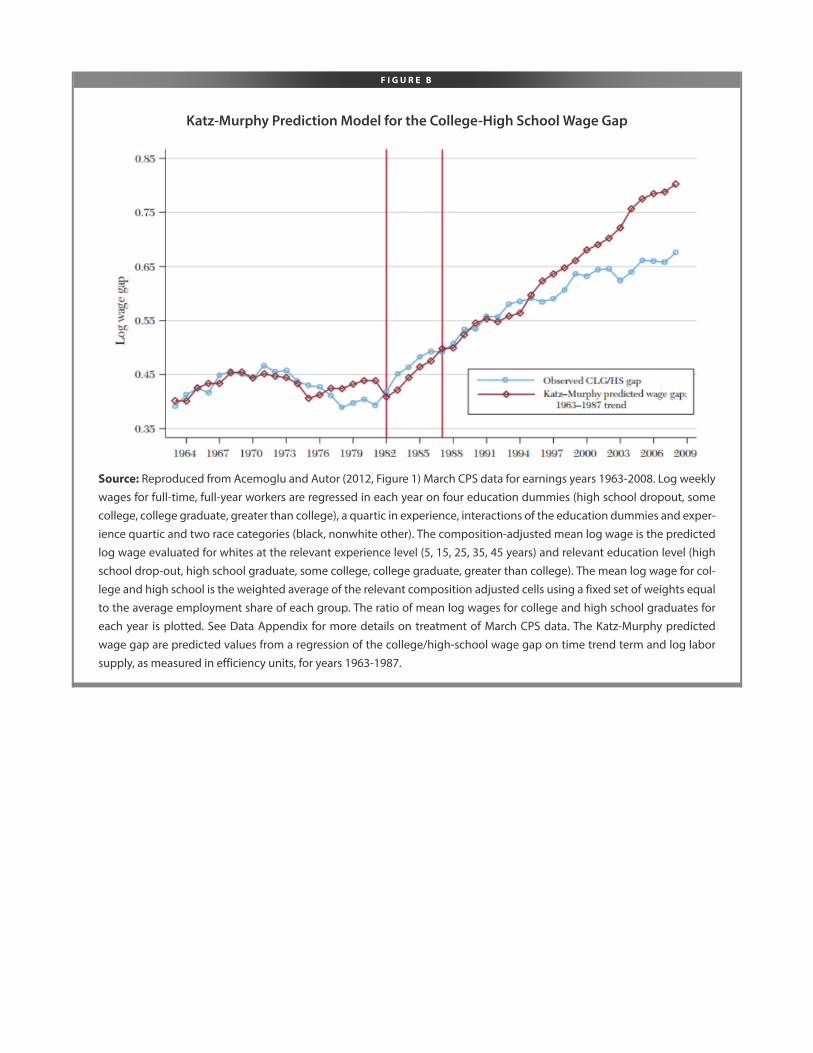
F I G U R E B
Katz-Murphy Prediction Model for the College-High School Wage Gap
Source: Reproduced from Acemoglu and Autor (2012, Figure 1) March CPS data for earnings years 1963-2008. Log weekly
wages for full-time, full-year workers are regressed in each year on four education dummies (high school dropout, some
college, college graduate, greater than college), a quartic in experience, interactions of the education dummies and exper-
ience quartic and two race categories (black, nonwhite other). The composition-adjusted mean log wage is the predicted
log wage evaluated for whites at the relevant experience level (5, 15, 25, 35, 45 years) and relevant education level (high
school drop-out, high school graduate, some college, college graduate, greater than college). The mean log wage for col-
lege and high school is the weighted average of the relevant composition adjusted cells using a fixed set of weights equal
to the average employment share of each group. The ratio of mean log wages for college and high school graduates for
each year is plotted. See Data Appendix for more details on treatment of March CPS data. The Katz-Murphy predicted
wage gap are predicted values from a regression of the college/high-school wage gap on time trend term and log labor
supply, as measured in efficiency units, for years 1963-1987.
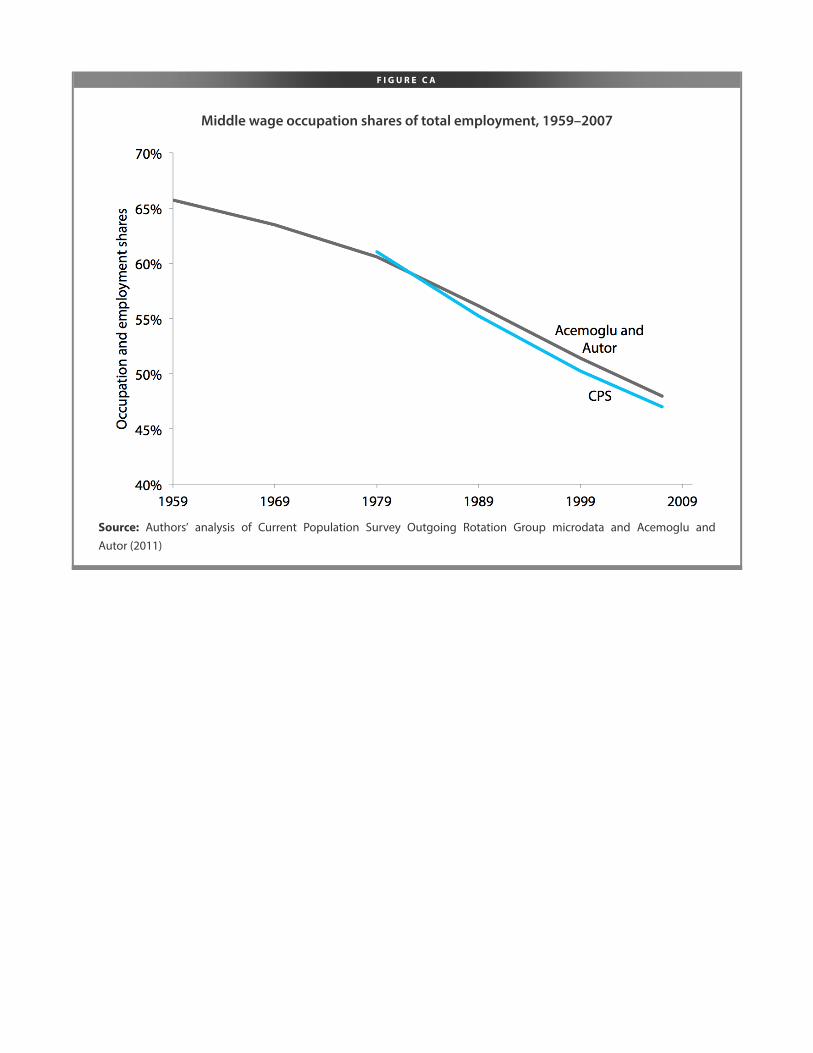
F I G U R E C A
Middle wage occupation shares of total employment, 1959–2007
Source: Authors’ analysis of Current Population Survey Outgoing Rotation Group microdata and Acemoglu and
Autor (2011)
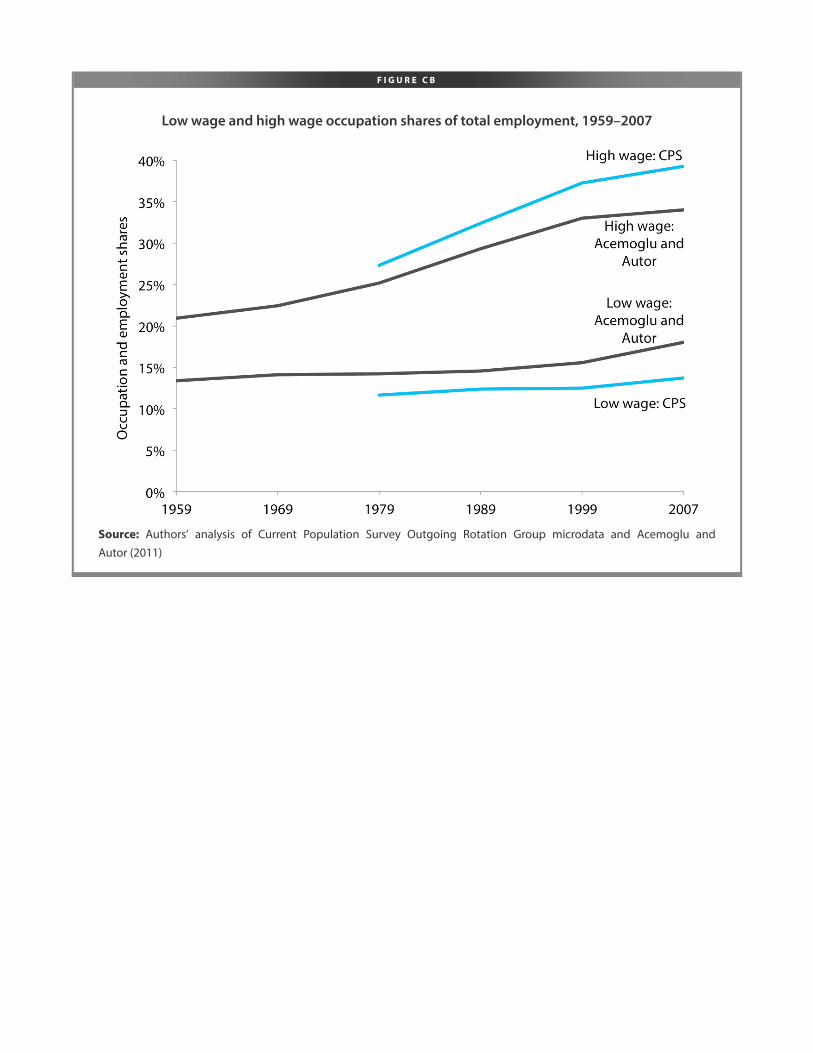
F I G U R E C B
Low wage and high wage occupation shares of total employment, 1959–2007
Source: Authors’ analysis of Current Population Survey Outgoing Rotation Group microdata and Acemoglu and
Autor (2011)
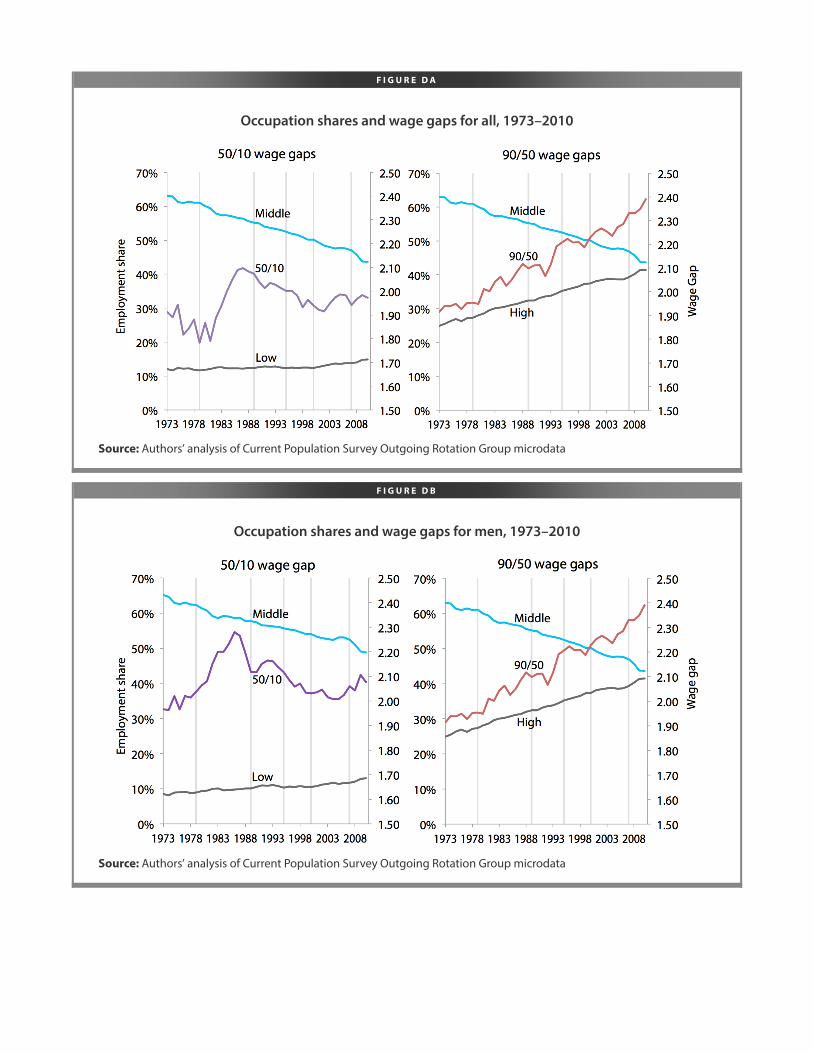
F I G U R E D A
Occupation shares and wage gaps for all, 1973–2010
Source: Authors’ analysis of Current Population Survey Outgoing Rotation Group microdata
F I G U R E D B
Occupation shares and wage gaps for men, 1973–2010
Source: Authors’ analysis of Current Population Survey Outgoing Rotation Group microdata
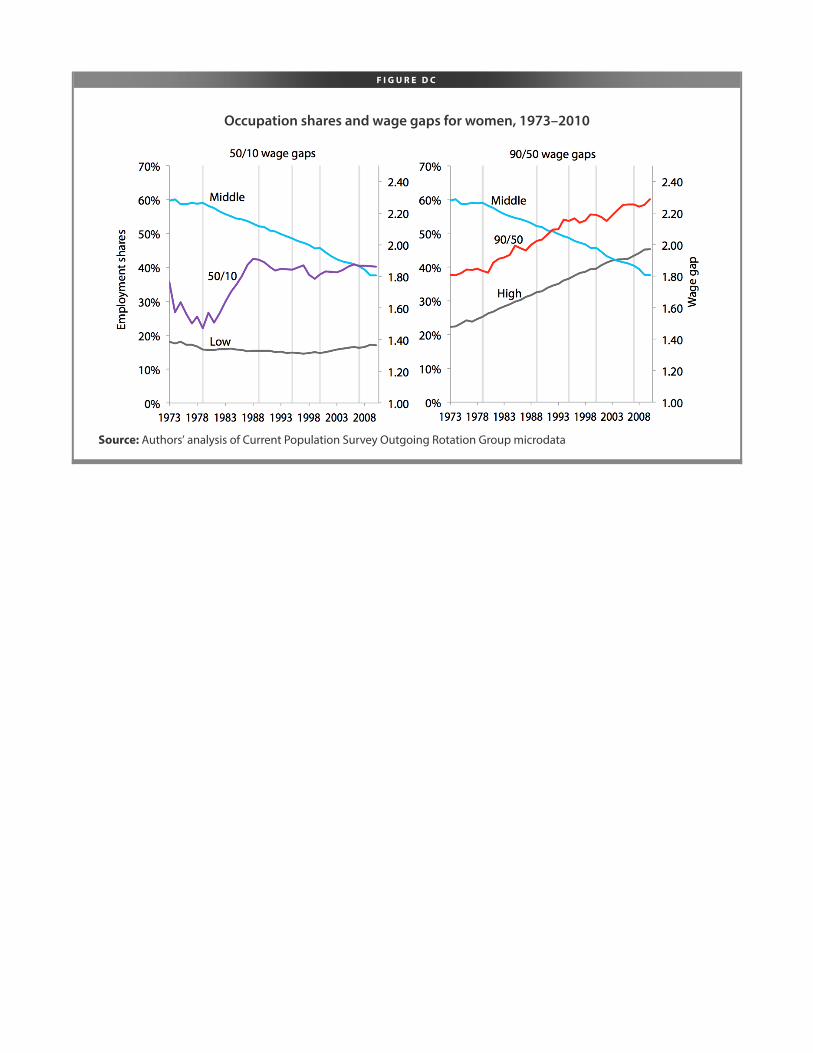
F I G U R E D C
Occupation shares and wage gaps for women, 1973–2010
Source: Authors’ analysis of Current Population Survey Outgoing Rotation Group microdata
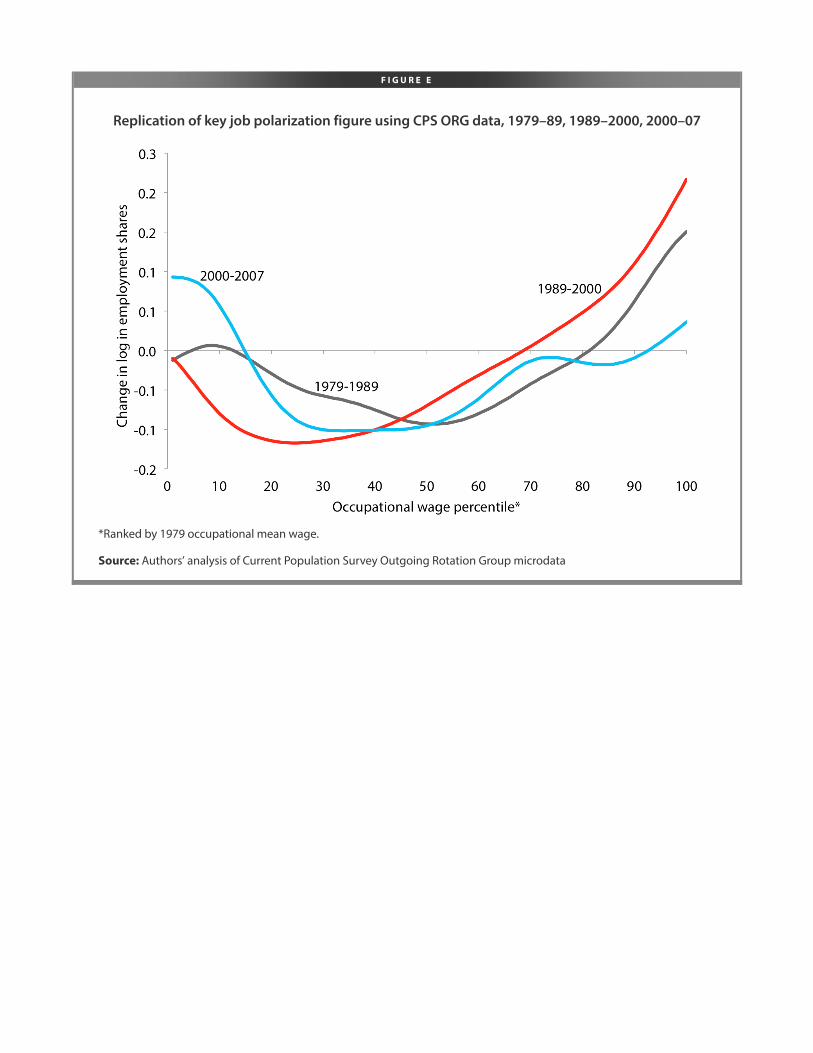
F I G U R E E
Replication of key job polarization figure using CPS ORG data, 1979–89, 1989–2000, 2000–07
*Ranked by 1979 occupational mean wage.
Source: Authors’ analysis of Current Population Survey Outgoing Rotation Group microdata
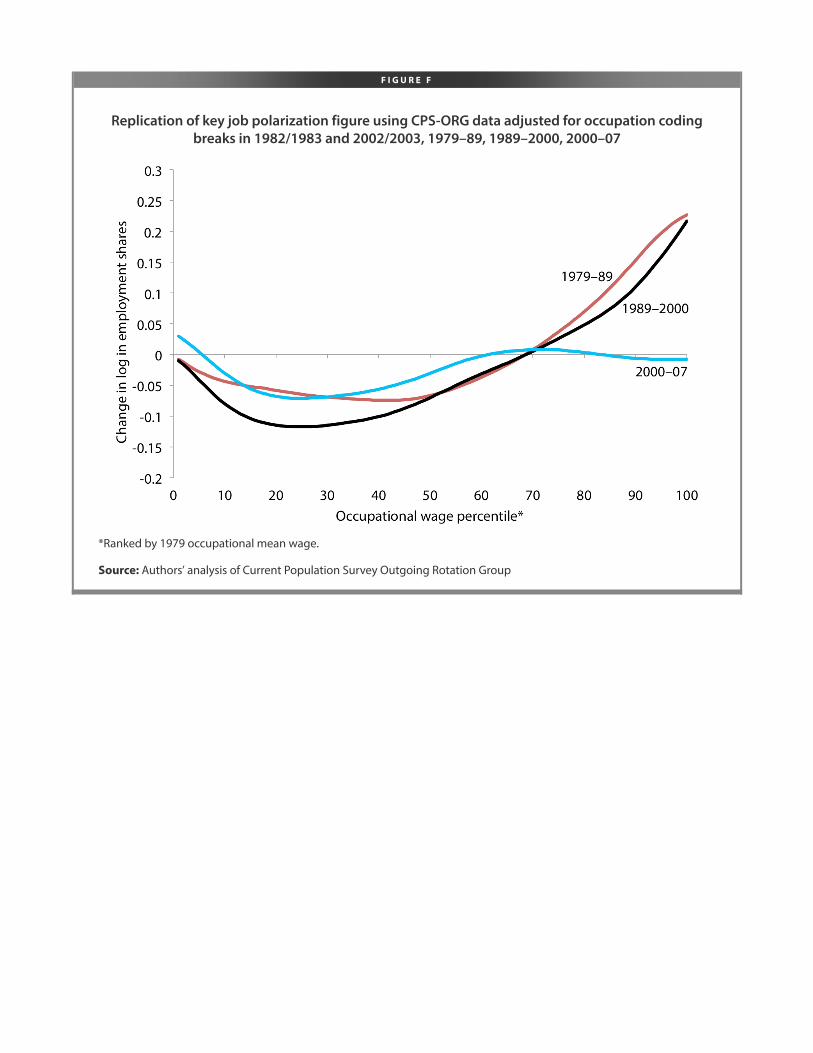
F I G U R E F
Replication of key job polarization figure using CPS-ORG data adjusted for occupation codingbreaks in 1982/1983 and 2002/2003, 1979–89, 1989–2000, 2000–07
*Ranked by 1979 occupational mean wage.
Source: Authors’ analysis of Current Population Survey Outgoing Rotation Group
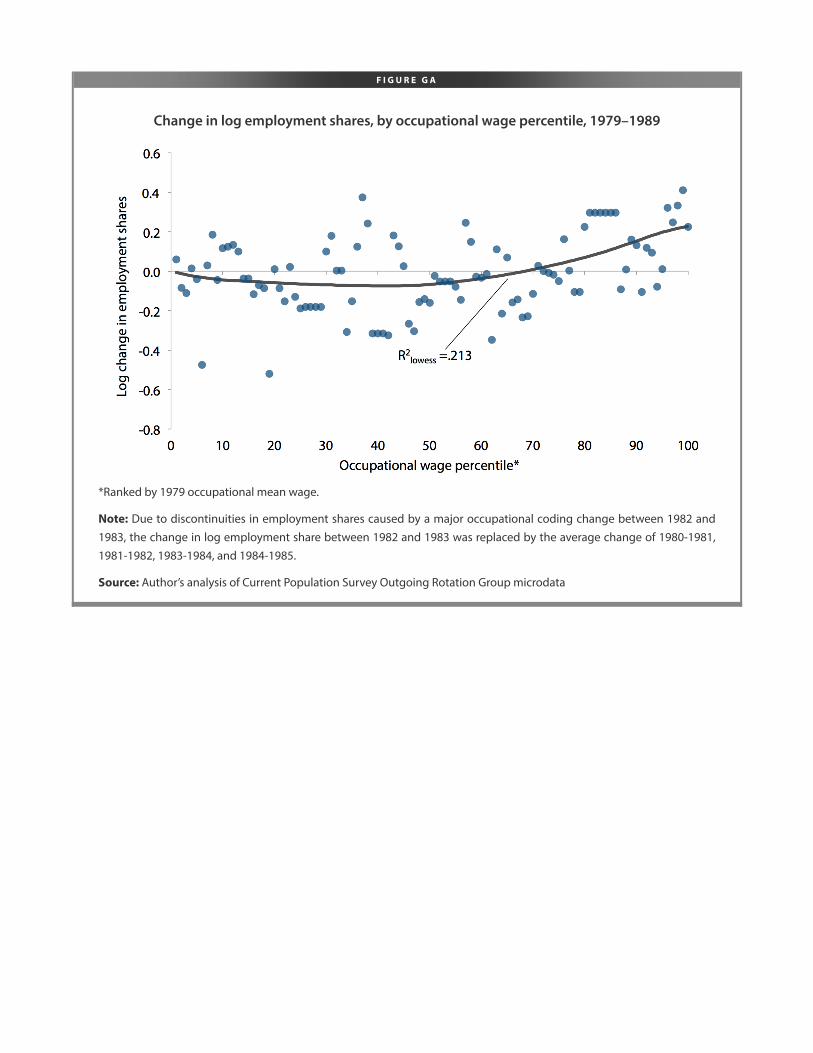
F I G U R E G A
Change in log employment shares, by occupational wage percentile, 1979–1989
*Ranked by 1979 occupational mean wage.
Note: Due to discontinuities in employment shares caused by a major occupational coding change between 1982 and
1983, the change in log employment share between 1982 and 1983 was replaced by the average change of 1980-1981,
1981-1982, 1983-1984, and 1984-1985.
Source: Author’s analysis of Current Population Survey Outgoing Rotation Group microdata
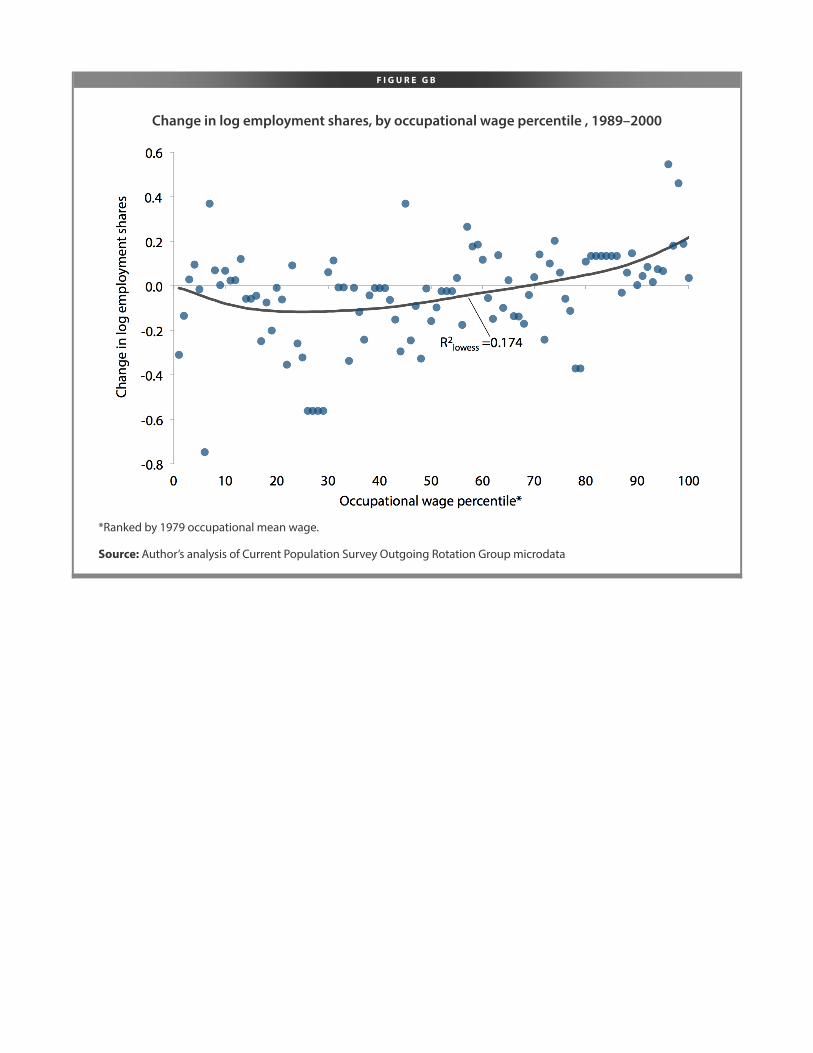
F I G U R E G B
Change in log employment shares, by occupational wage percentile , 1989–2000
*Ranked by 1979 occupational mean wage.
Source: Author’s analysis of Current Population Survey Outgoing Rotation Group microdata
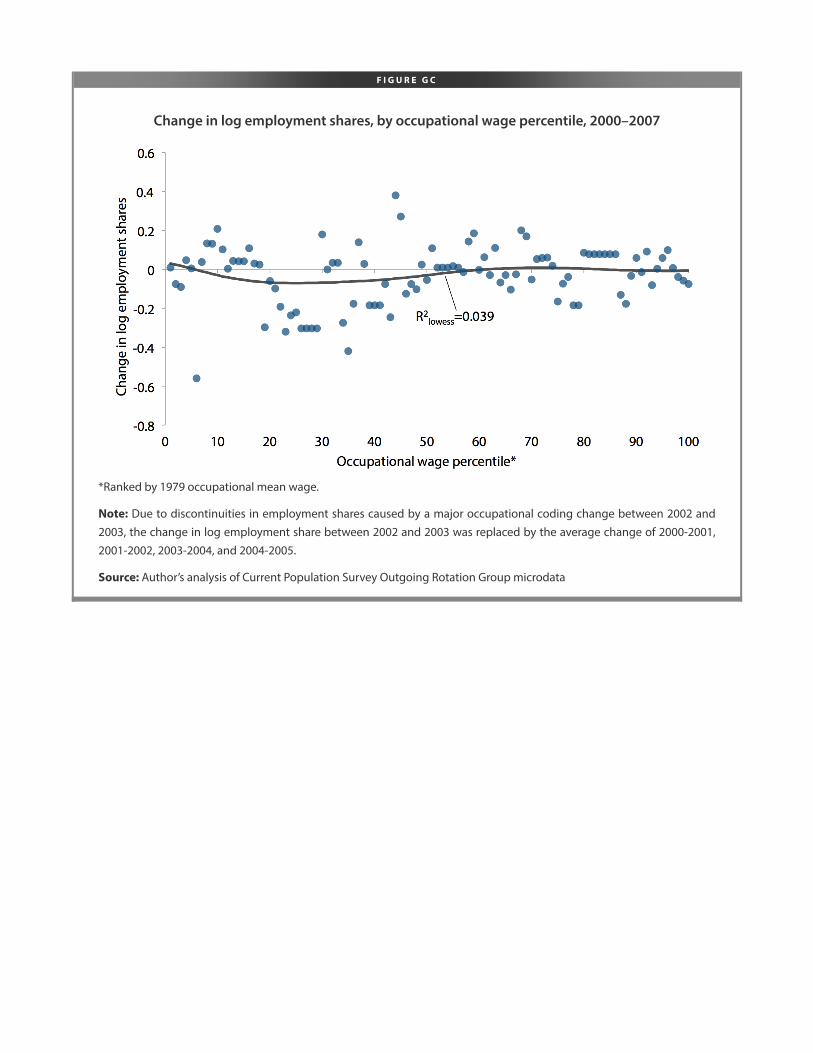
F I G U R E G C
Change in log employment shares, by occupational wage percentile, 2000–2007
*Ranked by 1979 occupational mean wage.
Note: Due to discontinuities in employment shares caused by a major occupational coding change between 2002 and
2003, the change in log employment share between 2002 and 2003 was replaced by the average change of 2000-2001,
2001-2002, 2003-2004, and 2004-2005.
Source: Author’s analysis of Current Population Survey Outgoing Rotation Group microdata
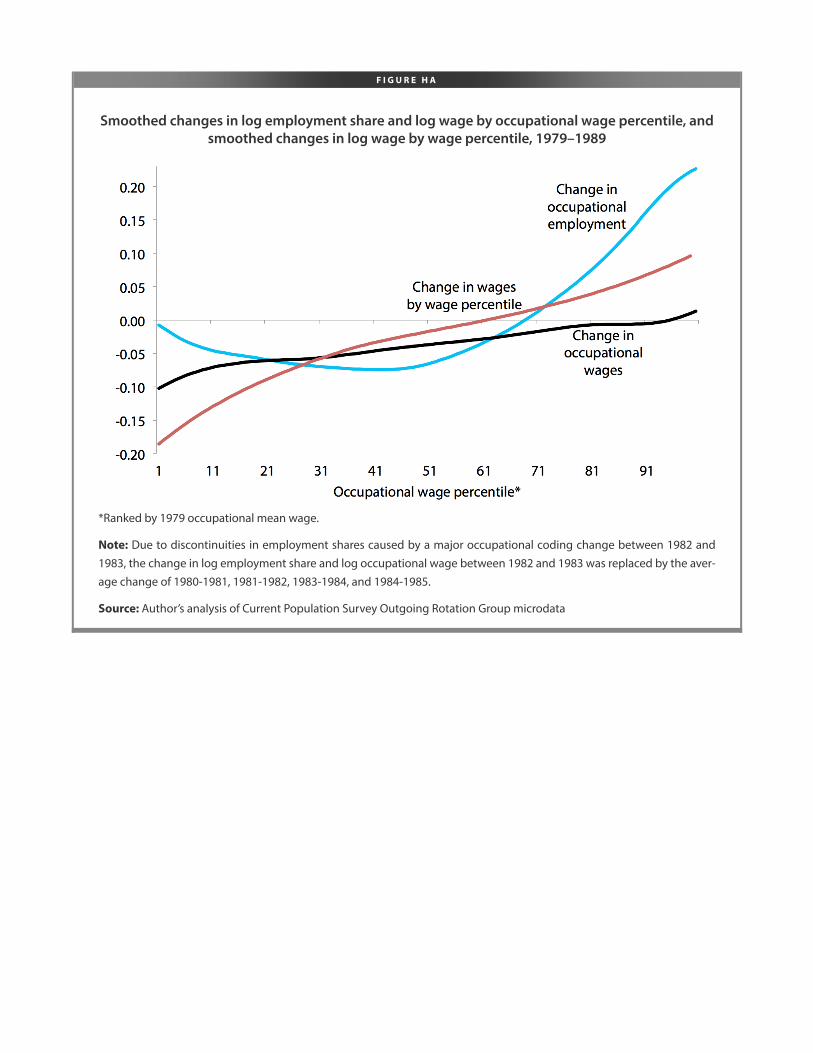
F I G U R E H A
Smoothed changes in log employment share and log wage by occupational wage percentile, andsmoothed changes in log wage by wage percentile, 1979–1989
*Ranked by 1979 occupational mean wage.
Note: Due to discontinuities in employment shares caused by a major occupational coding change between 1982 and
1983, the change in log employment share and log occupational wage between 1982 and 1983 was replaced by the aver-
age change of 1980-1981, 1981-1982, 1983-1984, and 1984-1985.
Source: Author’s analysis of Current Population Survey Outgoing Rotation Group microdata
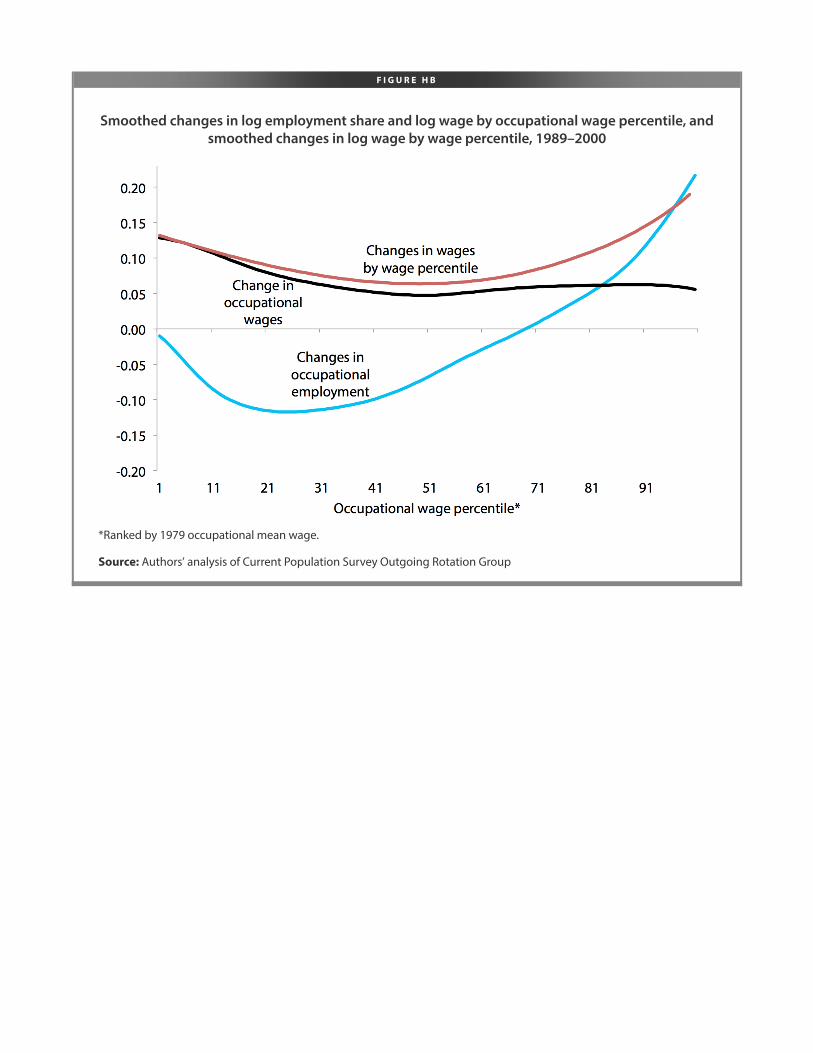
F I G U R E H B
Smoothed changes in log employment share and log wage by occupational wage percentile, andsmoothed changes in log wage by wage percentile, 1989–2000
*Ranked by 1979 occupational mean wage.
Source: Authors’ analysis of Current Population Survey Outgoing Rotation Group
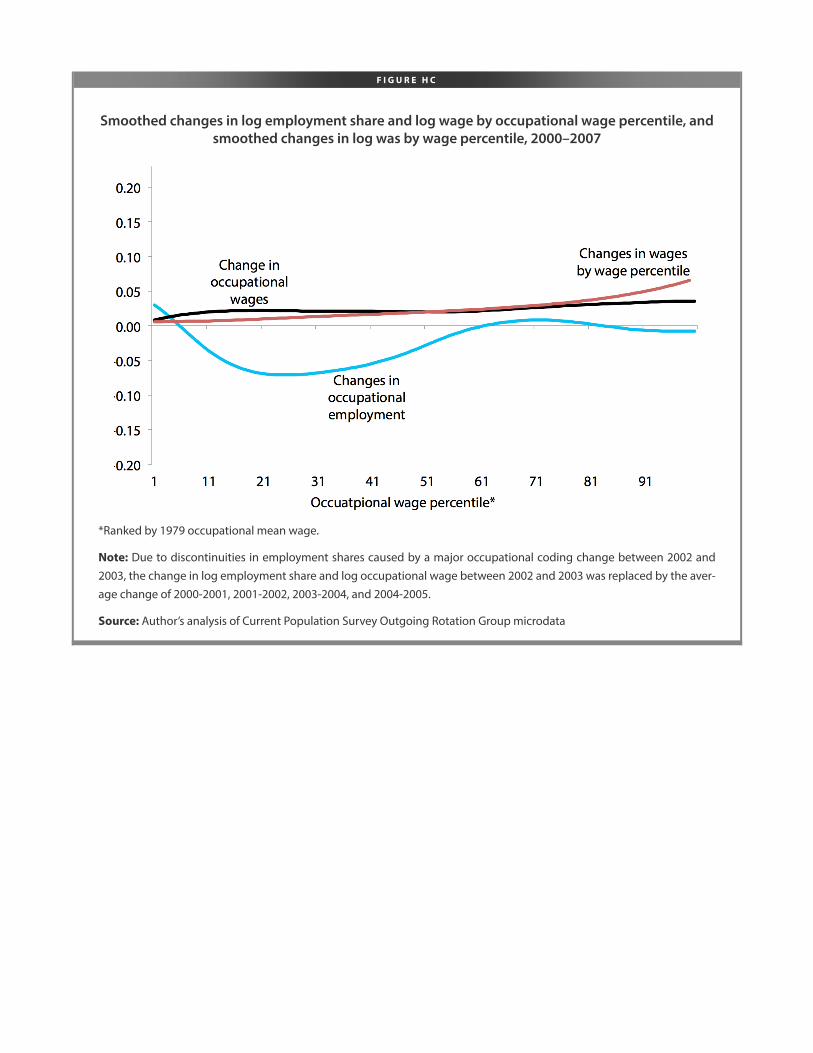
F I G U R E H C
Smoothed changes in log employment share and log wage by occupational wage percentile, andsmoothed changes in log was by wage percentile, 2000–2007
*Ranked by 1979 occupational mean wage.
Note: Due to discontinuities in employment shares caused by a major occupational coding change between 2002 and
2003, the change in log employment share and log occupational wage between 2002 and 2003 was replaced by the aver-
age change of 2000-2001, 2001-2002, 2003-2004, and 2004-2005.
Source: Author’s analysis of Current Population Survey Outgoing Rotation Group microdata
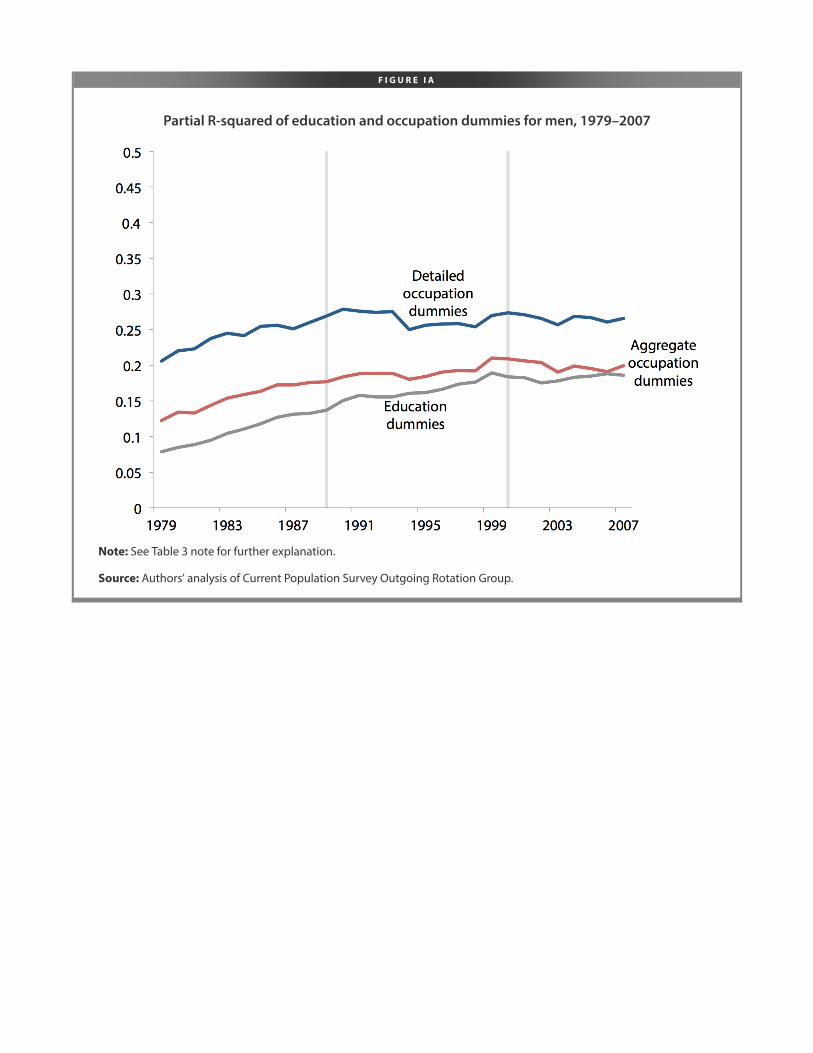
F I G U R E I A
Partial R-squared of education and occupation dummies for men, 1979–2007
Note: See Table 3 note for further explanation.
Source: Authors’ analysis of Current Population Survey Outgoing Rotation Group.
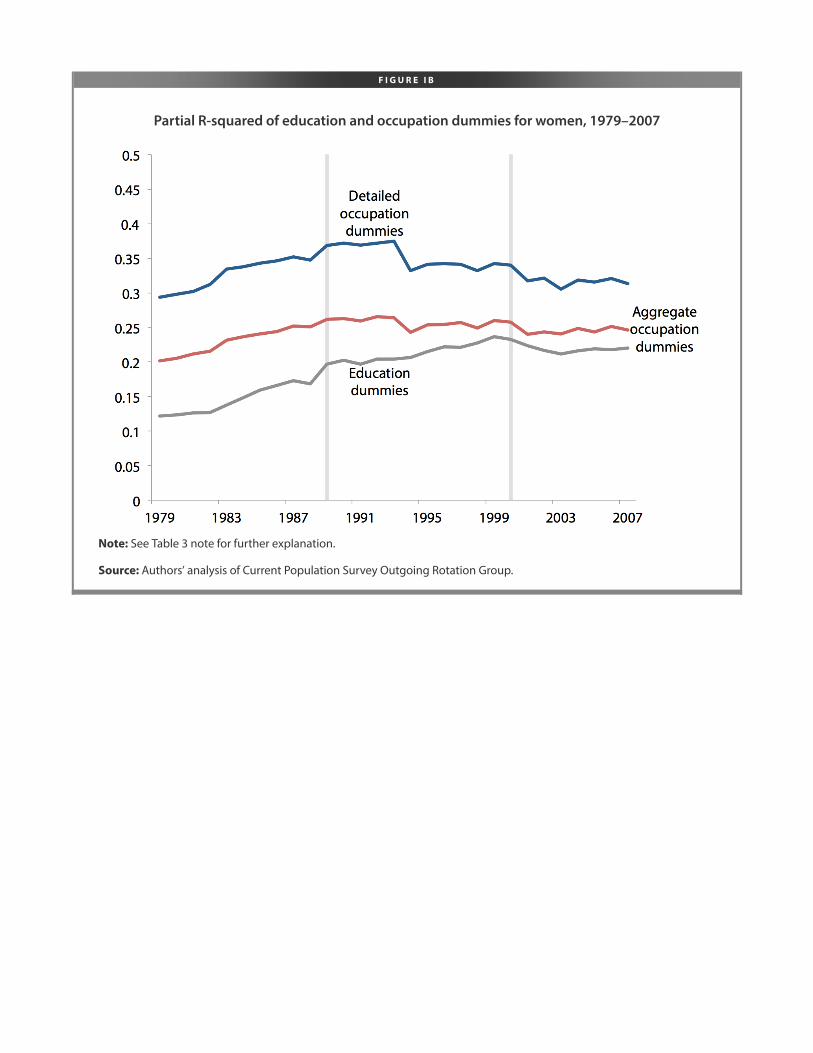
F I G U R E I B
Partial R-squared of education and occupation dummies for women, 1979–2007
Note: See Table 3 note for further explanation.
Source: Authors’ analysis of Current Population Survey Outgoing Rotation Group.
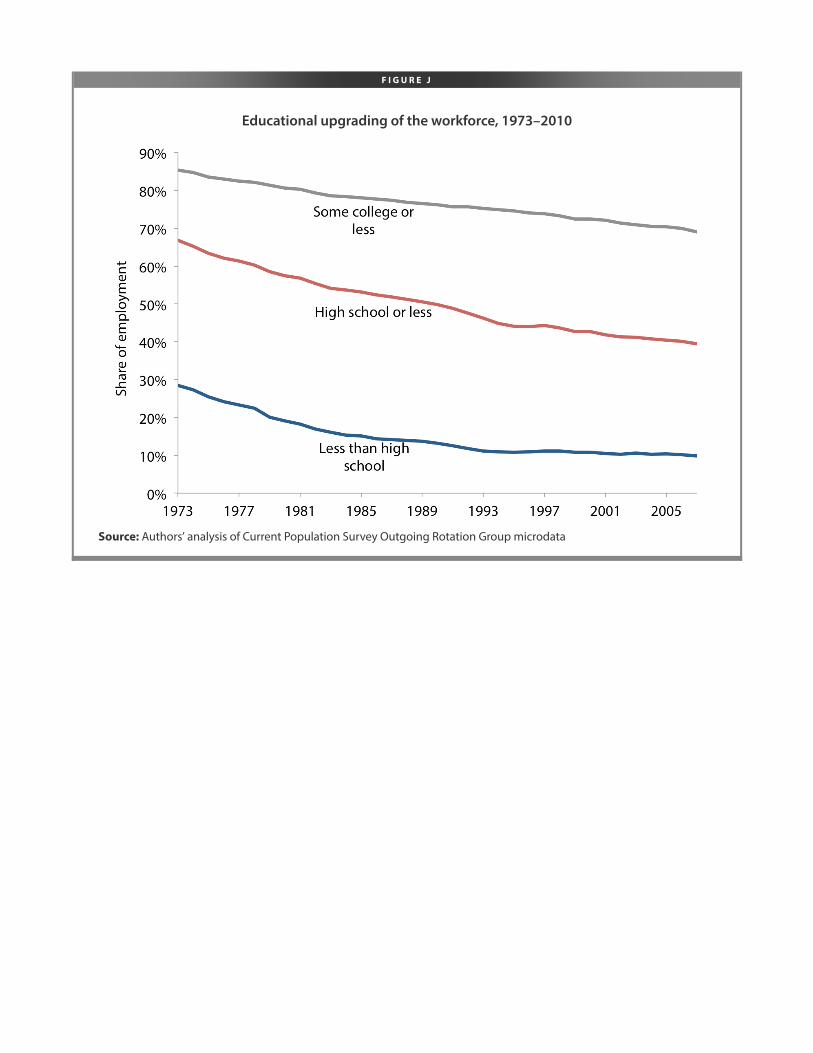
F I G U R E J
Educational upgrading of the workforce, 1973–2010
Source: Authors’ analysis of Current Population Survey Outgoing Rotation Group microdata
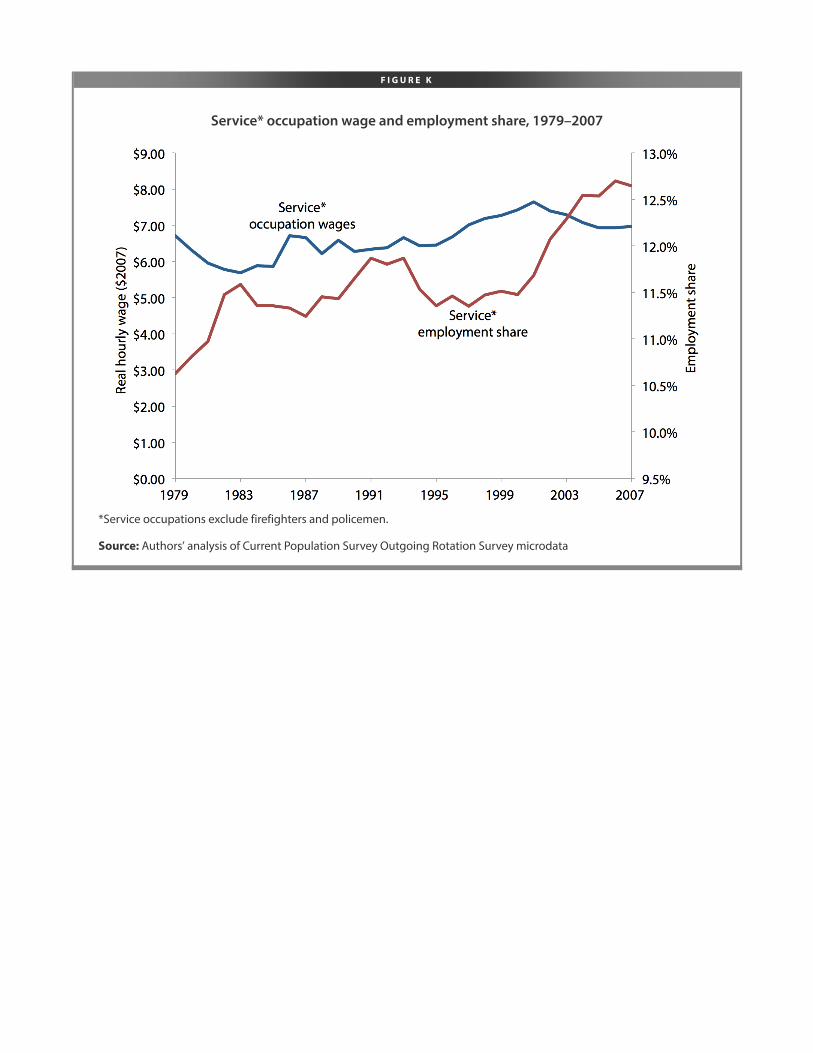
F I G U R E K
Service* occupation wage and employment share, 1979–2007
*Service occupations exclude firefighters and policemen.
Source: Authors’ analysis of Current Population Survey Outgoing Rotation Survey microdata
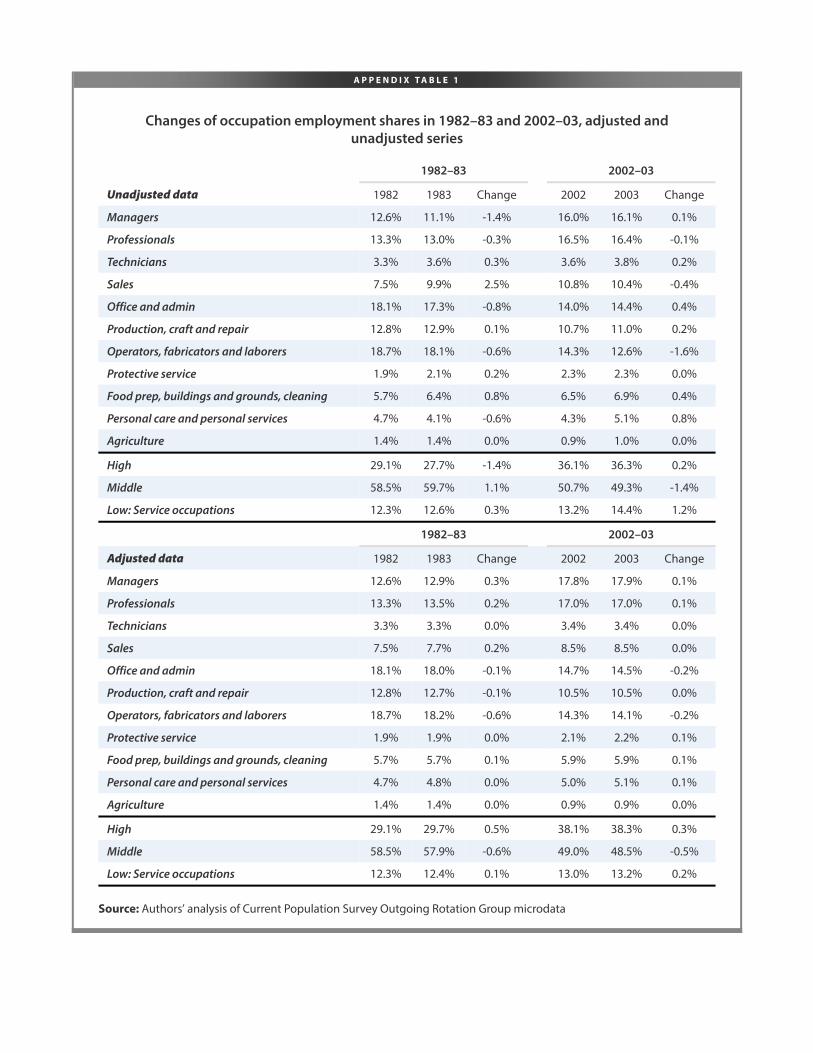
A P P E N D I X T A B L E 1
Changes of occupation employment shares in 1982–83 and 2002–03, adjusted andunadjusted series
1982–83 2002–03
Unadjusted data 1982 1983 Change 2002 2003 Change
Managers 12.6% 11.1% -1.4% 16.0% 16.1% 0.1%
Professionals 13.3% 13.0% -0.3% 16.5% 16.4% -0.1%
Technicians 3.3% 3.6% 0.3% 3.6% 3.8% 0.2%
Sales 7.5% 9.9% 2.5% 10.8% 10.4% -0.4%
Office and admin 18.1% 17.3% -0.8% 14.0% 14.4% 0.4%
Production, craft and repair 12.8% 12.9% 0.1% 10.7% 11.0% 0.2%
Operators, fabricators and laborers 18.7% 18.1% -0.6% 14.3% 12.6% -1.6%
Protective service 1.9% 2.1% 0.2% 2.3% 2.3% 0.0%
Food prep, buildings and grounds, cleaning 5.7% 6.4% 0.8% 6.5% 6.9% 0.4%
Personal care and personal services 4.7% 4.1% -0.6% 4.3% 5.1% 0.8%
Agriculture 1.4% 1.4% 0.0% 0.9% 1.0% 0.0%
High 29.1% 27.7% -1.4% 36.1% 36.3% 0.2%
Middle 58.5% 59.7% 1.1% 50.7% 49.3% -1.4%
Low: Service occupations 12.3% 12.6% 0.3% 13.2% 14.4% 1.2%
1982–83 2002–03
Adjusted data 1982 1983 Change 2002 2003 Change
Managers 12.6% 12.9% 0.3% 17.8% 17.9% 0.1%
Professionals 13.3% 13.5% 0.2% 17.0% 17.0% 0.1%
Technicians 3.3% 3.3% 0.0% 3.4% 3.4% 0.0%
Sales 7.5% 7.7% 0.2% 8.5% 8.5% 0.0%
Office and admin 18.1% 18.0% -0.1% 14.7% 14.5% -0.2%
Production, craft and repair 12.8% 12.7% -0.1% 10.5% 10.5% 0.0%
Operators, fabricators and laborers 18.7% 18.2% -0.6% 14.3% 14.1% -0.2%
Protective service 1.9% 1.9% 0.0% 2.1% 2.2% 0.1%
Food prep, buildings and grounds, cleaning 5.7% 5.7% 0.1% 5.9% 5.9% 0.1%
Personal care and personal services 4.7% 4.8% 0.0% 5.0% 5.1% 0.1%
Agriculture 1.4% 1.4% 0.0% 0.9% 0.9% 0.0%
High 29.1% 29.7% 0.5% 38.1% 38.3% 0.3%
Middle 58.5% 57.9% -0.6% 49.0% 48.5% -0.5%
Low: Service occupations 12.3% 12.4% 0.1% 13.0% 13.2% 0.2%
Source: Authors’ analysis of Current Population Survey Outgoing Rotation Group microdata
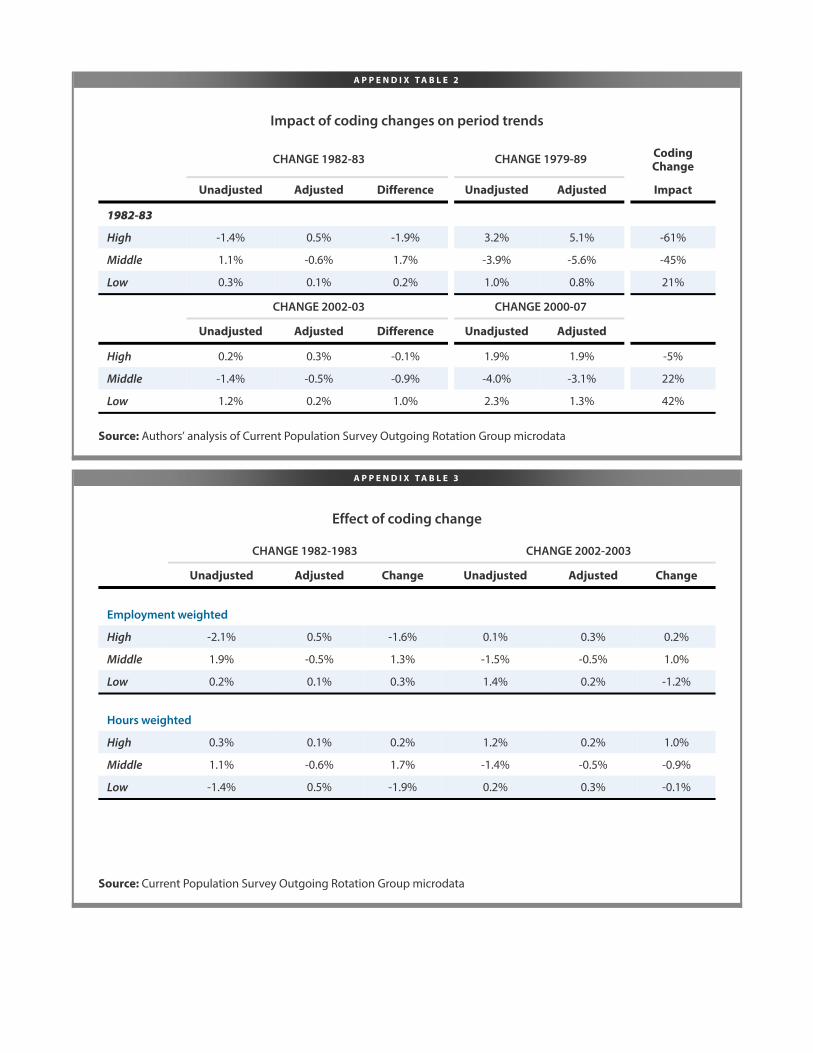
A P P E N D I X T A B L E 2
Impact of coding changes on period trends
CHANGE 1982-83 CHANGE 1979-89 CodingChange
Unadjusted Adjusted Difference Unadjusted Adjusted Impact
1982-83
High -1.4% 0.5% -1.9% 3.2% 5.1% -61%
Middle 1.1% -0.6% 1.7% -3.9% -5.6% -45%
Low 0.3% 0.1% 0.2% 1.0% 0.8% 21%
CHANGE 2002-03 CHANGE 2000-07
Unadjusted Adjusted Difference Unadjusted Adjusted
High 0.2% 0.3% -0.1% 1.9% 1.9% -5%
Middle -1.4% -0.5% -0.9% -4.0% -3.1% 22%
Low 1.2% 0.2% 1.0% 2.3% 1.3% 42%
Source: Authors’ analysis of Current Population Survey Outgoing Rotation Group microdata
A P P E N D I X T A B L E 3
Effect of coding change
CHANGE 1982-1983 CHANGE 2002-2003
Unadjusted Adjusted Change Unadjusted Adjusted Change
Employment weighted
High -2.1% 0.5% -1.6% 0.1% 0.3% 0.2%
Middle 1.9% -0.5% 1.3% -1.5% -0.5% 1.0%
Low 0.2% 0.1% 0.3% 1.4% 0.2% -1.2%
Hours weighted
High 0.3% 0.1% 0.2% 1.2% 0.2% 1.0%
Middle 1.1% -0.6% 1.7% -1.4% -0.5% -0.9%
Low -1.4% 0.5% -1.9% 0.2% 0.3% -0.1%
Source: Current Population Survey Outgoing Rotation Group microdata
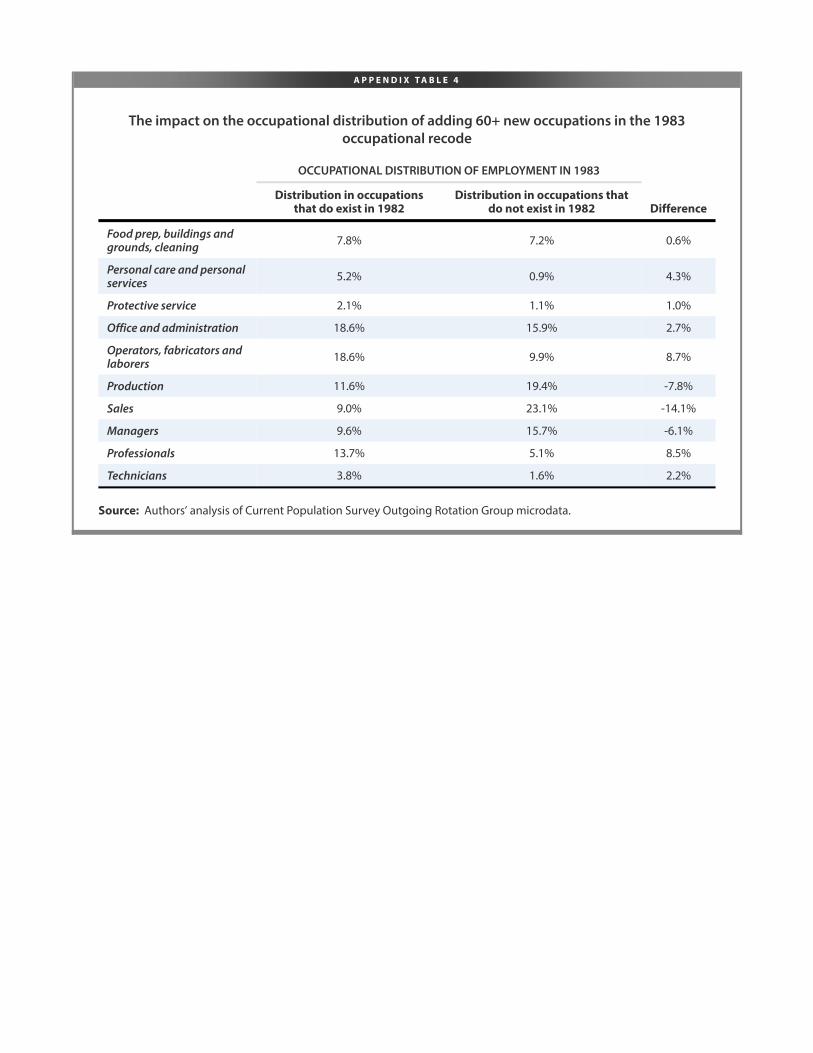
A P P E N D I X T A B L E 4
The impact on the occupational distribution of adding 60+ new occupations in the 1983occupational recode
OCCUPATIONAL DISTRIBUTION OF EMPLOYMENT IN 1983
Distribution in occupationsthat do exist in 1982
Distribution in occupations thatdo not exist in 1982 Difference
Food prep, buildings andgrounds, cleaning 7.8% 7.2% 0.6%
Personal care and personalservices 5.2% 0.9% 4.3%
Protective service 2.1% 1.1% 1.0%
Office and administration 18.6% 15.9% 2.7%
Operators, fabricators andlaborers 18.6% 9.9% 8.7%
Production 11.6% 19.4% -7.8%
Sales 9.0% 23.1% -14.1%
Managers 9.6% 15.7% -6.1%
Professionals 13.7% 5.1% 8.5%
Technicians 3.8% 1.6% 2.2%
Source: Authors’ analysis of Current Population Survey Outgoing Rotation Group microdata.
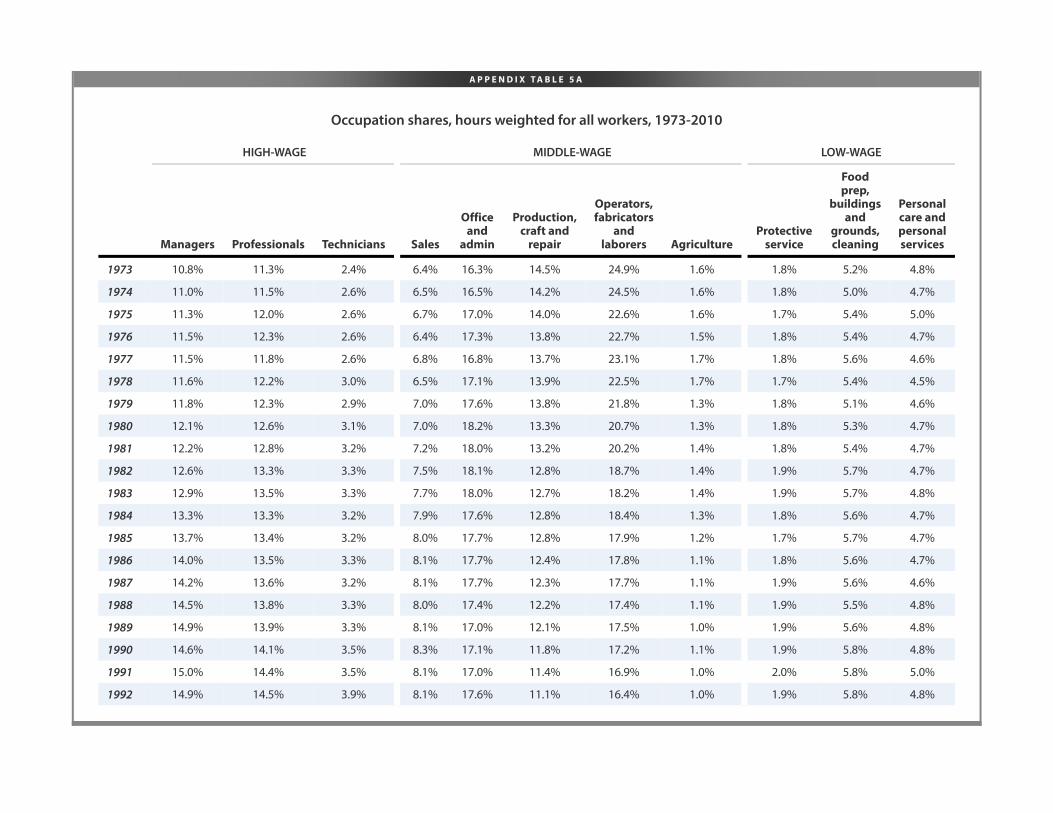
A P P E N D I X T A B L E 5 A
Occupation shares, hours weighted for all workers, 1973-2010
HIGH-WAGE MIDDLE-WAGE LOW-WAGE
Managers Professionals Technicians Sales
Officeand
admin
Production,craft and
repair
Operators,fabricators
andlaborers Agriculture
Protectiveservice
Foodprep,
buildingsand
grounds,cleaning
Personalcare andpersonalservices
1973 10.8% 11.3% 2.4% 6.4% 16.3% 14.5% 24.9% 1.6% 1.8% 5.2% 4.8%
1974 11.0% 11.5% 2.6% 6.5% 16.5% 14.2% 24.5% 1.6% 1.8% 5.0% 4.7%
1975 11.3% 12.0% 2.6% 6.7% 17.0% 14.0% 22.6% 1.6% 1.7% 5.4% 5.0%
1976 11.5% 12.3% 2.6% 6.4% 17.3% 13.8% 22.7% 1.5% 1.8% 5.4% 4.7%
1977 11.5% 11.8% 2.6% 6.8% 16.8% 13.7% 23.1% 1.7% 1.8% 5.6% 4.6%
1978 11.6% 12.2% 3.0% 6.5% 17.1% 13.9% 22.5% 1.7% 1.7% 5.4% 4.5%
1979 11.8% 12.3% 2.9% 7.0% 17.6% 13.8% 21.8% 1.3% 1.8% 5.1% 4.6%
1980 12.1% 12.6% 3.1% 7.0% 18.2% 13.3% 20.7% 1.3% 1.8% 5.3% 4.7%
1981 12.2% 12.8% 3.2% 7.2% 18.0% 13.2% 20.2% 1.4% 1.8% 5.4% 4.7%
1982 12.6% 13.3% 3.3% 7.5% 18.1% 12.8% 18.7% 1.4% 1.9% 5.7% 4.7%
1983 12.9% 13.5% 3.3% 7.7% 18.0% 12.7% 18.2% 1.4% 1.9% 5.7% 4.8%
1984 13.3% 13.3% 3.2% 7.9% 17.6% 12.8% 18.4% 1.3% 1.8% 5.6% 4.7%
1985 13.7% 13.4% 3.2% 8.0% 17.7% 12.8% 17.9% 1.2% 1.7% 5.7% 4.7%
1986 14.0% 13.5% 3.3% 8.1% 17.7% 12.4% 17.8% 1.1% 1.8% 5.6% 4.7%
1987 14.2% 13.6% 3.2% 8.1% 17.7% 12.3% 17.7% 1.1% 1.9% 5.6% 4.6%
1988 14.5% 13.8% 3.3% 8.0% 17.4% 12.2% 17.4% 1.1% 1.9% 5.5% 4.8%
1989 14.9% 13.9% 3.3% 8.1% 17.0% 12.1% 17.5% 1.0% 1.9% 5.6% 4.8%
1990 14.6% 14.1% 3.5% 8.3% 17.1% 11.8% 17.2% 1.1% 1.9% 5.8% 4.8%
1991 15.0% 14.4% 3.5% 8.1% 17.0% 11.4% 16.9% 1.0% 2.0% 5.8% 5.0%
1992 14.9% 14.5% 3.9% 8.1% 17.6% 11.1% 16.4% 1.0% 1.9% 5.8% 4.8%
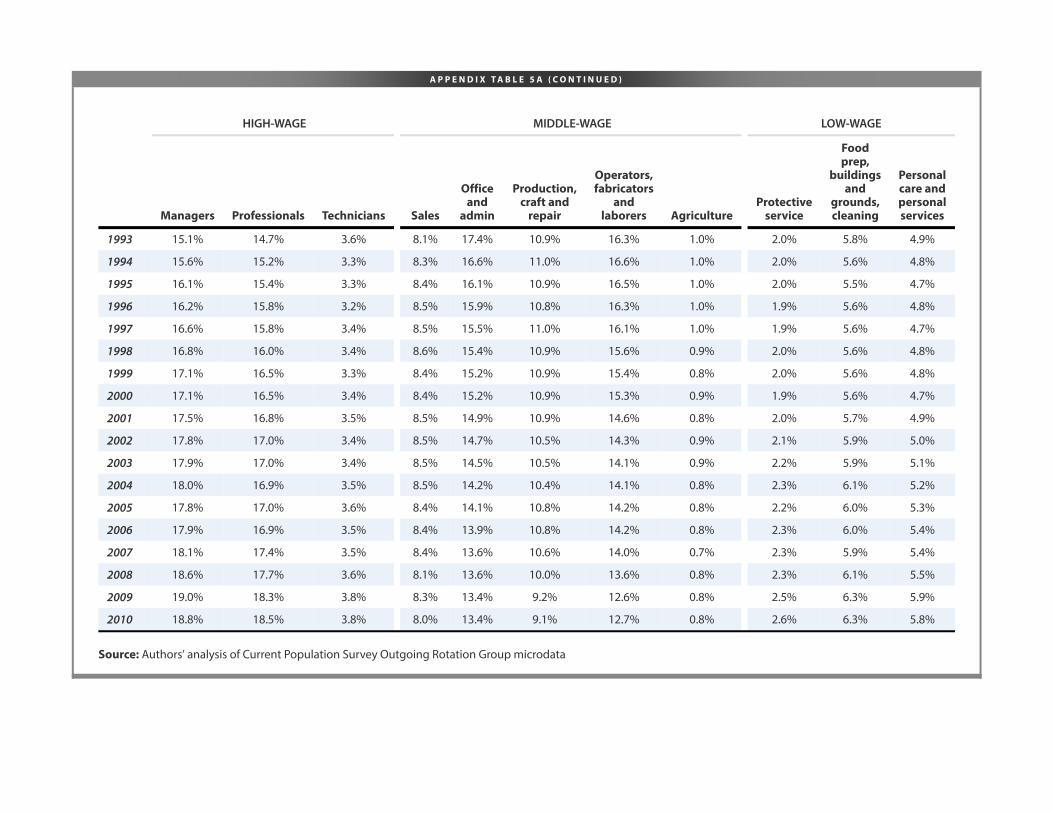
A P P E N D I X T A B L E 5 A ( C O N T I N U E D )
HIGH-WAGE MIDDLE-WAGE LOW-WAGE
Managers Professionals Technicians Sales
Officeand
admin
Production,craft and
repair
Operators,fabricators
andlaborers Agriculture
Protectiveservice
Foodprep,
buildingsand
grounds,cleaning
Personalcare andpersonalservices
1993 15.1% 14.7% 3.6% 8.1% 17.4% 10.9% 16.3% 1.0% 2.0% 5.8% 4.9%
1994 15.6% 15.2% 3.3% 8.3% 16.6% 11.0% 16.6% 1.0% 2.0% 5.6% 4.8%
1995 16.1% 15.4% 3.3% 8.4% 16.1% 10.9% 16.5% 1.0% 2.0% 5.5% 4.7%
1996 16.2% 15.8% 3.2% 8.5% 15.9% 10.8% 16.3% 1.0% 1.9% 5.6% 4.8%
1997 16.6% 15.8% 3.4% 8.5% 15.5% 11.0% 16.1% 1.0% 1.9% 5.6% 4.7%
1998 16.8% 16.0% 3.4% 8.6% 15.4% 10.9% 15.6% 0.9% 2.0% 5.6% 4.8%
1999 17.1% 16.5% 3.3% 8.4% 15.2% 10.9% 15.4% 0.8% 2.0% 5.6% 4.8%
2000 17.1% 16.5% 3.4% 8.4% 15.2% 10.9% 15.3% 0.9% 1.9% 5.6% 4.7%
2001 17.5% 16.8% 3.5% 8.5% 14.9% 10.9% 14.6% 0.8% 2.0% 5.7% 4.9%
2002 17.8% 17.0% 3.4% 8.5% 14.7% 10.5% 14.3% 0.9% 2.1% 5.9% 5.0%
2003 17.9% 17.0% 3.4% 8.5% 14.5% 10.5% 14.1% 0.9% 2.2% 5.9% 5.1%
2004 18.0% 16.9% 3.5% 8.5% 14.2% 10.4% 14.1% 0.8% 2.3% 6.1% 5.2%
2005 17.8% 17.0% 3.6% 8.4% 14.1% 10.8% 14.2% 0.8% 2.2% 6.0% 5.3%
2006 17.9% 16.9% 3.5% 8.4% 13.9% 10.8% 14.2% 0.8% 2.3% 6.0% 5.4%
2007 18.1% 17.4% 3.5% 8.4% 13.6% 10.6% 14.0% 0.7% 2.3% 5.9% 5.4%
2008 18.6% 17.7% 3.6% 8.1% 13.6% 10.0% 13.6% 0.8% 2.3% 6.1% 5.5%
2009 19.0% 18.3% 3.8% 8.3% 13.4% 9.2% 12.6% 0.8% 2.5% 6.3% 5.9%
2010 18.8% 18.5% 3.8% 8.0% 13.4% 9.1% 12.7% 0.8% 2.6% 6.3% 5.8%
Source: Authors’ analysis of Current Population Survey Outgoing Rotation Group microdata
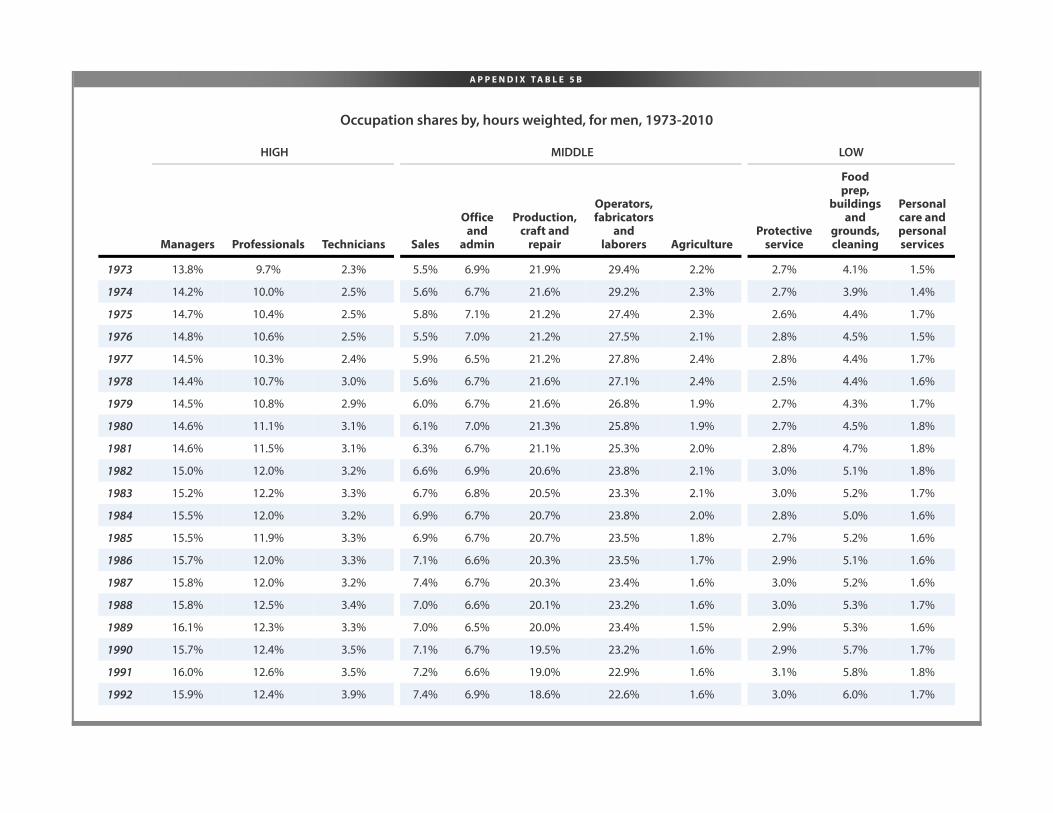
A P P E N D I X T A B L E 5 B
Occupation shares by, hours weighted, for men, 1973-2010
HIGH MIDDLE LOW
Managers Professionals Technicians Sales
Officeand
admin
Production,craft and
repair
Operators,fabricators
andlaborers Agriculture
Protectiveservice
Foodprep,
buildingsand
grounds,cleaning
Personalcare andpersonalservices
1973 13.8% 9.7% 2.3% 5.5% 6.9% 21.9% 29.4% 2.2% 2.7% 4.1% 1.5%
1974 14.2% 10.0% 2.5% 5.6% 6.7% 21.6% 29.2% 2.3% 2.7% 3.9% 1.4%
1975 14.7% 10.4% 2.5% 5.8% 7.1% 21.2% 27.4% 2.3% 2.6% 4.4% 1.7%
1976 14.8% 10.6% 2.5% 5.5% 7.0% 21.2% 27.5% 2.1% 2.8% 4.5% 1.5%
1977 14.5% 10.3% 2.4% 5.9% 6.5% 21.2% 27.8% 2.4% 2.8% 4.4% 1.7%
1978 14.4% 10.7% 3.0% 5.6% 6.7% 21.6% 27.1% 2.4% 2.5% 4.4% 1.6%
1979 14.5% 10.8% 2.9% 6.0% 6.7% 21.6% 26.8% 1.9% 2.7% 4.3% 1.7%
1980 14.6% 11.1% 3.1% 6.1% 7.0% 21.3% 25.8% 1.9% 2.7% 4.5% 1.8%
1981 14.6% 11.5% 3.1% 6.3% 6.7% 21.1% 25.3% 2.0% 2.8% 4.7% 1.8%
1982 15.0% 12.0% 3.2% 6.6% 6.9% 20.6% 23.8% 2.1% 3.0% 5.1% 1.8%
1983 15.2% 12.2% 3.3% 6.7% 6.8% 20.5% 23.3% 2.1% 3.0% 5.2% 1.7%
1984 15.5% 12.0% 3.2% 6.9% 6.7% 20.7% 23.8% 2.0% 2.8% 5.0% 1.6%
1985 15.5% 11.9% 3.3% 6.9% 6.7% 20.7% 23.5% 1.8% 2.7% 5.2% 1.6%
1986 15.7% 12.0% 3.3% 7.1% 6.6% 20.3% 23.5% 1.7% 2.9% 5.1% 1.6%
1987 15.8% 12.0% 3.2% 7.4% 6.7% 20.3% 23.4% 1.6% 3.0% 5.2% 1.6%
1988 15.8% 12.5% 3.4% 7.0% 6.6% 20.1% 23.2% 1.6% 3.0% 5.3% 1.7%
1989 16.1% 12.3% 3.3% 7.0% 6.5% 20.0% 23.4% 1.5% 2.9% 5.3% 1.6%
1990 15.7% 12.4% 3.5% 7.1% 6.7% 19.5% 23.2% 1.6% 2.9% 5.7% 1.7%
1991 16.0% 12.6% 3.5% 7.2% 6.6% 19.0% 22.9% 1.6% 3.1% 5.8% 1.8%
1992 15.9% 12.4% 3.9% 7.4% 6.9% 18.6% 22.6% 1.6% 3.0% 6.0% 1.7%
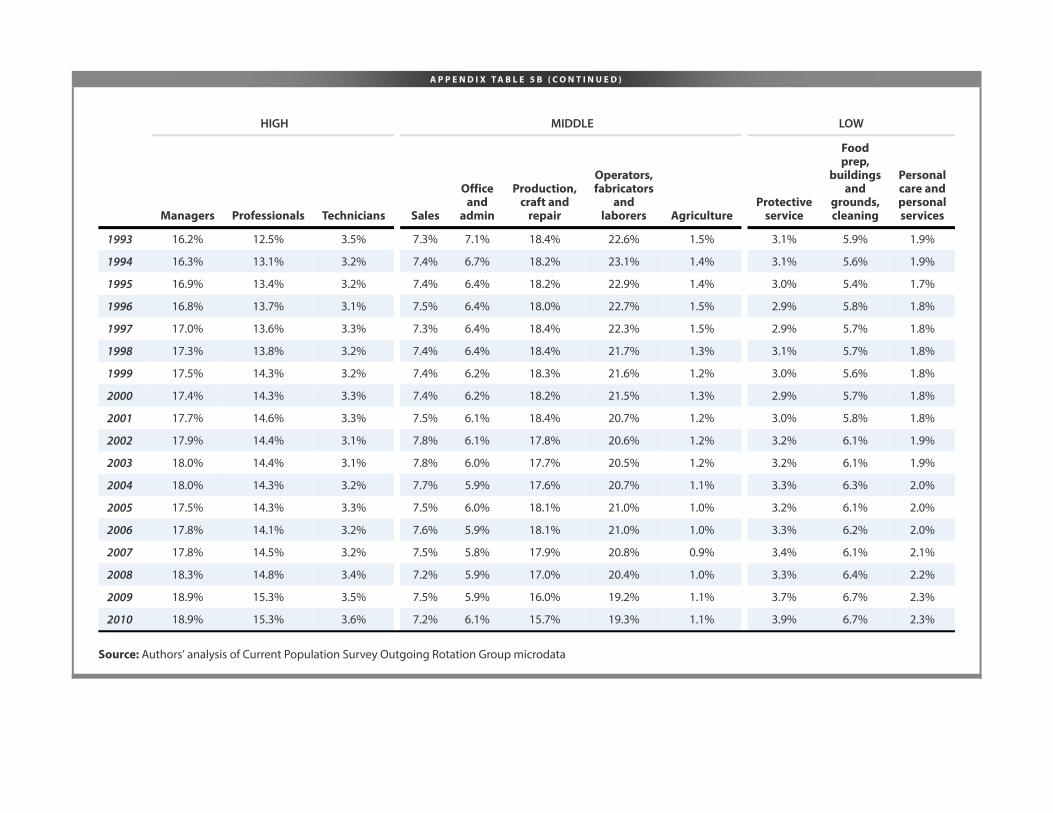
A P P E N D I X T A B L E 5 B ( C O N T I N U E D )
HIGH MIDDLE LOW
Managers Professionals Technicians Sales
Officeand
admin
Production,craft and
repair
Operators,fabricators
andlaborers Agriculture
Protectiveservice
Foodprep,
buildingsand
grounds,cleaning
Personalcare andpersonalservices
1993 16.2% 12.5% 3.5% 7.3% 7.1% 18.4% 22.6% 1.5% 3.1% 5.9% 1.9%
1994 16.3% 13.1% 3.2% 7.4% 6.7% 18.2% 23.1% 1.4% 3.1% 5.6% 1.9%
1995 16.9% 13.4% 3.2% 7.4% 6.4% 18.2% 22.9% 1.4% 3.0% 5.4% 1.7%
1996 16.8% 13.7% 3.1% 7.5% 6.4% 18.0% 22.7% 1.5% 2.9% 5.8% 1.8%
1997 17.0% 13.6% 3.3% 7.3% 6.4% 18.4% 22.3% 1.5% 2.9% 5.7% 1.8%
1998 17.3% 13.8% 3.2% 7.4% 6.4% 18.4% 21.7% 1.3% 3.1% 5.7% 1.8%
1999 17.5% 14.3% 3.2% 7.4% 6.2% 18.3% 21.6% 1.2% 3.0% 5.6% 1.8%
2000 17.4% 14.3% 3.3% 7.4% 6.2% 18.2% 21.5% 1.3% 2.9% 5.7% 1.8%
2001 17.7% 14.6% 3.3% 7.5% 6.1% 18.4% 20.7% 1.2% 3.0% 5.8% 1.8%
2002 17.9% 14.4% 3.1% 7.8% 6.1% 17.8% 20.6% 1.2% 3.2% 6.1% 1.9%
2003 18.0% 14.4% 3.1% 7.8% 6.0% 17.7% 20.5% 1.2% 3.2% 6.1% 1.9%
2004 18.0% 14.3% 3.2% 7.7% 5.9% 17.6% 20.7% 1.1% 3.3% 6.3% 2.0%
2005 17.5% 14.3% 3.3% 7.5% 6.0% 18.1% 21.0% 1.0% 3.2% 6.1% 2.0%
2006 17.8% 14.1% 3.2% 7.6% 5.9% 18.1% 21.0% 1.0% 3.3% 6.2% 2.0%
2007 17.8% 14.5% 3.2% 7.5% 5.8% 17.9% 20.8% 0.9% 3.4% 6.1% 2.1%
2008 18.3% 14.8% 3.4% 7.2% 5.9% 17.0% 20.4% 1.0% 3.3% 6.4% 2.2%
2009 18.9% 15.3% 3.5% 7.5% 5.9% 16.0% 19.2% 1.1% 3.7% 6.7% 2.3%
2010 18.9% 15.3% 3.6% 7.2% 6.1% 15.7% 19.3% 1.1% 3.9% 6.7% 2.3%
Source: Authors’ analysis of Current Population Survey Outgoing Rotation Group microdata
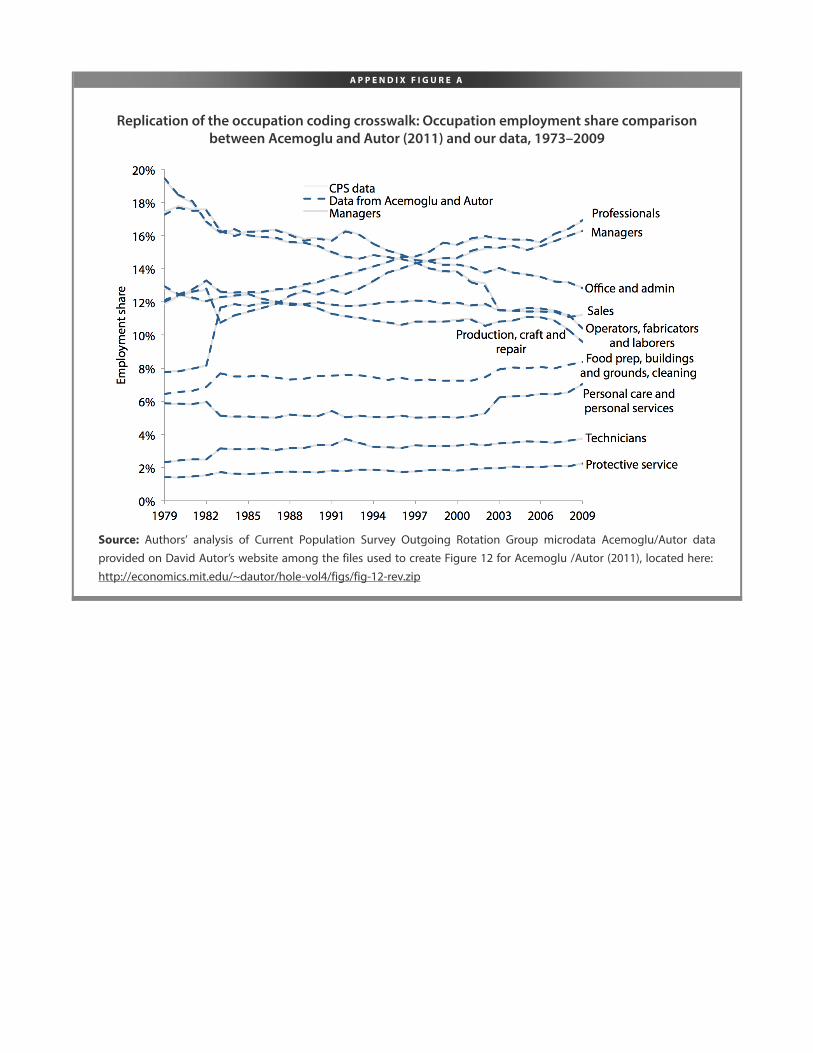
A P P E N D I X F I G U R E A
Replication of the occupation coding crosswalk: Occupation employment share comparisonbetween Acemoglu and Autor (2011) and our data, 1973–2009
Source: Authors’ analysis of Current Population Survey Outgoing Rotation Group microdata Acemoglu/Autor data
provided on David Autor’s website among the files used to create Figure 12 for Acemoglu /Autor (2011), located here:
http://economics.mit.edu/~dautor/hole-vol4/figs/fig-12-rev.zip
BESbswyBESbswyBESbswyBESbswyBESbswyBESbswyBESbswyBESbswyBESbswyBESbswyBESbswyBESbswyBESbswyBESbswyBESbswyBESbswyBESbswyBESbswyBESbswyBESbswyBESbswyBESbswyBESbswyBESbswyBESbswyBESbswyBESbswyBESbswyBESbswyBESbswyBESbswyBESbswyBESbswyBESbswyBESbswyBESbswyBESbswyBESbswyBESbswyBESbswyBESbswyBESbswyBESbswyBESbswyBESbswyBESbswyBESbswyBESbswyBESbswyBESbswyBESbswyBESbswyBESbswyBESbswyBESbswyBESbswyBESbswyBESbswyBESbswyBESbswyBESbswyBESbswyBESbswyBESbswyBESbswyBESbswyBESbswyBESbswyBESbswyBESbswy