Embed Size (px)
Citation preview
British Journal of Marketing Studies
Vol.4, No.4, pp.61-73, July 2015
___Published by European Centre for Research Training and Development UK (www.eajournals.org)
61 ISSN 2055-0111(Print), ISSN 2055-012X(Online)
ASSESSING THE EFFICIENCY OF SOYA BEAN MARKETING IN THE EJURA-
SEKYEDUMASI AND NKORANZA SOUTH DISTRICTS OF GHANA
Frimpong E1, Boamah E.A1, Dittoh J.S2, Gandhi S.K1, Kusi A.E1 and Owusu, V 1
1 Department of Agricultural Economics, Agribusiness and Extension, Kwame Nkrumah
University of Science and Technology, Kumasi, Ghana 2 Department of Food and Climate Change, University for Development Studies, Tamale,
Ghana
ABSTRACT: The study aimed at assessing the efficiencies of soya bean marketing channels
in the Ejura-Sekyedumasi and Nkoranza South Districts, Ghana. The multi-stage sampling
technique was employed in selecting thirty-seven soya bean farmers, two wholesalers, seven
retailers, two small-scale processors and one large-scale processor of soya beans for the study.
Gross Margin analysis was employed in determining the marketing costs and margins whereas
the Shepherd’s Method was used in analyzing the efficiencies of the marketing channels. The
study revealed that nine different channels existed through which soya bean was marketed in
the study areas, with the simplest channel (Channel 1) being where farmers sell directly to
consumers. Analysis of marketing cost and margins revealed that comparatively, Channel 1
had the least cost (GH₵2.40) and margins (GH₵10.50) since farmers dealt directly with
consumers without any interference from market intermediaries, who usually increase
transaction cost. From the study, Channel 1 was the most efficient channel with an Efficiency
Index of 37.71. Thus, its marketing cost constituted a smaller proportion of the consumer price.
The study recommends that farmers use Channel 1 where they sell directly to consumers to
market their produce and also form co-operatives to protect them against price fluctuation and
give them assurance of buyers. Moreso, the central government is directed to intervene in the
form of road construction and improvement to help reduce the excessive transportation cost
associated with the soya bean trade in Ghana
KEYWORDS: Efficiency, Soya Bean, Marketing, Marketing Channel, Ghana
INTRODUCTION
Agricultural marketing is of much relevance to agricultural production. (Olukosi and Isitor,
1990). It involves market structures/systems, marketing channels/chains, market participants,
marketing functions and risks and market information (Ibid). The marketing channels are the
pathways through which an agricultural commodity passes from the producer to the consumer
whilst the market participants are the market agents performing various marketing functions at
each stage of the chain (Ibid). In Ghana, the marketing of introduced agricultural commodities
such as soya beans is still not fully developed. More emphasis is usually placed on policies to
increase food production with little or no consideration on how to distribute the food produced
efficiently and in a manner that will enhance increased productivity (Aidoo et al., 2012).
According to Gage et al. (2012), producers of soya bean have been experiencing frustration
due to producing the bean without much regards to the local marketing systems. In a study by
Chigabatia (2007), the Managing Director of Savanna Farmers Marketing Company, Ghana,
she stated: that “farmers have all along been supported with extension services with the view
that that would help farmers to improve upon their incomes, but after twenty or more years,
those activities in terms of just extension services did not translate into improved incomes for
the farmers, and the missing link, was marketing”. Further, most marketing operations mainly
British Journal of Marketing Studies
Vol.4, No.4, pp.61-73, July 2015
___Published by European Centre for Research Training and Development UK (www.eajournals.org)
62 ISSN 2055-0111(Print), ISSN 2055-012X(Online)
pre- and post-harvest activities are generally poorly performed. Added, transport methods are
outdated and packing containers are much unsuitable (Ibid). The points of unloading and
loading are unsuitable and this grants access to pilfering and burglary (Ibid). In effect, high
post-harvest losses are recorded. It is estimated that more than 28 percent of soya bean produce
in Ghana are wasted and lost through poor post-harvest operations (Atiim, 2011). These
inefficiencies result in consumers paying an exorbitant price for produce whereas the producers
receives a very low price for their production making marketing channels less efficient, hence,
very uncompetitive (Galor, 1990).
The study is therefore aimed at assessing the efficiencies of soya bean marketing channels in
the Ejura-Sekyedumasi and Nkoranza South Districts. Specifically, the study seeks to
determine the various channels through which soya bean marketing takes place in the study
areas, undertake cost and marketing margin analysis along the various marketing channels,
compute marketing efficiencies and suggest possible means of strengthening the soya bean
marketing channels.
LITERATURE REVIEW
Soya bean (Glycine max, L), is a multifarious plant with its uses and benefits transcending
beyond agriculture to include the health and industrial sectors. The seed is the richest in food
value of all plant foods consumed in the world (Osho, 1995). Health wise, soya beans help in
the prevention and treatment of chronic diseases such as heart ailments, osteoporosis, cancer,
kidney ailments and menopausal syndromes (Myaka, 1990). Its industrial uses include the
manufacturing of glycerin, inks, margarine, vegetable oil, paints, varnishes, linoleum;
antibiotics etc. (www.nda.agric.za, October, 2012). In Ghana, soya bean was introduced in the
year 1910 and this was to get farmers to grow the crop as an additional food item and as an
export crop for England (Plahar, 2006). Wonderful food recipes prepared from soya beans in
Ghana includes koko (porridge), soup, milk etc. (Atiim, 2011).
Global production of Soya bean was over 250 million MT in 2010, rising at a Compound
Annual Growth Rate (CAGR) of 4.4 percent between 1991 and 2010 (FAOSTAT), yet,
Africa’s contribution to global soya trade is only 1 percent, with the greatest contributor being
Nigeria, keenly followed by South Africa and Uganda (Sanginga et al., 2003). In Ghana,
production between the years 2003 to 2005 amounted to 118,103 MT (Martin, 2006). The
country’s soya bean producing regions include the Northern, Upper East, Upper West, Volta,
Brong Ahafo and the Ashanti Region. The Ghanaian soya bean sector is dominated by small
scale farmers with only a few commercial producers such as Adventist Development and Relief
Agency (ADRA), Irrigation Company of Upper Region (ICOUR) Limited, Savanna
Agricultural Research Institute (SARI), Crop Research Institute (CRI), and Ejura Farms
(Adade, 2006). Indigenous varieties of soya are still used by the local farmers and these are the
late maturing and shattering types such as the Anidaso, Bengbie, Salintuya, Nakpanduri, except
Jenguma and Quarshie, the non-shattering types developed by SARI (Plahar, 2006).
Soya bean has a well-established and growing global market. According to USDA (2011),
approximately 35 percent of global soya bean production was traded in bean form with only
34 percent and 24 percent traded in soya bean meal and oil respectively between the years of
2009 and 2010. Ghana’s soya bean market is highly driven by the poultry industry. More than
100,000MT of soya bean meal is demanded annually by the poultry industry. The vegetable oil
market in Ghana comprises soya bean oil and palm oil, with the latter dominating the market.
Although the Ghanaian vegetable oil is dominated by palm oil, major stakeholders in the
British Journal of Marketing Studies
Vol.4, No.4, pp.61-73, July 2015
___Published by European Centre for Research Training and Development UK (www.eajournals.org)
63 ISSN 2055-0111(Print), ISSN 2055-012X(Online)
market attest to the fact that properly refined and bottled soya bean oil for the consumption
market will command a premium of about 15 percent to 20 percent above similarly packaged
and marketed palm (Gage et al., 2012).
Marketing of agricultural commodities has been defined in various concepts and descriptions
as the number of specialist and authors in the field. Galor (1990) stated that there is only
agreement in principle as to the definition and role of marketing. He argues that production and
marketing both require a chain of services, so that there is no clear-cut distinction, as to where
one ends and the other begins. Courtland and John (1992) defined marketing as the process of
planning and executing conception, pricing, promotion and the distribution of ideas, goods and
services to create exchanges that satisfy individual and organizational objectives. Kohls and
Uhl (1990) saw marketing in a broad perspective. They said marketing is the performance of
all business activities involved in the flow of food products from the point of initial agricultural
production until they are in the hands of the final consumer. They argue that agricultural
marketing starts with the conception and development of goods, services and ideas and then
channeling them to the market for purchase by buyers. They considered pricing and promotion
of these goods and services as a facilitative function performed by market intermediaries.
This study adopted Kohls and Uhl (1990) definition of agricultural marketing since it exposes
the activities involved in agricultural marketing and does not limit marketing to only the non –
farm activities in the food industry. Thus, agricultural marketing is viewed as the flow of
agricultural products and services from producers to consumers through the interplay of market
participants. These participants are those people and firms that facilitate the movement of
products from the producer to the final consumer (Beierlein and Michael, 1991). They are
mainly wholesalers, retailers, brokers, manufacturers’ representatives and sale agents that
specialize in performing various marketing functions involved in the purchase and sale of
foods. They are known as middlemen or market intermediaries (Kohls and Uhl, 1990)
According to Baker (1981), the various operations carried out in the movement of a produce to
the final consumer is termed marketing function. He explains that marketing functions are
major specialized activities performed in accomplishing the marketing processes of
concentration, equalization and dispersion. Kerin et al., (1992) divided marketing functions
into three basic categories, namely the transactional functions: buying and selling and
marketing risks; the logistics functions: assorting, storing and transportation and finally the
facilitating functions comprising financing, grading and market information and research.
These marketing functions are performed by intermediaries in definite routes or pathways for
every commodity. The pathways through which commodities are traded are termed as
marketing channels. Sarfo (1982) suggested that the greater or longer the channel, the higher
the consumer price. This is due to high cost of transportation, handling charges and the risks
involved in the handling of agricultural produce because of its high perishability. In the
simplest marketing channel, producers sell directly to consumers (Kwarteng and Towler,
1994).
Marketing channels differ in the number of intermediaries and the efficiency levels. Efficiency
of marketing channel, as defined by Olukosi and Isitor (1990) is the value added by marketing
activities (market margins) as a percentage of the costs incurred in marketing. Thus, Efficiency
of marketing channels depends directly on the relationship between marketing costs and
margins of the intermediaries or players in a given channel. Marketing cost are the costs
incurred by channel players in moving a produce from one stage to the other whereas the
British Journal of Marketing Studies
Vol.4, No.4, pp.61-73, July 2015
___Published by European Centre for Research Training and Development UK (www.eajournals.org)
64 ISSN 2055-0111(Print), ISSN 2055-012X(Online)
marketing margins are the difference in the actual prices paid by the consumer and the prices
received by the farmer for an equivalent quantity of the produce.
METHODOLOGY
The research was conducted in both the Ejura-Sekyedumasi and Nkoranza South Districts
which are in Ashanti and Brong Ahafo regions respectively. The districts were purposively
selected since they are the main soya bean growing areas in the southern part of the country.
The districts were stratified into four strata on the basis of geography (Northern stratum,
Southern stratum, Western stratum and Eastern stratum); out of which five communities were
then selected at random from each stratum. The farmers were then selected at random from
each community. The other channel members (wholesalers, retailers and processors) were
identified through the farmers. Both primary and secondary data were used in this study. In the
analysis of data, the study employed a combination of descriptive and inferential statistics. The
marketing margins of the channel players were determined using Gross Margin Analyses where
the price paid by the first buyer is deducted from the price paid by the final buyer, computed
as:
Gross Marketing Margin = Price paid by final buyer – Price paid by the first buyer
The Shepherd’s Method was employed in computing the marketing efficiency for the different
channels identified in the study areas and this is denoted as follows:
Shepherd’s Method: ME = (V / I) – 1
Where: ME: Marketing Efficiency Index
V: Consumer Price
I: Total Marketing Cost of Channel
The constraints facing channel actors with respect to marketing their produce were
accumulated, evaluated and ranked according to the most pressing.
RESULTS AND DISCUSSION
Marketing Channels of Soya bean
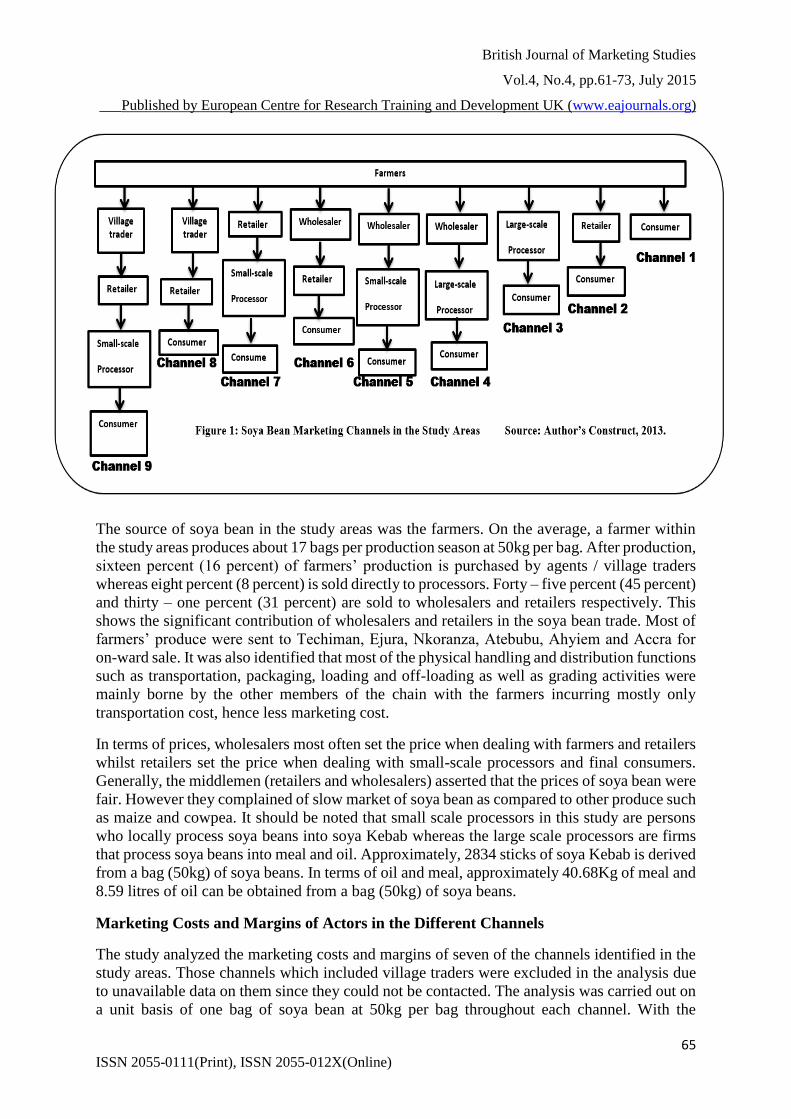
Figure 1 presents the nine different marketing channels identified in the study areas through
which soya bean is marketed. It is evident from the figure that the shortest channel is Channel
1 where farmers sell produce directly to consumers whereas the longest is Channel 9 where
farmers sell produce to village traders who in turn sell to retailers, then to small scale processors
and finally to consumers for consumption.
British Journal of Marketing Studies
Vol.4, No.4, pp.61-73, July 2015
___Published by European Centre for Research Training and Development UK (www.eajournals.org)
65 ISSN 2055-0111(Print), ISSN 2055-012X(Online)
The source of soya bean in the study areas was the farmers. On the average, a farmer within
the study areas produces about 17 bags per production season at 50kg per bag. After production,
sixteen percent (16 percent) of farmers’ production is purchased by agents / village traders
whereas eight percent (8 percent) is sold directly to processors. Forty – five percent (45 percent)
and thirty – one percent (31 percent) are sold to wholesalers and retailers respectively. This
shows the significant contribution of wholesalers and retailers in the soya bean trade. Most of
farmers’ produce were sent to Techiman, Ejura, Nkoranza, Atebubu, Ahyiem and Accra for
on-ward sale. It was also identified that most of the physical handling and distribution functions
such as transportation, packaging, loading and off-loading as well as grading activities were
mainly borne by the other members of the chain with the farmers incurring mostly only
transportation cost, hence less marketing cost.
In terms of prices, wholesalers most often set the price when dealing with farmers and retailers
whilst retailers set the price when dealing with small-scale processors and final consumers.
Generally, the middlemen (retailers and wholesalers) asserted that the prices of soya bean were
fair. However they complained of slow market of soya bean as compared to other produce such
as maize and cowpea. It should be noted that small scale processors in this study are persons
who locally process soya beans into soya Kebab whereas the large scale processors are firms
that process soya beans into meal and oil. Approximately, 2834 sticks of soya Kebab is derived
from a bag (50kg) of soya beans. In terms of oil and meal, approximately 40.68Kg of meal and
8.59 litres of oil can be obtained from a bag (50kg) of soya beans.
Marketing Costs and Margins of Actors in the Different Channels
The study analyzed the marketing costs and margins of seven of the channels identified in the
study areas. Those channels which included village traders were excluded in the analysis due
to unavailable data on them since they could not be contacted. The analysis was carried out on
a unit basis of one bag of soya bean at 50kg per bag throughout each channel. With the
British Journal of Marketing Studies
Vol.4, No.4, pp.61-73, July 2015
___Published by European Centre for Research Training and Development UK (www.eajournals.org)
66 ISSN 2055-0111(Print), ISSN 2055-012X(Online)
exception of Channel 1, farmers in the other channels did not bear marketing costs since all
their produce were purchased at the farm gate.
Table 1 shows the marketing costs and margins of the actors in the different marketing
channels. In channel 1 where farmers sold produce directly to consumers, it was realized that
the average value of one bag of soya beans (50kg) was found to be GH₵ 92.90 in the main
district markets whilst the average cost of produce at the farm gate was GH₵80.00. Thus,
farmers who sold their produce at the district markets obtained a gross margin of GH₵12.90
per one bag of soya beans more than farmers who sold soya bean at the farm gate. However,
an average cost of GH₵2.40 was incurred on various activities that got the produce onto the
market. Farmers realized a net marketing margin of GH₵ 10.50 per one bag of soya bean sold
in the market by them.
It is evident from Table 1 that the active actors in Channel 2 are farmers and retailers only. In
this channel, a unit bag of soya bean was sold at GH¢80.00 at the farm gate whilst at the retail
market it sold at GH¢122.90. Retailers in Channel 2 made gross margins of GH¢42.90 per unit
bag of soya bean. Marketing costs in this channel were borne only by retailers. A typical retailer
in Channel 2 incurs averagely GH¢5.90 as marketing cost and earned GH¢37.00 as net
marketing margins appropriately, as shown in Table 1.
Table 1 shows that in Channel 3, farmers produce are sold at the farm gates to large scale
processors who in turn process the produce into meal and oil for sale to consumers. It reveals
that in channel 3, a unit bag of soya bean was sold at GH¢72.50 at the farm gate. Large scale
processors in this channel made gross margins of GH¢65.40 and incurred GH¢7.80 as
marketing costs in the soya bean trade. They however earned a net marketing margin of
GH¢57.60.
In channel 4 farmers sold their produce at the farm gate to wholesalers who in turn moved the
produce to the premises of large scale processors for further processing into meal and oil. It
should be noted that averagely, a bag (50kg) of soya bean generate 40.68kg of meal and 8.59
litres of oil. From the table in channel 4, a bag of soya beans was sold at GH₵80.00 at the farm
gate whilst at the wholesale market it was sold at GH₵95.00. Wholesalers and Large scale
processors made gross margins of GH₵15.00 and GH₵42.90 per unit bag of soya beans
respectively, implying that large scale processors in this channel earned more gross margins
than wholesalers. In Channel 4, wholesalers and large scale processors incurred GH₵6.70 and
GH₵4.70 as marketing cost respectively, implying that wholesalers in this channel incurred
more marketing costs than large scale processors. In terms of net marketing margins,
wholesalers had the least margins (GH¢8.30) whilst the large scale processors had the highest
margins (GH¢38.20) due to large scale processors minimizing their marketing costs
considerably.
British Journal of Marketing Studies
Vol.4, No.4, pp.61-73, July 2015
___Published by European Centre for Research Training and Development UK (www.eajournals.org)
67 ISSN 2055-0111(Print), ISSN 2055-012X(Online)
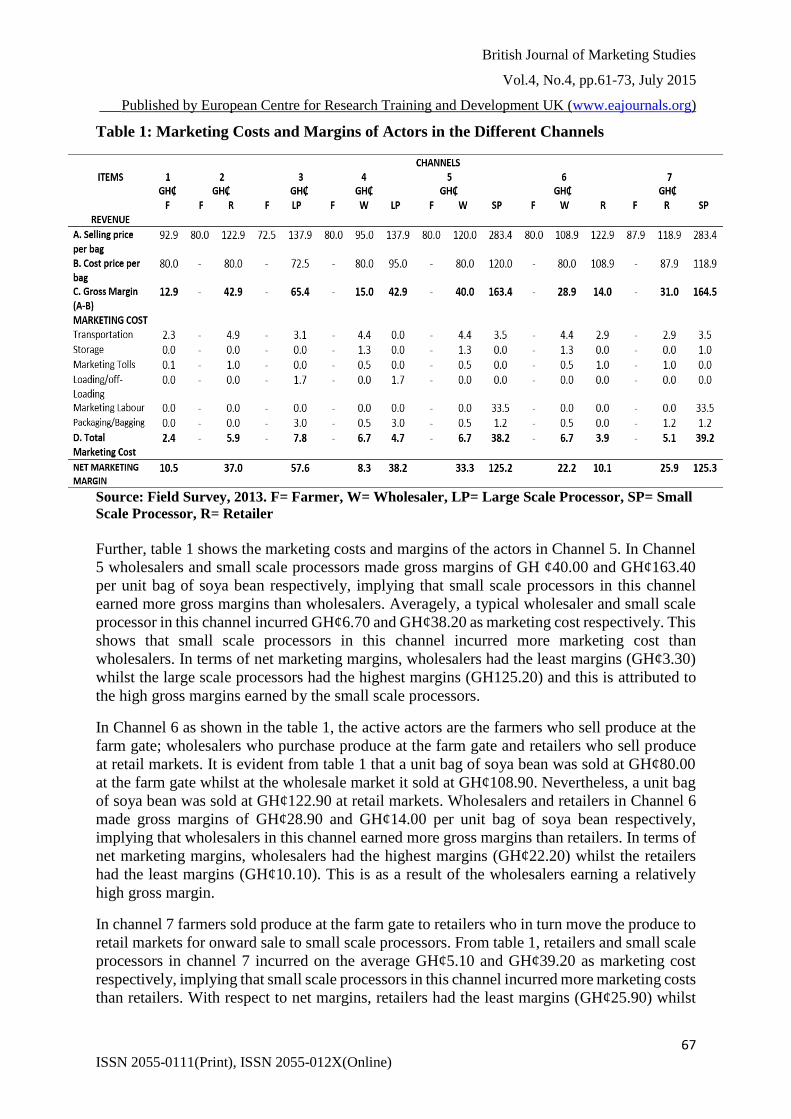
Table 1: Marketing Costs and Margins of Actors in the Different Channels
Source: Field Survey, 2013. F= Farmer, W= Wholesaler, LP= Large Scale Processor, SP= Small
Scale Processor, R= Retailer
Further, table 1 shows the marketing costs and margins of the actors in Channel 5. In Channel
5 wholesalers and small scale processors made gross margins of GH ¢40.00 and GH¢163.40
per unit bag of soya bean respectively, implying that small scale processors in this channel
earned more gross margins than wholesalers. Averagely, a typical wholesaler and small scale
processor in this channel incurred GH¢6.70 and GH¢38.20 as marketing cost respectively. This
shows that small scale processors in this channel incurred more marketing cost than
wholesalers. In terms of net marketing margins, wholesalers had the least margins (GH¢3.30)
whilst the large scale processors had the highest margins (GH125.20) and this is attributed to
the high gross margins earned by the small scale processors.
In Channel 6 as shown in the table 1, the active actors are the farmers who sell produce at the
farm gate; wholesalers who purchase produce at the farm gate and retailers who sell produce
at retail markets. It is evident from table 1 that a unit bag of soya bean was sold at GH¢80.00
at the farm gate whilst at the wholesale market it sold at GH¢108.90. Nevertheless, a unit bag
of soya bean was sold at GH¢122.90 at retail markets. Wholesalers and retailers in Channel 6
made gross margins of GH¢28.90 and GH¢14.00 per unit bag of soya bean respectively,
implying that wholesalers in this channel earned more gross margins than retailers. In terms of
net marketing margins, wholesalers had the highest margins (GH¢22.20) whilst the retailers
had the least margins (GH¢10.10). This is as a result of the wholesalers earning a relatively
high gross margin.
In channel 7 farmers sold produce at the farm gate to retailers who in turn move the produce to
retail markets for onward sale to small scale processors. From table 1, retailers and small scale
processors in channel 7 incurred on the average GH¢5.10 and GH¢39.20 as marketing cost
respectively, implying that small scale processors in this channel incurred more marketing costs
than retailers. With respect to net margins, retailers had the least margins (GH¢25.90) whilst
British Journal of Marketing Studies
Vol.4, No.4, pp.61-73, July 2015
___Published by European Centre for Research Training and Development UK (www.eajournals.org)
68 ISSN 2055-0111(Print), ISSN 2055-012X(Online)
the small scale processors had the highest margins (GH¢125.30), as shown in Table 1. This is
attributed to the relatively high gross margins earned by small scale processors.
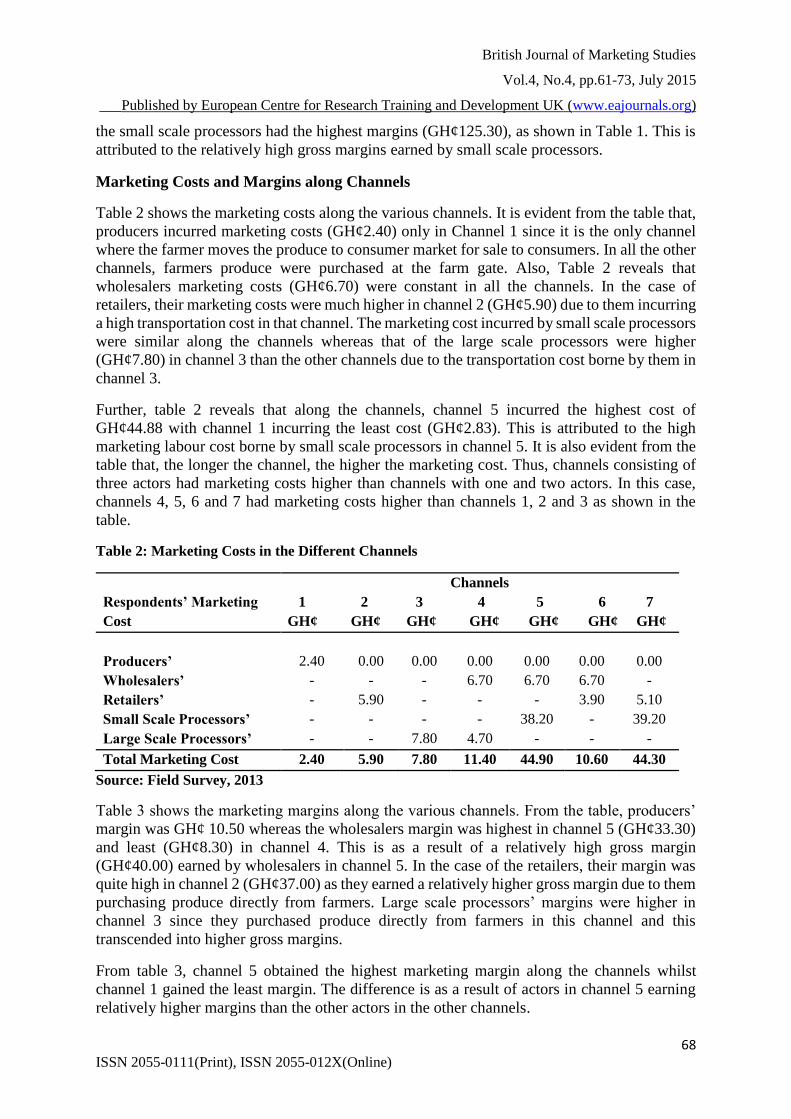
Marketing Costs and Margins along Channels
Table 2 shows the marketing costs along the various channels. It is evident from the table that,
producers incurred marketing costs (GH¢2.40) only in Channel 1 since it is the only channel
where the farmer moves the produce to consumer market for sale to consumers. In all the other
channels, farmers produce were purchased at the farm gate. Also, Table 2 reveals that
wholesalers marketing costs (GH¢6.70) were constant in all the channels. In the case of
retailers, their marketing costs were much higher in channel 2 (GH¢5.90) due to them incurring
a high transportation cost in that channel. The marketing cost incurred by small scale processors
were similar along the channels whereas that of the large scale processors were higher
(GH¢7.80) in channel 3 than the other channels due to the transportation cost borne by them in
channel 3.
Further, table 2 reveals that along the channels, channel 5 incurred the highest cost of
GH¢44.88 with channel 1 incurring the least cost (GH¢2.83). This is attributed to the high
marketing labour cost borne by small scale processors in channel 5. It is also evident from the
table that, the longer the channel, the higher the marketing cost. Thus, channels consisting of
three actors had marketing costs higher than channels with one and two actors. In this case,
channels 4, 5, 6 and 7 had marketing costs higher than channels 1, 2 and 3 as shown in the
table.
Table 2: Marketing Costs in the Different Channels
Respondents’ Marketing
Cost
Channels
1 2 3 4 5 6 7
GH¢ GH¢ GH¢ GH¢ GH¢ GH¢ GH¢
Producers’ 2.40 0.00 0.00 0.00 0.00 0.00 0.00
Wholesalers’ - - - 6.70 6.70 6.70 -
Retailers’ - 5.90 - - - 3.90 5.10
Small Scale Processors’ - - - - 38.20 - 39.20
Large Scale Processors’ - - 7.80 4.70 - - -
Total Marketing Cost 2.40 5.90 7.80 11.40 44.90 10.60 44.30
Source: Field Survey, 2013
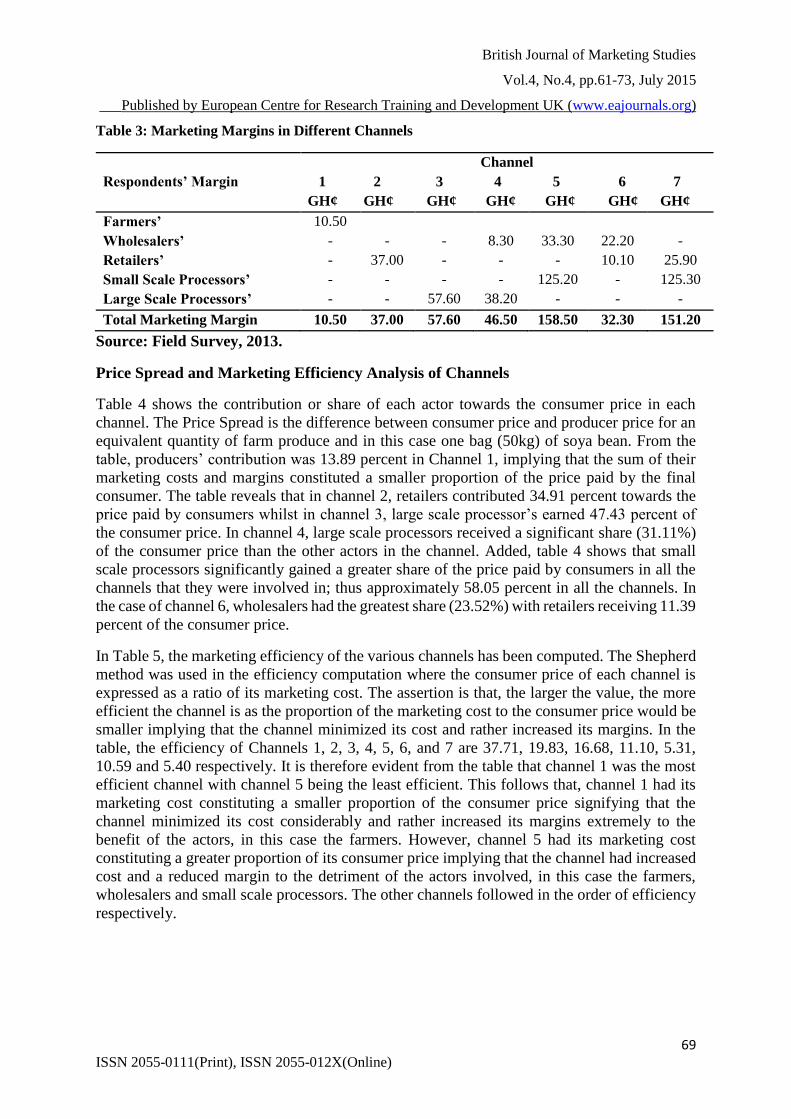
Table 3 shows the marketing margins along the various channels. From the table, producers’
margin was GH¢ 10.50 whereas the wholesalers margin was highest in channel 5 (GH¢33.30)
and least (GH¢8.30) in channel 4. This is as a result of a relatively high gross margin
(GH¢40.00) earned by wholesalers in channel 5. In the case of the retailers, their margin was
quite high in channel 2 (GH¢37.00) as they earned a relatively higher gross margin due to them
purchasing produce directly from farmers. Large scale processors’ margins were higher in
channel 3 since they purchased produce directly from farmers in this channel and this
transcended into higher gross margins.
From table 3, channel 5 obtained the highest marketing margin along the channels whilst
channel 1 gained the least margin. The difference is as a result of actors in channel 5 earning
relatively higher margins than the other actors in the other channels.
British Journal of Marketing Studies
Vol.4, No.4, pp.61-73, July 2015
___Published by European Centre for Research Training and Development UK (www.eajournals.org)
69 ISSN 2055-0111(Print), ISSN 2055-012X(Online)
Table 3: Marketing Margins in Different Channels
Respondents’ Margin
Channel
1 2 3 4 5 6 7
GH¢ GH¢ GH¢ GH¢ GH¢ GH¢ GH¢
Farmers’ 10.50
Wholesalers’ - - - 8.30 33.30 22.20 -
Retailers’ - 37.00 - - - 10.10 25.90
Small Scale Processors’ - - - - 125.20 - 125.30
Large Scale Processors’ - - 57.60 38.20 - - -
Total Marketing Margin 10.50 37.00 57.60 46.50 158.50 32.30 151.20
Source: Field Survey, 2013.
Price Spread and Marketing Efficiency Analysis of Channels
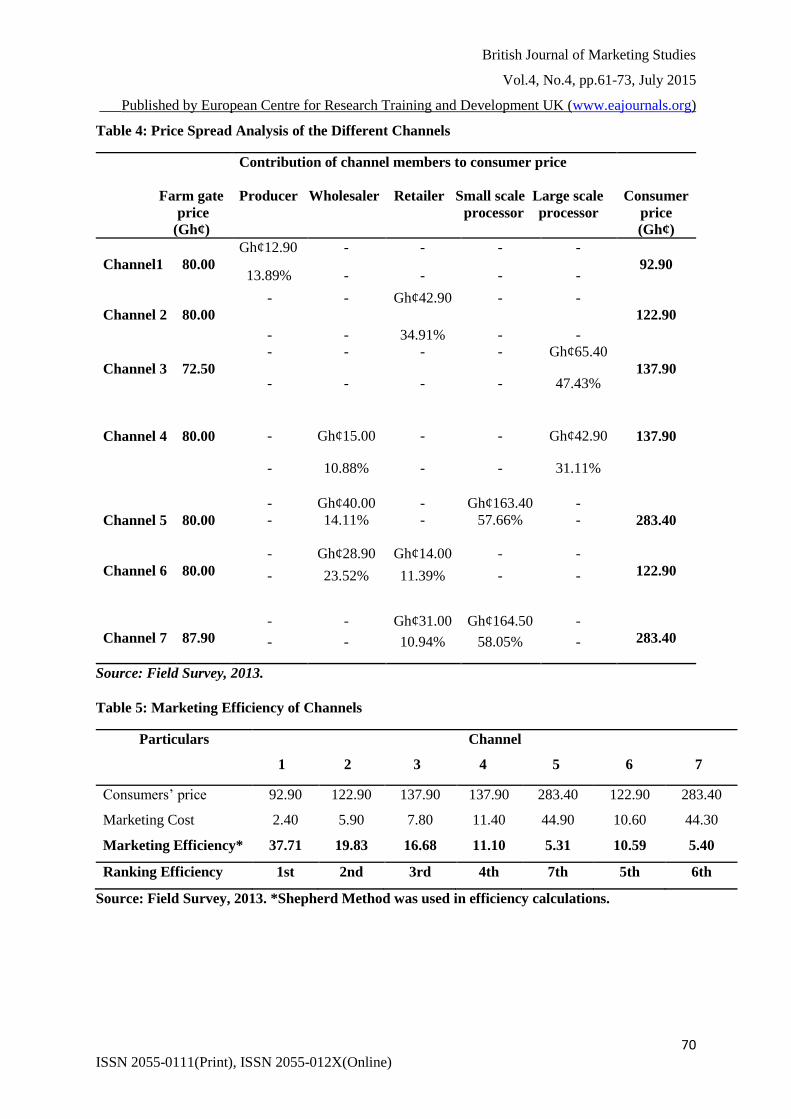
Table 4 shows the contribution or share of each actor towards the consumer price in each
channel. The Price Spread is the difference between consumer price and producer price for an
equivalent quantity of farm produce and in this case one bag (50kg) of soya bean. From the
table, producers’ contribution was 13.89 percent in Channel 1, implying that the sum of their
marketing costs and margins constituted a smaller proportion of the price paid by the final
consumer. The table reveals that in channel 2, retailers contributed 34.91 percent towards the
price paid by consumers whilst in channel 3, large scale processor’s earned 47.43 percent of
the consumer price. In channel 4, large scale processors received a significant share (31.11%)
of the consumer price than the other actors in the channel. Added, table 4 shows that small
scale processors significantly gained a greater share of the price paid by consumers in all the
channels that they were involved in; thus approximately 58.05 percent in all the channels. In
the case of channel 6, wholesalers had the greatest share (23.52%) with retailers receiving 11.39
percent of the consumer price.
In Table 5, the marketing efficiency of the various channels has been computed. The Shepherd
method was used in the efficiency computation where the consumer price of each channel is
expressed as a ratio of its marketing cost. The assertion is that, the larger the value, the more
efficient the channel is as the proportion of the marketing cost to the consumer price would be
smaller implying that the channel minimized its cost and rather increased its margins. In the
table, the efficiency of Channels 1, 2, 3, 4, 5, 6, and 7 are 37.71, 19.83, 16.68, 11.10, 5.31,
10.59 and 5.40 respectively. It is therefore evident from the table that channel 1 was the most
efficient channel with channel 5 being the least efficient. This follows that, channel 1 had its
marketing cost constituting a smaller proportion of the consumer price signifying that the
channel minimized its cost considerably and rather increased its margins extremely to the
benefit of the actors, in this case the farmers. However, channel 5 had its marketing cost
constituting a greater proportion of its consumer price implying that the channel had increased
cost and a reduced margin to the detriment of the actors involved, in this case the farmers,
wholesalers and small scale processors. The other channels followed in the order of efficiency
respectively.
British Journal of Marketing Studies
Vol.4, No.4, pp.61-73, July 2015
___Published by European Centre for Research Training and Development UK (www.eajournals.org)
70 ISSN 2055-0111(Print), ISSN 2055-012X(Online)
Table 4: Price Spread Analysis of the Different Channels
Farm gate
price
(Gh¢)
Contribution of channel members to consumer price
Producer Wholesaler Retailer Small scale Large scale
processor processor
Consumer
price
(Gh¢)
Channel1
80.00
Gh¢12.90 - - - -
92.90
13.89% - - - -
Channel 2
80.00
- - Gh¢42.90 - -
122.90
- - 34.91% - -
Channel 3
72.50
- - - - Gh¢65.40
137.90
- - - - 47.43%
Channel 4
80.00
-
Gh¢15.00
-
-
Gh¢42.90
137.90
- 10.88% - - 31.11%
Channel 5
80.00
- Gh¢40.00 - Gh¢163.40 -
283.40
- 14.11% - 57.66% -
Channel 6
80.00
- Gh¢28.90 Gh¢14.00 - -
122.90
- 23.52% 11.39% - -
Channel 7
87.90
- - Gh¢31.00 Gh¢164.50 -
283.40
- - 10.94% 58.05% -
Source: Field Survey, 2013.
Table 5: Marketing Efficiency of Channels
Particulars
Channel
1 2 3 4 5 6 7
Consumers’ price 92.90 122.90 137.90 137.90 283.40 122.90 283.40
Marketing Cost 2.40 5.90 7.80 11.40 44.90 10.60 44.30
Marketing Efficiency* 37.71 19.83 16.68 11.10 5.31 10.59 5.40
Ranking Efficiency 1st 2nd 3rd 4th 7th 5th 6th
Source: Field Survey, 2013. *Shepherd Method was used in efficiency calculations.
British Journal of Marketing Studies
Vol.4, No.4, pp.61-73, July 2015
___Published by European Centre for Research Training and Development UK (www.eajournals.org)
71 ISSN 2055-0111(Print), ISSN 2055-012X(Online)
Constraints Analysis
It was observed that farmers were faced with the most constraints with respect to their
marketing operations relative to the other players. Central among farmers’ constraints was low
prices received for their produce. This was the case since most farmers dealt individually with
the other channel actors. Added, farmers faced the challenge of low market, lack of access to
finance, poor harvesting methods, bad roads and high transportation costs.
Wholesaler indicated that they were faced with challenges such as high transportation cost,
seasonality of produce and high storage cost. On the part of small scale processors, high prices
of produce and limited supply of produce were identified as constraints facing them with
respect to their marketing operations. Large scale processors specified that they were faced
with challenges in the form of high prices of produce, unavailability of inputs and farmers’
unfaithfulness. They explained that farmers were unfaithful with market contract since after
their production, farmers tend to sell their produce to other parties rather than the large scale
processors, even though processors had supplied them with all required inputs for production.
CONCLUSION
The study revealed that nine different channel existed in the study areas through which soya
bean was marketed. The shortest channel was identified as Channel 1 where farmers sold
produce directly to consumers at consumer markets. Further, analysis of marketing costs
revealed that whilst small scale processors marketing costs were similar in almost all the
channels that they were involved in, the marketing costs of wholesalers were rather constant in
all the channels they actively involved themselves in. Retailers and large scale processors
earned a relatively higher cost in channels 2 and 3 respectively due to them bearing the
transportation costs in those channel. The study showed that channel 5 had the highest
marketing cost relative to the other channels due to the high cost of marketing labour borne by
this channel. Margin analysis indicated that farmers earned the least net margin as against
retailers who earned the highest net margins and the difference is as a result of the relatively
higher gross margins earned by retailers. In the same vain, channel 5 earned the highest net
margins compared to the other channels due to actors in channel 5 earning relatively higher
margins than others in the other channels.
Analysis of price spread revealed that channels 5 and 7 had the highest consumer price with
channel 1 having the least consumer price. This is attributed to the presence of small scale
processors in channels 5 and 7 who performed numerous marketing functions, bore the
necessary cost and hence earned the associated margins. Channel 1 where farmers sold produce
directly to consumers was identified as the most efficient marketing channel for marketing soya
beans in the study areas; thus it’s the channel that minimized its marketing cost considerably
and rather increased its margins extremely. Relatively, farmers were faced with numerous
constraints with respect to their marketing functions. Central among farmers’ constraints was
low prices of produce and low market.
British Journal of Marketing Studies
Vol.4, No.4, pp.61-73, July 2015
___Published by European Centre for Research Training and Development UK (www.eajournals.org)
72 ISSN 2055-0111(Print), ISSN 2055-012X(Online)
RECOMMENDATION
From the study, Farmers are encouraged to use channel 1, where they sell produce to consumers
directly in consumer markets, in marketing their produce since it’s the channel that farmers
will be better off in terms of margins. However, due to the difficulty in locating consumers
directly, they are strongly advised to form unions, co-operatives and farmer based
organizations to strengthen their bargaining power in their dealings with the other channel
actors. Moreso, farmers are directed to use strategies such as hedging and contract farming
when dealing with the other channel players to protect them against price fluctuations and also
give them assurance of buyers. Finally, the study recommends the central government’s
intervention in the form of road construction and improvement to help reduce the excessive
transportation cost associated with the soya bean trade in Ghana.
REFERENCES
Adade, J.K. (2006) Project Sweet Pea, Market Study On The Use Of Soy Products By The Food
Industry In Ghana. The World Initiative For Soy In Human Health (WISHH)
Aidoo R., Nimoh F., Bakang J.E.A., Ohene-Yankyera K., Fialor S. C., Mensah J.O. And
Abaidoo R.C. (2012): “Estimation Of Margins And Efficiency In The Ghanaian Yam
Marketing Chain”, Asian Journal Agriculture And Rural Development, Vol. 2, No.2,
Pp 226-234.
Atiim, P. (2011) Assessment Of Postharvest Losses In Soya Beans Production In The Builsa
District In The Upper East Region And Savelugu District In The Northern Region Of
Ghana.
Baker J.W. (1981): Agricultural Marketing, Oxford University Press, New York.
Beierlein, James G. and Michael, W. Woolverton (1991): Agribusiness Marketing, The
Management Perspective. Prentice Hall, New Jersey.
Chigabatia Janet (2007): Interview With Africa Report TV Documentary.
Courtland, L. Bovee and John, V. Thill (1992): Marketing, Published by McGraw-Hill
Professional, ISBN 10: 0070067341/ISBN 13: 9780070067349
Gage, D., Bangnikon, J., Abeka-Afari, H., Hanif, C., Addaquay, J., Antwi, Hale, A. (2012) The
Market For Maize, Rice, Soy And Warehousing In Northern Ghana. Publication
produced by USAID’s Enabling Agricultural Trade (EAT) Project, implemented by
Fintrac Inc.
Galor Zvi (1990) Marketing, Agricultural Produce and Marketing and Cooperating Marketing
in Traditional Rural Areas: The International Institute-Histadrut, Israel.
Kerin, R.A., Jain, A. and Howard, D.J. (1992) ‘Store Shopping Experience and Consumer
Price- Quality-Value Perceptions’, Journal Of Retailing 68(4): 376-97.
Kohls Richard L. and Uhl Joseph N. (1995): Marketing Of Agricultural Products. 7th Edition.
Macmillan Publishing Company, New York.
Kwarteng, J. A. and Towler, M. J. (1994) West African Agriculture. Macmillan Press Ltd.
London and Basingstoke
Martin, M (2006) Soy-A Global Overview.
www.wishh.org/workshops/int/ghana/ghana06/martin-o6.pdf (Accessed, February,
2013)
Myaka, F. A. (1990) Soyabean ‘The Golden Bean’. It’s present and future in Tanzania. In
Research and Training Newsletter, Vol. V No.4. Ministry of Agriculture, Livestock
Development and Cooperatives
British Journal of Marketing Studies
Vol.4, No.4, pp.61-73, July 2015
___Published by European Centre for Research Training and Development UK (www.eajournals.org)
73 ISSN 2055-0111(Print), ISSN 2055-012X(Online)
Olukosi, J. O. and Isitor, S.V. (1990) ‘Introduction to Agricultural Market and Price;
Principles and Applications’, Agitab publishers, Zaria. Pp34.
Osho, S.M. (1995) Soya Bean Processing and Utilization Research at International Institute
of Tropical Agriculture. Processing from SOYAFRICA’95: Johannesburg, South
Africa, 4- 5 October 1995. Association des Produits a Marche (APROMA)
CEE/ACP, 52, avenue Louis Lepoutre B1060 Bruxelles, Belgigue
Plahar, W. A., (2006) Overview of the Soya Bean Industry In Ghana.
www.wishh.org/workshops/intl/ghana/ghana06/plahar-06.pdf (Accessed, February,
2013)
Sanginga, P.C., Kaaria, S., Muzira, R., Delve, R. J., Kankwatsa, P., Kaganzi, E., Sangole, N.
and Pali, P. (2003) Adding Value To Soil Fertility Research With Participatory
Market Opportunities Identification: A Framework For Mainstreaming Market-Led
ISFM Research For Development. (Submitted to nutrient cycling in agro ecosystems)
Sarfo, A. (1982): Business Management Studies. Macmillan Press Limited.
USDA (2012) World Agricultural Supply and Demand Estimates (WASDA); October, 12,
2012. www.nda.agric.za; (Accessed, February, 2013)