Embed Size (px)
Citation preview
International Journal for the Scholarship ofTeaching and Learning
Volume 6 | Number 1 Article 14
1-2012
Assessing the Degree of Integrated Learner-Centered Instruction on Student Outcomes in aLarge Non-Major Environmental Science CourseRuthanne “Rudi” ThompsonUniversity of North Texas, [email protected]
Greta BolinUniversity of North Texas, [email protected]
Alice CoeUniversity of North Texas, [email protected]
Recommended CitationThompson, Ruthanne “Rudi”; Bolin, Greta; and Coe, Alice (2012) "Assessing the Degree of Integrated Learner-Centered Instructionon Student Outcomes in a Large Non-Major Environmental Science Course," International Journal for the Scholarship of Teaching andLearning: Vol. 6: No. 1, Article 14.Available at: https://doi.org/10.20429/ijsotl.2012.060114
Assessing the Degree of Integrated Learner-Centered Instruction onStudent Outcomes in a Large Non-Major Environmental Science Course
AbstractThe decision to employ learner-centered teaching methods, teacher-centered teaching methods, or whether tointegrate the two within large lecture halls in higher education continues to be heavily researched and hotlydebated. All, in one form or another, have been shown effective at varying levels, throughout a myriad ofdisciplines and across diverse cultures. Yet there are fewer quantitative studies assessing the effects ofimplementing varying degrees of integrated learner-centered methods within large classroom environments.To that end, this study compared two sections of an undergraduate non-major environmental science largelecture course. One section received a minimal degree of learner-centered (MLC) instruction (<5% classtime). A second section received a higher degree of learner-centered (HLC) instruction (>75% class time).Pre-test and post-test measures along with end-of-course grades were used to determine how student scoreswere affected by the degree of learner-centered instruction provided. Additionally, student evaluations werecompared for attitudinal information. Statistical tests did not demonstrate significant differences in studentscores or in student evaluations between the two groups. Yet this in itself is intriguing because: 1) the twoclasses were provided with different methods of post-testing; 2) the HLC class was provided with problem-based assignments while the MLC class was provided with multiple-choice ClickerTM questions; and 3) incontrast to much of the literature, this study found students’ evaluations of the MLC class were comparable tothose of the HLC class; potentially demonstrating a greater level of comfort/acceptance on the part of thestudents to higher degrees of learner-centered instruction. This work elaborates on the findings described hereand the potential implication of such findings on the evolution of best practices for large lecture classrooms.
KeywordsCollege teaching, Integrated learner-centered instruction, Large lecture courses
Assessing the Degree of Integrated Learner-Centered Instruction on Student
Outcomes in a Large Non-Major Environmental Science Course.
Ruthanne “Rudi” Thompson
Greta Bolin
Alice Coe [email protected] University
of North Texas Denton,
Texas, USA
Abstract
The decision to employ learner-centered teaching methods, teacher-centered teaching
methods, or whether to integrate the two within large lecture halls in higher education
continues to be heavily researched and hotly debated. All, in one form or another, have
been shown effective at varying levels, throughout a myriad of disciplines and across
diverse cultures. Yet there are fewer quantitative studies assessing the effects of
implementing varying degrees of integrated learner-centered methods within large
classroom environments. To that end, this study compared two sections of an
undergraduate non-major environmental science large lecture course. One section received a minimal degree of learner-centered (MLC) instruction (<5% class time). A second section
received a higher degree of learner-centered (HLC) instruction (>75% class time). Pre-test
and post-test measures along with end-of-course grades were used to determine how
student scores were affected by the degree of learner-centered instruction provided.
Additionally, student evaluations were compared for attitudinal information. Statistical tests
did not demonstrate significant differences in student scores or in student evaluations
between the two groups. Yet this in itself is intriguing because: 1) the two classes were
provided with different methods of post-testing; 2) the HLC class was provided with
problem-based assignments while the MLC class was provided with multiple-choice ClickerTM
questions; and 3) in contrast to much of the literature, this study found students’
evaluations of the MLC class were comparable to those of the HLC class; potentially
demonstrating a greater level of comfort/acceptance on the part of the students to higher
degrees of learner-centered instruction. This work elaborates on the findings described here
and the potential implication of such findings on the evolution of best practices for large
lecture classrooms. Keywords: college teaching, integrated learner-centered instruction, large lecture courses
Introduction
Since the mid-1930s, there has been a wealth of discourse concerning the use of learner-
centered and teacher-centered methodologies in K-16 learning environments (Angelo,
1997; Barr & Tagg, 1995; Berquist & Phillips, 1975; Bland et al., 2007; Burgan, 2006; Johnstone & Percival, 1976; Knight & Wood, 2005; Lord, 1997; Richardson, 2008). Often,
the two have been sharply contrasted with proponents found on one side of the debate or
1
IJ-SoTL, Vol. 6 [2012], No. 1, Art. 14
https://doi.org/10.20429/ijsotl.2012.060114
the other. Advocates of teacher-centered methods such as the lecture, have proffered positive effects of excellent lectures. Authors such as Burgan (2006), Bland et al., (2007)
and McKeachie and Svinicki (2006), posit that lectures conducted by exceptional lecturers
can be very beneficial as they are able to:
• Provide up-to-date information on current research in the field of study;
• Weave together and summarize related information from a variety of sources,
personal observations and research; • Model problem solving approaches and techniques; and
• Engage and motivate students to learn by imbuing their own passion for the subject.
In contrast, however, opponents of the lecture method site some less than positive effects
of the lecture including:
• Often serves as a one-way mode of communication;
• Encourages student passivity and student use of lower-order cognitive skills
(LOCS)(Zoller, 1993) such as rote memorization;
• Promotes poor attention and retention;
• Fails to engage students intellectually.
(Bligh, 2000; Bland et al., 2007; Kozma et al., 1978; Powell, 2003; Smith et al.,
2005; Crowe et al., 2008) On the other side, proponents of learner-centered methods such as inquiry-based learning
in which connections are made between prior knowledge and scientific descriptions of the
natural world (Panasan & Nuangchalerm, 2010); and problem-based or case-based learning
which, is the fundamental process of integrating basic science and clinical information
(DiLullo et al., 2009) have also proffered positive effects. Authors such as Cornelius-White, 2010; Ebert-May et al., 2008; Freeman et al., 2007; Felder & Brent, 1996; Hake, 1998;
Handelsman, 2004 & 2007, Knight & Wood, 2005; McKeachie, 1972; Prince & Felder, 2006;
and Udovic et al., 2002, posit that learner-centered methods can be very beneficial as they
are able to:
• Actively engage students and encourages student use of higher-order cognitive skills
(HOCS) (Zoller, 1993) in the subject of study;
• Improve students’ writing, thinking and problem-solving skills;
• Increase students’ retention of material; and
• Motivate students to apply their learning.
Yet opponents, along with more than a few advocates, of learner-centered methods also cite
the fact that:
• The methods themselves often do not translate into significantly improved learning
outcomes (Prince, 2004);
• Students find comfort in teacher driven lectures (Felder & Brent, 1996); and
• Students often show resistance to learner-centered methods (McKeachie, 1972;
Sorcinelli, 1991). As a case in point, in a more recent study, (Walker et al. 2008) teacher-centered methods
were again juxtaposed against learner-centered methods in a large introductory Biology
classroom at an equally large Minnesota university. Teacher-centered methods consisted of
lecture, unannounced quizzes, and multiple choice exams. In contrast, the learner-centered
section consisted of shortened lectures, ungraded group activities, unannounced quizzes,
2
Assessing the Degree of Integrated Learner-Centered Instruction
https://doi.org/10.20429/ijsotl.2012.060114
graded homework assignments, and multiple-choice exams. As with previous studies, the
results demonstrated only a small difference between the mean final percentage scores in
the direction of the learner-centered method (p.363). Additionally, as was found with other
studies, when the students were asked to evaluate the course and their instructors, the
scores were significantly higher in favor of the teacher-centered lecture section versus the
learner-centered section (p. 364). So, instead of asking “which method is better, teacher-
centered versus learner-centered,” maybe the question should be “can integrating learner-
centered methods into large lecture sections increase student scores?” Again, according to
a variety of studies, the answer to this question also appears to be yes (Ebert-May, Brewer,
& Allred, 1997; Huba & Freed, 2000; Allen & White, 2001; Donham, Schmieg, & Allen,
2001; Smith, Stewart, Shields, Hayes-Klosteridis, Robinson, & Yuan, 2005; Knight & Wood,
2006). Yet, like both teacher-centered and learner-centered methods, the integrated method also comes with an inherent set of issues.
One issue currently receiving a great deal of attention is the lack of reliable tools that can
effectively assess students’ use of higher-order cognitive skills (HOCs) (Crowe et al., 2008).
But another key issue also in need of attention centers on the amount or degree of
integrated learner-centered instruction provided in the large lecture classroom. According to
Allen and Tanner (2005), the most commonly used integrated techniques include asking
questions during lecture, using classroom technology for immediate feedback, allowing
students the opportunity to conduct projects and present their work, problem-based
learning, case studies, peer-led team learning, and modeling inquiry. But each of these
techniques varies in the degree of learner-centeredness allowed. In the first instance, asking questions during lecture, allows for a minimal degree of learner-centered instruction
leaving the bulk of instruction still to be delivered by lecture. In contrast, problem-based
learning and case studies rely much more heavily on the learner, significantly minimizing
lecture, and thus allowing for a higher degree of learner-centered instruction. Based on the research concerning teacher-centered, learner-centered and integrated
learner-centered instruction, student evaluations of learner-centered instruction, and the
recognition that the degree of learner-centered instruction proffered, varies. We wanted to
explore whether significant differences in test and/or semester scores would be evidenced
between two groups who were provided with contrasting degrees of learner-centered
instruction. Student success was measured via a pre-test/post-test, online assignments, in-
class assignments and end of course scores.
Methods and Materials
Purpose and Research Questions
The purpose of this study was to assess the effects (as measured by student scores and
course evaluations) of utilizing varying degrees of learner-centered instruction in a large
lecture undergraduate non-major environmental science course. The guiding research
questions were:
1. Will students who answer post-test questions in four unit exams given during the
semester score higher than students who answer post-test questions in a
comprehensive final exam?
2. Will students who receive a minimal degree of integrated learner-centered instruction
(MLC) achieve higher semester scores than students who receive a higher degree of integrated learner-centered instruction (HLC)?
3
IJ-SoTL, Vol. 6 [2012], No. 1, Art. 14
https://doi.org/10.20429/ijsotl.2012.060114
3. Will students be less receptive to the integration of a higher degree of learner-
centered (HLC) instruction into the large lecture classroom than students receiving a
minimal degree of learner-centered instruction (MLC)?
Context
The course used in this study, Environmental Science, is a 3-hour non-science major
elective course. The study was conducted at a large Texas public institution with more than 28,000 undergraduate students enrolled as of fall 2009. Since the inception of the course,
environmental science has been taught in a traditional teacher-centered, large-lecture
format, consisting of 1.5 hour Power PointTM based lectures delivered by science faculty twice per week. Along with most other large universities, however, in recent years we as faculty have been tasked with heeding the call to re-envision our large lecture courses so that they emphasize applications and connections and encourage student involvement and active participation in their own learning (American Association for the Advancement of Science, 1990; Boyer Commission on Education Undergraduates in the Research University,
1998; Cheney, 1989; Ebert-May et al. 1997; Hazen & Trefil, 1991; National Research
Council, 1996b, 1997, 1999a, 1999b, 2002a, 2003b; National Science Foundation, 1999;
Project Kaleidoscope, 2002; Smith et al., 2009; Springer et al., 1999; Sundberg et al. 1994;
Umbach et al., 2005; and Wilson, 1986). Thus, using the research on most effective
strategies (teacher-centered, learner-centered and integrated) for large lecture science
classrooms as our platform, we developed two large lecture environmental science sections,
each taught with a different degree of integrated learner-centered instruction to determine
if there would be a measurable effect on student outcomes. Sample
Students
Two classes or sections were used in this study; one group received minimal integrated
learner-centered (MLC) instruction (<5%) and another group received a higher degree of
integrated learner-centered (HLC) instruction (>75%). The MLC consisted of 211 students.
The HLC consisted of 82 students. Both groups were comprised of students who ranged,
academically, from first semester freshman to final semester seniors. The course schedule
did not denote any differences between the two sections. Section one was listed as ENV 1132.001, TR 12:30-1:50 pm and section two was listed as ENV 1132.002 TR 4:00-5:20
pm. Thus students were not assigned to either the MLC or HLC group but rather self
selected the course section that best fit their scheduling needs. In addition, all 293
students participated in a pre-test and no significant difference (Pearson product moment correlation, p=0.12) was found when comparing the results between the two groups.
Professors
The minimal degree of integrated learner-centered instruction section (MLC) was taught by
a distinguished teaching and research professor with 24 years teaching experience at the
collegiate level and historically high student evaluation ratings. The higher degree of
integrated learner-centered instruction section (HLC) was taught by a tenure-track assistant
teaching and research professor who has more than 20 years of teaching experience, 10 of
which are at the collegiate level, and equivalent student evaluation ratings. Structure To begin the semester, both professors required students to take an online pre-test. This
test was comprised of 146 multiple-choice questions and students were given a 2-hour
window in which to complete it. We chose multiple-choice testing because it has been
demonstrated as an efficient method to assess the depth and breadth of students’
4
Assessing the Degree of Integrated Learner-Centered Instruction
https://doi.org/10.20429/ijsotl.2012.060114
knowledge while not putting those with weak reading skills at a disadvantage (Epstein et al, 2002; Veeravagu et al, 2010). The results of the pre-test demonstrated that there was not
a significant difference between the two groups (p=0.12) as of the first day of class.
Additionally, both professors provided 3 office hours per week and had teaching assistants
who served as proctor/graders for 1-3 hours per week as needed. The requirements held constant for both MLC and HLC groups included:
• course text, Visualizing Environmental Science by Berg and Hager, 2009;
• course outline
• instruction around five concepts: nature of science; evolution and
ecosystems; pollution; resources; and action; • use of ClickersTM in the classroom
• student participation in laboratories and bi-weekly online homework
assignments; and • a large lecture hall with fixed seating for 230 students.
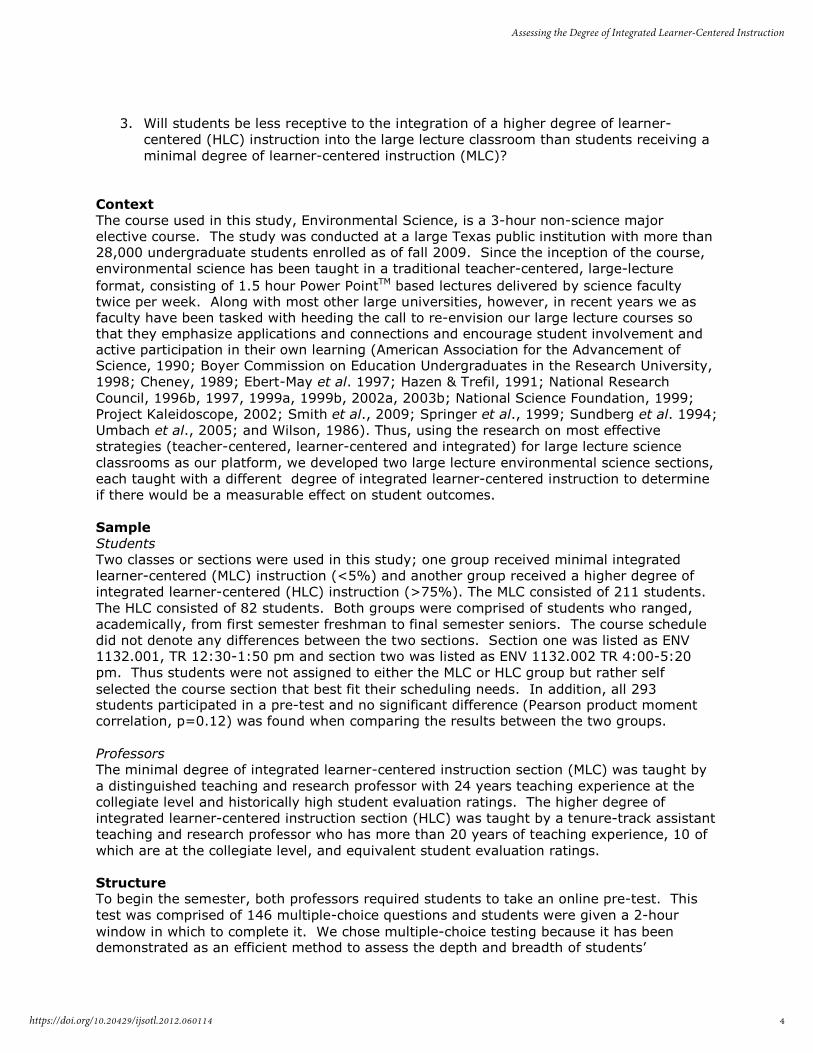
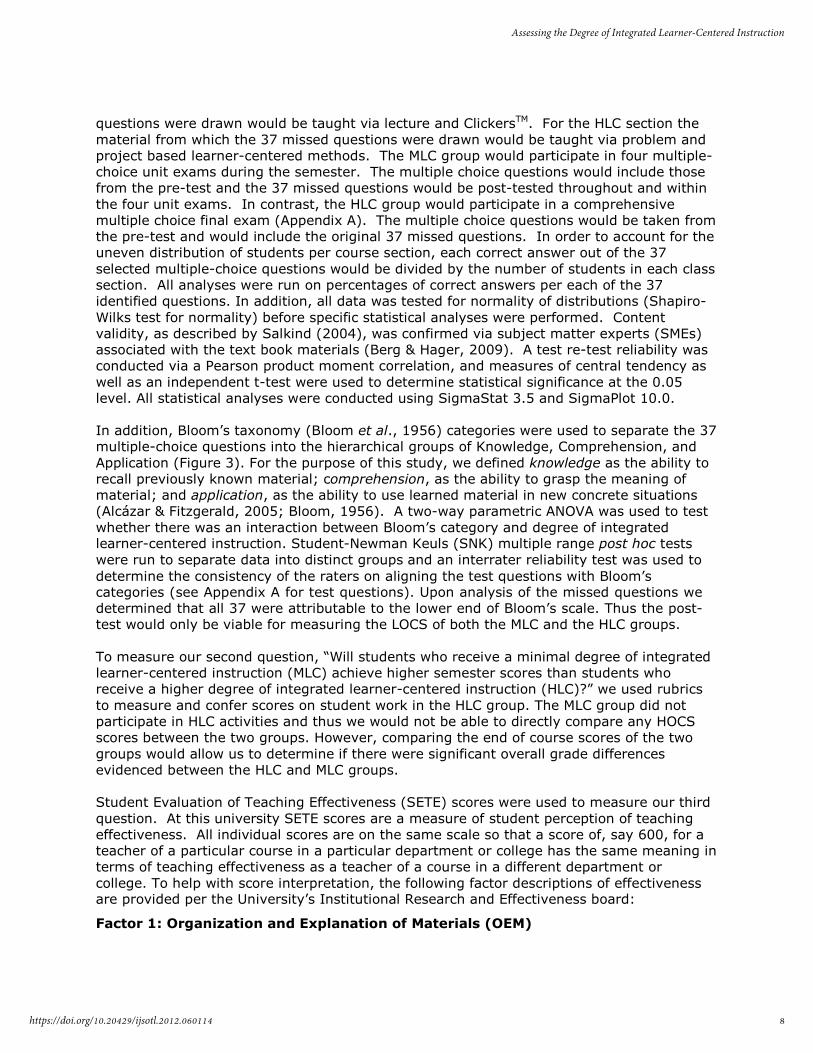
In addition to the above, the MLC group was provided with 1.5 hours of notes-based lectures twice per week for 16 weeks (see Figure 1). The minimal learner-centered method used
consisted of technology based ClickerTM questions proffered randomly throughout lectures. According to Zoller (1993), this type of lecture-oriented teaching methodology only engages students’ low-order cognitive skills (LOCS). Tests were graded by a proctor/grader and scores were posted on Blackboard Vista©.
Figure 1. Course Sections with Grade % Breakdown
5
IJ-SoTL, Vol. 6 [2012], No. 1, Art. 14
https://doi.org/10.20429/ijsotl.2012.060114
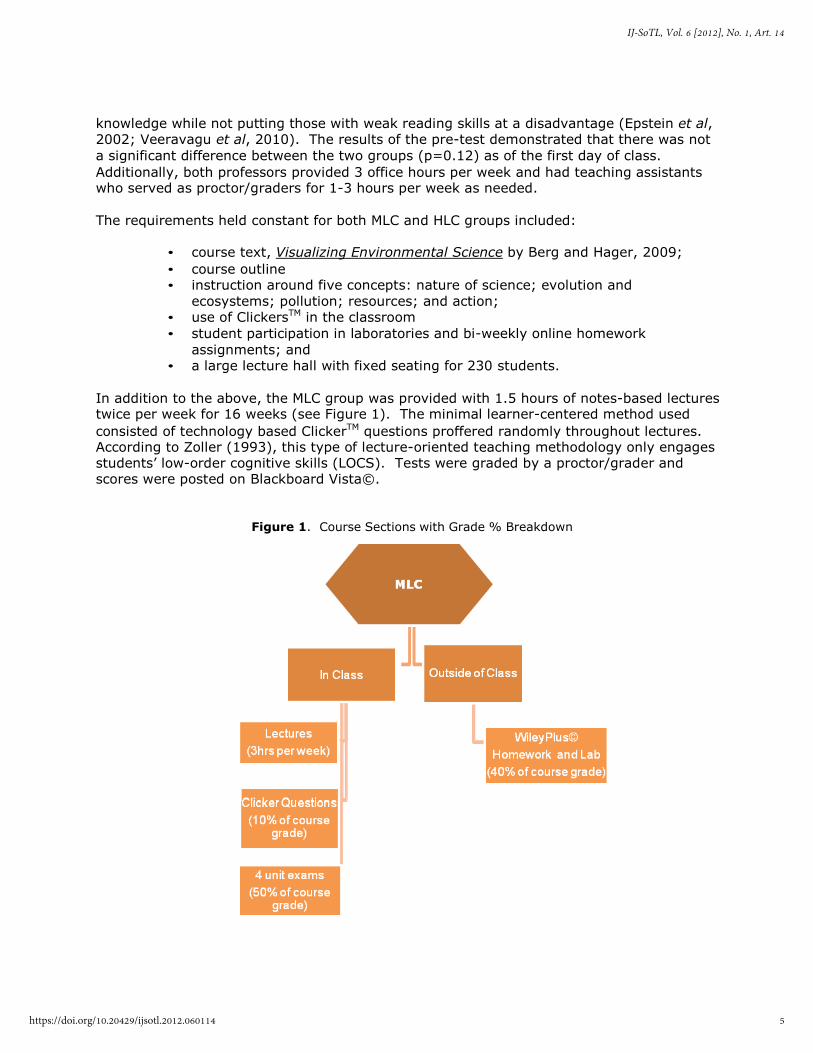
Figure 1. comparison of grading criteria between MLC and HLC class sections.
In addition to the constants listed above, the HLC group was provided with 30 minutes or
less of lecture twice per week for 16 weeks; structured graded in-class group activities; four
graded problem-based group projects/presentations; and an individual 6-week case study
(see Figure 1). Tests were graded by a proctor/grader; group projects were either peer-
graded and/or graded by the instructor; and written feedback was provided for each group
project and the individual 6-week case study. HLC Activities
In-class activities conducted throughout the semester were integrated with the lecture in
order to support or highlight specific key concepts being taught. In-class activities included
individual clicker questions, game-like activities where student groups experienced and
worked together to solve specific environmental problems, and time for group work on
projects/presentations. All activities were designed to actively engage students in
quantitative and qualitative conceptual questions which were previously unfamiliar to the
students. According to Zoller & Tsaparlis (1997) these types of activities engage students’
higher-order cognitive skills (HOCS) as they require the student to apply the abilities of
reasoning, decision-making, analysis, synthesis and critical thinking. The HLC activities
were designed based on the work of Ebert-May and Hodder (2008). Assessments were
premised on the work of Crowe, Dirks and Wenderoth (2008) who, in turn, use Bloom’s
Taxonomy of cognitive domains (Bloom et al., 1956) as their foundation. Rubrics were
provided to outline professor expectations for each activity assigned (see appendix B-D).
The graded group HLC activities included:
6
Assessing the Degree of Integrated Learner-Centered Instruction
https://doi.org/10.20429/ijsotl.2012.060114
1. The Nature of Science – Bloom’s Analysis
Activity: Scientific evidence. Students were provided with a research article on the
topic being discussed in lecture. The students were asked to work in their groups
inside and outside of class to discover and identify the steps of the scientific method
found within the article. Students submitted a written report of their findings
(Appendix B).
2. Resources – Bloom’s Synthesis Activity: Conceptualizing evidence. Groups were assigned a harmful chemical found
in the environment and were tasked with making a brochure that outlined the
potential risks associated with that chemical. Students submitted group brochure for
grading (Appendix C).
3. Action – Bloom’s Synthesis
Activity: The individual six-week project was to drive their car one day less per
week. Students were asked to provide details about their car, or their imaginary car
if they didn’t own one and driving habits in their blog space on Blackboard Vista©. Students were to blog weekly about their experience and for their final report they were to recount their six-week, including their analysis of carbon-offset, findings in a minimum 3-page report (Appendix D).
4. Evolution and Ecosystems - Bloom’s Evaluation
Activity: Comparing evidence. Groups were provided the opportunity to select sides
of an issue, work as a team in and outside of class to hone their side and then work
as a team in class to debate their group’s point of view. Students received peer-
evaluations on their presentations.
5. Pollution – Bloom’s Evaluation Activity: Interpreting evidence. Groups were provided with a research article on the
topic being discussed in lecture. The students were tasked with creating a structural
model (at least two graphs), which described a pattern or data-based relationship
they were able to extract from the article. Students submitted their models for grading.
Measures The measure for our first question, “Will students who answer post-test questions in four
unit exams given during the semester score higher than students who answer post-test
questions in a final comprehensive exam?” consisted of pre-test/post-test assessments.
The pre-test was drawn from a test bank which was derived directly from the learning
objectives set forth by the course text, Visualizing Environmental Science (Berg & Hager,
2009). Through Wiley Inc., learning objectives for each chapter were given to a panel of
Subject Matter Experts (SMEs) who were tasked with developing measurable assessments for each content module based on Bloom’s Taxonomy (Bloom et al., 1956). This
information was issued through proprietary documents released by Wiley Inc., the text-book publisher, and served as a guideline for the SMEs associated with the text materials. All
text-book materials were thoroughly reviewed and edited by SMEs, faculty and students
(Berg & Hager, 2009). To establish a baseline for comparison between the pre-test and post-test scores, the pre-
test scores were analyzed. The results demonstrated that of the original 146 pre-test
questions, all 293 participants missed 37 questions. Thus questions excluded from the study were those questions that received the highest percentage of correct answers as evidenced
by the pre-test. Both professors agreed that the material for the 37 missed questions would
be taught via MLC or HLC methods. For the MLC section the material from which the 37
7
IJ-SoTL, Vol. 6 [2012], No. 1, Art. 14
https://doi.org/10.20429/ijsotl.2012.060114
questions were drawn would be taught via lecture and ClickersTM. For the HLC section the
material from which the 37 missed questions were drawn would be taught via problem and
project based learner-centered methods. The MLC group would participate in four multiple-
choice unit exams during the semester. The multiple choice questions would include those
from the pre-test and the 37 missed questions would be post-tested throughout and within
the four unit exams. In contrast, the HLC group would participate in a comprehensive
multiple choice final exam (Appendix A). The multiple choice questions would be taken from
the pre-test and would include the original 37 missed questions. In order to account for the
uneven distribution of students per course section, each correct answer out of the 37
selected multiple-choice questions would be divided by the number of students in each class
section. All analyses were run on percentages of correct answers per each of the 37
identified questions. In addition, all data was tested for normality of distributions (Shapiro-
Wilks test for normality) before specific statistical analyses were performed. Content
validity, as described by Salkind (2004), was confirmed via subject matter experts (SMEs)
associated with the text book materials (Berg & Hager, 2009). A test re-test reliability was
conducted via a Pearson product moment correlation, and measures of central tendency as
well as an independent t-test were used to determine statistical significance at the 0.05
level. All statistical analyses were conducted using SigmaStat 3.5 and SigmaPlot 10.0.
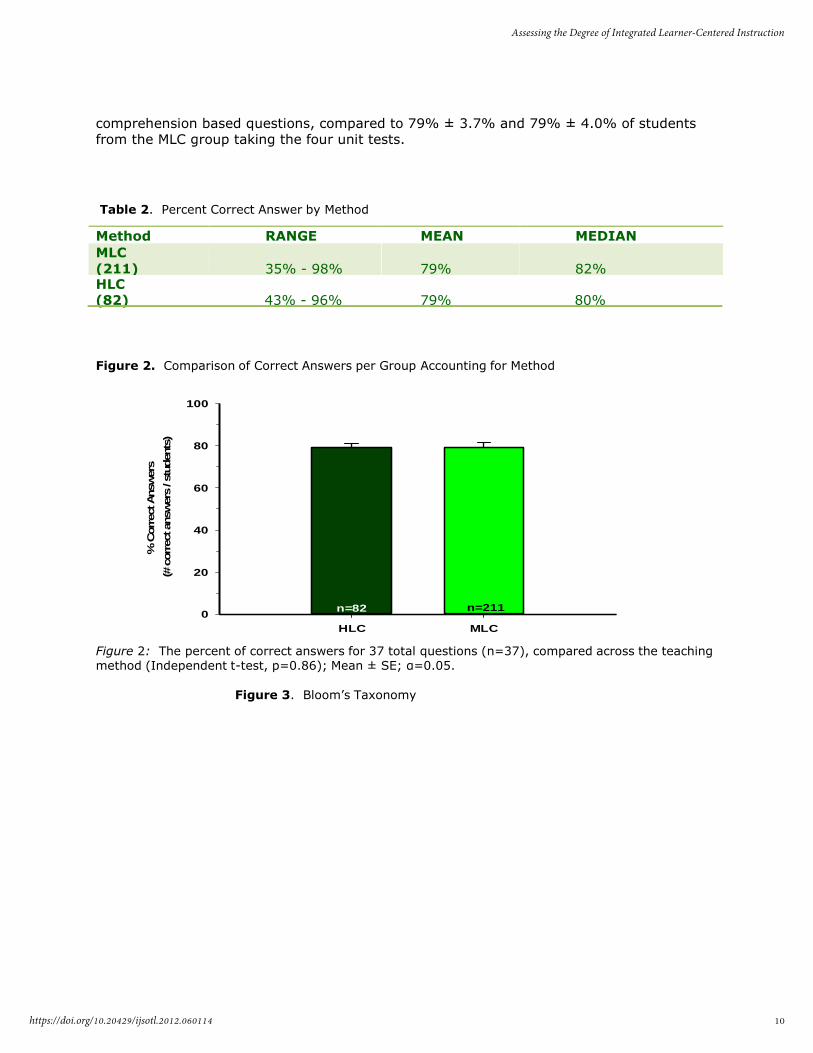
In addition, Bloom’s taxonomy (Bloom et al., 1956) categories were used to separate the 37
multiple-choice questions into the hierarchical groups of Knowledge, Comprehension, and
Application (Figure 3). For the purpose of this study, we defined knowledge as the ability to
recall previously known material; comprehension, as the ability to grasp the meaning of
material; and application, as the ability to use learned material in new concrete situations
(Alcázar & Fitzgerald, 2005; Bloom, 1956). A two-way parametric ANOVA was used to test
whether there was an interaction between Bloom’s category and degree of integrated learner-centered instruction. Student-Newman Keuls (SNK) multiple range post hoc tests
were run to separate data into distinct groups and an interrater reliability test was used to
determine the consistency of the raters on aligning the test questions with Bloom’s
categories (see Appendix A for test questions). Upon analysis of the missed questions we
determined that all 37 were attributable to the lower end of Bloom’s scale. Thus the post-
test would only be viable for measuring the LOCS of both the MLC and the HLC groups. To measure our second question, “Will students who receive a minimal degree of integrated
learner-centered instruction (MLC) achieve higher semester scores than students who
receive a higher degree of integrated learner-centered instruction (HLC)?” we used rubrics
to measure and confer scores on student work in the HLC group. The MLC group did not
participate in HLC activities and thus we would not be able to directly compare any HOCS
scores between the two groups. However, comparing the end of course scores of the two
groups would allow us to determine if there were significant overall grade differences
evidenced between the HLC and MLC groups. Student Evaluation of Teaching Effectiveness (SETE) scores were used to measure our third
question. At this university SETE scores are a measure of student perception of teaching
effectiveness. All individual scores are on the same scale so that a score of, say 600, for a
teacher of a particular course in a particular department or college has the same meaning in
terms of teaching effectiveness as a teacher of a course in a different department or
college. To help with score interpretation, the following factor descriptions of effectiveness are provided per the University’s Institutional Research and Effectiveness board:
Factor 1: Organization and Explanation of Materials (OEM)
8
Assessing the Degree of Integrated Learner-Centered Instruction
https://doi.org/10.20429/ijsotl.2012.060114
This score reflects the student’s perception of how well the instructor: makes the course
requirements and student learning outcomes clear to the students; gives assignments,
activities and materials that are helpful and that contribute to understanding the subject;
explains difficult material clearly; shows the relationships among topics and new concepts;
and evaluates student work in ways that are helpful to learning.
Factor 2: Learning Environment (LE) This score represents the student’s perception of how well the instructor establishes a
climate of mutual respect and encouragement; motivates students to work and engage in
learning; is available and encouraging; is skillful in actively engaging students in learning;
and provides useful feedback.
Factor 3: Self-Regulated Learning (SRL)
This score represents the student’s perception of how well the instructor guides and
encourages self-directed learning in which the student is encouraged to: be open to the
viewpoints of others; develop new viewpoints; connect course topics to a wider
understanding of the subject; and contribute to the learning process.
To give meaning to the scores in terms of a scale of teaching effectiveness, the board
established cut points to identify a range of effectiveness (Table 1). Three levels were
established and the scale score range for each level is as follows:
Table 1. SETE Scale Score Ranges for Effectiveness Levels by Factors
Effectiveness OEM LE SRL Overall
Highly
Effective 710 - 981 659 – 972 747 - 998 701 - 998
Effective 438 - 709 347 – 658 495 - 746 406 - 701
Somewhat
Effective 167 - 437 35 – 346 243 - 494 111 - 405
Results
The most straightforward answer to our first question, “Will students who answer post-test
questions in four unit exams given during the semester score higher than students who
answer post-test questions in a comprehensive final exam?” is no. The MLC class of
students who answered the post-test questions in four unit exams did not score higher than
the HLC class of students who answered the post-test questions in a comprehensive final
exam. In analyzing the percentage of correct answers per question given by each student
across the two groups, independent of test method, data confirmed that there was not a
statistically significant difference found between the MLC class taking the four unit tests and
the HLC class taking the comprehensive final exam as measured by the pre-test versus post-test scores (Independent t-test, p=0.857). On average, 79% ± 2.2% of the HLC
students taking the comprehensive final exam gave correct answers on the post-test. For
the MLC students taking the four unit tests an average of 79% ± 2.4% of students gave
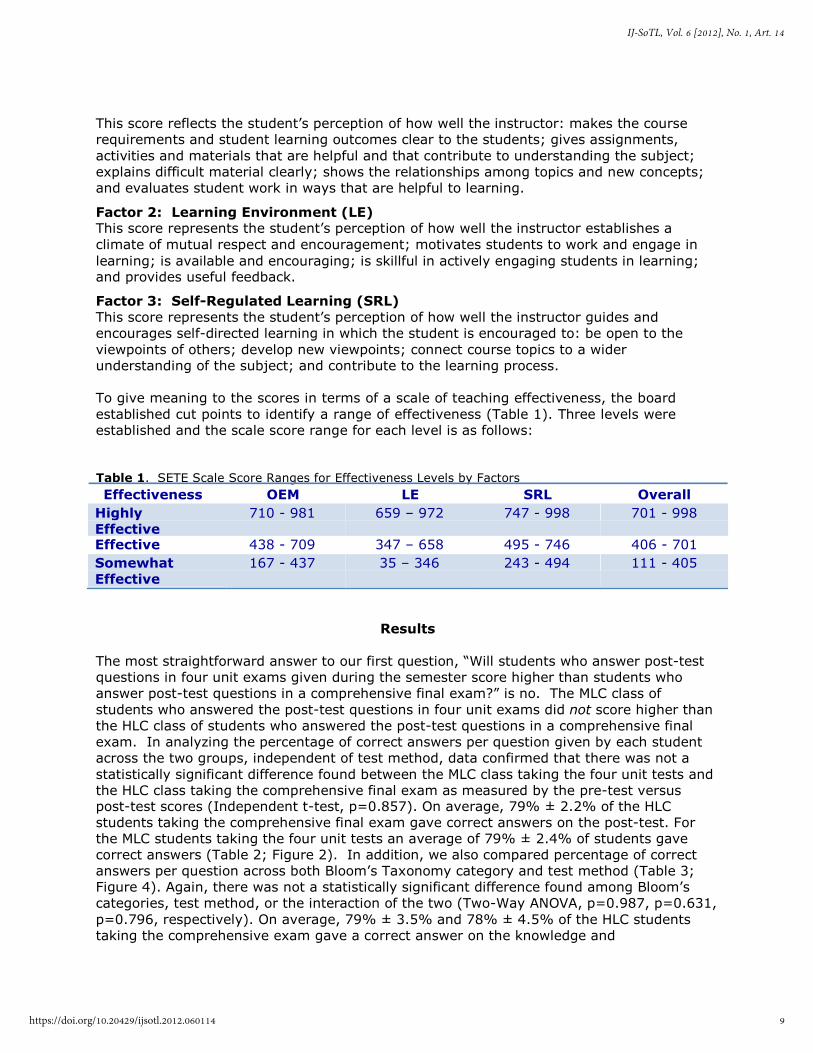
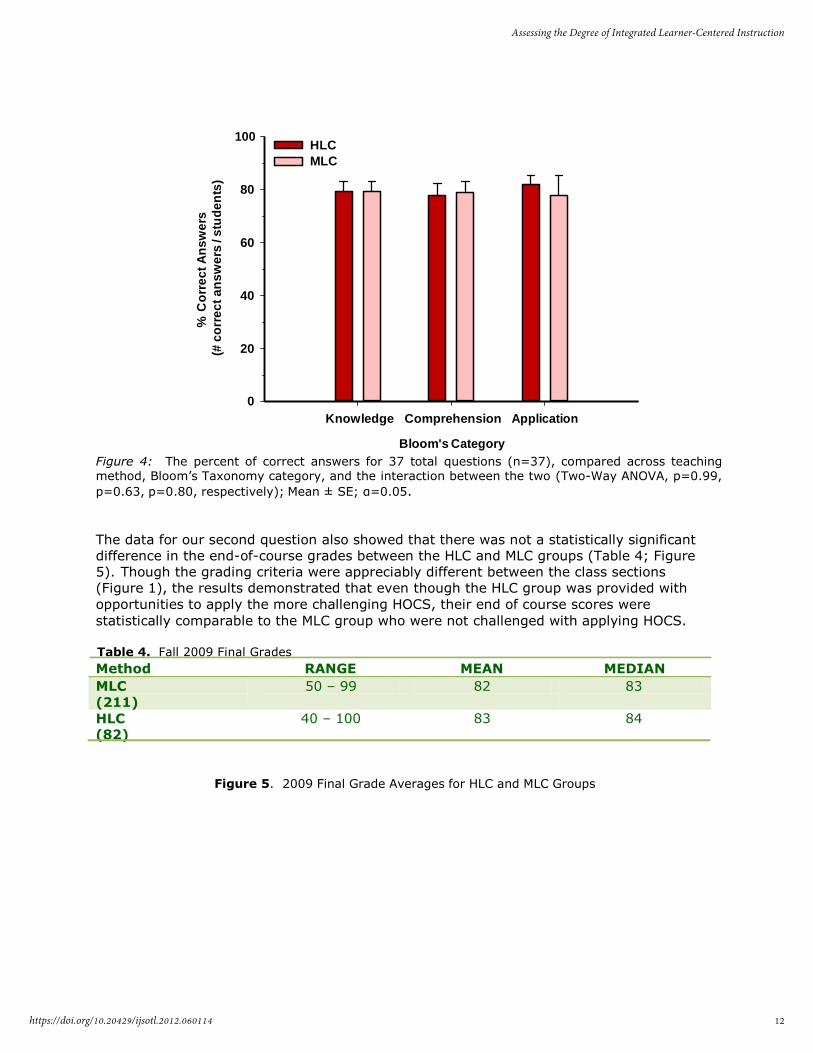
correct answers (Table 2; Figure 2). In addition, we also compared percentage of correct
answers per question across both Bloom’s Taxonomy category and test method (Table 3;
Figure 4). Again, there was not a statistically significant difference found among Bloom’s
categories, test method, or the interaction of the two (Two-Way ANOVA, p=0.987, p=0.631,
p=0.796, respectively). On average, 79% ± 3.5% and 78% ± 4.5% of the HLC students
taking the comprehensive exam gave a correct answer on the knowledge and
9
IJ-SoTL, Vol. 6 [2012], No. 1, Art. 14
https://doi.org/10.20429/ijsotl.2012.060114
% C
orr
ect Answ
ers
(# corr
ect answ
ers
/ stu
dents
)
comprehension based questions, compared to 79% ± 3.7% and 79% ± 4.0% of students from the MLC group taking the four unit tests.
Table 2. Percent Correct Answer by Method
Method RANGE MEAN MEDIAN
MLC
(211)
35% - 98%
79%
82%
HLC
(82) 43% - 96% 79% 80%
Figure 2. Comparison of Correct Answers per Group Accounting for Method
100
80
60
40
20
0 n=82 n=211
HLC MLC
Figure 2: The percent of correct answers for 37 total questions (n=37), compared across the teaching method (Independent t-test, p=0.86); Mean ± SE; α=0.05.
Figure 3. Bloom’s Taxonomy
10
Assessing the Degree of Integrated Learner-Centered Instruction
https://doi.org/10.20429/ijsotl.2012.060114
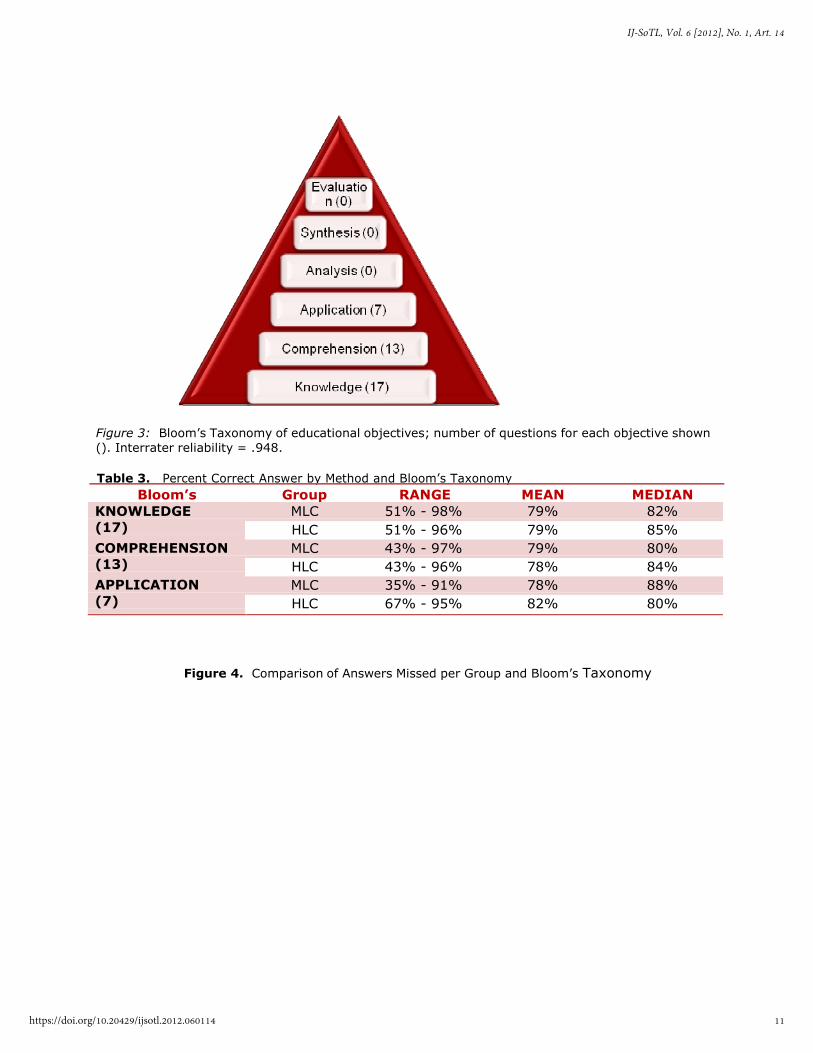
Figure 3: Bloom’s Taxonomy of educational objectives; number of questions for each objective shown
(). Interrater reliability = .948.
Table 3. Percent Correct Answer by Method and Bloom’s Taxonomy
Bloom’s Group RANGE MEAN MEDIAN
KNOWLEDGE
(17)
COMPREHENSION
(13)
APPLICATION
(7)
MLC 51% - 98% 79% 82%
HLC 51% - 96% 79% 85%
MLC 43% - 97% 79% 80%
HLC 43% - 96% 78% 84%
MLC 35% - 91% 78% 88%
HLC 67% - 95% 82% 80%
Figure 4. Comparison of Answers Missed per Group and Bloom’s Taxonomy
11
IJ-SoTL, Vol. 6 [2012], No. 1, Art. 14
https://doi.org/10.20429/ijsotl.2012.060114
% C
orr
ec
t A
ns
we
rs
(# c
orr
ec
t a
ns
we
rs /
stu
de
nts
)
100
HLC
MLC
80
60
40
20
0
Knowledge Comprehension Application
Bloom's Category
Figure 4: The percent of correct answers for 37 total questions (n=37), compared across teaching method, Bloom’s Taxonomy category, and the interaction between the two (Two-Way ANOVA, p=0.99,
p=0.63, p=0.80, respectively); Mean ± SE; α=0.05.
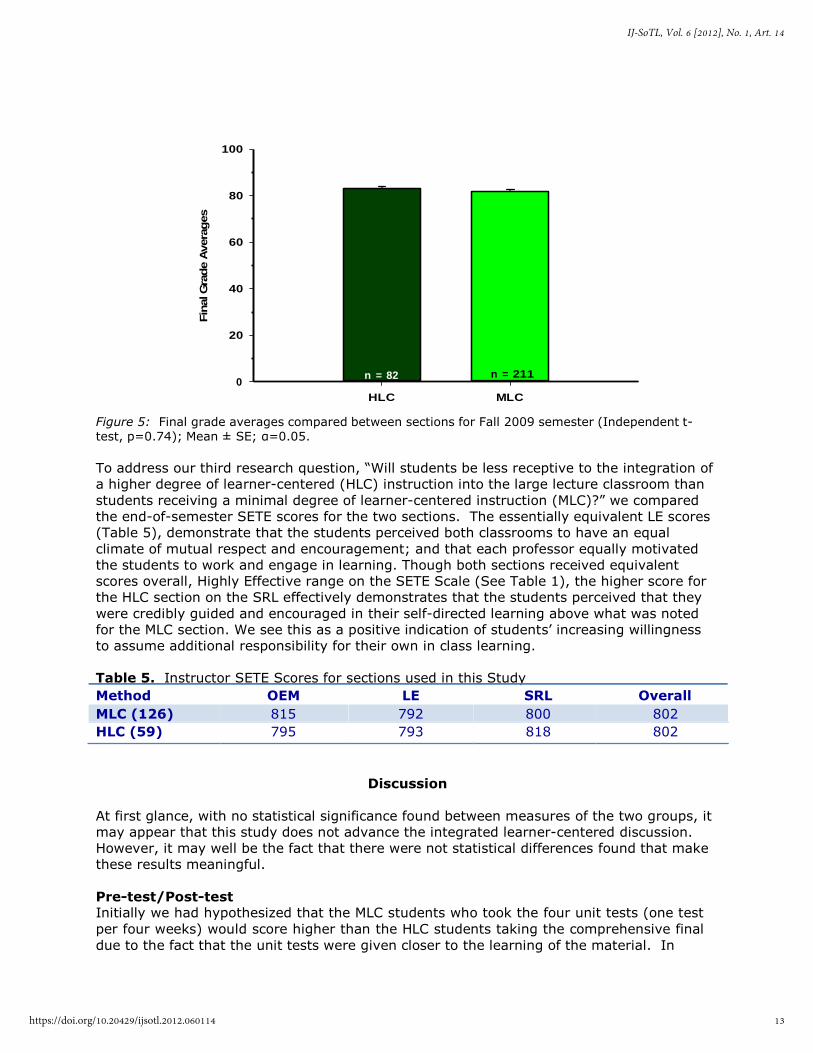
The data for our second question also showed that there was not a statistically significant
difference in the end-of-course grades between the HLC and MLC groups (Table 4; Figure
5). Though the grading criteria were appreciably different between the class sections
(Figure 1), the results demonstrated that even though the HLC group was provided with
opportunities to apply the more challenging HOCS, their end of course scores were
statistically comparable to the MLC group who were not challenged with applying HOCS.
Table 4. Fall 2009 Final Grades
Method RANGE MEAN MEDIAN
MLC
(211)
HLC
50 – 99 82 83 40 – 100 83 84
(82)
Figure 5. 2009 Final Grade Averages for HLC and MLC Groups
12
Assessing the Degree of Integrated Learner-Centered Instruction
https://doi.org/10.20429/ijsotl.2012.060114
Fin
al G
rade A
vera
ges
100
80
60
40
20
0 n = 82 n = 211
HLC MLC
Figure 5: Final grade averages compared between sections for Fall 2009 semester (Independent t- test, p=0.74); Mean ± SE; α=0.05.
To address our third research question, “Will students be less receptive to the integration of
a higher degree of learner-centered (HLC) instruction into the large lecture classroom than
students receiving a minimal degree of learner-centered instruction (MLC)?” we compared
the end-of-semester SETE scores for the two sections. The essentially equivalent LE scores
(Table 5), demonstrate that the students perceived both classrooms to have an equal
climate of mutual respect and encouragement; and that each professor equally motivated
the students to work and engage in learning. Though both sections received equivalent
scores overall, Highly Effective range on the SETE Scale (See Table 1), the higher score for
the HLC section on the SRL effectively demonstrates that the students perceived that they
were credibly guided and encouraged in their self-directed learning above what was noted
for the MLC section. We see this as a positive indication of students’ increasing willingness
to assume additional responsibility for their own in class learning.
Table 5. Instructor SETE Scores for sections used in this Study
Method OEM LE SRL Overall
MLC (126) 815 792 800 802
HLC (59) 795 793 818 802
Discussion
At first glance, with no statistical significance found between measures of the two groups, it
may appear that this study does not advance the integrated learner-centered discussion.
However, it may well be the fact that there were not statistical differences found that make
these results meaningful.
Pre-test/Post-test Initially we had hypothesized that the MLC students who took the four unit tests (one test
per four weeks) would score higher than the HLC students taking the comprehensive final
due to the fact that the unit tests were given closer to the learning of the material. In
13
IJ-SoTL, Vol. 6 [2012], No. 1, Art. 14
https://doi.org/10.20429/ijsotl.2012.060114
addition, since the MLC students spent the preponderance of their class time involved in
LOCS, which is mainly what this multiple-choice test examined, we believed they would
achieve higher scores than the HLC students who spent their class time progressively
engaged in all six of Bloom’s categories (LOCS and HOCS). Yet, in truth, the HLC students
achieved comparable post-test scores though they were tasked with retaining the material
for the entire 16-weeks. So, though the post-test scores were not significantly different
between the two groups, it may well be that the HLC students did learn more than the MLC
students due to the fact that comprehensive or end-of-course exams require greater
retention of knowledge (Bishop et al., 2001). In addition, it is also interesting to note that
for the seven “application” post-test questions (see Appendix A), a mean difference of 4%
was evidenced with the HLC class on the comprehensive exam over the MLC class on the
four unit tests. This may be suggestive of a correlation between students having the
opportunity to apply their HOCS through the HLC activities and their ability to answer
application questions in an exam setting. However because the two groups were tested
differently, a follow-up study which tasks both MLC and HLC students with taking a
comprehensive final exam is needed to ascertain whether or not HLC activities are
contributing factors to long-term retention of LOCS. End-of-course scores For our second question we had assumed that the MLC students would earn higher end-of-
course scores considering they were tasked with applying LOCS and were only assessed
through multiple-choice questions. The HLC students however, in addition to the LOCS were
also tasked with applying HOCS, which were measured with constructed-response questions
(see appendix B-D). Constructed-response questions differ from multiple-choice questions
in their scoring objectivity and the fact that constructed-response questions are open-ended
versus multiple-choice questions which provide fixed answers (Rodriguez, 1993; Scouller &
Prosse, 1994; Scouller, 1998). In the end however, despite the fact that 20% of the HLC
students’ course grades were assessed via the more complex constructed-response
questions, their semester or end-of-course scores were comparable with the MLC students.
The fact that the semester grades were not statistically significant between the two groups
suggests that students are equally as capable of rising to the challenge of and successfully
applying their HOCS as they generate their own answers in a variety of formats as they are
with applying their LOCS in fixed-answer formats. Though end-of-course scores may not be
the most discerning approach for comparing these two groups, as Crowe et al., (2008)
explain, the development of HOCS related teaching strategies constitute only one part of the
equation. Equally as important is the development of assessments which can effectively
measure the efficacy of the strategies. Student Perceptions
For our third question, as evidenced in Table 5, in contrast to the work done by Walker et
al. 2008, among others, the student evaluation data demonstrated that the students who
participated in the HLC class were as receptive to the learner-centered methods as the
students in the MLC class. As discussed in the introduction, one of the significant drawbacks
cited by both opponents and advocates of implementing learner-centered methods has been student resistance. Thus it is interesting to note that the HLC section was given lower
marks in Organization and Explanation of Materials (OEM) and higher marks in Self- Regulated Learning (SRL) and that the Learning Environment (LE) scores were almost
identical for both sections. The lower marks in OEM for the HLC class may be reflective of the more variable structure of the group projects and the fact that these projects entailed a
large portion of the work being completed independently in and out of the classroom. In
addition rubrics were used to grade group assignments and are often perceived to be more
subjective than traditional objective evaluations like those used in the MLC class (Rodriguez,
14
Assessing the Degree of Integrated Learner-Centered Instruction
https://doi.org/10.20429/ijsotl.2012.060114
1993). However, in this study students demonstrated they were as receptive overall to the
HLC methods as to the MLC methods. These results may well indicate that students are
more willing to accept the intellectual challenge of engaging in and directing their own
learning and/or, that as varying degrees of integrated learner-centered methods are being
introduced in a variety of courses, students are becoming more familiar with and thus more
accepting of HLC environments. An argument can be made, however, that these results
could, at least in part, be the consequence of class size rather than degree of learner-
centeredness. Though still large, the HLC class consisted of less than half the number of
students than the MLC class (82 and 211 respectively) and researchers have reported
consistently higher student evaluations in smaller classes (Chapman & Ludlow, 2010).
Conclusions
This study serves to further substantiate much of what has already been evidenced
concerning the positive effects of learner-centered instruction. As with previous studies, this
study demonstrated that actively engaging and encouraging students’ use of (HOCS)
provides students with opportunities to think critically, problem-solve effectively, and retain
knowledge efficiently. In contrast to previous studies, however, this study posits that student opposition to higher
degrees of integrated learner-centered methods is waning. The students’ evaluation of the
MLC class was essentially identical to the students’ evaluation of the HLC class. These
results, though potentially influenced by class size, bode well for both the implementation
and acceptance of higher degrees of learner-centered instruction within large lecture
classrooms.
References
Alcázar, M., & Fitzgerald, V. (2005). An experimental design to study the effectiveness of
PBL in higher education, in first year science students at a university in Peru, South
America. College Quarterly, 8(2).
Allen, D., & Tanner, K. (2006). Rubrics: tools for making learning goals and evaluation
criteria explicit for both teachers and learners. CBE Life Sci. Educ. 5, 197-203. Allen, D., Y White, H. (2001). Peer facilitators of in-class groups: adapting problem-based
learning to the undergraduate setting. In: Student Assisted Teaching: A Guide to
Faculty-Student Teamwork, ed. J.E. Miller, J.E. Groccia and M.S. Miller. Bolton, MA:
Anker Publications.
American Association for the Advancement of Science. (1990). Science for all Americans:
Project 2061. New York: Oxford University Press.
Angelo, T. (1997). The campus as a learning community: Seven promising shifts and seven
powerful levers. AAHE Bulletin, 4(9): 3-6. Barr, R. & Tagg, J. (1995). From teaching to learning: A new paradigm for undergraduate
education. Change, 27(6): 12-25. Berg, L. R. and Hager, M. C. (2009). Visualizing Environmental Science, 2nd Ed. Jon Wiley
15
IJ-SoTL, Vol. 6 [2012], No. 1, Art. 14
https://doi.org/10.20429/ijsotl.2012.060114
& Sons.
Berquist, W. H. & Phillips, S. R. (Eds.). (1975). Classroom structures which encourage
student participation. In Gary H. Quel (General Editor). A handbook for faculty
development (pp. 118–121). The Council for the Advancement of Small Colleges in
association with The College Center of the Finger Lakes.
Bishop, J., Mane, F., Bishop M., & Moriarty, J. (2001). The role of end-of-course exams and
minimum competency exams in standards-based reforms. In D. Ravitch (Ed.),
Brooking Papers in Educational Policy 2001. (pp. 267-345). Washington, DC:
Brookings Institution.
Bland, J., Saunders, G., and Kreps Frish, J. (2007). In defense of the lecture. Journal of
College Science Teaching. 37(2): 10-13.
Bligh, D. (2000). What’s the Use of Lectures? San Francisco, CA: Jossey-Bass Publishers.
Bloom, B.S. (1956). Taxonomy of Educational Objectives, Handbook 1: The Cognitive
Domain. New York: David McKay Co. Inc. Boyer Commission on Educating Undergraduates in the Research University. (1998).
Reinventing Undergraduate education: A blueprint for America’s research universities,
Carnegie Foundation for the Advancement of Teaching, Menlo Park, CA. Burgan, M. (2006). In defense of lecturing. Change, 38: 30-35.
Chapman, L., & Ludlow, L. (2010). Can downsizing college class sizes augment student
outcomes? An investigation of the effects of class size on student learning. Journal of
General Education, 59(2), 105-123. Cheney, L. (1989). Fifty Hours: A core curriculum for students. Washington, DC: National
Endowment for the Humanities, 1989. Cornelius-White, J. & Harbaugh, A. (2010). Learner-Centered Instruction: Building
Relationships for Student Success. Thousand Oaks, CA: Sage Publications, Inc.
Crowe, A., Dirks, C., & Wenderoth, M. (2008). Biology in Bloom: Implementing Bloom’s
taxonomy to enhance student learning in biology. CBE Life Sci. Educ. 7, 368-381. DiLullo, C., Morris, H.J., & Kriebel, R.M. (2009). Clinical Competencies and the Basic
Sciences: An online case tutorial paradigm for delivery of integrated clinical and basic
science content. Anatomical Sciences Education, 2 (5): 238-243.
Donham, R., Schmieg, F., & Allen, D. (2001). The large and the small of it: a case study of
introductory biology courses. In: The Power of Problem-Based Learning: A practical ‘How To’ for Teaching Undergraduate Courses in Any Discipline, ed. B.J. Duch, S.E. Groh, and D.E.
Allen. Sterling, VA: Stylus Publications. Ebert-May, Brewer, C., Allred, S. (1997). Innovation in large lectures: Teaching for active
learning. BioScience, 47(9): 601-607. Ebert-May, D., and Hodder, J. (eds.) (2008). Pathways to Scientific Teaching. Sunderland,
16
Assessing the Degree of Integrated Learner-Centered Instruction
https://doi.org/10.20429/ijsotl.2012.060114
MA: Sinauer Associates.
Epstein, M., Lazarus, A., Calvano, T., & Matthews, K. (2002). Immediate feedback
assessment technique promotes learning and correct inaccurate first responses. The
Psychological Record, 53(2): 187-202. Felder, R. M. & Brent. R. (1996). Navigating the bumpy road to student-centered
instruction. College Teaching, 44: 43-47. Freeman, S., O’Connor, E., Parks, J. W., Cunningham, M., Hurley, D., Haak, D., Dirks, C.,
and Wenderoth, M. P. (2007). Prescribed active learning increases performance in
introductory biology. CBE Life Sci. Educ., 6: 132–137. Hake, R. (1998). Interactive engagement versus traditional methods: a six-thousand
student survey of mechanics test data for introductory physics courses. Am. J.
Phys. 66: 64–74.
Handelsman, J., Ebert-May, D., Beichner, R., Bruns, P., Chang, A., DeHaan, R., Gentile, J.,
Lauffer, S., Stewart, J., Tilghman, S.M., and Wood, W.B. (2004). Scientific teaching.
Science 304: 521-522. Handelsman, J., Miller, S. & Pfund, C. (2007). Scientific Teaching. New York: W.H.
Freeman & Company Plublishers. Hazen, R, & Trefil, J. (1991). Science matters. Achieving scientific literacy. New York:
Anchor Books Doubleday.
Huba, M. & Freed, J. (2000). Learner-Centered Assessment on College Campuses: Shifting
the Focus from Teaching to Learning. Boston: Allyn and Bacon, 35.
Johnstone, A. H., & Percival, F. (1976). Attention breaks in lectures. Education in Chemistry,
13: 49–50. Knight, J. K., and Wood, W. B. (2005). Teaching more by lecturing less. Cell Biol. Educ., 4:
298–310.
Kozma, R., Belle, L, and Williams. G. (1978). Instructional techniques in higher education.
Englewood Cliffs, NJ: Educational Technology Publications.
Lord, Thomas R. 1997. A Comparison Between Traditional and Constructivist
Teaching in College Biology. Innovative Higher Education, 21(3): 197-216.
McKeachie, E. (1972). Research on college teaching. Educational Perspectives, 11: 3-20.
McKeachie, W., & Svinicki, M. (2006). McKeachie’s teaching tips: Strategies, research,
and theory for college and university teaching. (12th ed.) Boston: Houghton Mifflin.
National Research Council (1996b). From analysis to action: Undergraduate education in
science, mathematics, engineering, and technology. Washington, DC: National Academy
Press. National Research Council (1997). Science teaching reconsidered: A Handbook. Committee
17
IJ-SoTL, Vol. 6 [2012], No. 1, Art. 14
https://doi.org/10.20429/ijsotl.2012.060114

on Science Education, Center for Science, Mathematics, and Engineering Education.
Washington, DC: National Academy Press.
National Research Council (1999a). How people learn: Bridging research and practice. In
Donovan, M., Bransford, J., and Pellegrino, J. (EDS), Committee on Learning Research and
Educational Practice, Commission on Behavioral and Social Sciences and Education.
Washington, DC: National Academy Press. National Research Council (1999b). Transforming undergraduate education in science,
mathematics, engineering and technology, Committee on Undergraduate Science Education,
Center for Science, Mathematics, and Engineering Education. Washington, DC: National
Academy Press. National Research Council (2002a). BIO2010. Transforming Undergraduate Education for
Future Research Biologists. Committee on Undergraduate Biology Education to Prepare
Research Scientists for the 21st Century. Washington, DC: National Academy Press. National Research Council (2003b). Improving undergraduate instruction in science,
technology, engineering, and mathematics: Report of a workshop. In McCray, R., DeHaan,
R., and Shuck, J. (Eds.), Center for Education, Division of Behavioral and Social Sciences
and Education. Washington, DC: National Academy Press. National Science Foundation. (1999). How people learn: Brain, mind, experience and
school. Science and Engineering Indicators. Washington, DC: National Academy Press. Panasan, M. & Nuangchalerm, P. (2010). Learning Outcomes of Project-Based and Inquiry
Based Learning Activities. Journal of Social Sciences, 6: 252-255.
Powell, K. (2003). Spare me the lecture. Nature, 425: 234-236.
Prince, M. (2004). Does active learning work? A review of the research. Journal of
Engineering Education, 93(3): 223-231. Prince, M., & Felder, R. (2006). Inductive teaching and learning methods: Definitions,
comparisons, and research bases. Journal of Engineering Education, 95(2): 123-138. Project Kaleidoscope. (2002). Recommendations for Action in Support of Undergraduate
Science, Technology, Engineering, and Mathematics: Report on Reports. Washington,
DC. Richardson, D. (2008). Don’t dump the didactic lecture; fix it. Advances in Physiology
Education, 32: 23-24. Rodriguez, M. (1993). Choosing an item format. In R.E. Bennett & W.C. Ward (EDs.),
Construction versus choice in cognitive measurement (pp. 213-231). Hillsdale, NJ:
Lawrence Erlbaum Associates. Salkind, N. J. (2004). Statistics for People Who (think they) Hate Statistics, 2nd ed. Sage
Publications.
Scouller, K. & Prosser, M. (1994). Students’ experiences in studying for multiple choice
question examinations. Studies in Higher Education 19, 267-279.
18
Assessing the Degree of Integrated Learner-Centered Instruction
https://doi.org/10.20429/ijsotl.2012.060114
Scouller, K. (1998). The influence of assessment method on students’ learning approaches:
Multiple choice examination versus assignment essay. Higher Education, Vol. 35(4): 453-
472.
Smith, A., Stewart, R., Shields, P., Hayes-Klosterdis, J., Robinson, P., & Yuan, R. (2005). Introductory biology courses: a framework to support active learning in large
enrollment introductory science courses. Cell Biology Education, 4: 143-156.
Smith, K., Sheppard, S, Jonhson, D, and Johnson, R. (2005). Pedagogies of engagement:
classroom-based practices. Journal of Engineering Education. 94: 87-101.
Smith, M., Wood, W., Adams, W, Wieman, C., Knight, J, Guild, N., & Su, T. (2009). Why
peer discussion improves student performance on in-class concept questions. Science,
323: 122-124. Sorcinelli, M. (1991). Research findings on the seven principles. New Directions for
Teaching and Learning, 47: 13–25.
Springer, L., Stanne, M. E., & Donovan, S. S. (1999). Effects of small-group learning on
undergraduates in science, mathematics, engineering and technology: A meta-analysis.
Review of Educational Research, 69: 21–51. Sundberg, M., Dini, M., Li, E., (1994). Decreasing course content improves student
comprehension of science and attitudes towards science in freshman biology. Journal of
Research in Science Teaching, 31: 679-693. Udovic, D., Morris, D., Dickman, A., Postlethwait, J., and Wetherwax, P. (2002). Workshop
biology: demonstrating the effectiveness of active learning in an introductory biology
course. Bioscience, 52: 272–281. Umbach, P., & Wawrzynski, M. (2005). Faculty do matter: The role of college faculty in
student learning and engagement. Research in Higher Education, 46: 153-184. Veeravagu, J., Muthusamy, C., Marimuthu, R., Subrayan-Michael, A. (2010). Using Bloom’s
Taxonomy to gauge students’ reading comprehension performance. Canadian Social
Science, 6(3): 205-212.
Walker, J., Cotner, H., Baepler, P., and Decker, M. (2008). A delicate balance: Integrating
active learning into a large lecture course. Journal of Life Sciences Education 7(4):
361-367.
Wilson, R. (1986). Improving faculty teaching. Journal of Higher Education, 57(2):195.
Zoller, U. (1993). Are lecture and learning compatible? Maybe for LOCS: unlikely for HOCS
(SYM). Journal of Chemical Education 70, 195-197.
Zoller, U., & Tsparlis, G. (1997). Higher and lower-order cognitive skills: The case of chemistry. Research in Science Education, 27(1), 117-130.
19
IJ-SoTL, Vol. 6 [2012], No. 1, Art. 14
https://doi.org/10.20429/ijsotl.2012.060114
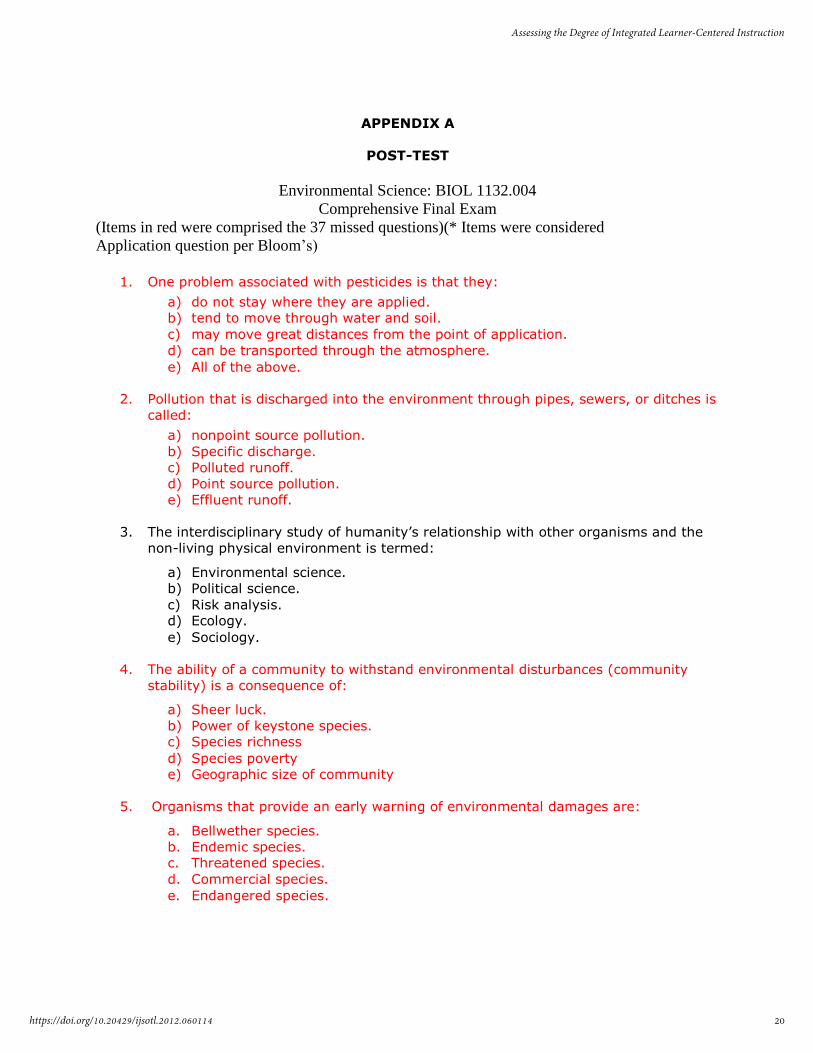
APPENDIX A
POST-TEST
Environmental Science: BIOL 1132.004
Comprehensive Final Exam
(Items in red were comprised the 37 missed questions)(* Items were considered
Application question per Bloom’s)
1. One problem associated with pesticides is that they:
a) do not stay where they are applied. b) tend to move through water and soil.
c) may move great distances from the point of application.
d) can be transported through the atmosphere.
e) All of the above.
2. Pollution that is discharged into the environment through pipes, sewers, or ditches is
called:
a) nonpoint source pollution.
b) Specific discharge.
c) Polluted runoff.
d) Point source pollution.
e) Effluent runoff.
3. The interdisciplinary study of humanity’s relationship with other organisms and the
non-living physical environment is termed:
a) Environmental science.
b) Political science.
c) Risk analysis. d) Ecology.
e) Sociology.
4. The ability of a community to withstand environmental disturbances (community
stability) is a consequence of:
a) Sheer luck.
b) Power of keystone species. c) Species richness
d) Species poverty
e) Geographic size of community
5. Organisms that provide an early warning of environmental damages are:
a. Bellwether species.
b. Endemic species. c. Threatened species.
d. Commercial species.
e. Endangered species.
20
Assessing the Degree of Integrated Learner-Centered Instruction
https://doi.org/10.20429/ijsotl.2012.060114
6. The concern that the largest number of landfills, incinerators, and sewage treatment
plants are found in low-income communities raises issues of:
a. Environmental justice
b. Voluntary simplicity
c. Phytoremediation
d. Environmental economics e. Racial prejudice
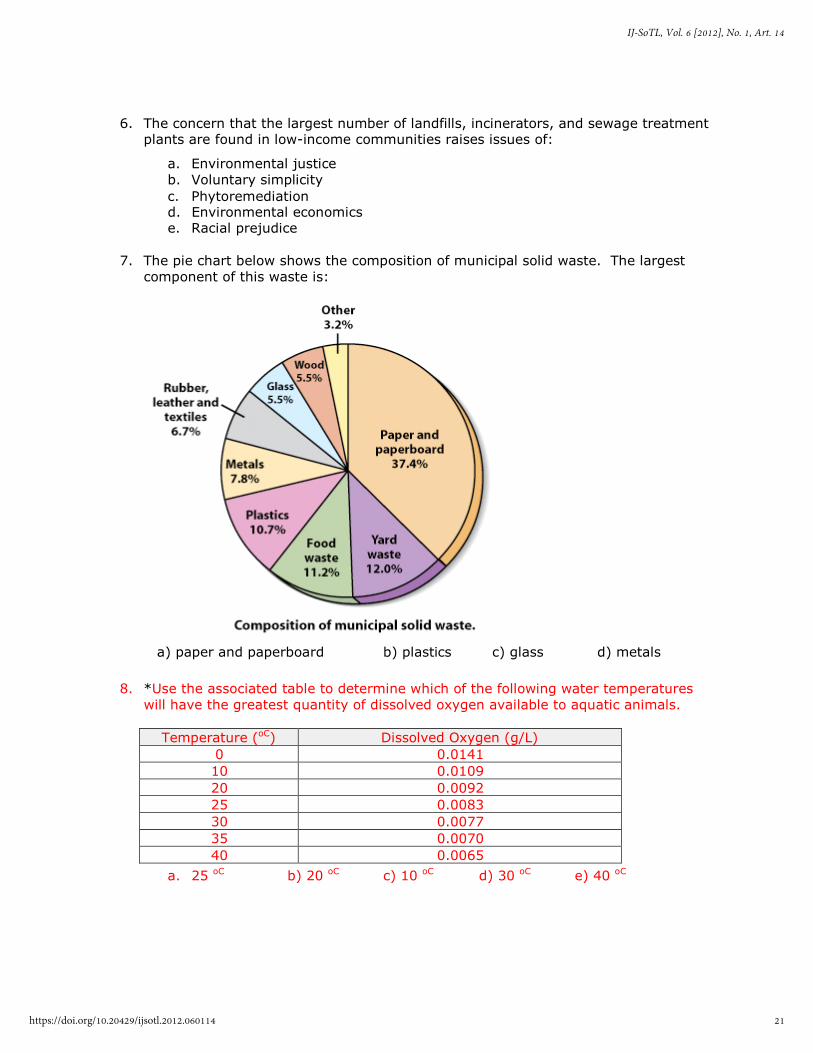
7. The pie chart below shows the composition of municipal solid waste. The largest
component of this waste is:
a) paper and paperboard b) plastics c) glass d) metals
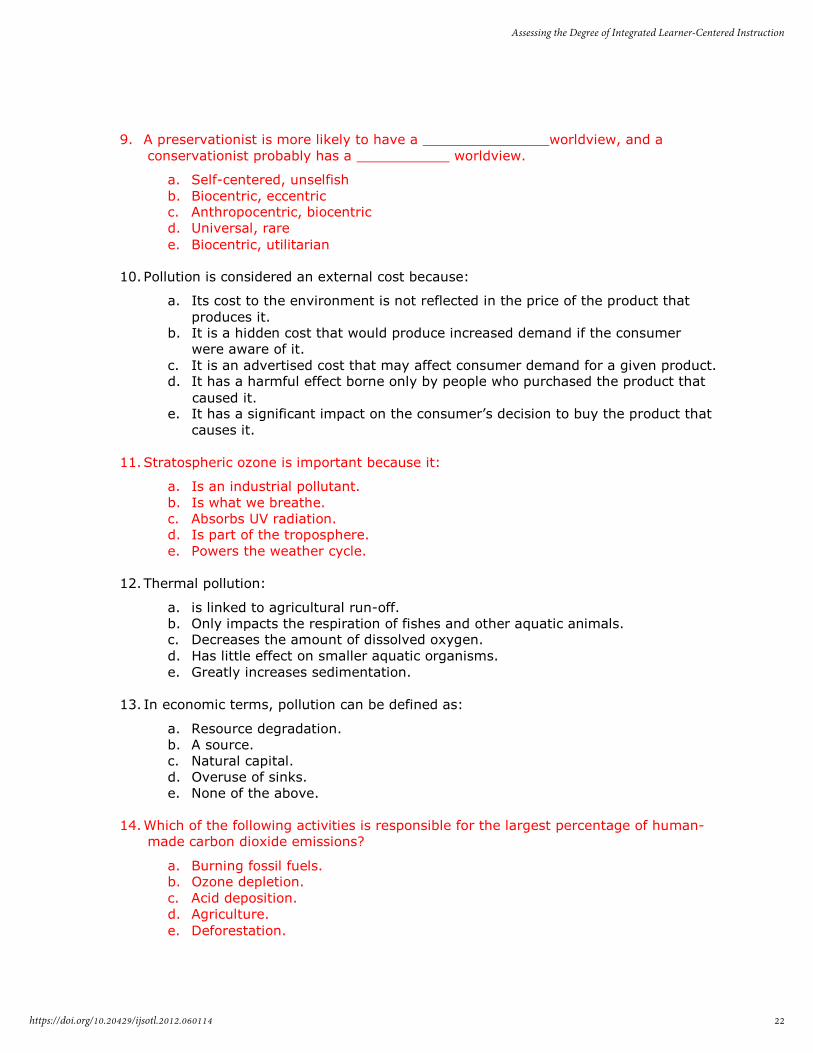
8. *Use the associated table to determine which of the following water temperatures
will have the greatest quantity of dissolved oxygen available to aquatic animals.
Temperature (oC) Dissolved Oxygen (g/L)
0 0.0141
10 0.0109
20 0.0092
25 0.0083
30 0.0077
35 0.0070
40 0.0065
a. 25 oC b) 20 oC c) 10 oC d) 30 oC e) 40 oC
21
IJ-SoTL, Vol. 6 [2012], No. 1, Art. 14
https://doi.org/10.20429/ijsotl.2012.060114
9. A preservationist is more likely to have a worldview, and a
conservationist probably has a worldview.
a. Self-centered, unselfish
b. Biocentric, eccentric c. Anthropocentric, biocentric
d. Universal, rare
e. Biocentric, utilitarian
10. Pollution is considered an external cost because:
a. Its cost to the environment is not reflected in the price of the product that
produces it. b. It is a hidden cost that would produce increased demand if the consumer
were aware of it.
c. It is an advertised cost that may affect consumer demand for a given product. d. It has a harmful effect borne only by people who purchased the product that
caused it.
e. It has a significant impact on the consumer’s decision to buy the product that
causes it.
11. Stratospheric ozone is important because it:
a. Is an industrial pollutant.
b. Is what we breathe.
c. Absorbs UV radiation. d. Is part of the troposphere.
e. Powers the weather cycle.
12. Thermal pollution:
a. is linked to agricultural run-off.
b. Only impacts the respiration of fishes and other aquatic animals. c. Decreases the amount of dissolved oxygen.
d. Has little effect on smaller aquatic organisms.
e. Greatly increases sedimentation.
13. In economic terms, pollution can be defined as:
a. Resource degradation.
b. A source.
c. Natural capital.
d. Overuse of sinks.
e. None of the above.
14. Which of the following activities is responsible for the largest percentage of human-
made carbon dioxide emissions?
a. Burning fossil fuels. b. Ozone depletion.
c. Acid deposition.
d. Agriculture.
e. Deforestation.
22
Assessing the Degree of Integrated Learner-Centered Instruction
https://doi.org/10.20429/ijsotl.2012.060114
15. Urban areas receive less sunlight than rural areas, partly as a result of greater
quantities of in the air.
a. Ozone
b. Sulfur oxides
c. Nitrogen oxides
d. Hydrocarbons
e. Particulate matter
16. Combustion of which of these fossil fuels is/are linked to global warming?
a. Oil b. Natural gas
c. Coal
d. Methane
e. All of the above
17. An ecosystem can be characterized as:
a. All of the biological interactions, plus interactions with the abiotic
environment, in a given area.
b. Populations + community.
c. Interactions between physical processes and the abiotic environment.
d. The abiotic components of the environment.
e. All species, population, and community interactions for organisms in a given
area.
18. National income accounts are incomplete estimates of national economic
performances because national income accounts do NOT include:
a. Gross domestic product.
b. Estimates of human manufactured material goods. c. Net domestic product.
d. Estimates of external costs such as natural resource depletion and the environmental cost of economic activities.
e. Estimates of imported goods and services.
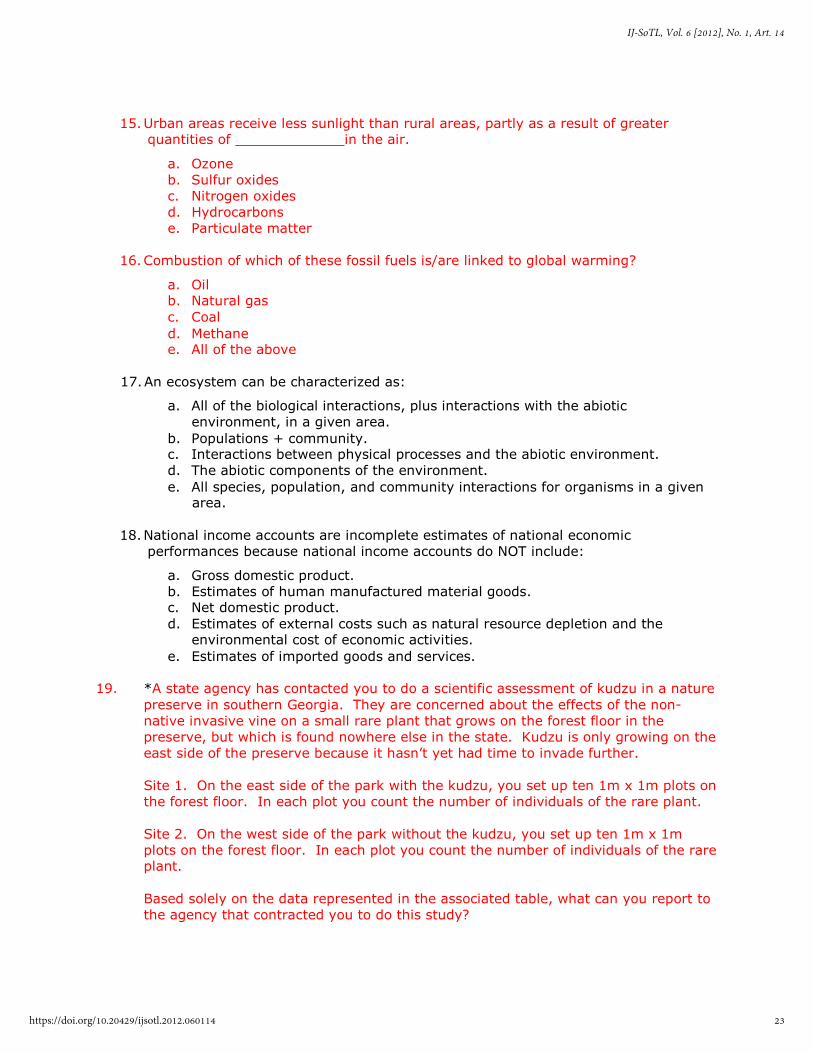
19. *A state agency has contacted you to do a scientific assessment of kudzu in a nature
preserve in southern Georgia. They are concerned about the effects of the non-
native invasive vine on a small rare plant that grows on the forest floor in the
preserve, but which is found nowhere else in the state. Kudzu is only growing on the
east side of the preserve because it hasn’t yet had time to invade further.
Site 1. On the east side of the park with the kudzu, you set up ten 1m x 1m plots on
the forest floor. In each plot you count the number of individuals of the rare plant.
Site 2. On the west side of the park without the kudzu, you set up ten 1m x 1m
plots on the forest floor. In each plot you count the number of individuals of the rare plant.
Based solely on the data represented in the associated table, what can you report to
the agency that contracted you to do this study?
23
IJ-SoTL, Vol. 6 [2012], No. 1, Art. 14
https://doi.org/10.20429/ijsotl.2012.060114
Site Mean number of individuals of rare plant per plot
Site 1 1.7
Site 2 4.2
a. Kudzu is shading out the rare plant.
b. Kudzu grows much faster than the rare plant and will dominate the preserve within a decade.
c. The rare plant is unaffected by the presence of the kudzu.
d. It will be impossible to remove kudzu from the park because it grows too fast.
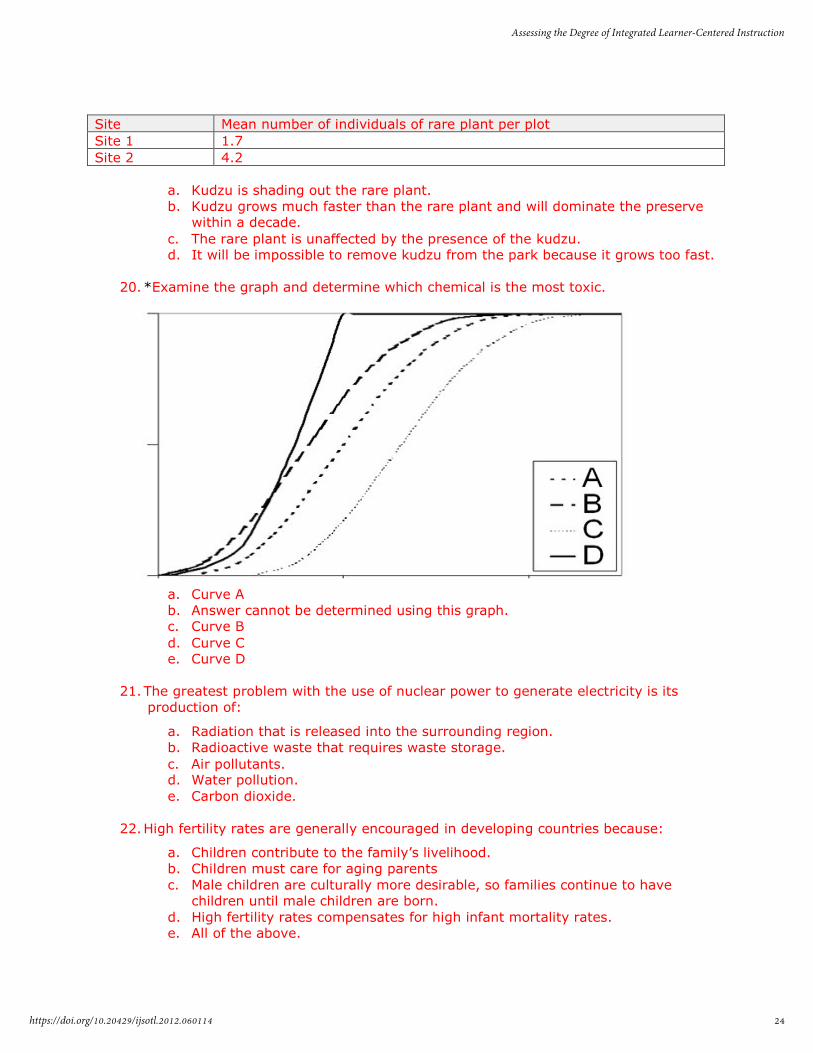
20. *Examine the graph and determine which chemical is the most toxic.
a. Curve A
b. Answer cannot be determined using this graph. c. Curve B
d. Curve C
e. Curve D
21. The greatest problem with the use of nuclear power to generate electricity is its
production of:
a. Radiation that is released into the surrounding region.
b. Radioactive waste that requires waste storage.
c. Air pollutants.
d. Water pollution.
e. Carbon dioxide.
22. High fertility rates are generally encouraged in developing countries because:
a. Children contribute to the family’s livelihood.
b. Children must care for aging parents
c. Male children are culturally more desirable, so families continue to have children until male children are born.
d. High fertility rates compensates for high infant mortality rates. e. All of the above.
24
Assessing the Degree of Integrated Learner-Centered Instruction
https://doi.org/10.20429/ijsotl.2012.060114
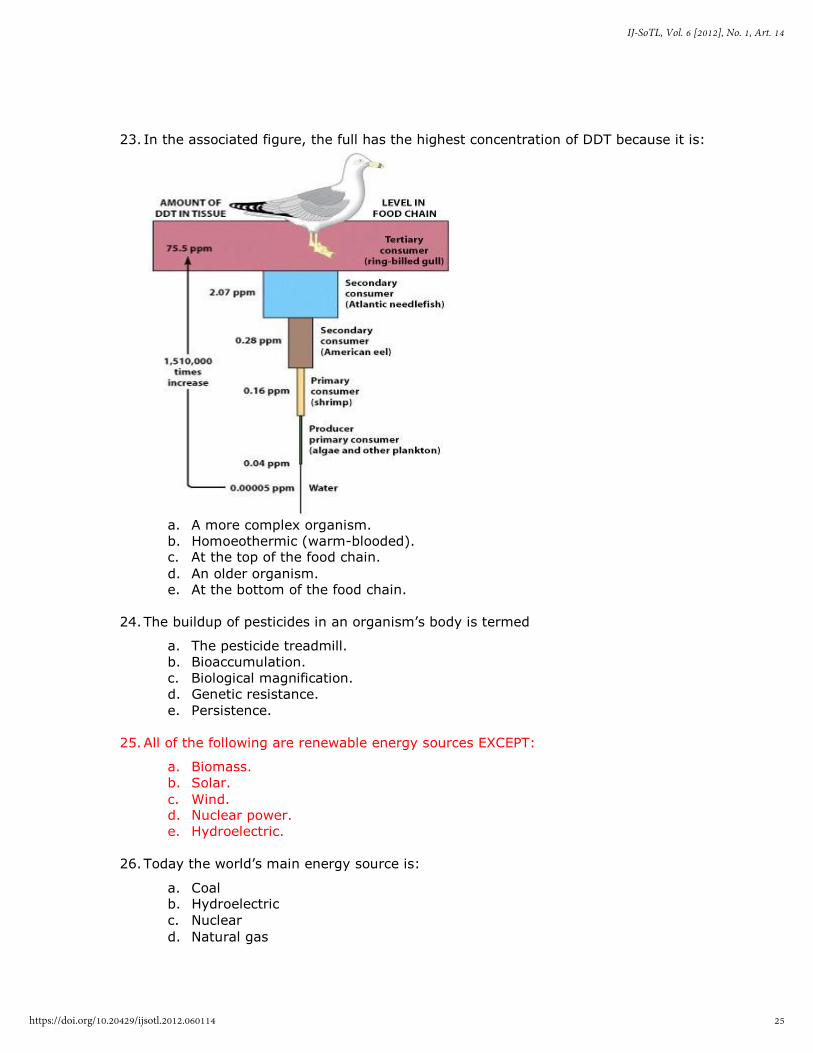
23. In the associated figure, the full has the highest concentration of DDT because it is:
a. A more complex organism.
b. Homoeothermic (warm-blooded). c. At the top of the food chain.
d. An older organism.
e. At the bottom of the food chain.
24. The buildup of pesticides in an organism’s body is termed
a. The pesticide treadmill.
b. Bioaccumulation.
c. Biological magnification.
d. Genetic resistance.
e. Persistence.
25. All of the following are renewable energy sources EXCEPT:
a. Biomass.
b. Solar.
c. Wind.
d. Nuclear power.
e. Hydroelectric.
26. Today the world’s main energy source is:
a. Coal b. Hydroelectric
c. Nuclear
d. Natural gas
25
IJ-SoTL, Vol. 6 [2012], No. 1, Art. 14
https://doi.org/10.20429/ijsotl.2012.060114
e. oil
27. The difference between primary and secondary pollutants is that primary air
pollutants:
a. Are the direct results of natural processes, whereas secondary air pollutants
are the result of human activity. b. Are not harmful to humans, whereas secondary air pollutants may be toxic to
humans.
c. Only affect plants, while secondary pollutants affect plants and animals. d. Enter the atmosphere directly, whereas secondary pollutants form from
substances released into the atmosphere. e. Are smaller, primary molecules.
28. *A primary consumer would eat:
a. Bacteria.
b. Secondary consumers. c. Rabbits.
d. Plants.
e. Herbivores.
29. The concern about global warming is directly related to increased levels of what
chemical in the atmosphere?
a. carbon dioxide
b. Mercury c. chlorofluorocarbon
d. sulfur oxide
e. nitrogen oxide
30. A secondary consumer would eat:
a. Herbivores.
b. Tertiary consumers. c. Fungi.
d. Lions.
e. Bacteria.
31. What is the correct sequence of steps in the scientific method?
I. State the problem
II. Analyze and interpret the data
III. Develop a hypothesis
IV. Share the results with others
V. Design and perform an experiment to test the hypothesis
a. III – I – V – II – IV
b. I – III – V – II – IV
c. V – II – I – III – IV
d. I – II – III – IV – V
e. V – IV – III – II - I
26
Assessing the Degree of Integrated Learner-Centered Instruction
https://doi.org/10.20429/ijsotl.2012.060114
32. The greenhouse effect occurs because:
a. Carbon dioxide and other trace gases trap infrared radiation in the Earth’s
atmosphere.
b. The gases produced by human activities allow significantly more heat to pass
out of the Earth’s atmosphere.
c. Sulfur emissions from smokestacks and volcanoes continue to occur.
d. Greenhouse gases released interact chemically to produce excess heat. e. There are too many greenhouses scattered across the Earth’s surface.
33. Which of the following is NOT critical for a balanced ecosystem?
a. Consumers b. Humans
c. Producers
d. Decomposers e. Plants
34. Which of the following represents a resource that could be characterized as a
present-day “commons?”
a. Fresh water
b. Atmosphere
c. Forests
d. Marine fisheries
e. All of the above
35. The maximum number of individuals of a given species that a particular environment
can support for an indefinite period, assuming there are no changes in the
environment is called its:
a. Demography.
b. Environmental resistance. c. Sustainability.
d. Carrying capacity.
e. Intrinsic rate of increase.
36. The theory of evolution by natural selection was proposed in The Origin of Species by
Means of Natural Selection (1859), written by:
a. Charles Darwin b. Aristotle
c. G.F. Gause
d. Rachel Carson
e. Ponce de Leon
37. The human population is increasing because of:
a. Medical advances.
b. Agricultural advances.
c. Sanitation practices.
d. Improved water quality.
e. All of the above.
27
IJ-SoTL, Vol. 6 [2012], No. 1, Art. 14
https://doi.org/10.20429/ijsotl.2012.060114
38. *Which of the following best illustrates the process of evolution?
a. A population of foxes increases as more prey becomes available.
b. A plant loses its leaves in a drought.
c. A lizard’s color becomes brown as it sits on a log.
d. A bear goes into hibernation.
e. A population of mosquitoes develops resistance to a pesticide.
39. Which of the following series is organized according to the levels of organization used
by ecologists?
a. Population – ecosystem – community
b. Species – community – abiotic factors
c. Population – community – ecosystem
d. Species – ecosystem – population
e. Population – community – biotic factors
40. An improving economy in a country is generally correlated with:
a. Increased birth rate and increased population growth rate.
b. Decreased birth rate and increased population growth rate.
c. Decreased birth rate and decreased population growth rate.
d. Decreased death rate and increased population growth rate.
e. Increased death rate and decreased population growth rate.
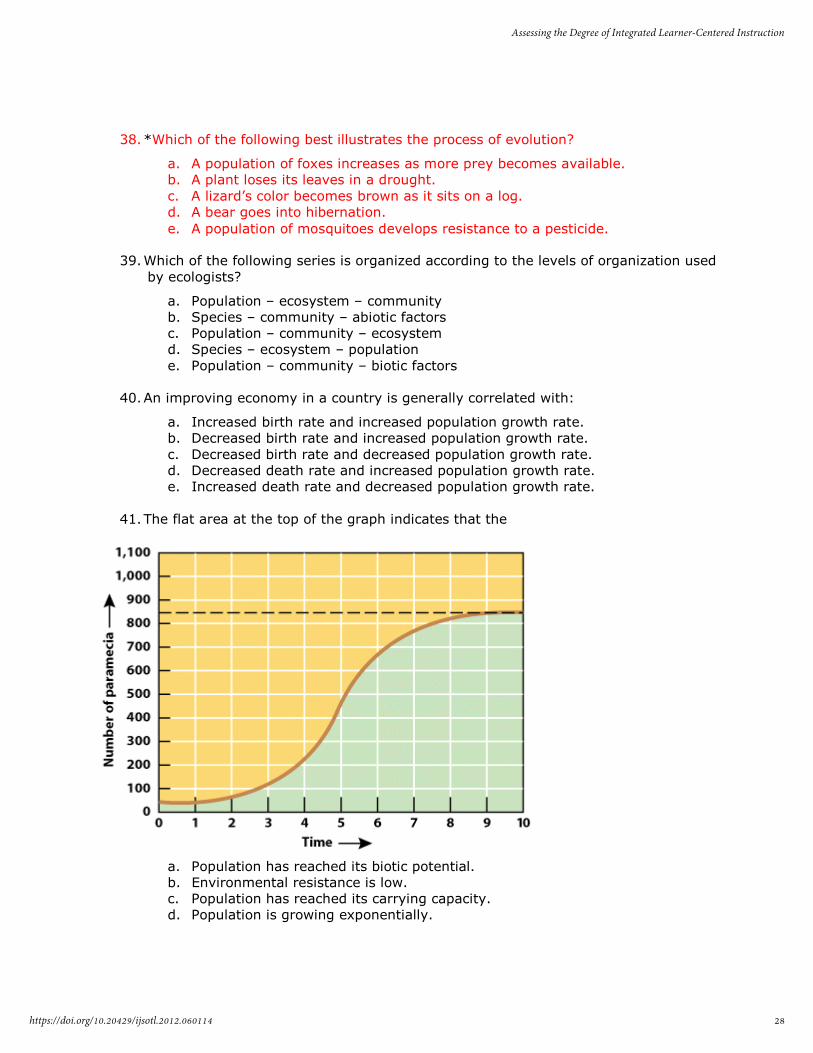
41. The flat area at the top of the graph indicates that the
a. Population has reached its biotic potential.
b. Environmental resistance is low.
c. Population has reached its carrying capacity.
d. Population is growing exponentially.
28
Assessing the Degree of Integrated Learner-Centered Instruction
https://doi.org/10.20429/ijsotl.2012.060114
42. The pathway by which carbon is transferred from living organisms to the atmosphere
is called:
a. Burning fossil fuels.
b. Cellular respiration.
c. Photosynthesis.
d. Transpiration.
e. Evaporation.
43. In the scientific method, a hypothesis:
a. Is a statement of fact. b. Makes a prediction that can be tested.
c. Is usually proven to be correct.
d. Can only be tested once.
e. All of the above.
44. A brownfield is an urban area of:
a. Sports arenas for baseball, football, and soccer. b. Abandoned, vacant factories, warehouses, and residential sites that may be
contaminated from past uses.
c. Vacant house lots that are overgrown with weeds and vegetation.
d. Meadows that are earmarked for industrial development. e. Parking lot pavement that collects heat during the day and emits heat at
night.
45. The Earth’s atmosphere is important because:
a. It protects us from UV radiation and X-rays. b. It is primarily composed of oxygen, essential for our survival.
c. It is composed of approximately twenty different layers.
d. It is a staple and unchanging part of our global environment.
e. The most dense outer later shields the Earth’s surface from dangerous forms of energy.
46. Plastics are the fastest growing component of solid waste, large due to the
contribution of:
a. Obsolete computers.
b. Disposable diapers.
c. Clothing. d. Discarded automobiles.
e. Packaging.
47. The stratospheric chemical that prevents much of the solar ultraviolet radiation from
penetrating to Earth’s surface is:
a. Nitrogen oxides.
b. Particulate matter. c. Carbon dioxide.
d. Water vapor. e. Ozone.
29
IJ-SoTL, Vol. 6 [2012], No. 1, Art. 14
https://doi.org/10.20429/ijsotl.2012.060114
48. Every ton of recycled paper saves approximately:
a. 17 trees.
b. 7000 gallons of water.
c. 4100 kilowatt-hours of energy.
d. 3 cubic yards of landfill space.
e. All of the above.
49. Risk:
a. Is the probability of injury, disease, death, or environmental damage under a
given set of circumstances.
b. Does not apply to routine, everyday activities.
c. Only applies to environmental impact on human health and welfare.
d. Is the probability that a given hypothesis will be proven true.
e. Is an assessment of the financial cost of environmental impact.
50. The First Law of Thermodynamics states that:
a. Energy cannot be created or destroyed.
b. Energy transfer between organism is inefficient and much energy is lost c. The organization of the universe is steadily increasing.
d. Energy can be created or destroyed by physical processes. e. Entropy always increases.
51. Examples of non-sustainable human activities or behaviors include:
a. Use of nonrenewable resources as if they were present in unlimited
quantities. b. Using technology to improve car mileage.
c. Conservation practices.
d. Recycling.
e. Attempts to limit human population growth.
52. All of the following represent ways in which individuals can reduce water
consumption except:
a. Installing low-flush toilets.
b. Washing many small loads of laundry. c. Using a dishwasher.
d. Installing low-flow showerheads.
e. Turning the facet off while brushing teeth.
53. *What factors should be considered to make an “ideal” sanitary landfill?
a. Geology.
b. Proximity to nearby surface and ground water.
c. Proximity to population centers but far enough to not be offensive.
d. Does not require high transportation costs to deliver solid waste.
e. All of the above.
54. The most promising solution to our current and future energy needs is:
a. Photovoltaic technology.
b. Wind farms.
30
Assessing the Degree of Integrated Learner-Centered Instruction
https://doi.org/10.20429/ijsotl.2012.060114
c. Geothermal energy.
d. Direct and indirect solar power.
e. Conservation and increased efficiency.
55. Integrated waste management refers to:
a. Handling problems of household, industrial, and sewage wastes all together.
b. The principle of dilute and disperse.
c. National programs of source reduction.
d. Proper disposal of household hazardous wastes.
e. Waste management techniques that involve reusing, recycling, and reducing.
56. Worldwide, freshwater use is:
a. Relatively stable due to offsets between individual use and industrial
conservation.
b. Increasing because, on average, each person is using more water.
c. Decreasing because, on average, agriculture is conserving more water.
d. Decreasing due to the decline in the global population growth rate.
e. Decreasing due to improved technology and greater efficiency.
57. Which of the following is NOT a renewable source of energy?
a. Fossil fuels
b. Hydropower
c. Direct solar
d. Wind
e. Biomass
58. The main cause of under nutrition and malnutrition is:
a. Inadequate global food production.
b. Decreasing livestock yields.
c. Polyculture.
d. Organic farming practices.
e. Poverty.
59. The energy consumption of each person in highly developed countries:
a. Is four times as much as each person in developing countries.
b. Is eight times as much as each person in developing countries.
c. Cannot be compared because people in developing countries don’t use energy.
d. Is about the same as each person in developing countries. e. Is twice as much as each person in developing countries.
60. Which of the following correctly identifies one of the goals of waste prevention?
a. Decrease dematerialization
b. Increase reuse of products c. Decrease recycling of packaging materials
d. Increase use of disposable items
e. Increase consumption
31
IJ-SoTL, Vol. 6 [2012], No. 1, Art. 14
https://doi.org/10.20429/ijsotl.2012.060114
61. *If you measured the LD50 for a particular chemical, you would know:
a. How much it takes to kill 50 rats.
b. The effective dose for humans.
c. What dose is lethal to 50% of a population of test animals.
d. That the chemical is safe for human use.
e. The chemical properties of the given chemical
62. One advantage of conventional nuclear power, when compared to coal, is:
a. Emission of few pollutants to the atmosphere.
b. No related occupational death.
c. Unlimited supply.
d. No connection to water pollution.
e. Limited risk from catastrophic accidents.
63. In solving environmental problems, a risk analysis is usually performed:
a. To analyze the potential effect of an intervention or doing nothing.
b. To provide public awareness and endorsement. c. A risk analysis is not necessary in resolving environmental problems.
d. To monitor the initial assessment and modeling of the problem.
e. To solicit public opinion about how evidence should be interpreted when
selecting a course of action.
64. We depend on water for all of the following except:
a. Manufacturing.
b. Travel.
c. Energy production. d. Mining.
e. None of the above, we depend on water for all of these.
65. An environmental impact statement must include:
a. Solutions to any potentially adverse environmental effects.
b. Short- and long-term effects and any adverse environmental effects.
c. Documentation of the financial cost-benefit analysis of the proposed action. d. A description of the solution to any associated environmental controversy.
e. An ethical analysis of the proposed action.
66. Which of the following statements is true?
a. Predation only favors the predator with the evolution of more efficient ways to
catch prey. b. Predation has no evolutionary consequences for either the predator or the
prey.
c. Predation only favors the prey with the evolution of more efficient ways to escape predators.
d. Predation exerts a selective force on the prey, favoring characteristics that reduce the probability of capture.
e. Predation exerts a selective force on the predator, favoring characteristics that reduce the probability of prey capture.
67. A large amount of sewage:
32
Assessing the Degree of Integrated Learner-Centered Instruction
https://doi.org/10.20429/ijsotl.2012.060114
a. Generates a high BOD, which lowers the level of dissolved oxygen in the
water.
b. Does not effect the BOD.
c. Generates a low BOD, which raises the level of dissolved oxygen in the water.
d. Generates a low BOD, which lowers the level of dissolved oxygen in the
water.
e. Generates a high BOD, which raises the level of oxygen in the water.
68. Elements or groupings of elements that occur naturally in the Earth’s crust are
called:
a. Minerals.
b. Compounds.
c. Metals.
d. Atoms.
e. Ores.
69. The ability to meet humanity’s current needs without compromising the ability of
future generations to meet their needs is:
a. Synergism. b. Natural balance.
c. Ecology.
d. Environmental science.
e. Environmental sustainability.
70. Soil is formed from parent material by biological, chemical, and physical:
a. Digestion processes.
b. Leaching.
c. Terracing.
d. Weathering processes.
e. Composting.
71. Why are tropical rain forests considered so important to global ecology?
a. They contribute greatly to the world’s carbon and oxygen cycles. b. They retard soil erosion.
c. They contain much of the world’s biodiversity. d. They mitigate floods and droughts.
e. All of the above.
72. The long-term solution to the food supply problem is to:
a. Control human population growth.
b. Implement the use of genetically engineered crops and livestock.
c. Expand organic farming.
d. Develop and then utilize genetically diverse varieties of various crops.
e. Expand energy-intensive agricultural methods that produce high yields of food.
73. “The Tragedy of the Commons” refers to:
a. An environmental theory promoting public ownership of lands and resources.
33
IJ-SoTL, Vol. 6 [2012], No. 1, Art. 14
https://doi.org/10.20429/ijsotl.2012.060114
b. Events impacting the common people, particularly farmers, of developing
countries.
c. An economic theory promoting private ownership of lands and resources. d. Environmental problems generated by farming practices.
e. An analogy describing the conflict between individual interest and
management of shared resources.
74. Bioaccumulation is the buildup of a persistent pesticide in .
a. Oceans and seas; lakes and ponds
b. An individual’s blood stream; an individual’s fatty tissues. c. Plants; animals
d. Living tissue; air, water, and soil
e. An individual organism’s body; organisms at the top of the food chain.
75. The single greatest threat to biological diversity is:
a. The introduction of foreign species.
b. Air pollution.
c. Water pollution.
d. Overexploitation.
e. Habitat loss.
34
Assessing the Degree of Integrated Learner-Centered Instruction
https://doi.org/10.20429/ijsotl.2012.060114

Appendix B
Scientific Method Student Rubric
Group Assignment #1: The Scientific Method Instructions
A) Read the article given in class. B) Describe the steps of the scientific method in detail,
AND
C) Find all components of the scientific method as given in this article. Use the following as a guideline to help you:
1. What is the problem/unanswered question? 2. What was the testable hypothesis the scientists chose? 3. What experiments did they use to test the hypothesis? 4. How did they analyze and interpret the data? 5. What conclusions do the scientists wish to convey to the public?
Mechanics This assignment must be typed using 12 point font; double-spaced; between 300-500 words. This assignment is due IN CLASS. Late submissions will result in point deductions (- 10% per day late). You have one week from the assignment deadline to turn in the assignment for credit.
Use the Rubric below to see the point distributions. Content and Development 10 Points
Points Earned XX/10
Additional Comments:
The student covers all key elements of the assignment in a substantive way. The student:
• explains the processes of the scientific method as used in the journal article
• explains each step of the scientific method
The student is comprehensive, accurate, and persuasive.
• The paper is 300-500 words in length.
The student develops a central theme or idea directed toward the appropriate audience.
• The steps of the scientific method are applied to a scientific study.
The student links theory to relevant examples and uses the vocabulary of the theory correctly.
35
IJ-SoTL, Vol. 6 [2012], No. 1, Art. 14
https://doi.org/10.20429/ijsotl.2012.060114
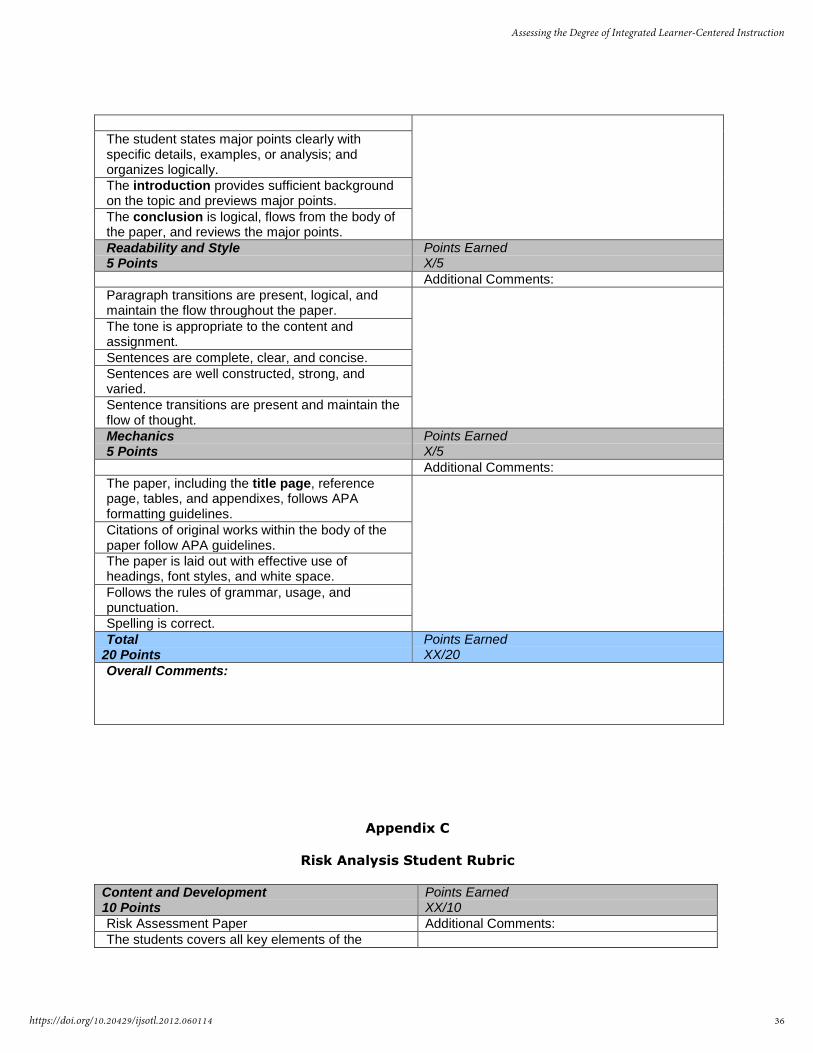
The student states major points clearly with specific details, examples, or analysis; and organizes logically.
The introduction provides sufficient background on the topic and previews major points.
The conclusion is logical, flows from the body of the paper, and reviews the major points.
Readability and Style 5 Points
Points Earned X/5
Additional Comments:
Paragraph transitions are present, logical, and maintain the flow throughout the paper.
The tone is appropriate to the content and assignment.
Sentences are complete, clear, and concise.
Sentences are well constructed, strong, and varied.
Sentence transitions are present and maintain the flow of thought.
Mechanics 5 Points
Points Earned X/5
Additional Comments:
The paper, including the title page, reference page, tables, and appendixes, follows APA formatting guidelines.
Citations of original works within the body of the paper follow APA guidelines.
The paper is laid out with effective use of headings, font styles, and white space.
Follows the rules of grammar, usage, and punctuation.
Spelling is correct.
Total 20 Points
Points Earned XX/20
Overall Comments:
Appendix C
Risk Analysis Student Rubric
Content and Development 10 Points
Points Earned XX/10
Risk Assessment Paper Additional Comments:
The students covers all key elements of the
36
Assessing the Degree of Integrated Learner-Centered Instruction
https://doi.org/10.20429/ijsotl.2012.060114
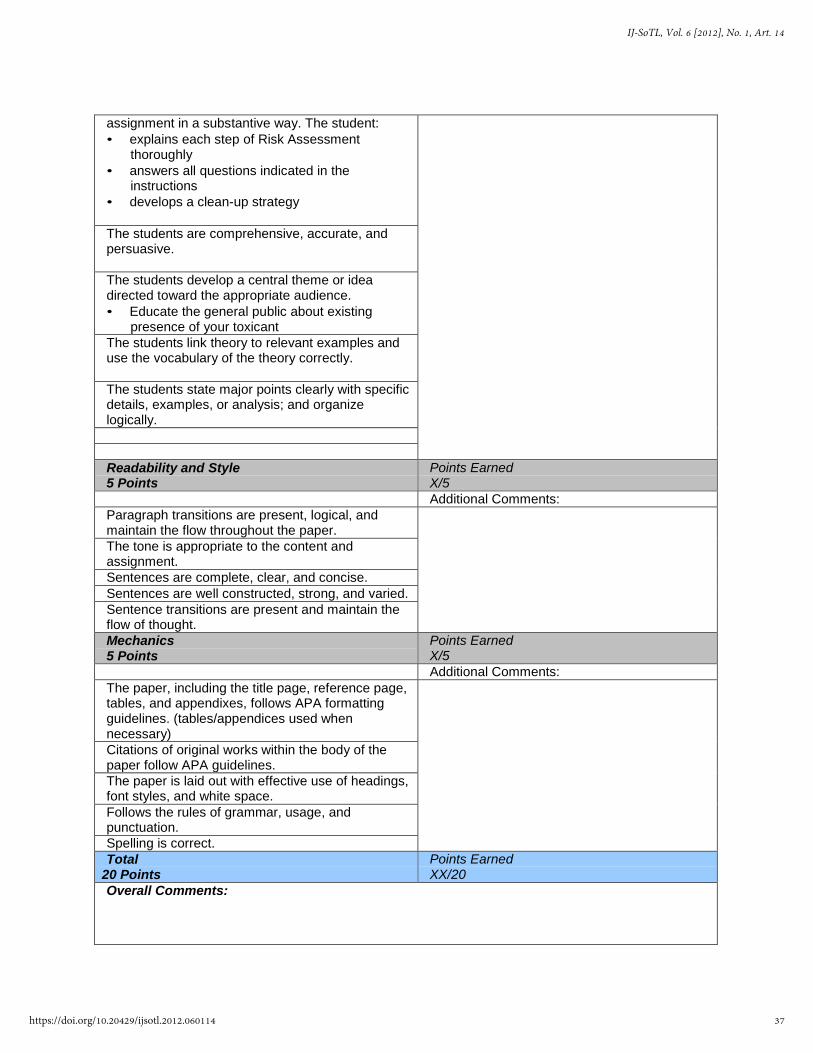
assignment in a substantive way. The student:
• explains each step of Risk Assessment thoroughly
• answers all questions indicated in the instructions
• develops a clean-up strategy
The students are comprehensive, accurate, and persuasive.
The students develop a central theme or idea directed toward the appropriate audience.
• Educate the general public about existing presence of your toxicant
The students link theory to relevant examples and use the vocabulary of the theory correctly.
The students state major points clearly with specific details, examples, or analysis; and organize logically.
Readability and Style 5 Points
Points Earned X/5
Additional Comments:
Paragraph transitions are present, logical, and maintain the flow throughout the paper.
The tone is appropriate to the content and assignment.
Sentences are complete, clear, and concise.
Sentences are well constructed, strong, and varied.
Sentence transitions are present and maintain the flow of thought.
Mechanics 5 Points
Points Earned X/5
Additional Comments:
The paper, including the title page, reference page, tables, and appendixes, follows APA formatting guidelines. (tables/appendices used when necessary)
Citations of original works within the body of the paper follow APA guidelines.
The paper is laid out with effective use of headings, font styles, and white space.
Follows the rules of grammar, usage, and punctuation.
Spelling is correct.
Total 20 Points
Points Earned XX/20
Overall Comments:
37
IJ-SoTL, Vol. 6 [2012], No. 1, Art. 14
https://doi.org/10.20429/ijsotl.2012.060114
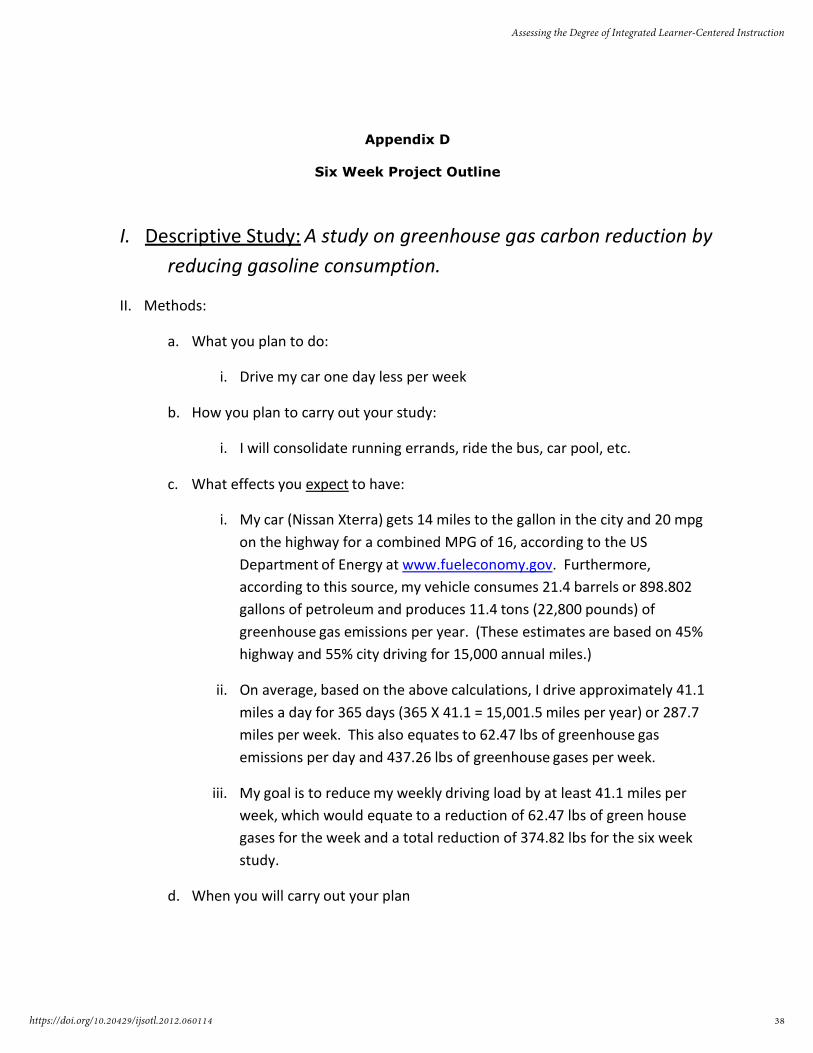
Appendix D
Six Week Project Outline
I. Descriptive Study: A study on greenhouse gas carbon reduction by
reducing gasoline consumption.
II. Methods:
a. What you plan to do:
i. Drive my car one day less per week
b. How you plan to carry out your study:
i. I will consolidate running errands, ride the bus, car pool, etc.
c. What effects you expect to have:
i. My car (Nissan Xterra) gets 14 miles to the gallon in the city and 20 mpg
on the highway for a combined MPG of 16, according to the US
Department of Energy at www.fueleconomy.gov. Furthermore,
according to this source, my vehicle consumes 21.4 barrels or 898.802
gallons of petroleum and produces 11.4 tons (22,800 pounds) of
greenhouse gas emissions per year. (These estimates are based on 45%
highway and 55% city driving for 15,000 annual miles.)
ii. On average, based on the above calculations, I drive approximately 41.1
miles a day for 365 days (365 X 41.1 = 15,001.5 miles per year) or 287.7
miles per week. This also equates to 62.47 lbs of greenhouse gas
emissions per day and 437.26 lbs of greenhouse gases per week.
iii. My goal is to reduce my weekly driving load by at least 41.1 miles per
week, which would equate to a reduction of 62.47 lbs of green house
gases for the week and a total reduction of 374.82 lbs for the six week
study.
d. When you will carry out your plan
38
Assessing the Degree of Integrated Learner-Centered Instruction
https://doi.org/10.20429/ijsotl.2012.060114

i. I will begin this project on (specific date) and will end it six weeks from
now on (specific date).
III. Procedures
(Here you provide DETAILS about what you actually have done!!) For instance:
a. Today is . This day will serve as the beginning of Week 1 for this
study. I set my trip odometer to 0 today.
b. Today is . I am choosing not to drive or ride in another car
today.
c. Today is . This is the seventh and final day of Week 1.
According to my trip odometer, I drove miles this week.
d. Today is . This day will serve as the beginning of Week 2 for
this study. I set my trip odometer to 0 today.
e. Today is . I am choosing not to drive or ride in another car
today.
f. Today is . This is the seventh and final day of Week 2.
According to my trip odometer, I drove miles this week.
(ETC. for the remaining 2 weeks of the study)
IV. Results
a. According to my resource (www.fueleconomy.gov) the average usage for my
vehicle (Nissan Xterra) is 15,000 miles per year, which equates to a contribution
of 11.4 tons of greenhouse gases per year.
b. Based on my study, I found that on average I actually drive miles per
week. This amount is (more/less) than the average provided by my resource.
Due to this (increase/decrease) in use, I found that I contribute approximately
lbs of greenhouse gases (below/above) the average.
V. Implications
a. During my four week study, I found that I contributed approximately
lbs of greenhouse gases to our environment.
39
IJ-SoTL, Vol. 6 [2012], No. 1, Art. 14
https://doi.org/10.20429/ijsotl.2012.060114

b. If everyone in the US contributed as much as I do, then our national gasoline
based greenhouse gas emissions would be equal to lbs. per year.
(US population is 307,595,506 as of 19:51 GMT on Oct. 1, 2009)
(www.census.gov/main/www/popclock.html)
c. This amount (re state amount here) is currently lbs (above/below) the
average provided by my resource (www.fueleconomy.gov)
d. If everyone in the US were to drive a vehicle like mine and were to reduce their
driving by at least (41.1)(insert the amount of miles you actually reduced for
yourself) miles per week, this would equate to a carbon reduction (gasoline
based greenhouse gases) of lbs per year if our population
were to stay exactly the same as it is as of this writing.
VI. Final Conclusions
(share your thoughts here)
40
Assessing the Degree of Integrated Learner-Centered Instruction
https://doi.org/10.20429/ijsotl.2012.060114