Embed Size (px)
Citation preview

Assessing Market Performance:
The Current State of Metrics
Tim Ambler1, Flora Kokkinaki, Stefano Puntoni and Debra Riley2
Centre for Marketing Working Paper No. 01-903
September 2001
Tim Ambler is Senior Fellow at London Business School
London Business School, Regent's Park, London NW1 4SA, U.K. Tel: +44 (0)20 7262-5050 Fax: +44 (0)20 7724-1145
http://www.london.edu/Marketing
Copyright © London Business School 2001
1 Tim Ambler, Senior Fellow. The London Business School, Sussex Place, Regent's Park, London NW1 4SA. Tel: 44 0207 262 5050, Fax: 44 0207 724 1145. Dr Flora Kokkinaki, University of Patras. Stefano Puntoni, Phd Student at the London Business School. Debra Riley, Lecturer at the University of Kingston. 2 We are grateful to The Marketing Society, The Marketing Council, Institute for Practitioners in
Advertising, Sales Promotions Consultants Association, London Business School and Marketing Science Institute for sponsoring this research.

ASSESSING MARKETING PERFORMANCE:
THE CURRENT STATE OF METRICS
Abstract
After summarising the relevant theoretical foundations, this exploratory paper
describes the current state of marketing metrics in the UK. “Marketing” is broadly
defined as what the whole company does to achieve customer preference and, thereby,
its own goals. We show that both financial and non-financial measures are used
though the former continue to predominate. Brand equity bridges short- with long-
term effects. We develop a generalized framework of marketing around six
measurement categories: financial, competitive, consumer behavior, consumer
intermediate, i.e. thoughts and feelings, direct trade customer and innovativeness. In
addition we established three criteria for the assessment of a metrics system:
comparison with internal expectations, e.g. plan, and the external market together with
an adjustment for any change in the marketing asset brand equity. Using this basis, the
research gathered an empirical description of current metrics practice in the UK
through three stages. The first was qualitative. The second stage explored the use and
perceived importance of metrics by category, and associations with orientation and
performance. Less than one quarter of UK firms review the data to meet all three
marketing performance assessment criteria above. The third stage separated out
individual metrics and through a succession of analyses brought us to a general set of
19 metrics which could be used as a starting point by firms wishing to benchmark
their own portfolio. However metrics usage is substantially moderated by size and
sector which also moderates the association between orientation and performance.

ASSESSING MARKETING PERFORMANCE: THE CURRENT STATE OF
METRICS
Digital navigation was slow to evolve in shipping and we should not expect
the idea of steering a firm by numbers to be any more rapid. This exploratory paper
describes the current state of marketing metrics in the UK. “Marketing” is broadly
defined as what the whole company does to achieve customer preference and, thereby,
its own goals (Webster 1992). Thus it is not limited to those with marketing
departments or separate budgets. Every business undertakes marketing in this sense.
It can also be seen as the process which sources cash flow. Despite the new emphasis
on the shareholder (Doyle 2000; Srivastava, Shervani and Fahey 1998), or on
employees, or on the Web, customers remain the fundamental source of cash flow for
most businesses and thus the provider of the resource on which all other stakeholders
depend.
Marketers therefore should not have to show the importance of their
perspective. On the other hand they should be able to quantify their performance3, i.e.
show effectiveness4 and efficiency5. The increasing interest in justifying marketing
investment is not limited to financial metrics: non-financial measures are increasingly
seen as needed. (IMA 1993; 1995; 1996; Clark 1999; Marketing Science Institute
2000; Marketing Week 2001; Moorman and Rust 1999; Shaw and Mazur 1997;
Schultz 2000). The Marketing Science Institute has raised marketing metrics to
become its leading capital research project (Marketing Science Institute 2000).
3 “Performance” here is used conventionally to mean the financial results from business
activities (e.g. sales, profits, increase in shareholder value), not the activities themselves. 4 The extent to which marketing actions have moved the company towards its goals. 5 The ratio of results to resources used, e.g. return on investment.

Part of the difficulty is relating marketing activities to long-term effects
(Dekimpe and Hanssens 1995) and another is the separation of individual marketing
activities from other actions (Bonoma and Clark 1988). This paper shows how the
concept of marketing assets, or “brand equity”, can help resolve the former difficulty.
We avoid the second by focusing on the total effects of marketing, in its holistic sense;
we do not report the metrics used to evaluate individual parts of the marketing mix,
e.g. use of the Web.
The paper is structured as follows. We review theoretical principles and
previous findings from the literature. We develop a theoretical framework, and present
the results of a UK research project together with the managerial implications. After
reviewing limitations, we propose future research before drawing conclusions.
LITERATURE REVIEW
The marketing performance literature has been criticized for its limited
diagnostic power (Day and Wensley 1988), its focus on the short term (Dekimpe and
Hanssens 1995; 1999), the excessive number of different measures and the related
difficulty of comparison (Clark 1999; Kokkinaki and Ambler 1997); the dependence
of the perceived performance on the set of indicators chosen (Murphy, Trailer and Hill
1996). “Perhaps no other concept in marketing’s short history has proven as
stubbornly resistant to conceptualization, definition, or application as that of
marketing performance” (Bonoma and Clark 1988, p. 1).
In the first part of this review we identify three theoretical perspectives. The
second part focuses on managerial practice. The third reviews the measurement of the
intangible marketing asset, which we call “brand equity”.

Theoretical foundations of performance assessment
This section reviews reasons why top management would seek to quantify
marketing performance. The first explanation, control theory, posits that management
has a strategy and a known set of intermediary stages with which actual performance
can be compared. Like the navigators of old, captains of business can both monitor
and improve progress by minimizing variances. A second explanation is provided by
institutional theory which suggests that metrics will be selected, or perhaps evolve,
according to the cultural norms of businesses and the sectors within which they
operate. Finally, orientation theory suggests that the choice of metrics will be
influenced by the way top management perceives its business. A more market
oriented business is likely to seek more market metrics.
Agency theory (Jensen and Meckling 1976; see Bergen, Dutta and Walker
1992 for a review) provides a fourth explanation for the selection of metrics but this
requires the interaction between two levels of management but that interaction is not
the subject of this research. These four theories overlap but one conclusion is that
metrics are important not just for the information they contain but for their portrayal
of what top management considers important.
Control theory.
The monitoring of the results deriving by marketing activities provides the
informational means to ensure that “planned marketing activities produce desired
results”, as stated by (Jaworski 1988, p. 24) in his definition of marketing control. The
perceived effectiveness of marketing actions is dependent upon the control model
adopted within the firm as well as upon the effectual implementation of such model as
“marketing managers can learn to improve performance by altering the utility levels
associated with marketing control variables” (Fraser and Hite 1988, p. 97).

Thus managers seek to enhance performance by identifying performance
predictors, modeling the relationships between the predictors and performance and
then monitoring the predictors. These mental models may not be explicit.
The literature dedicated to marketing control however is fragmentary and
agreement on a theoretical framework is lacking (Merchant 1988; Jaworski 1988;
Jaworski, Stathakopolous and Krishnan 1993). The two principal dimensions of
marketing control are outcome- vs. behavior-based forms of control and the degree of
formality of marketing controls (Anderson and Oliver 1987; Celly and Frazier 1996;
Eisenhardt 1985; Jaworski 1988; Jaworski and MacInnis 1989; Jaworski et al. 1993;
Ouchi 1979). Outcome-based controls emphasize “bottom line”6 results whereas
behavior-based controls emphasize “tasks and activities”, that in turn are expected to
be related to bottom-line results (Celly and Frazier 1996).
Formal controls require written, management-initiated mechanisms that
influence the probability that employees or groups will behave in ways that support
the stated marketing objectives, e.g. marketing plans. Informal controls refer typically
to worker initiated mechanisms that influence the behavior of individuals or groups in
marketing units (Jaworski 1988).
Institutional theory.
Institutional theory (e.g. Meyer and Rowan 1977) postulates that
organizational action is mainly driven by cultural values and by the history of the
specific company as well as by those of its industry sector. In this framework,
organizational actions reflect imitative forces and traditions, even in the presence of
major changes in job content and technology (Eisenhardt 1988; Zucker 1987). In the
6 “Bottom line” usually means net profits but may alternatively mean whatever ultimate goal
the company seeks.

institutional perspective, organizational practices are legitimated by the environment
(Tolbert and Zucker 1983). According to Meyer and Rowan (1977) “organizations are
driven to incorporate the practices and procedures defined by prevailing rationalized
concepts of organizational work and institutionalized in society. Organizations that do
so increase their legitimacy and their survival prospects, independent of the immediate
efficacy of the acquired practices and procedures” (p. 340).
This perspective, whether it is formally institutional theory or not, provides an
essentially social view of metrics selection (e.g. Brown 1999). Dearborn and Simon
(1958) demonstrated that “functional conditioning” is an important predictor of
executives’ behavior, i.e. that executives generally perceive those aspects of a
situation that relate to the activities and goal of their department. This “selective
attention” has consequences for information gathering and use. The selection of the
type of measure employed to assess competitive advantage and evaluate the
effectiveness of marketing activities depends in fact on the manager’s “view of the
world” (Day and Nedungadi 1994).
Chattopadhyay et al. (1999) carried out an extensive study to determine the
factors that influence the way executives think. They conclude that “executives’
beliefs are clearly influenced to a greater extent by the beliefs of other members of the
upper-echelon team than by their past and current functional experience” (p. 781). As
a result of social desirability factors and political issues, the set of marketing metrics
selected by a company therefore tends to reflect the intended subjective performance
(‘what the Board wants’) that may in some cases be different from objective
performance (‘comparable information with competitors and/or information required
by external stakeholders’).

Orientation
The extent to which top management is interested in assessing marketing, or
market performance, may be explained by the extent to which they are market-
oriented (Day 1994a; Jaworski and Kohli 1993; Kohli and Jaworski 1990; Narver and
Slater 1990). Market-driven firms need to gather and disseminate market intelligence
within the organization (Day 1994b; Kohli and Jaworski 1990; Slater and Narver
1995). Various perspectives contribute to explain the vertical flow of market-related
information within the firm. Managers are forced by time, financial constraints and
environmental uncertainty to take a partial view of their environment (Day and
Nedungadi 1994). Thus the metrics they select reflect such a partial view and strategy
can perhaps be inferred from what managers measure.
Discussion of theoretical perspectives
The theoretical perspectives overlap to some degree. Control and agency
theories are two rational approaches to metrics selection but the latter is only relevant
where a separate marketing function determines the metrics to be presented to top
management. Institutional and orientation theories are more experiential and imply
that metrics selection will be driven by social factors within the firm and the industry
sector. None of these theories has much to contribute to which individual metrics will
be chosen except for market orientation which would relatively prefer external
customer and competitor market to internal, e.g. financial, metrics. This will be tested
later in this paper.
Managerial practice
Success measures can be classified broadly as either financial or non-financial
(Frazier and Howell 1982; Buckley et al. 1988). Early work in firm-level measurement

of marketing performance focused on financial measures: profit, sales and cash flow
(Sevin 1965, Feder 1965, Day and Fahey 1988).
Many authors criticized the only use of financial indicators in determining
marketing performance (Bhargava, Dubelaar and Ramaswani 1994; Chakravarthy
1986; Eccles 1991). Accounting measures are in the main short-term and take little
account of the value to the firm of long-term customer preference, or the marketing
investment which created it. For example, Chakravarthy (1986) wrote: “accounting-
measure-of-performance record only the history of a firm. Monitoring a firm’s strategy
requires measures that can also capture its potential for performance in the future” (p.
444). We suggest below that brand equity is the key to solving this problem.
In the 1980’s, market share gained popularity as a strong predictor of cash flow
and profitability (e.g. Buzzell and Gale 1987). Over the past decade, other non-
financial measures such as customer satisfaction (e.g. Ittner and Larcker 1998;
Szymaski and Henard 2001), customer loyalty (Dick and Basu 1994), and brand
equity (see Keller 1998 for review) have attracted wide attention. Ittner and Larcker
(1998) found that “the relationship between customer satisfaction and future
accounting performance generally is positive and statistical significant” (p. 2).
Clark (1999), in his history of marketing performance measures, showed how
traditional financial measures (profit, sales, cash flow) expanded to a range of non-
financial (market share, quality, customer satisfaction, loyalty, brand equity), input
(marketing audit, implementation and orientation) and output (marketing audit,
efficiency/effectiveness, multivariate analysis) measures. As a consequence, the
number and variety of measures has risen: Meyer (1998) suggests that “firms are
swamped with measures” (p. xvi) and that some have over 100 metrics. This variety
makes comparison difficult between results of different studies (Murphy et al. 1996).
A literature search of five leading marketing journals yielded 19 different measures of

marketing “success”, the most recurrent among which were sales, market share, profit
contribution, purchase intention (Ambler and Kokkinaki 1997).
The general pattern of evolution of marketing metrics appears to be:
• Little awareness of the need for marketing metrics at top executive level.
• Seeking the solution exclusively from financial metrics.
• Broadening the portfolio with a miscellany of non-financial metrics.
• Finding some rationale(s) to reduce the number of metrics to a manageable
set of about 25 or less, e.g. Unilever (1998).
Two kinds of benchmarks are required for the valid assessment of
performance: Internal benchmarks (e.g. plans) reveal the extent to which
management’s own expectations and goals are met. External benchmarks (e.g.
competitive, market) provide a more neutral perspective which also takes into account
environmental and market factors (Ambler and Kokkinaki 1997).
In addition to internal and external benchmarks, performance assessment for
any period requires adjustment for the effects brought forward from past, and carried
forward for future, periods. Some advertising effects take more than one year to decay
and therefore affects the following financial year (Assmus, Farley and Lehmann
1984).
Brand equity
The need for valid benchmark comparisons underlines the importance of
assessing short-term performance on a like-for-like basis. In accounting terms,
aligning the period’s inputs and outcomes requires their adjustment for the state of the
marketing asset, i.e. the benefits created by marketing which have yet to reach the
firm’s profit and loss account, at the beginning and end of the period in question.

Intangible assets are significant determinants of business performance
(Jacobson 1990). If a firm has built up large intangible assets, it can expect a
continuing flow of sales and profits without further investment, at least for a time.
Thus the intangible assets provide, in theory, a possible way to reconcile short and
long-term performance.
Brand equity (Aaker 1991; 1996) is a widely used term for the intangible
marketing asset. Srivastava and Shocker (1991) define brand equity as “a set of
associations and behaviors on the part of a brand’s customers, channel members and
parent corporation that permits the brand to earn greater volume or greater margins than
it could without the brand name and that gives a strong, sustainable and differential
advantage” (p. 5).
Building brand equity “provides sustainable competitive advantage because it
creates meaningful competitive barriers” (Yoo, Donthu and Lee 2000, p. 208),
including the opportunity for successful extensions, resilience against competitors’
promotional pressures, and creation of barriers to competitive entry (Farquhar 1989;
Keller 1993).
The literature indicates three main methods of measuring brand equity: non-
financial measures, brand valuation and consumer utility.
Non-financial measures are of two types: consumer behavioral measures, such
as loyalty and market share, and “intermediate” measures such as awareness and
intention to purchase (e.g. Keller 1993; Park and Srinivasan 1994). For example,
Keller (1993) defines customer-based brand equity as ''the differential effect of brand
knowledge on consumer response to the marketing of the brand'' (p. 8) to distinguish
the analysis of brand equity carried out by focusing on consumer intermediates to that
carried out by focusing on its financial outcome. Keller distinguishes between two
components of customer-based brand equity: brand awareness and brand image. The

first is related to the ability of the consumer to identify the brand, the second is instead
connected to the perceptions held about the brand, expressed in terms of product-
related attributes.
Agarwal and Rao (1996) found that ten popular brand equity measures (such
as perceptions and attitudes, preferences, choice intentions, and actual choice) were
convergent. Perceptions, preference and intentions (five in all) predicted market share
but the wider range of brand equity may still be necessary to explain behavior. In
other words, the extent of covariance was not enough to allow measures to be dropped
altogether. “It may not be necessary to subject respondents to difficult questions in
order to obtain accurate measures of brand equity. Simple appropriately worded
single-item scales may do just as well” (Agarwal and Rao 1996, p. 246). Customer-
based measures, however, are limited by the inability of a consumer survey to elicit
accurate information about the store environment in terms of prices and promotions of
different brands (Park and Srinivasan 1994).
The second, financial, perspective (e.g. Simon and Sullivan 1993) can be used
to value the brand at the beginning and end of each period and the difference used to
adjust the short-term performance (e.g. profits). For this reason it is attractive to
financially oriented firms. The leading analysis of the relationship between stock
market prices and brand value has been carried out by Simon and Sullivan (1993) who
separated the value of brand equity from the value of the firm’s other assets. The
result is an estimate of brand equity that is based on the financial market evaluation of
the firm’s future cash flow. The estimate of brand equity is obtained from the firm’s
intangible assets as a difference between the financial market value of the firm and the
value of its tangible assets. The main advantage of the financial approach is providing
measures that are future-oriented, compared to customer-based measures that reflect
the effectiveness of the marketing activities carried out by the firm in the past. The

financial approach is based on the future value of the present level of brand equity
because current stock return are driven by expectation about the future based on
current information (Lane and Jacobson 1995).
Kerin and Sethuraman (1998) underline the link between stock market prices
and a firm’s intangible assets: “From a financial perspective, tangible wealth
emanated from the incremental capitalized earnings and cash flows achieved by
linking a successful, established brand name to a product or service” (p. 260).
Of the various ways of valuing brands, discounted cash flow is the most
frequently used (Perrier 1997; Arthur Andersen 1992). Ambler and Barwise (1998)
claim that brand valuation is flawed for the purpose of assessing marketing
performance.
A third approach takes a utility perspective and infers the value of brand equity
from consumers’ choices by formulating assumptions about the structure of the utility
function at the individual level (Kamakura and Russell 1993; Swain et al. 1993). Its
major strength is the use of actual purchase behavior. However, the specification of
the utility function is weak: “our measure of intangible value is a residual and is
conditioned on both the validity of the overall Brand Value measure and on the
particular objective measures of physical features used” (Kamakura and Russell 1993,
p. 20). Swain et al. (1993), however, use “the entire utility value attributed to a brand
as a basis for measuring equity, whereas [Kamakura and Russell] use a specific part of
the utility function, reflecting their definition that brand equity is the “additional utility
not explained by measured attributes”” (p. 42). This choice is motivated by the fact
that “the effect of brand equity occurs throughout the components of the utility
function, and hence any measure of brand equity should be based on total utility” (p.
42). Swain et al. (1993) obtain a measure of brand equity, called Equalization Price,

by comparing the estimated utility with the utility obtained by the same set of brands
in a hypothetical referential market in which there is no market differentiation.
Lassar, Mittal and Sharma (1995) suggest that brand equity is the outcome of
consumer perceptions rather than of objective indicators. A measure of brand equity is
therefore related to financial results not because of its absolute value but because of its
value in relation to competition.
While there are various ways to measure brand equity, we conclude that
quantifying the increase or decline in this intangible asset is a crucial part of assessing
marketing performance since without that, short-term results can present a biased
picture.
CONCEPTUAL FRAMEWORK
The concept of marketing adopted within an organization affects the kind of
measurement system implemented for determining performance (Moorman 1995;
Dunn et al. 1994; Jaworski 1988; Ruekert 1992; Webster 1992). We identified the
need for the set of metrics reviewed by top management to be both necessary and
sufficient but they also need to be consistent across financial periods and across
business functions since they are both formed by, and part of, the firm’s culture and
internal understanding.
From a control theoretic point of view, metrics can be seen as indicating
progress towards objectives. As such, a set of metrics always concerns effectiveness,
but not necessarily efficiency. “The greater the consistency between each control and
the stated marketing objective, the greater the likelihood of attaining the marketing
objective” (Jaworski 1988, p. 32).

Since this research considers UK for-profit companies, we can conceptualize
their objective as the “bottom line” in the sense of profitability. Figure 1 provides the
basic model showing cash flow from customer to the firm’s profitability.
Figure 1: Basic Model
Firm’s Competitors’ Marketing Customers Marketing Activities Activities
Firm costs
Firm’s profitability
The discussion of brand equity would indicate that, conceptually, we can
assess marketing performance from the profitability in the period together with the
change in brand equity – primarily customer-based brand equity since most
practitioners would not include employees and other stakeholder-based brand equity
in a marketing assessment.
Since customer memories cannot be directly accessed, we opt for the first of
the three approaches discussed above since that includes the other two. In other
words, we will accept in principle financial (including brand valuation) and non-
financial measures, both intermediate and behavioral. Furthermore, the competitive
nature of the market can be recognized by accepting both absolute measures, e.g.
customer satisfaction, and relative measures, e.g. satisfaction as a percent of that held
by the leading competitor. Relative may be to one or more competitors or relative to
the whole market.

Of course this catholic acceptance of measures is subject to our definition of
metrics: top management must be using some, probably implicit, process to reduce the
possible measures to the necessary and sufficient (in their view) set of metrics.
Thus metrics may be derived according to control and/or institutional and/or
orientation theories. Figure 2 develops the basic model in order to separate out brand
equity effects in two ways: the immediate (trade) customer is distinguished from the
end user (consumer). This distinction applies to most business (including business to
business where the user is not usually the buyer) but not necessarily in retailing.
Secondly, intermediate effects are separated from consumer behavior.
Thus marketing activities impact both trade customers and consumers at the
intermediate, or in-the-head, level. These in turn interact and result in consumer
usage. Cash flows from consumer to trade customer to the financial results (both
costs and profits) but these also fund the marketing activities.
Figure 2: Generalized Model of Cash Flows
Tradecustomer
Firm’s CompetitorMarketing MarketingActivities Activities
Consumerintermediate
Consumerbehavior
Firm costsand profits

Figure 2 also provides a conceptual framework for assembling marketing
performance metrics in two respects. The short term metrics are supplied by the
inputs (marketing activities such as share of voice) and the outputs (the financial
results such as sales and profit contribution). Secondly, the brand equity asset,
changes in which are need to adjust the short-term perspective, are provided by the
status of the three boxes in the central column: trade customer and consumer
intermediate and behavior.
Thus a metrics system can itself be assessed by its fit with this framework and
the comparison of those metrics. Control theory suggests that metrics should be
compared with management expectations, e.g. a formal marketing plan. Market
orientation would imply that the metrics should be compared with competitor
performance. Finally, the short-term results should be adjusted by changes in brand
equity as noted above.
EMPIRICAL ANALYSIS OF CURRENT PRACTICE
This framework is now used to structure the findings from three stages of data
gathering. The first was qualitative (in-depth interviews) and the next two were
quantitative (surveys). The former survey used the framework in Figure 2 to group
metrics together and the latter quantified usage of individual metrics. The goal was to
establish current business practice both as the basis for further research and for
managers to benchmark their firms’ processes.
Stage One
Method After six pilot interviews with Chief Executives and senior marketers of UK
firms, 44 in-depth interviews were conducted with senior marketing and finance

managers from 24 British firms in order not to restrict the perspective to the marketers
(Homburg et al. 1999). Table 1 presents a description of this sample. An interview
guide was used to structure the discussions. The issues addressed included: the type of
measures collected, the level of review of these measures (e.g. marketing department,
Board), the assessment of the marketing asset, planning and benchmarking,
practitioners’ satisfaction with their measurement processes and their views on
measurement aspects that call for improvement, and firm orientation. Information on
firm characteristics, such as size and sector, was also obtained.
Table 1: Respondents by business size and sector (Stage One)
(# employees) Retail Consumer
goods
Consumer
services
B2B
goods
B2B
services
Other Total
Small (<110) 1 1 2
Medium (<500) 2 2
Large (>500) 2 15 13 4 6 40
Total 2 15 13 4 9 1 44
Results of Stage One
The framework in Figure 2 matched the way respondents grouped metrics
except for innovation. This was considered an important category but the metrics
proposed, e.g. the proportion of sales represented by products launched in the last
three years, did not fit the five categories. Accordingly this category was added.
Table 2 presents the results of summarizing the respondents’ key marketing
measures by category. Responses were obtained through an open ended, top-of-mind
question concerning how each firm assesses its marketing performance. Financial

measures were the most frequently mentioned, especially by the finance respondents,
who also made less mention of consumer intermediate.
Table 2: Marketing metric categories (percent mentions – Stage One)
Marketers Finance Total
Financial 40.7 54.7 44.4
Consumer intermediate 30.3 13.3 25.9
Competitive 12.7 16.0 13.5
Consumer behavior 13.2 14.7 13.5
Direct customer 2.6 0.0 1.9
Innovativeness 0.5 1.3 0.8
100 100 100
Number of measures per
respondent
6.6 5.0 6.0
Number of respondents 29 15 44
The areas where improvements are sought are, in declining frequency of
mention: specifics (more detail) on campaign, launch and promotions performance;
speed and regularity of data which was now considered too slow and ad hoc;
predictiveness and modeling; more financial data (mostly from the Finance
respondents); better customer information. Some respondents felt they already had too
many data and needed no more. This last point is important. It indicates that collecting
a large number of measures is not always a good thing. In fact, it can complicate
assessment and mislead managers, especially when these measures are not integrated
into a meaningful system. Marketers use many measures but overviews seem to be
weighted to internal financial figures rather than customer and competitor indicators.

Although these categories are not strictly discrete, they matched respondents’
perceptions in that the first category of measures were provided internally, by their
accounting colleagues in management accounts, whereas the other figures came from
market research and off-line reporting systems, e.g. consumer thoughts and feelings
(intermediate).
Stage Two Method
The findings of the qualitative study were used to develop a survey instrument
for Stage Two. After piloting, the questionnaire was sent to 1,014 marketing and
1,180 finance senior executives in the UK, recruited through their professional bodies
(i.e. the Marketing Council, the Marketing Society, the Institute of Chartered
Accounts in England and Wales). A total of 531 questionnaires were returned (367
from marketers and 164 from finance officers, response rate 36 percent and 14
percent, respectively).
Different waves of marketer data showed no significant differences but the
survey arrangement with the Institute of Chartered Accountants in England and
Wales did not allow reminder or follow up. Comparing early and late returns gave no
cause for concern (Armstrong and Overton 1977). The two sub-samples did not differ
substantially in terms of the distribution of firm size, and business sector, with the
exception of the consumer goods sector which was slightly over-represented in the
marketers group (see Table 3). The two sub-samples did not differ significantly in
terms of the crucial variables of performance and customer and competitor orientation.

Table 3: Respondents by business size and sector (Stage Two)
(# employees) Retail Consumer goods
Consumer services
B2B goods
B2B services
Other Total
Small (<110) 8 7 14 6 44 32 111
Medium (<500)
8 13 6 7 21 12 67
Large (>500) 51 111 38 30 38 77 345
Missing values 8
Total 67 131 58 43 103 121 531
Respondents were asked to indicate the importance attached to the different
measurement categories by top management on a 7-point scale. They were also asked
to report how regularly data are collected for each measure category and the
benchmark against which each measure category is compared (previous year,
marketing/business plan, total category data, specific competitors, other units in the
group). The survey instrument is attached as Appendix A.
Respondents were also asked whether they have a term for the main intangible
asset built by the firm’s marketing efforts and whether this asset is formally and
regularly tracked, through financial valuation or other measures. Customer and
competitor orientation were measured with eight 7-point Likert type scales drawn
from Narver and Slater (1990). Separate single indices of customer and competitor
orientation were computed as the mean of responses to these items (Cronbach’s alpha
.81 and .69, respectively).
Performance was operationalized as the mean of responses to two 5-point
scales asking participants to indicate how their competitors view them (strong leader
vs. laggard) and to rate their success in comparison to the average in the sector
(excellent vs. poor, alpha = .52). Despite its relatively low reliability, this item was
retained as separate analyses for each individual measure of performance yielded
substantively similar patterns of results.

Results – Measurement categories
Financial measures were reported as being seen by top management as
significantly more important than all other categories (p<.001 in all cases). The
differences between customer and competitive measures are small, but innovativeness
rates slightly lower. The relative importance of the prompted categories in Stage Two
gives a balanced scorecard impression which is very different from the top of mind
metric mentions in Stage One.
Table 4: Importance of metrics categories (Stage One and Two)
Metrics category Stage One Percent mentions
Stage Two Mean Importance
Financial 44.4 6.51
Direct customer 1.9 5.53
Competitive 13.5 5.42
Consumer intermediate 25.9 5.42
Consumer behavior 13.5 5.38
Innovativeness 0.8 5.04
As Stage One showed, marketers give less mentions of finance metrics than
finance respondents. However, apart from a slightly greater concern with innovation
by marketers, there were no other significant differences. The consensus may be
explained by both marketers and finance respondents being asked in Stage Two to
report the importance attached by top management. It is worth reminding ourselves
that we are not seeking to establish which measures are normatively ideal but
exploring current practice. There were no significant differences in measurement
category importance between different business sectors.
Practitioners were neither satisfied nor dissatisfied, overall, with their
marketing performance measurement systems (mean = 4.06). Finance officers,

however, were more satisfied than marketers (4.28 vs. 3.97, t (510) = -2.24, p <.05).
This finding may be explained by their focus being mainly on financial figures.
Irrespective of the importance attached to different indicators, financial
measures are more frequently collected than any other category. Table 5 shows in bold
type the modal regularity for each category of measure. In 33.5 percent of the cases,
consumer intermediate measures are collected only rarely/ad hoc. Innovation, which
some see as the lifeblood of marketing (e.g. Simmonds 1986), is least regularly
measured. That may partly be due to the difficulty of quantifying innovativeness.
Table 5: Regularity of data collection (Stage Two)
Metric category Monthly or more percent
Yearly/ Quarterly percent
Rarely/ Ad hoc percent
Never percent
Financial 74.9 16.6 6.9 1.5
Competitive 36.2 39.9 21.1 2.7
Consumer behavior 23.0 45.9 26.9 4.2
Consumer intermediate 17.5 43.5 33.5 5.5
Direct customer 25.1 42.0 27.7 5.2
Innovativeness 10.3 34.7 40.9 14.1
In order to determine whether firm size influences the regularity with which
different measures are collected, regularity was regressed on size. With the exception
of innovativeness measures, firm size had a significant effect on regularity of data
collection in all other measure categories. As might be expected, larger firms tend
measure most categories more frequently than smaller firms. Similarly, business
sector was found to have a significant effect on frequency of data collection, with the
exception of innovativeness. On average, irrespective of metric category, consumer
goods and retail firms tend to collect data more frequently than other sectors (F (5,
512) = 11.81, p < .000).

Metrics comparisons
Table 6 shows that plans provide the most frequent benchmarks of financial
and innovativeness measures, in those cases where such measures are used. However,
competitive metrics seem to be compared with market research rather than forecast in
plans. Consumer and direct customer measures are modally compared with previous
year results. Market share apart, it appears that internal (plan) and external
benchmarks are routinely used only by the minority of respondent firms. The modal
frequency for each row is highlighted.
Table 6: Frequency of benchmarks used (Stage Two)
Metric category (valid percent, where category used)
Previous year
Marketing/ Business Plan
Total category
data
Specific competitor
Other units in
the Group
Financial measures 80.4 85.1 17.5 23.0 22.0
Competitive 51.4 51.0 35.8 55.7 6.6
Consumer behavior 47.1 42.0 27.1 31.6 6.4
Consumer intermediate 36.7 30.3 22.0 27.7 5.1
Direct customer 40.3 37.7 17.3 22.8 7.3
Innovativeness 21.3 33.7 10.9 20.7 6.6
Brand equity
Moving now to the marketing asset, 328 respondents (62.2 percent of the total)
reported the use of some term to describe the concept. The most common terms are
brand equity (32.5 percent of those who reported a term), reputation (19.6 percent),
brand strength (8.8 percent), brand value (8.2 percent) and brand health (6.9 percent).
20 percent (of those who use a term) use one or more of 65 different terms, such as
brand integrity, customer loyalty, global image, quality, contact base and trademark
value. 3.4 percent of those who claimed usage of some term did not report it when

prompted (11 cases). 112 respondents (24.9 valid percent of the total) regularly (yearly
or more) value the marketing asset financially, and 163 (41 valid percent) regularly
quantify it in other ways, e.g. through customer/consumer based measures (see Table
7). 79 respondents do both. These findings suggest that a minority of companies (37
percent of total sample) quantify their marketing assets, using any formulation, on a
regular basis.
Table 7: Regularity of tracking the marketing asset (valid percent of the total sample)
Never Rarely/Ad hoc
Regularly Yearly/Quarterly
Monthly or more
Financial valuation 51.4 23.6 16.9 8.0
Other measures 36.8 22.2 28.7 12.3
Our conceptual framework suggested that the marketing performance
assessment system could be tested with three criteria: comparisons with both internal
(plan) and external (competitor) performance benchmarks, adjusted by changes in the
marketing asset. Of the 196 respondents (37 percent) who quantify their marketing
assets (either financially and/or in other ways), 128 (24 percent) also quantify
consumer, competitive or direct customer measures in their business plan (internal)
and use market or competitive benchmarks. Thus, on this survey, less than one quarter
of UK firms could meet all three criteria. These data merely indicate that they have the
measures available for such comparisons, not that they necessarily make them. The
process by which marketing performance is assessed overall requires further
investigation.
Market orientation
We now move to the analyses concerning the relations between firm
orientation, performance and its assessment. In order to examine whether customer

and competitor orientation have an effect on performance assessment practices,
regularity of tracking and importance attached to different measures were regressed
simultaneously on these constructs, after partialling out the effect of firm size and
sector. As can be seen in Table 8, customer orientation is positively associated with
the regularity of collection of consumer, direct customer and innovativeness measures.
As might be expected, more customer-oriented firms tend to collect data on such
measures more frequently than firms less so oriented. Customer orientation does not
seem to influence the regularity of tracking of financial and competitive measures, but
the regularity of collection of competitor measures is influenced by competitor
orientation. The relation between orientation and measure importance is less clear
(Table 9). Customer orientation is positively related with the importance attached to
most measures except financial and competitive measures. Competitor orientation also
influences the importance of competitor measures, but it is also a significant predictor
of the importance attached to measures related to consumer behavior, consumer
thoughts and feelings and innovativeness.
Table 8: Regression of regularity of tracking on customer and competitor orientation
Metric category Customer Orientation
Competitor Orientation
F R R2 beta t Beta t
Financial 210.40*** .27 .07 .03 .83 .05 1.13
Competitive 39.17*** .48 .23 .03 .81 .22 5.31***
Consumer behavior 11.14*** .28 .08 .18 3.78*** .07 1.50
Consumer intermediate 12.07*** .31 .09 .23 4.88*** .00 .16
Direct customer 8.53*** .26 .07 .16 3.29*** .00 .04
Innovativeness 9.01*** .26 .07 .24 5.05*** .03 .71 *** p < .001

Table 9: Regression of metric category importance on customer and competitor orientation
Metric Category Customer orientation
Competitor orientation
F R R2 beta T beta t
Financial 4.86*** .19 .00 .10 2.19* .03 .71
Competitive 27.88*** .42 .18 .05 1.30 .26 6.03***
Consumer behavior 19.05*** .36 .13 .25 5.64*** .16 3.57***
Consumer intermediate 21.45*** .38 .14 .30 6.68*** .09 2.18*
Direct customer 9.40*** .26 .07 .22 4.67*** .07 1.62
Innovativeness 9.80*** .26 .07 .20 4.29*** .10 2.32*
*** p < .001, *p < .05
Tables 8 and 9 show that both customer and competitor orientation
significantly predicted assessment practice. No moderating effects by size or sector
were observed, with the exception of the importance attached to competitive
measures, which was moderated by firm size. The results indicate that customer
orientation is a stronger predictor of the importance of competitive measures for large
firms, compared to small firms (beta of the interaction term = .50, t = 2.60, p < .01).
However, competitor orientation is a stronger predictor of importance for small firms,
compared to large firms (beta of the interaction term = -.46, t = -2.57, p < .01). We
have no simple explanation for these results. It is possible that larger firms need to be
more customer oriented in order to be effective, perhaps because they already are
competitor oriented. For smaller firms, competitor orientation seems to be more
important, perhaps because they already are customer oriented.
Customer and competitor orientation were both significantly correlated with
reported business performance (r = .25, p < .001 and r = .14, p < .001, respectively).
Marketing performance was regressed on customer and competitor orientation after
the effect of business size and sector had been partialled out. Neither firm size nor

sector had a significant effect on performance. Customer orientation was a significant
(p<.001) predictor of performance whereas competitor orientation was a significant
only when used as the sole determinant of performance, i.e. when the effect of
customer performance was not taken into account.
Business sector moderated the effect of orientation on performance. For retail
and consumer services firms, neither customer nor competitor orientation was a
significant predictor of performance. For consumer goods and business-to-business
goods firms, only customer orientation was a significant predictor of performance
(beta = .32, t = 3.43, p < .001 and beta = .42, t = 2.67, p < .01, respectively).
However, in the business-to-business services sector, only competitor, and not
customer orientation, significantly predicted performance (beta = .27, t = 2.64, p <
.01). Size did not moderate the orientation-performance relation.
Stage Three
Method
Measures of marketing performance were obtained independently from the
literature and through Stage One which resulted in a survey instrument with 54
metrics. To focus on substantive metrics we excluded year on year changes (i.e. trends
or derivatives), diagnostics (e.g. analyses of metrics by channel, region, or product
size), composites of other metrics (e.g. the profit to sales ratio where both profits and
sales were already included as separate metrics) and the same metrics for different
time periods (e.g. sales for the period of the promotion and sales for the whole year).
The survey instrument was piloted, and respondents were encouraged to
identify additional metrics they used. No new metric had more than its original
supporter and none were added in view of the need to keep the survey instrument to a
length respondents would tolerate. Metrics which found no usage in the pilot phase

were eliminated. Metrics used solely for trending and analysis rather than marketing
assessment were discarded as noted above. Appendix B shows the 38 metrics used for
the final survey and those eliminated after the pilot.
A telephone survey was conducted of 200 marketing or finance senior
executives with an additional 31 at the pilot stage. The survey instrument was
unchanged apart from reformatting for telephone usage. We used lists supplied by The
Marketing Society and The Institute of Chartered Accountants in England and Wales.
In both cases, only senior practitioners were selected. In the event, some of those had
changed role since the lists were compiled but they were still in senior roles in their
companies and qualified to respond. The acceptance level for the telephone
interviews, i.e. response level, was 50.1%. This excludes wrong numbers and other
technical blockages.
Respondents were asked to indicate the importance of each measure for
assessing the overall marketing performance of the business on a 5-point scale from
very important (5) to not at all important (1). They were also asked to indicate the
highest level of routine review of this metric within the firm, on a scale ranging from
the [group’s] top board level (5) through junior marketing (1) to not used at all (0).
Respondents were also asked to add any relevant measures not listed. Performance
was operationalized as the mean of responses to four 5-point scales asking participants
to rate the firm’s performance relative to major competitors, the business plan, and
prior sales performance; and to rate its overall marketing performance.
Contextual data indicated a broad spread across firm size, business sector,
organization structure, and age of business with a broad spread across these factors.
Although the telephone calls and questionnaires were addressed to individually named
marketers and accountants (50/50), Table 10 show that a sizeable minority of

respondents were in other roles, either because the individuals had changed positions
or had assigned the survey to a more suitable colleague.
Table 10: Respondents by Sector and Role
Sector Finance Marketing Manager
Marketing Services Agency
Other Consultant
Other Total
Retail 3 13 6 22
Consumer Goods 3 22 1 6 32
Consumer Services 6 9 1 7 23
B2B Goods 22 12 7 41
B2B Services 21 14 1 3 27 66
Other 24 11 11 46
Missing 1
Total 79 81 2 4 64 231
Stage Three Results First we report metrics usage. We expected correlation between the perceived
importance of metric and whether top management reviewed them. Then we analyze
sector and respondent role (marketer vs. accountant) differences. Finally we
developed a short list of primary metrics through content validity and scale
purification techniques.
Table 11 ranks the top 15 (> 62 percent usage) metrics by frequency of use
compared with the frequency that it was rated as “very important” and the frequency
that it reached the top level of management. In the UK, top management and top
“board” are synonymous.

Table 11: Ranking of Marketing Metrics
Metric % claiming
to use measure
% firms rating as very
important
% claimed to reach top level
Pearson Correlation
between Level and Importance
1. Profit/Profitability 92 80 71 .719**
2. Sales, Value and/or Volume 91 71 65 .758**
3. Gross Margin 81 66 58 .827**
4. Awareness 78 28 29 .732**
5. Market Share (Volume or Value) 78 37 34 .727**
6. Number of New Products 73 18 19 .859**
7. Relative Price (SOMValue/Volume) 70 36 33 .735**
8. Number of Consumer Complaints (Level of dissatisfaction)
69 45 31 .802**
9. Consumer Satisfaction 68 48 37 .815**
10.Distribution/Availability 66 18 11 .900**
11. Total Number of Customers 66 24 23 .812**
12. Marketing Spend 65 39 46 .849**
13. Perceived Quality/esteem 64 37 32 .783**
14. Loyalty/Retention 64 47 34 .830**
15. Relative perceived quality 63. 39 30 .814** n = 231, ** p < .01
Table 11 shows the expected correlation between the measure being seen as
very important and its review by the top management level but we were surprised by
the relatively low levels reported for basics such as sales and profitability. Every
board must see these figures as part of their financial accounts but the context here
was marketing. For example, the board of a multi-brand company may not see profits
for each brand. We interpreted these results in terms of the respondents’
understanding of what top management reviewed when they were considering
marketing but this needs to be tested.
In line with Stage Two, most firms rely primarily on internally generated
financial figures to assess their marketing performance. The last column in Table 12
shows the Stage Two results adjusted from its 7-point to a 5-point scale. While the

differences between the other groups were not large, the main changes were the higher
ratings for direct customer and innovativeness.
Table 12: The importance of metrics by category
Metrics category Stage Three Mean N = Stage Two Mean
Financial 4.54 222 4.68
Direct Customer 4.19 138 4.02
Competitive 4.05 211 3.95
Innovativeness 4.03 211 3.69
Consumer behavior 3.96 207 3.92
Consumer intermediate 3.95 202 3.95
n = 5257
The main difference in the number of responses was due to retail and “other”
respondents (68 of 231) not having trade customers as distinct from end users.
Business sector was found to have a significant effect on the usage of specific items,
particularly consumer intermediate (e.g. attitudes), competitive market and financial
measures. Distinctions between sectors were greater for level of importance measures
than level of review. As would be expected, consumer oriented items are more
important for consumer sectors.
Tables 13 separates perceived importance by sector. For clarification, the
highest and lowest means on each row have been underlined or put into bold,
respectively. Consumer goods consistently rates metrics highly both in terms of
importance and level of review whereas business-to-business services consistently
ranks them lowly on both counts. It is probably fair to deduce that consumer goods
are the most, and business-to-business services the least, market oriented sectors.
Analysis by level of review provides, as would be expected in view of their correlation
noted earlier, a similar picture.

Table 13: Means for perceived importance by sector
Metric Retail (N=22)
Consumer Goods (N=32)
Consumer Services (N=23)
B2B goods
(N=41)
B2B services (N=66)
Other (N=46)
Other attitudes e.g. liking 2.82 2.97 2.61 3.02 1.06 1.47
Image/personality/identity 2.72 3.5 1.83 1.53 2.71 2.44
Penetration 2.00 3.59 2.95 2.15 1.11 1.89
Salience 1.64 2.34 1.81 0.80 0.85 1.56
Commitment/purchase intent
2.55 3.47 3.39 1.54 1.55 1.77
Distribution/availability 1.48 2.84 0.9 1.6 0.53 1.07
Percent Discount 2.0 2.72 2.19 1.76 0.74 0.87
Awareness 3.09 3.41 3.68 1.83 1.88 2.85
Relevance to Consumer 1.91 3.22 3.52 1.68 1.47 2.36
Marketing Spend 3.73 3.78 3.27 3.51 2.14 2.39
Market Share 3.23 3.88 3.36 3.51 2.08 2.68
Share of Voice 1.64 2.66 1.70 1.54 0.71 1.13
Brand/product knowledge 3.13 2.94 3.17 1.88 1.55 2.38
Conversions 1.52 1.56 3.30 1.80 2.55 2.20
Margin of New Products 2.52 2.56 2.70 3.07 1.32 1.89
Purchasing on Promotion 2.64 1.81 1.30 1.29 0.62 0.96
Marketers reported 17 percent more metrics in use by their companies than
their finance peers. With the exception of shareholder value and number of new
customers, finance respondents’ reported use of a given metric was always lower than
marketers’. Differences were greater for level of importance than for level of review.
These differences probably indicate different awareness levels as distinct from actual
usage within the firm due to marketers’ greater familiarity with their measures.
Differences between the groups were greatest for consumer attitude and behavior
measures. Table 14 highlights those metrics where the differences between marketers
7 Due to missing values there were small variations in sample size per cell.

and accountants are significant but these mostly relate to importance. As would be
expected, the reporting on the level of review was similar.
Table 14: ANOVA for significant metric variations by role
Level of Importance Level of Review
df F Df F
Distribution/Availability 218 5.726*** * *
Awareness 229 8.78*** 229 2.936**
Other attitudes, e.g. liking 228 6.110*** 229 2.599**
Relevance to consumer 226 5.43*** * *
Image/personality/identity 226 5.074** * *
Perceived differentiation 227 3.329** * *
Conversions 225 2.976** * *
Salience 225 5.436*** * *
Commitment/Purchase intent 228 3.354** * *
Purchasing on promotion 225 8.922*** * *
Penetration 225 3.754** 229 2.887**
Share of voice 225 9.877*** 229 7.952***
Percent discount 226 3.443** * *
Loyalty/Retention 228 3.147** * *
Number of products per customer 226 4.543** * *
Market share 226 7.72*** * *
Brand/Product knowledge 228 5.320*** * *
Revenue from new products 225 2.845** * *
Marketing spend 228 5.979*** * * n = 231, * not significant, ** p < .05, *** p < .001
Developing primary metrics
This section considers which metrics should be selected as being generally
valuable, irrespective of sector or size. Content validity (Churchill 1979) using a 50
percent cutoff (Cronbach and Meehl 1955) left 30 metrics which were then subjected
to scale purification procedures. Construct validity was assessed with the guidelines
outlined by Churchill (1979) and Gerbing and Anderson (1987). We examined item-

to-total correlations and the factor structure (through principal components) for each
scale. The decision criterion for item deletion was an improvement in corresponding
alpha values to the point at which all items retained had corrected item-total
correlations greater than 0.5. Eight items were eliminated, varying slightly as to
whether the level of review or level of importance was considered.

Table 15: Recommended item set for scale development
If level of review is measured If level of importance is measured
Construct Alpha Items Alpha Items
Consumer attitudes
.85 Awareness Perceived quality Consumer satisfaction Relevance to consumer Image/personality Perceived differentiation Brand/product knowledge
.84 Awareness Perceived quality Consumer satisfaction Relevance to consumer Perceived differentiation Brand/product knowledge
Consumer behavior
.78 Total number of consumers Number of new consumers Loyalty/retention Conversions Number of consumer complaints
.83 Number of new consumers Loyalty Leads generated Conversions
Trade customer
.80 Customer satisfaction Number of complaints
.79 Distribution/availability Customer satisfaction Number of customer complaints
Relative to competitor
.79 Relative consumer satisfaction Perceived quality
.80 Relative consumer satisfaction Perceived quality Share of voice
Innovation .84 Number of new products Revenue of new products Margin of new products
.81 Number of new products Revenue of new products Margin of new products
Financial .81 Sales Gross margins Profitability
.77 Sales Gross margins Profitability
TOTAL : 22 items TOTAL : 22 items n = 231
Level of review and importance are both shown for comparison. 19 items
match and could be considered as the primary general metrics: Awareness, Perceived
quality, Consumer satisfaction, Relevance to consumer, Perceived differentiation,
Brand/product knowledge, Number of new customers, Loyalty/retention, Conversions,
[Trade] Customer satisfaction, Number of complaints, Relative consumer satisfaction,
Perceived quality, Number of new products, Revenue of new products, Margin of new
products, Sales, Gross margins, Profitability.

DISCUSSION
While the 19 primary metrics were well distributed over the framework in
Figure 2 above it is perhaps surprising that market share and relative price are omitted.
Subsequent practitioner discussions have informally suggested that, in many sectors,
these metrics are uncertain. For example, in financial services the basis for
calculating relative price was not known.
All three stages indicate that financial metrics are most commonly employed to
evaluate performance, both in terms of importance attributed by the respondents and
of regularity of assessment. This is in line with the traditional use of financial
measures (Clark 1999).
We now compare the empirical findings with the three theories used as
background for this research. Control theory requires formal comparisons which
requires benchmarking performance against expected standards (usually plan). Table
6 shows that 85 percent of financial metrics were controlled in this way but otherwise
benchmarking was between one third and one half of metrics. Furthermore, rigorous
application of control theory would require both internal and external benchmarking
and adjustment of short-term results by any change in brand equity. We did not obtain
an exact proportion of firms meeting these three tests but it is possible from the data to
infer that it is less than one quarter. Table 7 shows 17 percent using brand valuation
and 29 percent other measures but these overlap. Table 6 shows that internal and
external benchmarking, apart from financial measures, range from 23 to 55 percent for
the five internal and five external categories. We cannot be certain of the percent of

companies that meet all criteria for all metric categories but the upper bound of that is
the lower bound of the individual figures.
Orientation theory was consistent with metrics usage as shown for regularity
and importance (Tables 8 and 9 respectively). Our results also provide limited support
for the relationship between market orientation and performance being influenced by
sector (Slater and Narver 1994). Customer orientation was a significant determinant
of performance for consumer goods and business-to-business goods and competitor
orientation was a significant determinant of performance for business-to-business
service sector.
Institution theory appears to be consistent with the evolutionary process of
metrics selection. We found little evidence of firms deliberately constructing an ideal
set of metrics according to some rational process. The impression we gained was
more of trial and error, the speed of which depended upon the corporate climate
within the firm. Firms appear to proceed incrementally as metrics are added and
dropped.
This research confirms the validity of the main metrics categories: consumer
intermediate (in the mind) and behavior, trade customer, relative to competitor,
innovation and financial. The analysis concluded with a general list of 19 metrics
which could serve as a starting point for firms wishing to strategically reassess their
selection. This could be modified by examining the sector separations for importance
and level of review.
MANAGERIAL IMPLICATIONS
Shaw and Mazur (1997) suggest that non-marketer dissatisfaction with
marketing is partly due to a perception that measurement is not taken seriously by
marketers. “Marketing executives themselves have shown a marked reluctance to take

on ‘support’ roles, preferring the glamour of big-budget advertising over developing
corporate marketing measures” (p.1). And: “Marketing is rarely involved in
measurement development, and consequently the finance department is left alone to
do the job as best it can” (p.4).
The imprecision of marketing language, as seen by other business disciplines
(Shaw and Mazur 1997), and the changing perception of marketing within
organizations (Webster 1992) indicate a need for a formal definition of “metrics”
which we do not regard as just another word for measures or indicators. We propose
that “metrics” can be limited to performance measures which are high level,
necessary, sufficient, unambiguous, and, ideally, predictive. Brand equity is the store
of future profits. Finance officers may continue to be reluctant to support marketing
investment unless they can measure the resulting changes in profits and brand equity.
The systematic benchmarking of performance, implicit in control theory, does
not deny wider considerations and therefore other metrics and processes, for example
the importance of satisfying multiple stakeholders (Chakravarty 1986). Furthermore
the selection of a different strategy implies the selection of different metrics which are
only marker posts in that direction. In particular, the two extremes of conventionality
and differentiation are both sub-optimal and that, as always in marketing, the amount
of uncertainty existing in a market makes the optimal solution closer to one extreme
or the other (Geletkanycz and Hambrick 1997).
For example, most managers regard more market share as better, but they may
be wrong. More market share bought at the expenses of reputation, e.g. through price
promotions, can damage the brand’s health permanently (Jedidi, Mela and Gupta
1999; Mela, Gupta and Lehmann 1997). A similar view has been expressed by Day
and Wensley (1988) who wrote: “The measurement appropriate or even feasible for a
semiconductor or auto parts manufacturer differ from those suited to a retail banker or
apparel manufacturer. This fact does not exempt the monitoring system – comprising
the measures used and the and the composite picture they give of the competition
position – from having to meet the basic requirements of any attempt to assess
advantages” (p. 17).
The significance of brand equity has been increasingly recognized through the
1990s but our findings suggest that it has yet to be fully adopted by firms in their
routine measurement systems. Nor are results benchmarked internally and externally.
We hope that this paper provides the basis on which firms could review their selection
of marketing metrics and the benchmarks for performance comparison.
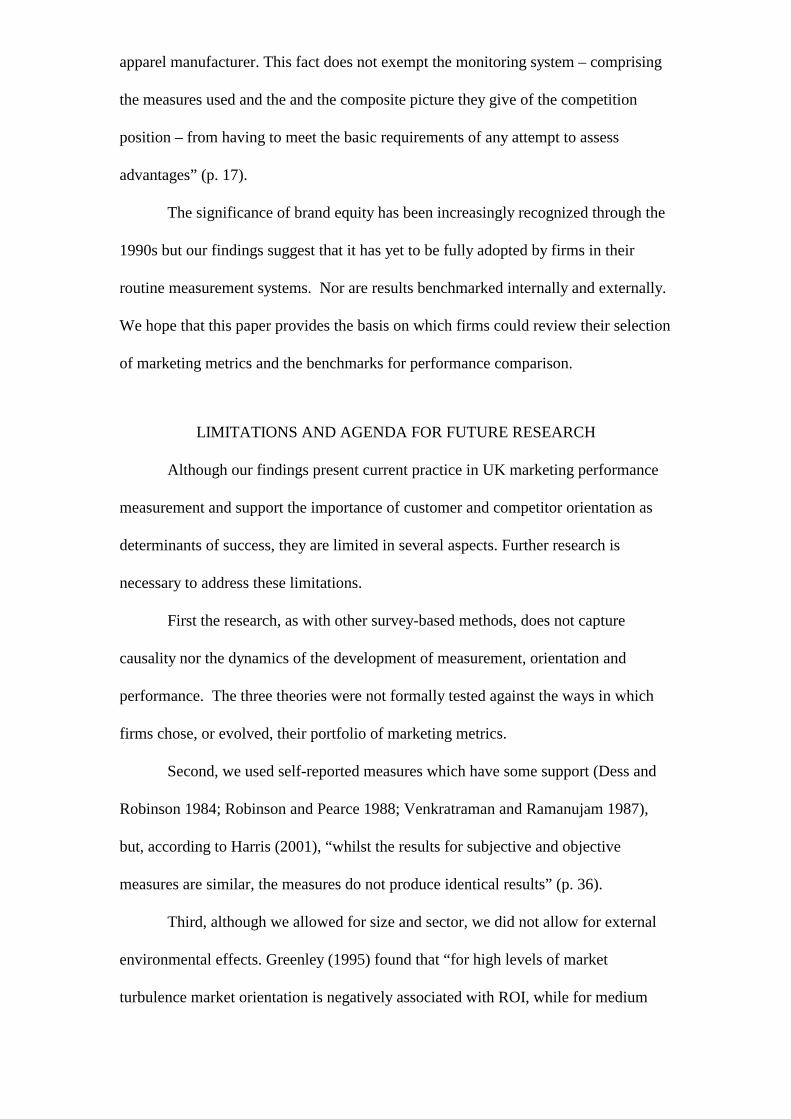
LIMITATIONS AND AGENDA FOR FUTURE RESEARCH
Although our findings present current practice in UK marketing performance
measurement and support the importance of customer and competitor orientation as
determinants of success, they are limited in several aspects. Further research is
necessary to address these limitations.
First the research, as with other survey-based methods, does not capture
causality nor the dynamics of the development of measurement, orientation and
performance. The three theories were not formally tested against the ways in which
firms chose, or evolved, their portfolio of marketing metrics.
Second, we used self-reported measures which have some support (Dess and
Robinson 1984; Robinson and Pearce 1988; Venkratraman and Ramanujam 1987),
but, according to Harris (2001), “whilst the results for subjective and objective
measures are similar, the measures do not produce identical results” (p. 36).
Third, although we allowed for size and sector, we did not allow for external
environmental effects. Greenley (1995) found that “for high levels of market
turbulence market orientation is negatively associated with ROI, while for medium

and low market turbulence market orientation is positively associated with ROI” (p.
7). Harris (2001) found little relationship between market orientation and both
subjective and objective measures of performance except “under specific moderating
environmental condition, market orientation is associated with both measures of
performance” (p. 33). Taking all these studies together it is possible that ”in cases
where the market is highly dynamic in nature, consistency may be more important
than market responsiveness” (Harris 2001, p. 35).
Fourth, we considered the assessment of marketing as a whole, without
attempting to disentangle the effect of the different marketing instruments on the
overall marketing performance or to ascertain how companies evaluate separately the
effectiveness of different marketing actions. There is a wide literature on the effects of
components of the marketing mix, e.g. advertising (Assmus et al. 1984; Vakratsas and
Ambler 1999) and promotions (Mela et al. 1997) effectiveness. Future research could
valuably link the holistic and separate perspectives. Moreover, the weakest area of
metrics concerned innovation which also, in this data, failed to correlate with
performance. Research is now developing in this direction (e.g. Hurley and Hult 1998)
and managers will need to develop practical means for tracking the relationship.
Finally, the questionnaire did not include explicit reference to online metrics, a
topic that is becoming increasingly important (Marketing Science Institute 2000;
Mohammed et al. 2001). Even though some analytic instruments developed for the
analysis of offline environments are likely to provide useful suggestions (Marketing
Science Institute 2000), the development of an efficient system of online metrics
requires the development of an entire new set of tools.

CONCLUSIONS
We have summarized the marketing metrics literature and relevant theory.
From this we developed a generalized framework of marketing around five
measurement categories: financial, competitive, consumer behavior, consumer
intermediate, i.e. thoughts and feelings, and direct trade customer. In addition we
established three criteria for the assessment of a metrics system: comparison with
internal expectations, e.g. plan, and the external market together with an adjustment
for any change in the marketing asset brand equity). We suggested that this should
take care of the problem of short-termism: that “only short-term results of marketing
actions are readily observable, yet short-term profit maximization is not the best
paradigm for allocating resources” (Dekimpe and Hanssens 1999, p. 397).
Using this basis, the research gathered an empirical description of current
metrics practice in the UK through three stages. The first was qualitative which
broadly supported the framework once innovativeness had been added. The second
stage explored the use and perceived importance of metrics by category. Financial
metrics retain their dominance but the use of customer metrics was associated both
with a customer orientation, as might be expected, and with profitability. Similarly,
although to a lesser extent, competitive metrics were associated with a competitive
orientation and profitability.
These effects were moderated by business sector: only for consumer and
business-to-business goods firms was customer orientation significantly associated
with performance. In the business-to-business services sector, only competitor
orientation was significantly associated with performance. Size did not moderate the
orientation-performance relation.

According to this survey, less than one quarter of UK firms could meet all
three marketing performance assessment criteria above, i.e. they had the data to do so.
It seems likely that best practice, as thus defined, is much less frequent.
The third stage separated out individual metrics and through a succession of
analyses brought us to a general set of 19 metrics which could be used as a starting
point by firms wishing to benchmark their own portfolio. However metrics usage is
substantially moderated by size and sector. Larger firms use more metrics and the
needs of retail, for example, are different from those in the consumer goods sector.
In today’s market companies face intensive competition and deal with more
knowledgeable and aware consumers. Markets are characterized by an abundance of
goods and services but buyers have less time to devote to making choices.
Communication and distribution channels proliferate but the attention to any one
channel diminishes. Information technology eliminates time zones and geographical
and cultural boundaries in a way unthinkable just a couple of decades ago. This
increasing complexity makes it more and more difficult for top managers to navigate
experientially and will put an increasing emphasis on metrics.

Appendix A: Stage Two survey instrument Overall, how satisfied are you with your existing measures of marketing effectiveness? Very satisfied Satisfied Fairly satisfied Neither satisfied
Nor dissatisfied Fairly
dissatisfied Dissatisfied Very
dissatisfied ! ! ! ! ! ! !
What measures are considered by your firm’s TOP management (or Board) when reviewing marketing performance? And how often?
Never Rarely/ Ad hoc
Regularly Yearly/Quarterly
Monthly or more Don’t know/ not applicable
Financial measures ! ! ! ! ! (e.g. sales volume/turnover, profit contribution, ROC) Competitive market measures
! ! ! ! !
(e.g. market share, share of voice, relative price, share of promotions) Consumer (end user) behavior
! ! ! ! !
(e.g. penetration/number of users/consumers, user/consumer loyalty, user gains/losses/churn) Consumer (end user) intermediate
! ! ! ! !
(e.g. awareness, attitudes, satisfaction, commitment, buying intentions, perceived quality) Direct (trade) customer ! ! ! ! ! (e.g. distribution/availability, customer profitability, satisfaction, service quality) Innovativeness ! ! ! ! ! (e.g. number of new products/services, revenue generated from new products/services as a percentage of sales) Other (please state) ! ! ! ! ! ____________________________________________________ What marketing performance measures are COLLECTED by your firm (irrespective of who reviews them)? And how often? Never Rarely/
Ad hoc Regularly
Yearly/Quarterly Monthly or
more Don’t know/
not applicable Financial measures ! ! ! ! ! Competitive market measures
! ! ! ! !
Consumer behavior ! ! ! ! ! Consumer intermediate ! ! ! ! ! Direct (trade) customer ! ! ! ! ! Innovativeness ! ! ! ! ! Other (please state) ! ! ! ! !

What importance does your firm’s TOP management attach to these kinds of measures as indicators of marketing performance? Very
important Important Fairly
important Neither
important nor
unimportant
Fairly unimportant
Unimportant Very unimportant
Financial measures ! ! ! ! ! ! ! Competitive market measures
! ! ! ! ! ! !
Consumer behavior ! ! ! ! ! ! ! Consumer intermediate
! ! ! ! ! ! !
Direct (trade) customer)
! ! ! ! ! ! !
Innovativeness ! ! ! ! ! ! ! Other (as stated above)
! ! ! ! ! ! !
What are these particular measures usually compared against? (Tick all that apply) Previous
year Marketing/ Business
Plan
Total category data
Specific competitor(s)
Other units in your Group
Don’t know/ not
applicable Financial measures ! ! ! ! ! ! Competitive market measures
! ! ! ! ! !
Consumer behavior ! ! ! ! ! ! Consumer intermediate
! ! ! ! ! !
Direct (trade) customer)
! ! ! ! ! !
Innovativeness ! ! ! ! ! ! Other (as stated above)
! ! ! ! ! !
Do you have a term for the main intangible asset(s) built by the firm’s marketing efforts (e.g. brand equity, goodwill, brand health, brand strength, reputation)? No ! Yes ! If yes, we call it________________________ For internal control purposes, do you formally measure that (those) intangible marketing asset(s)? And if so, how often? (Tick one box for each line that applies) Never Rarely/
Ad hoc Regularly
Yearly/Quarterly Monthly or
more Don’t know/
not applicable Financial valuation ! ! ! ! ! Other measures ! ! ! ! !
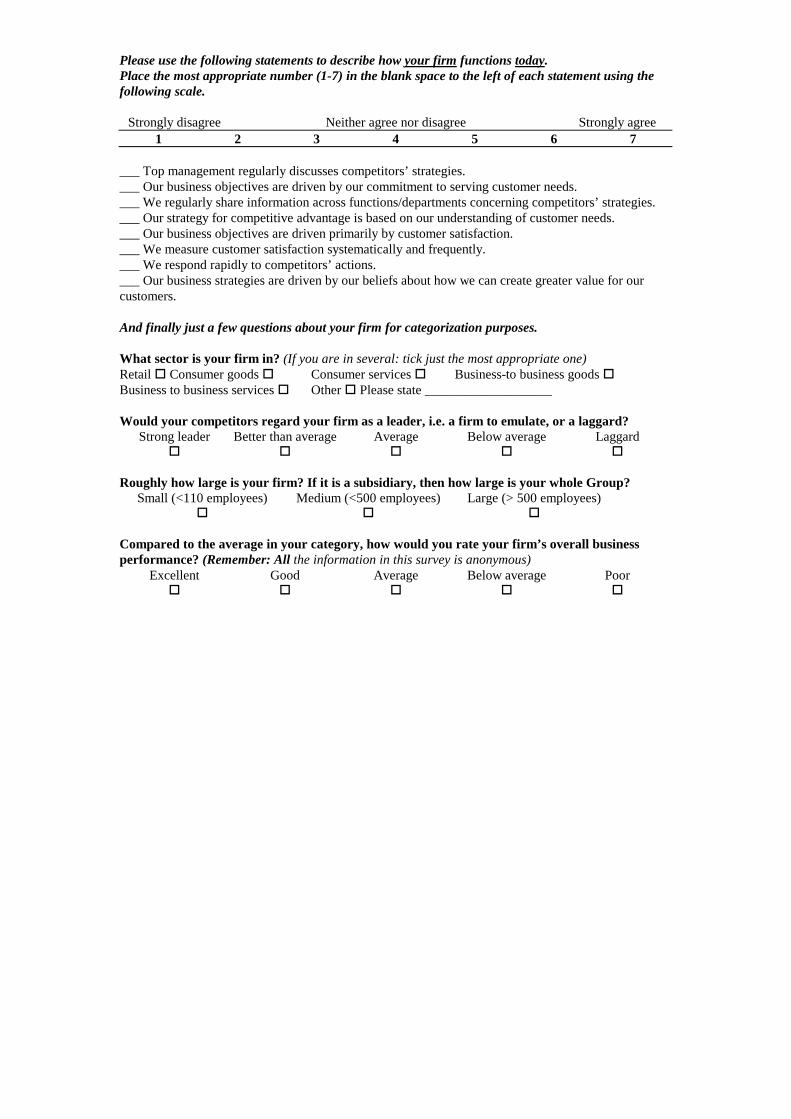
Please use the following statements to describe how your firm functions today. Place the most appropriate number (1-7) in the blank space to the left of each statement using the following scale.
Strongly disagree Neither agree nor disagree Strongly agree 1 2 3 4 5 6 7
___ Top management regularly discusses competitors’ strategies. ___ Our business objectives are driven by our commitment to serving customer needs. ___ We regularly share information across functions/departments concerning competitors’ strategies. ___ Our strategy for competitive advantage is based on our understanding of customer needs. ___ Our business objectives are driven primarily by customer satisfaction. ___ We measure customer satisfaction systematically and frequently. ___ We respond rapidly to competitors’ actions. ___ Our business strategies are driven by our beliefs about how we can create greater value for our customers. And finally just a few questions about your firm for categorization purposes. What sector is your firm in? (If you are in several: tick just the most appropriate one) Retail ! Consumer goods ! Consumer services ! Business-to business goods ! Business to business services ! Other ! Please state ___________________ Would your competitors regard your firm as a leader, i.e. a firm to emulate, or a laggard?
Strong leader Better than average Average Below average Laggard ! ! ! ! !
Roughly how large is your firm? If it is a subsidiary, then how large is your whole Group?
Small (<110 employees) Medium (<500 employees) Large (> 500 employees) ! ! !
Compared to the average in your category, how would you rate your firm’s overall business performance? (Remember: All the information in this survey is anonymous)
Excellent Good Average Below average Poor ! ! ! ! !

Appendix B: Metrics used in the Stage Three survey instrument (* after number indicates dropped after pilot)
CONSUMER / END USER
THOUGHTS AND FEELINGS
1 Awareness Prompted, unprompted or total
2 Salience Prominence, stand-out
3 Perceived quality/ esteem How highly rated
4 Consumer satisfaction Confirmation of expectations
5 Relevance to consumer “My kind of brand”
6 Image/ personality/ identity Strength of individuality
7 (Perceived) differentiation How distinct from other brands
8 Commitment/ purchase intent Expressed likelihood of buying
9 Other attitudes, e.g. liking May be a variety of indicators
10 Knowledge Experience with product attributes
CONSUMER / END USER BEHAVIOUR
11 Total number of consumers
12 Number of new consumers
13 Loyalty/ retention e.g. % buying this year and last
14 Price sensitivity/ elasticity Any measure of volume sensitivity
15 Purchasing on promotion
16 # products per consumer The width of range end user buys
17 # leads generated/ inquiries Number of new prospects
18 Conversions (leads to sales) % Prospect to sales conversions
19 # consumer complaints Level of end user dissatisfaction
20 * Warranty expenses Cost of quality rectification
21 * Weight ratio SOM/{Penetration* Loyalty (share of requirements)}
22 * Target market fit Actual and target consumer profile match (demo/ psychographics)
TRADE CUSTOMER/ RETAILER
23* Cost per contact Cost of sales call
24 Distribution/ availability e.g. number of stores
25 * Share of shelf Retailer space as % total
26 * Features in store Number of times during year
27 * Pipeline stockholding (days) Stock in channel
28 * Out of stock % of stores with no stock
29 * % sales on deal Proportion of sales on promotion
30 * On-time delivery
31 Customer Satisfaction

32 # customer complaints
RELATIVE TO COMPETITOR
33 Market share % SOM (Share of Market) by Volume
34 Relative price e.g. SOM Value/ SOM Volume
35 Loyalty (share) Share of category requirements
36 Penetration % of total who buy brand in period
37 Relative consumer satisfaction e.g. satisfaction vs. competitor
38 Relative perceived quality Perceived quality as % leader
39 Share of voice Brand advertising as % category
INNOVATION
40 # of new products in period New product launches
41* Satisfaction from new products
42 Revenue of new products Turnover, sales
43 Margin of new products Gross profit
FINANCIAL
44 Sales Value (turnover) and/ or volume
45* Sales volume Quantity of sales in standard units
46 % discount Allowances as % of sales
47 Gross margins Gross profit as % sales turnover
48* New customers gross margins Ditto but for recent customers
49* New customer acquisition cost
50 Marketing spend e.g. ads, PR, promotions
51 Profit/ Profitability Contribution, trading, or before tax
52 Shareholder value/ EVA/ ROI The true financial bottom line
53* Stock cover Inventory expressed as days sales
54* New products revenue share

Appendix C: Stage Three Marketing Metrics Results
Table C1: Top marketing metrics
Metric % of firms using measure
% that reach their top board
% giving top rating for assessing
marketing performance
Profit/Profitability 91.5 73.0 80.5
Sales, Value and/or Volume 91.0 65.0 71.0
Gross Margin 81.0 58.0 20.0
Awareness 78.0 28.0 28.0
Market Share (Volume or Value) 78.0 33.5 36.5
Number of new products 73.0 24.0 25.3
Relative Price (SOM Value/Volume) 70.0 34.5 37.5
Number of Complaints (Level of dissatisfaction)
69.0 30.0 45.0
Consumer Satisfaction 68.0 36.0 46.5
Distribution/Availability 66.0 11.5 18.0
Total Number of Customers 65.5 37.4 40.0
Perceived Quality/esteem 64.0 32.0 35.5
Loyalty/Retention 64.0 50.7 67.0
Marketing spend 64.5 71.3 62.8
Relative perceived quality 62.5 52.8 61.6
Number of new Customers 57.0 48.2 57.0
Brand/product knowledge 55.0 41.8 44.5
Image/Personality/Identity 54.5 43.0 56.0
Shareholder value 52.5 83.8 79.0
Perceived differentiation 50.0 46.0 49.0
Revenue of new products 49.0 55.1 61.2
Relative Consumer Satisfaction 48.5 55.7 60.8
Relevance to Consumer 48.0 42.7 52.1
Penetration 47.5 40.0 46.3
Commitment/purchase intend 47.5 35.8 43.1
Number of leads generated/inquiries 46.5 33.0 44.0
Conversions (leads to sales) 46.5 42.0 54.0
Margin of new products 46.0 55.4 66.3
Price sensitivity/elasticity 45.0 43.3 51.0
Customer satisfaction (Trade) 45.0 48.9 57.8

Loyalty (share of category) 43.0 47.7 61.6
Other attitudes, e.g. liking 42.5 38.8 33.0
Purchasing on Promotion 39.5 30.4 48.0
Number of products per customer 36.0 29.0 41.7
Share of voice 30.5 34.4 50.8
Percent discount 30.0 66.7 63.3
Salience (Prominence) 28.5 35.0 36.8
Table C2: Key metrics where responses varied by respondent role
Metric % of Firms
Using Measure
% Finance responses
% Marketer responses
Awareness 76.5 70.9 90.1
Market Share (Volume or Value) 76.5 72.1 88.9
Number of new products 71.3 76.0 63.0
Relative Price (SOM Value/Volume) 69.6 65.8 75.3
Consumer Satisfaction 72.2 63.3 76.5
Distribution/Availability 61.7 49.3 79.0
Perceived Quality/esteem 65.7 60.0 72.8
Loyalty/Retention 67.0 54.4 76.5
Marketing spend 68.7 57.0 84.0
Number of new Customers 60.0 53.2 66.7
Brand/product knowledge 57.0 39.2 76.5
Image/Personality/Identity 55.2 43.0 74.1
Perceived differentiation 53.5 41.8 64.2
Revenue of new products 51.7 43.0 65.4
Relative Consumer Satisfaction 50.9 43.0 58.0
Relevance to Consumer 50 34.2 66.7
Penetration 49.1 45.6 65.4
Commitment/purchase intend 50.9 38.0 65.4
Number of leads generated/inquiries 49.1 43.0 54.3
Conversions (leads to sales) 49.1 38.0 55.6
Margin of new products 48.7 41.8 59.3
Price sensitivity/elasticity 47.8 44.3 55.6
Other attitudes, e.g. liking 44.8 29.1 63.0
Purchasing on Promotion 40.4 24.0 63.0
Number of products per customer 36 25.3 53.1
Share of voice 32.6 16.5 54.3

Percent discount 34.3 21.5 45.7
Salience (Prominence) 32.6 19.0 46.9
Note: Discrepancies between role splits and overall frequency values are due to the “Other” role category.

REFERENCES
Aaker, David A. (1991), Managing Brand Equity. New York: Free Press.
---------- (1996), Building Strong Brands. New York: Free Press.
Agarwal, Manoj K. and Vithala R. Rao (1996), "An Empirical Comparison of
Consumer Based Measures of Brand Equity," Marketing Letters, 7 (3), 237-247.
Ambler, Tim, and Patrick Barwise (1998), “The trouble with brand valuation,” Journal
of Brand Management, 5(5 May), 367-377.
Ambler, Tim, and Flora Kokkinaki (1997), "Measures of Marketing Success," Journal
of Marketing Management, 13, 665-678.
Anderson, Erin, and Richard L. Oliver (1987), "Perspectives on Behavior-Based
Versus Outcome-Based Sales force Control Systems ," Journal of Marketing, 51
(October), 76-88.
Armstrong, J. Scott and Terry S. Overton (1977), “Estimating Nonresponse Bias in
Mail Surveys,” Journal of Marketing Research, 14 (August), 396-402.
Arthur Andersen (1992), The Valuation of Intangible Assets, Special Report #
P254, London: The Economist Intelligence Unit.

Assmus, Gert, John U. Farley, and Donald Lehmann (1984), “How Advertising
Affects Sales: Meta Analysis of Econometric Results,” Journal of Marketing Research
21 (February), 65-74.
Aulakh, Preet S. and Esra F. Gencturk (2000), "International Principal-Agent
Relationship," Industrial Marketing Management, 29, 521-538.
Babakus, Emin, David W. Cravens, Kent Grant, Thomas N. Ingram and Raymond W.
LaForge (1996), "Investigating the Relationships Among Sales, Management Control,
Sales Territory Design, Salesperson Performance, and Sales Organization
Effectiveness," International Journal of Research in Marketing, 13, 345-363.
Bergen, Mark, Shantanu Dutta and Orville C. Jr. Walker (1992), "Agency
Relationship in Marketing: A Review of the Implications and Applications of the
Agency and Related Theories," Journal of Marketing, 56 (July), 1-24.
Bhargava, Mukesh, Chris Dubelaar and Sridhar Ramaswami (1994), "Reconciling
Diverse Measures of Performance: A Conceptual Framework and Test of a
Methodology," Journal of Business Research, 31, 235-246.
Bonoma, Thomas V. and Bruce C. Clark (1988), Marketing Performance
Assessment. Boston: Harvard Business School Press.
Brown, Christina L. (1999), ""Do the Right Thing:" Diverging Effects of
Accountability in a Managerial Context," Marketing Science, 18 (3), 230-246.
Buckley, Ronald, Sid Hall, Philip G. Benson and M. Buckley (1988), “The Impact Of

Rating Scale Format On Rater Accuracy: An Evaluation,” Journal of Management, 14
(3), 415-423.
Buzzell, Robert D. and Bradley T. Gale (1987), The PIMS Principles: Linking
Strategy to Performance. New York: Free Press.
Celly, Kirti S. and Gary L. Frazier (1996), "Outcome-Based and Behavior-Based
Coordination Efforts in Channel Relationships," Journal of Marketing Research, 33
(May), 200-210.
Chakravarthy, Balaji S. (1986), "Measuring Strategic Performance," Strategic
Management Journal, 7, 437-458.
Chattopadhyay, Prithviraj, William H. Glick, C. Chet Miller and George P. Huber
(1999), “Determinants of Executive Beliefs: Comparing Functional Conditioning and
Social Influence,” Strategic Management Journal, 20, 763-789.
Churchill, Gilbert A. Jr. (1979), “A Paradigm for Developing Better Measures of
Marketing Constructs,” Journal of Marketing Research, 16 (Feb), 64-73.
Clark, Bruce H. (1999), "Marketing Performance Measures: History and
Interrelationships," Journal of Marketing Management, 15, 711-732.
Collins, James C. and Jerry I. Porras (1995), Built to Last, London: Century.

Cravens, David W., Thomas N. Ingram, Raymond W. LaForge and Clifford E. Young
(1993), "Behavior-Based and Outcome-Based Sales force Control Systems," Journal
of Marketing, 57 (October), 47-59.
Cronbach, Lee J and Paul E Meehl (1955), “Construct Validity in Psychological
Testing,” Psychological Bulletin, 52(July), 281-302.
Dawes, Philip L., Don Y. Lee and Grahame R. Dowling (1998), "Information Control
and Influence in Emergent Buying Centers," Journal of Marketing, 62 (July), 55-68.
Day, George S. (1994a), "The Capabilities of Market Driven Organizations," Journal
of Marketing, 58 (October), 37-52.
---------- (1994b), "Continuous Learning About Markets," California Management
Review, Summer, 9-31.
---------- and Liam Fahey (1988), “Valuing Market Strategies,” Journal of Marketing,
52 (July), 45-57.
---------- and Prakash Nedungadi (1994), "Managerial Representations of Competitive
Advantage," Journal of Marketing, 58 (April), 31-44.
---------- and Robin Wensley (1988), "Assessing Advantage: A Framework for
Diagnosing Competitive Superiority," Journal of Marketing, 52 (April), 1-20.

Dearborn, DeWitt C. and Herbert A. Simon (1958), "Selective Perception: A Note on
the Departmental Identifications of Executives," Sociometry, 21, 140-144.
Dekimpe, Marnik G. and Dominique M. Hanssens (1995), "The Persistence of
Marketing Effects on Sales," Marketing Science, 14 (1), 1-21.
---------- and ---------- (1999), "Sustained Spending and Persistent Response: A New
Look at Long-Term Marketing Profitability," Journal of Marketing Research, 36
(November), 397-412.
Deshpande, Rohit, John U. Farley and Frederick E. Webster Jr. (1993), "Corporate
Culture, Customer Orientation, and Innovativeness in Japanese Firms: A Quadrad
Analysis," Journal of Marketing, 57 (January), 23-36.
---------- and Frederick E. Webster Jr. (1989), "Organizational Culture and Marketing:
Defining the Research Agenda," Journal of Marketing, 53 (January), 3-15.
Dess, Gregory G. and Richard B. Robinson Jr. (1984), "Measuring Organizational
Performance in the Absence of Objective Measures: The Case of the Privately-held
Firm and Conglomerate Business Unit," Strategic Management Journal, 5, 265-273.
Dick, Alan S. and Kunal Basu (1994), “Customer Loyalty: Towards an Integrated
Conceptual Framework,” Journal of the Academy of Marketing Science, 28 (5), 5-16.
Dunn, Mark G., David Norburn and Sue Birley (1994), "The Impact of Organizational

Values, Goals, and Climate on Marketing Effectiveness," Journal of Business
Research, 30, 131-141.
Eccles, Robert G. (1991), "The Performance Measurement Manifesto," Harvard
Business Review, 69 (January-February), 131-137.
Eisenhardt, Kathleen M. (1985), "Control: Organizational and Economic
Approaches," Management Science, 31 (2), 134-149.
---------- (1988), "Agency- and Institutional- Theory Explanations: The Case of Retail
Sales Compensation," Academy of Management Journal, 31 (3), 488-511.
---------- (1989), "Agency Theory: An Assessment and Review," Academy of
Management Journal, 14 (1), 57-74.
Fama, Eugene F. (1980), “Agency Problems and the Theory of the Firm,” Journal of
Political Economy, 88 (2), 288-307.
---------- and Michael C. Jensen (1983), “Separation of Ownership and Control,”
Journal of Law and Economics, 26 (June), 301-325.
Farquhar, Peter H. (1989), "Managing Brand Equity," Marketing Research, 1
(September), 24-33.
Feder, Robert A. (1965), “How to Measure Marketing Performance,” Harvard
Business Review, 43 (May-June), 132-142.

Fisher, Robert J., Elliot Maltz and Bernard J. Jaworski (1997), "Enhancing
Communication Between Marketing and Engineering: The Moderating Role of
Relative Functional Identification," Journal of Marketing, 61 (July), 54-70.
Fraser, Cynthia and Robert E. Hite (1988), "An Adaptive Utility Approach for
Improved Use of Marketing Models," Journal of Marketing, 52 (October), 96-103.
Frazier, Gary L. and Roy D. Howell (1982), “Intra-industry Marketing Strategy
Effects on the Analysis of Firm Performance,” Journal of Business Research, 10 (4),
431-443.
Geletkanycz, Marta A. S. and Donald C. Hambrick (1997), "The External Ties of Top
Executives: Implications for Strategic Choice and Performance," Administrative
Science Quarterly, 42 (December), 654-681.
Gerbing, David W. and James Anderson (1988), “An Updated Paradigm for Scale
Development Incorporating Unidimensionality and its Assessment,” Journal of
Marketing Research 25(2 May) 186-92.
Glazer, Rashi (1991), "Marketing in an Information-Intensive Environment: Strategic
Implications of Knowledge as an Asset," Journal of Marketing, 55 (October), 1-19.
Greenley, Gordon E. (1995), “Market Orientation and Company Performance:
Empirical Evidence From UK Companies,” British Journal of Management, 6, 1-13.

Grossman, Sanford J. (1981), “The role of warranties and private disclosure about
product quality,” Journal of Law and Economics, 24, 461-483.
Guadagni, Peter M. and John D. C. Little (1983), "A Logit Model of Brand Choice
Calibrated on Scanner Data," Marketing Science, 2 (3), 203-238.
Gupta, Anil K. and Vijay Govindarajan (1991), "Knowledge Flows and the Structure
of Control Within Multinational Corporations," Academy of Management Review, 16
(4), 768-792.
Harris, Lloyd C. (2001), “Market Orientation and Performance: Objective and
Subjective Empirical Evidence From UK Companies,” Journal of Management
Studies, 38 (1), 17-43.
Hartline, Michael D., James G. I. Maxham and Daryl O. McKee (2000), "Corridors of
Influence in the Dissemination of Customer-Oriented Strategy to Customer Contact
Service Employees," Journal of Marketing, 64 (April), 35-50.
Homburg, Christian and Christian Pflesser (2000), "A Multiple-Layer model of
Market-Oriented Organizational Culture: Measurement Issues and Performance
Outcomes," Journal of Marketing, 37 (November), 449-462.
----------, John P. Workman Jr. and Harley Krohmer (1999), "Marketing's Influence

Within the Firm," Journal of Marketing, 63 (April), 1-17.
Hurley, Robert F. and G. Tomas M. Hult (1998), “Innovation, Market Orientation, and
Organizational Learning: An Integration and Empirical Examination,” Journal of
Marketing, 62 (July), 42-54.
IMA (1992), Cost Management Update, 32 (October), US Institute of
Management Accountants, Cost Management Group.
---------- (1994), Cost Management Update, 49 (March), US Institute of
Management Accountants, Cost Management Group.
---------- (1996), Cost Management Update, 64 (June), US Institute of
Management Accountants, Cost Management Group.
Ittner, Christopher D. and David F. Larcker (1998), "Are Non-financial Measures
Leading Indicators of Financial Performance? An Analysis of Customer Satisfaction,"
Journal of Accounting Research, 36, 1-35.
Jacobson, Robert (1990), "Unobservable Effects and Business Performance,"
Marketing Science, 9 (1), 74-85.
Jaworski, Bernard J. (1988), "Toward a Theory of Marketing Control: Environmental
Context, Control Types, and Consequences," Journal of Marketing, 52 (July), 23-39.

---------- and Ajay K. Kohli (1993), "Market Orientation: Antecedents and
Consequences," Journal of Marketing, 57 (July), 53-70.
---------- and Deborah J. MacInnis (1989), "Marketing Jobs and Management
Controls: Towards a Framework," Journal of Marketing Research, 26 (November),
406-419.
----------, Vlasis Stathakopoulos and H. S. Krishnan (1993), "Control Combinations in
Marketing: Conceptual Framework and Empirical Evidence," Journal of Marketing,
57 (January), 57-69.
Jedidi, Kamel, Carl F. Mela and Senil Gupta (1999), "Managing Advertising and
Promotion for Long-Run Profitability," Marketing Science, 18 (1), 1-22.
Jensen, Michael C. and William H. Meckling (1976), "Theory of the Firm: Managerial
Behavior, Agency Costs and Ownership Structure," Journal of Financial Economics,
3, 305-360.
Kamakura, Wagner A. and Gary J. Russell (1993), "Measuring Brand Value with
Scanner Data," International Journal of Research in Marketing, 10, 9-22.
Keller, Kevin L. (1993), "Conceptualizing, Measuring, and Managing Customer-
Based Brand Equity," Journal of Marketing, 57 (January), 1-22.
---------- (1998), Strategic Brand Management: Building, Measuring and
Managing Brand Equity. Upper Saddle River, NJ: Prentice-Hall.

Kerin, Roger A. and Ray Sethuraman (1998), "Exploring the Brand Value-
Shareholder Value Nexus for Consumer Goods Companies," Journal of the Academy
of Marketing Science, 26 (4), 260-273.
Kohli, Ajay K. and Bernard J. Jaworski (1990), "Market Orientation: The Construct,
Research Proposition, and Managerial Implications," Journal of Marketing, 54 (April),
1-18.
Kotler, Philip (2000), Marketing Management. Upper Saddle River, NJ:
Prentice-Hall.
Krafft, Manfred (1999), "An Empirical Investigation of the Antecedents of Sales
Force Control Systems," Journal of Marketing, 63 (July), 120-134.
Lane, Vicki and Robert Jacobson (1995), "Stock Market Reactions to Brand
Extension Announcements: The Effects of Brand Attitude and Familiarity," Journal of
Marketing, 59 (January), 63-77.
Lassar, Walfried, Banwari Mittal and Arun Sharma (1995), "Measuring Customer-
Based Brand Equity," Journal of Consumer Marketing, 12 (4), 11-19.
Marketing Science Institute (2000), 2000-2002 Research Priorities: A Guide to
MSI Research Programs and Procedures. Cambridge, MA: Marketing Science
Institute.

Marketing Week (2001), “Assessing Marketers’ Worth,” February 1, 42-43.
Mela, Carl F., Senil Gupta and Donald R. Lehman (1997), "The Long-term Impact of
Price and Promotion on Brand Choice," Journal of Marketing Research, 34 (May),
248-261.
Merchant, Kenneth A. (1988), "Progressing Toward a Theory of Marketing Control: A
Comment," Journal of Marketing, 52 (July), 40-44.
Meyer, John W. and Brian Rowan (1977), "Institutionalized Organizations: Formal
Structure as Mith and Cerimony," American Journal of Sociology, 83, 340-363.
Meyer, Marshall W. (1998), “Finding Performance: The new discipline in
management,” Performance Measurement- Theory and Practice, Vol. 1,
Cambridge, UK: Centre for Business Performance, xiv-xxi.
Milgrom, Paul R. (1981), “Good News and Bad News: Representation Theorems and
Applications,” Bell Journal of Economics, 12, 380-391.
Mohammed, Rafi, Robert J. Fisher, Bernard J. Jaworski and Aileen Cahill
(2001), Internet Marketing: Building Advantage in a Networked Economy .
Englewood Cliffs, NJ: McGraw-Hill.
Moorman, Christine (1995), "Organizational Market Information Processes: Cultural
Antecedents and New Product Outcomes," Journal of Marketing Research, 32
(August), 318-335.
---------- and Roland T. Rust (1999), "The Role of Marketing," Journal of Marketing,
63 (Special Issue), 180-197.
---------- and Gerald Zaltman (1985), "Sharing Models of Inquiry," in Advances
in Consumer Research, Vol 12, E. Hirschman and M. Holbrook eds., Ann Arbor,
MI: Association for Consumer Research, 312-314.
----------, ---------- and Rohit Deshpande (1992), "Relationships Between Providers
and Users of Market Research: The Dynamics of Trust Within and Between
Organizations," Journal of Marketing Research, 29 (August), 314-328.
Murphy, Gregory B., Jeff W. Trailer and Robert C. Hill (1996), "Measuring
Performance in Entrepreneurship Research," Journal of Business Research, 36, 15-23.
Narver, John C. and Stanley F. Slater (1990), "The Effect of a Market Orientation on
Business Profitability," Journal of Marketing, 54 (October), 20-35.
Nikalant, V. and Hayagreeva Rao (1994), "Agency Theory and Uncertainty in
Organizations: An Evaluation," Organization Studies, 15 (5), 649-672.
Noble, Charles H. and Michael P. Mokwa (1999), "Implementing Marketing
Strategies: Developing and Testing a Managerial Theory," Journal of Marketing, 63
(October), 57-73.

Oliver, Richard L. and Erin Anderson (1994), "An Empirical Test of the
Consequences of Behavior- and Outcome-Based Sales Control Systems," Journal of
Marketing, 58 (October), 53-67.
Ouchi, William G. (1979), "A Conceptual Framework for the Design of
Organizational Control Mechanisms," Management Science, 25 (September), 833-
847.
Park, Chan S. and Srinivasan V. (1994), "A Survey-Based Method for Measuring and
Understanding Brand Equity and Its Extendibility," Journal of Marketing Research, 31
(May), 271-288.
Perrier, Raymond (ed.) (1997), Brand Valuation, (3rd. edition), London: Premier
Books.
Robinson, Richard B. Jr. and John A. Pierce II (1988), “Planned Patterns of Strategic
Behavior and Their Relationship to Business-Unit Performance,” Strategic
Management Journal, 9, 43-60.
Ross, Stephen A. (1979) “Disclosure Regulation in Financial Markets:
Implications of Modern Finance Theory and Signaling Theory,” in Issues in
Financial Regulation, F. Edwards, ed. New York: McGraw-Hill, 177-202.
Ruekert, Robert W. (1992), "Developing a Market Orientation: An Organizational
Strategy Perspective," International Journal of Research in Marketing, 9, 225-245.

Sarin, Shikar and Vijay Mahajan (2001), "The Effect of Reward Structures on the
Performance of Cross-Functional Product Development Teams," Journal of
Marketing, 65 (April), 35-53.
Sevin, Charles H. (1965), Marketing Productivity Analysis. New York: McGraw-
Hill.
Schultz, Don E. (2000), "Understanding and Measuring Brand Equity," Marketing
Management, Spring, 8-9.
Shaw, Robert and Laura Mazur (1997), Marketing Accountability: Improving
Business Performance. London: Financial Times, Retail and Consumer
Publishing.
Simon, Carol J. and Mary W. Sullivan (1993), "The Measurement and Determinants
of Brand Equity: A Financial Approach," Marketing Science, 12 (1), 28-51.
Slater, Stanley F. and John C. Narver (1994), "Does Competitive Environment
Moderate the Market Orientation-Performance Relationship?," Journal of Marketing,
58 (January), 46-55.
---------- and ---------- (1995), "Market Orientation and the Learning Organization,"
Journal of Marketing, 59 (July), 63-74.
Small Business Service (2001), Website: http://www.sbs.gov.uk/statistics/, June 21.

Srivastava, Rajendra K. and Allan D. Shocker (1991), “Brand Equity: A Perspective on
its Meaning and Measurement,” Working Paper No. 91-124, Cambridge, MA:
Marketing Science Institute.
----------, Tasadduq A. Shervani and Liam Fahey (1998), "Market-Based Assets and
Shareholder Value: A Framework for Analysis," Journal of Marketing, 62 (January),
2-18.
Standard and Poor (1996), The Outlook, Special Issue, 68 (17), September 30.
New York: McGraw-Hill, Section 2.
Swain, Joffre, Tulin Erdem, Jordan Louvriere and Chris Dubelaar (1993), "The
Equalization Price: A Measure of Consumer-Perceived Brand Equity," International
Journal of Research in Marketing, 10, 23-45.
Szymanski, David M. and David H. Henard (2001), "Customer Satisfaction: A Meta-
Analysis of the Empirical Evidence," Journal of the Academy of Marketing Science,
1, 16-35.
Tolbert, Pamela S. and Lynne G. Zucker (1983), "Institutional Sources of Change in
the Formal Structure of Organizations: The Diffusion of Civil Service Reform, 1880-
1935," Administrative Science Quarterly, 28, 22-39.
Unilever (1998), Presentation to The Marketing Council Seminar on Measuring
Marketing, London, 2 December.

Vakratsas, Demetrios and Tim Ambler (1999), "How Advertising Works: What Do
We Really Know?," Journal of Marketing, 63 (January), 26-43.
Venkatraman, N. and Vasudevan Ramanujam (1987), “Measurement of Business
Economic Performance: An Examination of Method Convergence,” Journal of
Management, 13 (Spring), 109-122.
Webster, Frederick E. Jr. (1992), "The Changing Role of Marketing in the
Corporation," Journal of Marketing, 56 (October), 1-17.
Workman, John P. Jr. (1993), "Marketing's Limited Role in New Product
Development in One Computer System Firm," Journal of Marketing Research, 30
(November), 405-421.
Yoo, Boonghee, Naveen Donthu and Sungho Lee (2000), "An Examination of
Selected Marketing Mix Elements and Brand Equity," Journal of the Academy of
Marketing Science, 28 (2), 195-211.
Zucker, Lynne G. (1987), “Institutional Theories of Organizations” in Annual Review
of Sociology, W.R. Scott ed. Palo Alto: Annual Reviews, 443-464.