Embed Size (px)
Citation preview
Assessing distributed mountain-block recharge in
semiarid environments
Huade Guan and John L. Wilson
GSA Annual Meeting Nov. 10, 2004
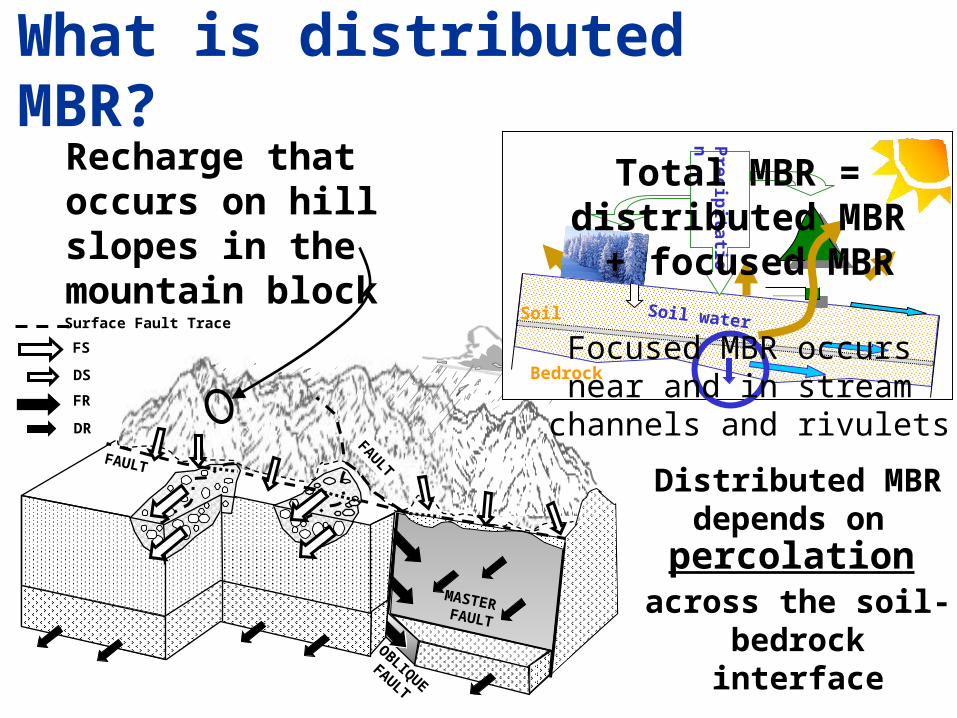
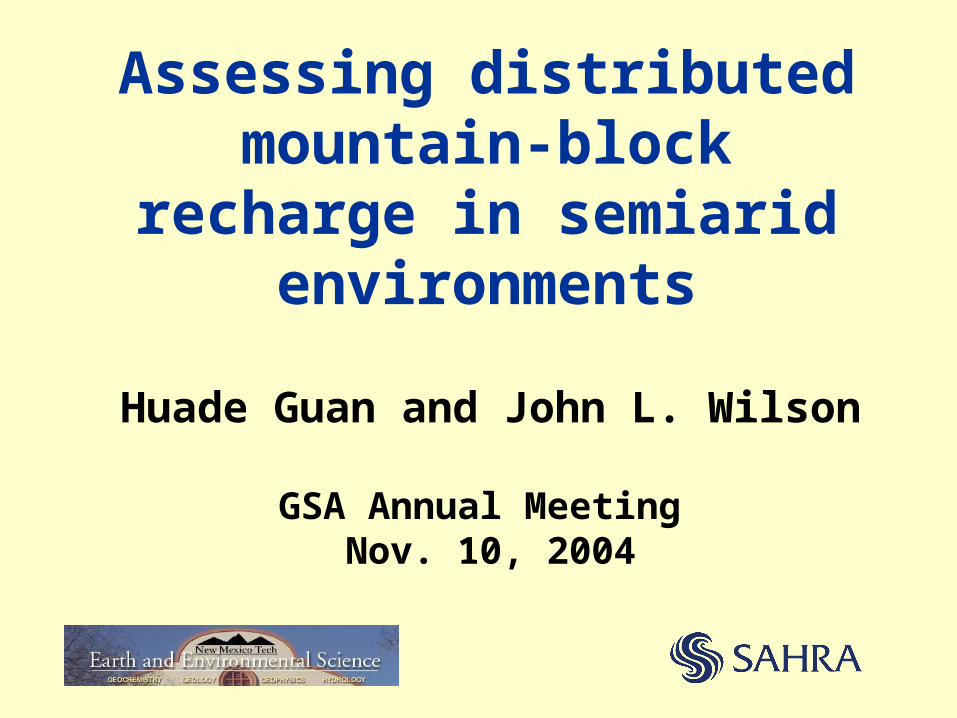
What is distributed MBR?
FS
DS
FR
DR
MASTER FAULT
FAULT
OBLIQUEFAULT
Surface Fault Trace
FAULT
Recharge that occurs on hill slopes in the mountain block
Precip
itation
Bedrock
Soil Soil water
Distributed MBR depends on
across the soil-bedrock interface
percolation
Total MBR = distributed MBR + focused MBR
Focused MBR occurs near and in stream
channels and rivulets
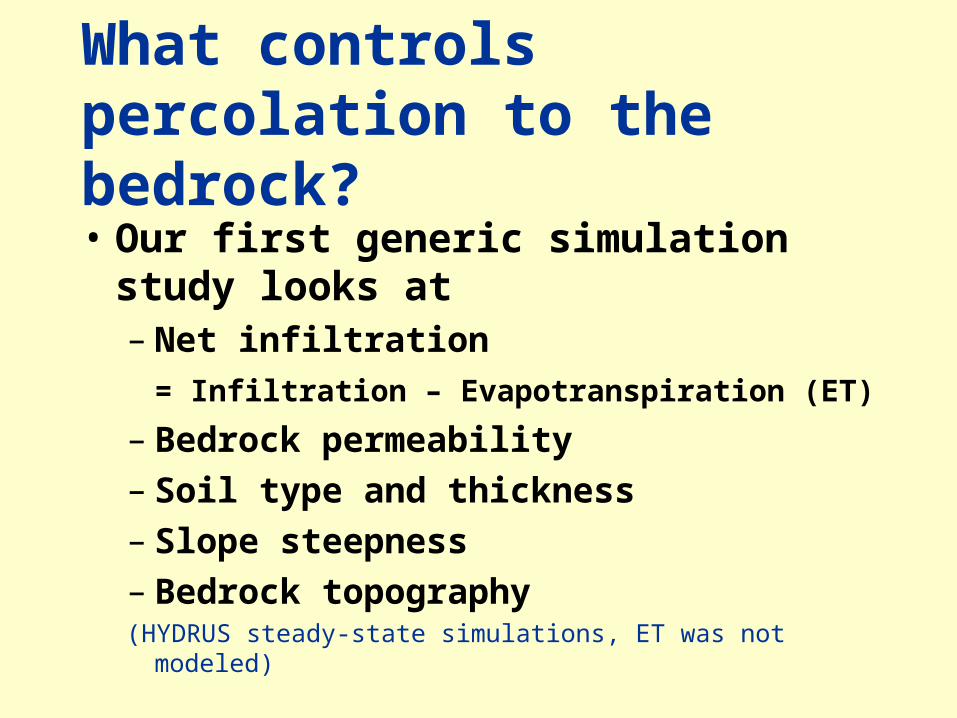
What controls percolation to the bedrock?
• Our first generic simulation study looks at– Net infiltration
= Infiltration – Evapotranspiration (ET)
– Bedrock permeability– Soil type and thickness– Slope steepness– Bedrock topography(HYDRUS steady-state simulations, ET was not modeled)
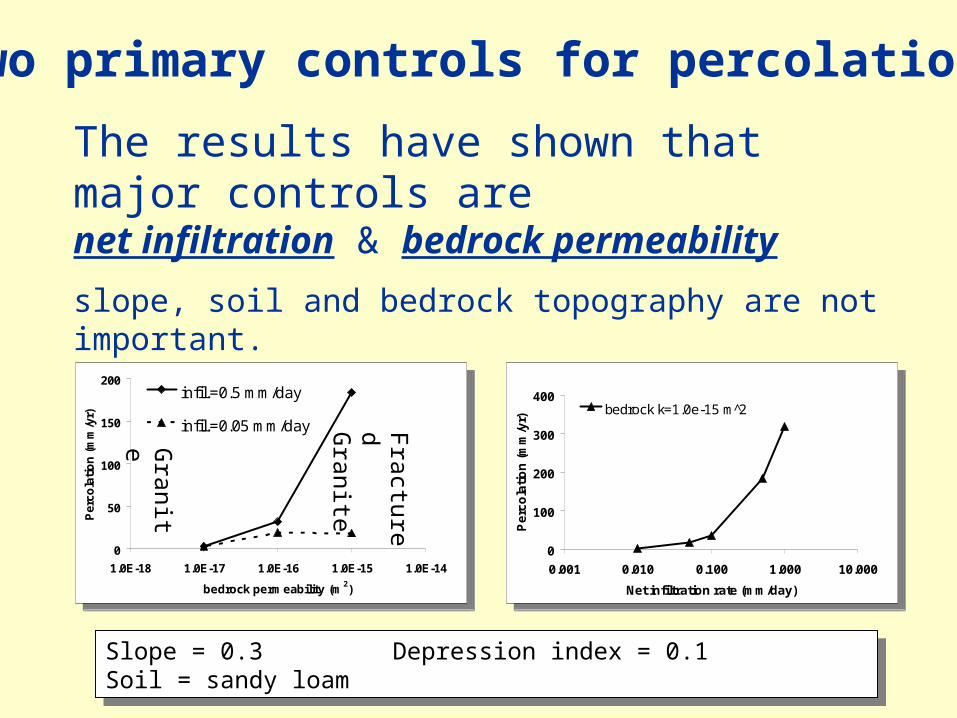
The results have shown that major controls are net infiltration & bedrock permeability
slope, soil and bedrock topography are not important.
0
100
200
300
400
0.001 0.010 0.100 1.000 10.000
Net infiltration rate (mm/day)
Pe
rco
lati
on
(m
m/y
r)
bedrock k=1.0e-15 m 2̂
0
100
200
300
400
0.001 0.010 0.100 1.000 10.000
Net infiltration rate (mm/day)
Pe
rco
lati
on
(m
m/y
r)
bedrock k=1.0e-15 m 2̂
0
50
100
150
200
1.0E-18 1.0E-17 1.0E-16 1.0E-15 1.0E-14
bedrock permeability (m2)
Per
cola
tio
n (
mm
/yr)
infil.=0.5 mm/day
infil.=0.05 mm/day
0
50
100
150
200
1.0E-18 1.0E-17 1.0E-16 1.0E-15 1.0E-14
bedrock permeability (m2)
Per
cola
tio
n (
mm
/yr)
infil.=0.5 mm/day
infil.=0.05 mm/day
Granit
e FracturedG
ranite
Slope = 0.3 Depression index = 0.1 Soil = sandy loamSlope = 0.3 Depression index = 0.1 Soil = sandy loam
Two primary controls for percolation
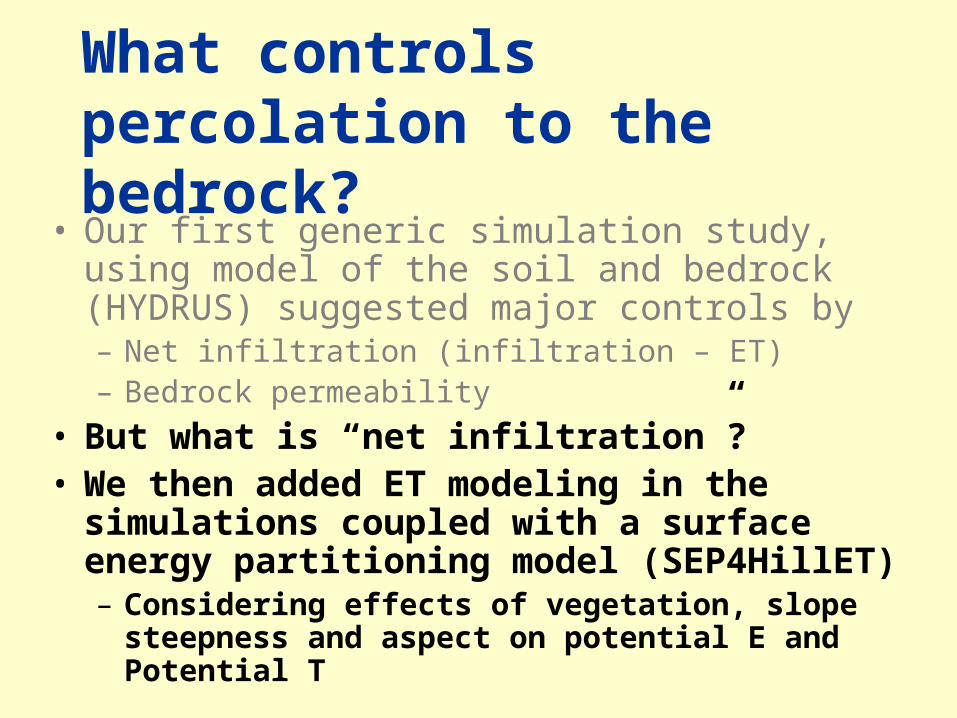
• Our first generic simulation study, using model of the soil and bedrock (HYDRUS) suggested major controls by– Net infiltration (infiltration – ET)– Bedrock permeability
• But what is “net infiltration”?• We then added ET modeling in the simulations
coupled with a surface energy partitioning model (SEP4HillET)– Considering effects of vegetation, slope steepness
and aspect on potential E and Potential T
What controls percolation to the bedrock?
Granite
Tuff
Granite
Tuff
Soil
Soil
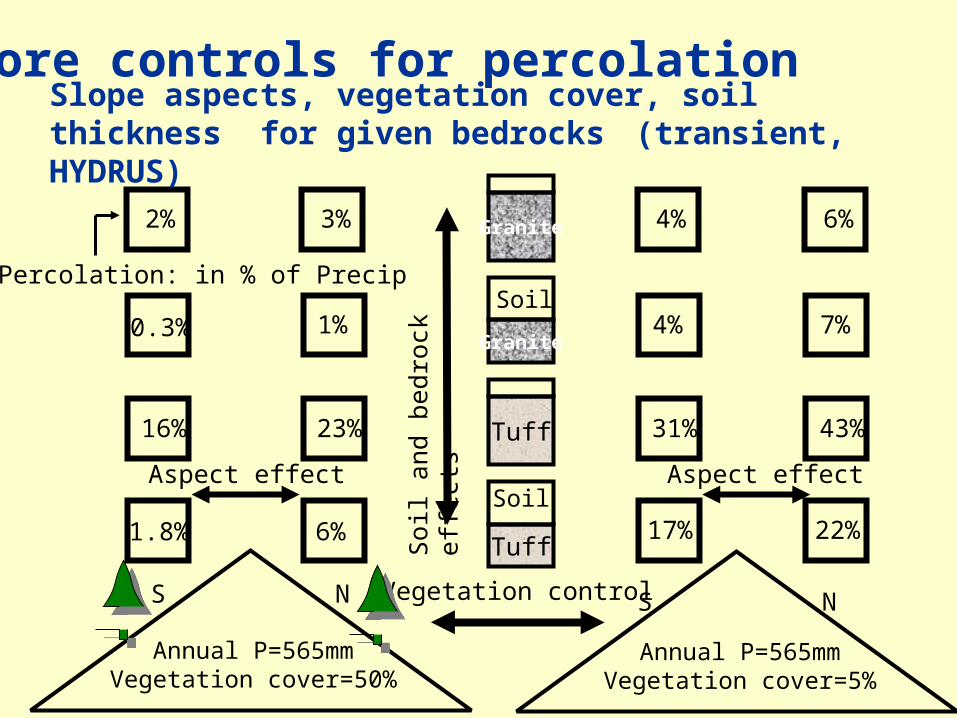
Vegetation control S N
Annual P=565mmVegetation cover=5%
4%
4%
31%
17%
Aspect effect
6%
7%
43%
22%
Annual P=565mmVegetation cover=50%
S N
Percolation: in % of Precip
Aspect effect
Soi
l and
bed
rock
ef
fect
s
3%
1%
23%
6%
2%
0.3%
16%
1.8%
Slope aspects, vegetation cover, soil thickness for given bedrocks (transient, HYDRUS)
More controls for percolation
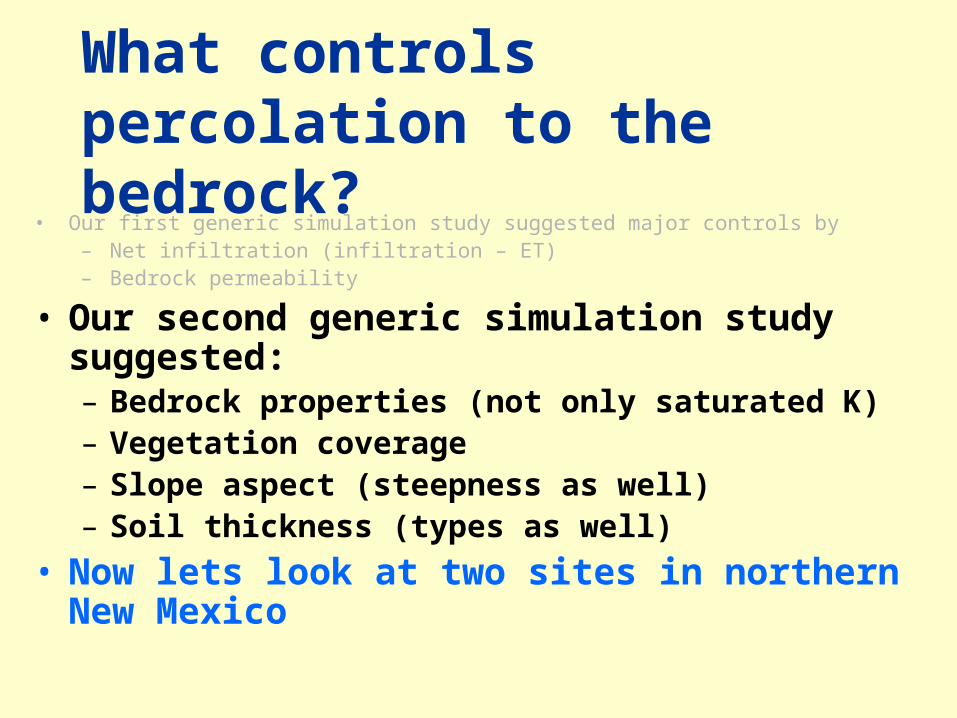
• Our first generic simulation study suggested major controls by– Net infiltration (infiltration – ET)– Bedrock permeability
• Our second generic simulation study suggested:– Bedrock properties (not only saturated K)– Vegetation coverage– Slope aspect (steepness as well)– Soil thickness (types as well)
• Now lets look at two sites in northern New Mexico
What controls percolation to the bedrock?
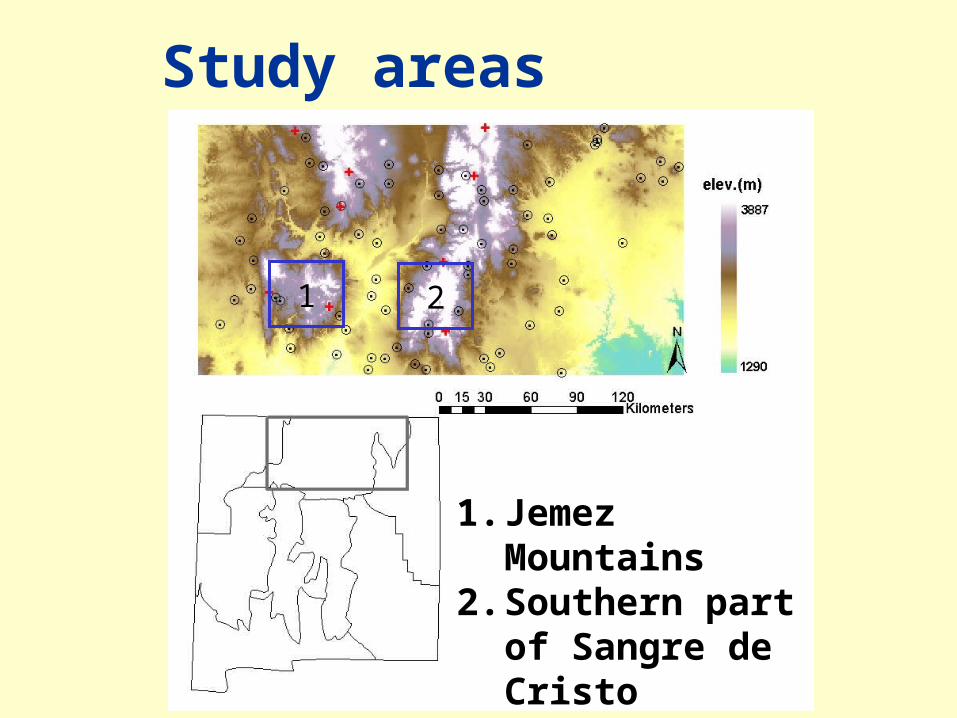
Study areas
1. Jemez Mountains2. Southern part of
Sangre de Cristo Mountains
1 2
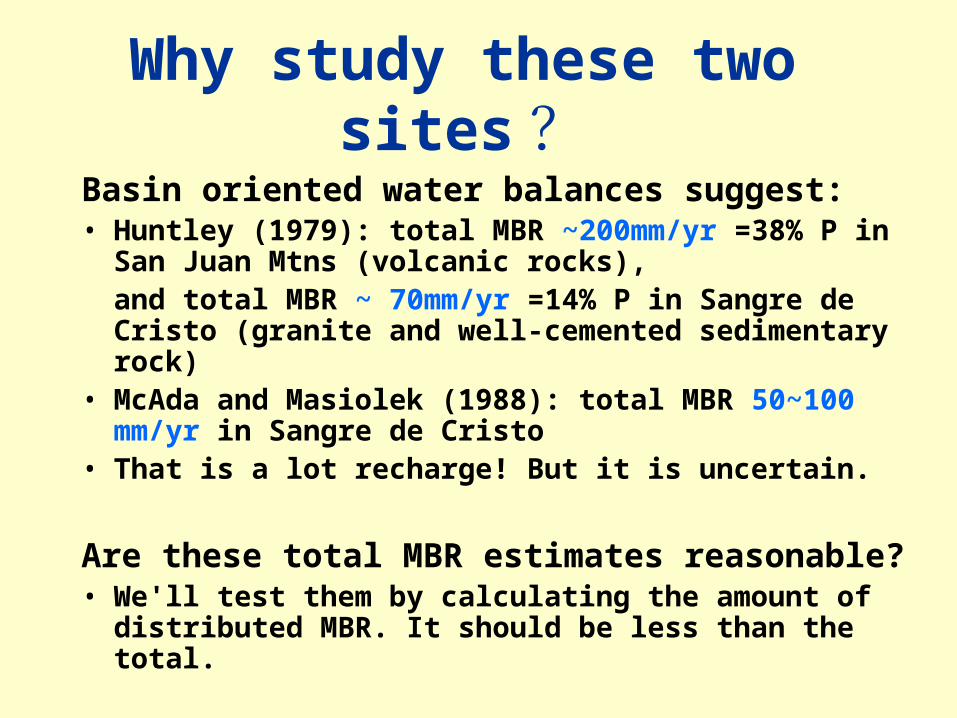
Why study these two sites?Basin oriented water balances suggest: • Huntley (1979): total MBR ~200mm/yr =38% P in San
Juan Mtns (volcanic rocks), and total MBR ~ 70mm/yr =14% P in Sangre de Cristo (granite and well-cemented sedimentary rock)
• McAda and Masiolek (1988): total MBR 50~100 mm/yr in Sangre de Cristo
• That is a lot recharge! But it is uncertain.
Are these total MBR estimates reasonable? • We'll test them by calculating the amount of distributed
MBR. It should be less than the total.
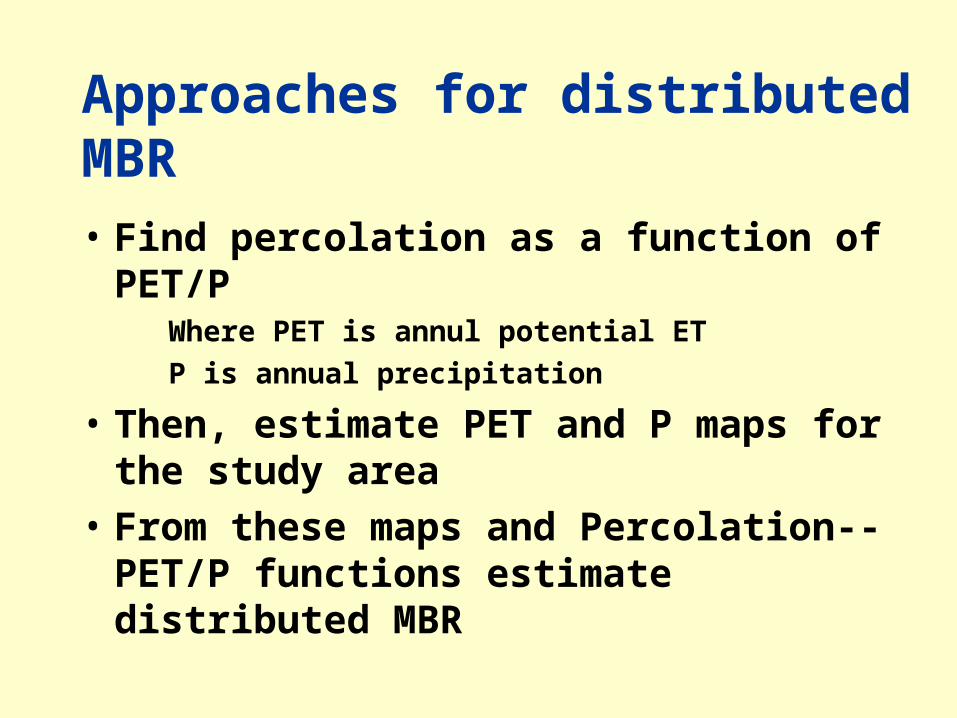
• Find percolation as a function of PET/PWhere PET is annul potential ET
P is annual precipitation
• Then, estimate PET and P maps for the study area
• From these maps and Percolation--PET/P functions estimate distributed MBR
Approaches for distributed MBR
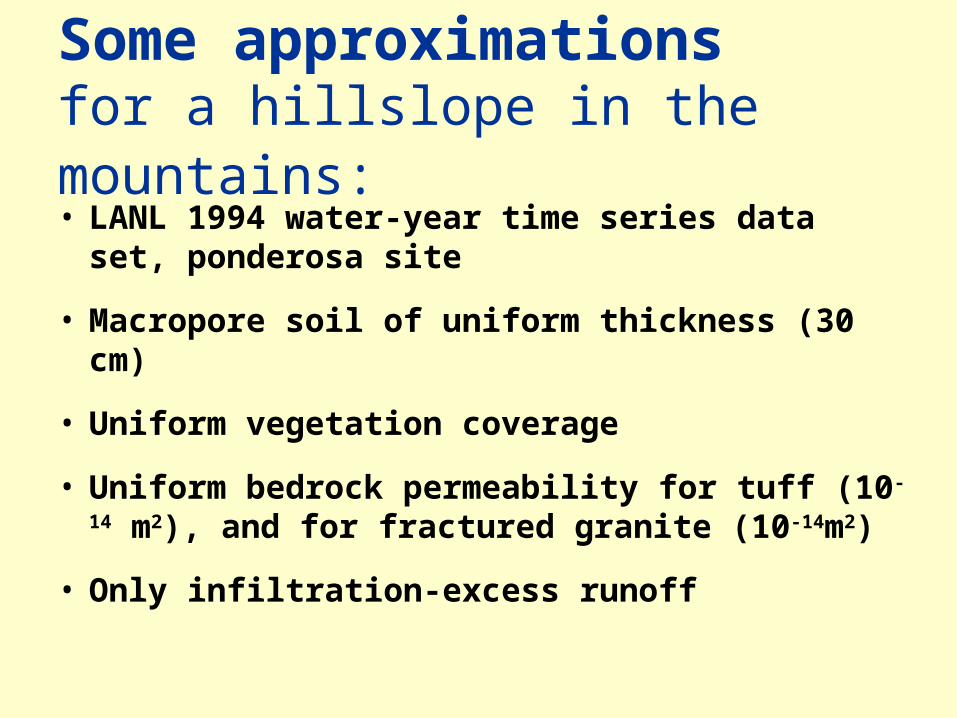
• LANL 1994 water-year time series data set, ponderosa site
• Macropore soil of uniform thickness (30 cm)
• Uniform vegetation coverage
• Uniform bedrock permeability for tuff (10-14 m2), and for fractured granite (10-14m2)
• Only infiltration-excess runoff
Some approximations for a hillslope in the mountains:
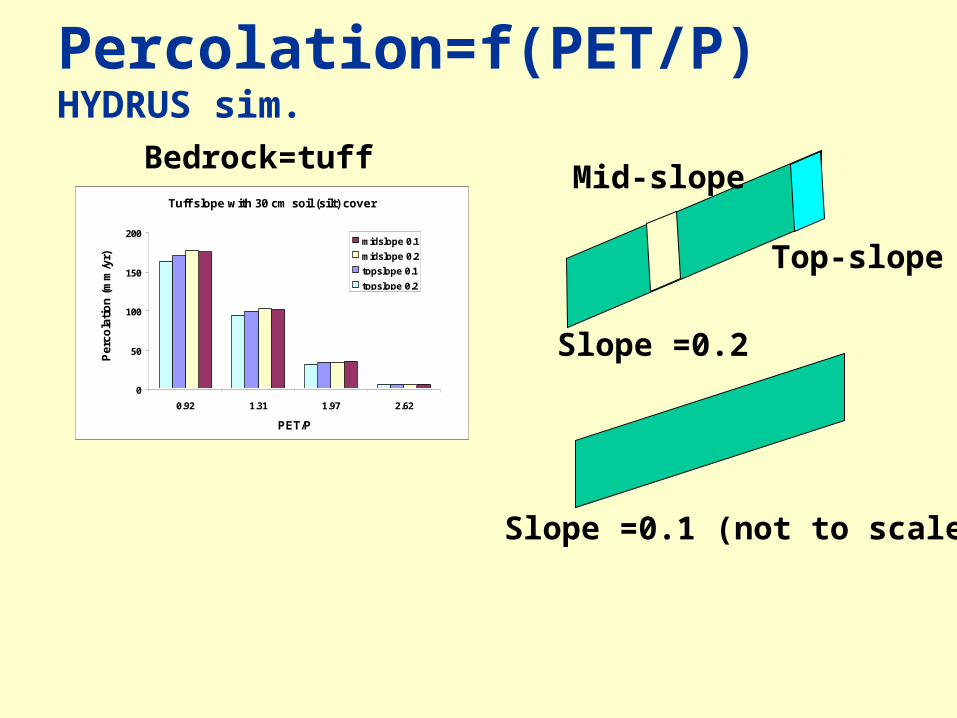
Percolation=f(PET/P) HYDRUS sim.
Bedrock=tuffTuff slope with 30 cm soil (silt) cover
0
50
100
150
200
2.621.971.310.92
PET/P
Per
cola
tio
n (
mm
/yr)
midslope 0.1
midslope 0.2
topslope 0.1
topslope 0.2
Slope =0.1 (not to scale)
Slope =0.2
Top-slope
Mid-slope
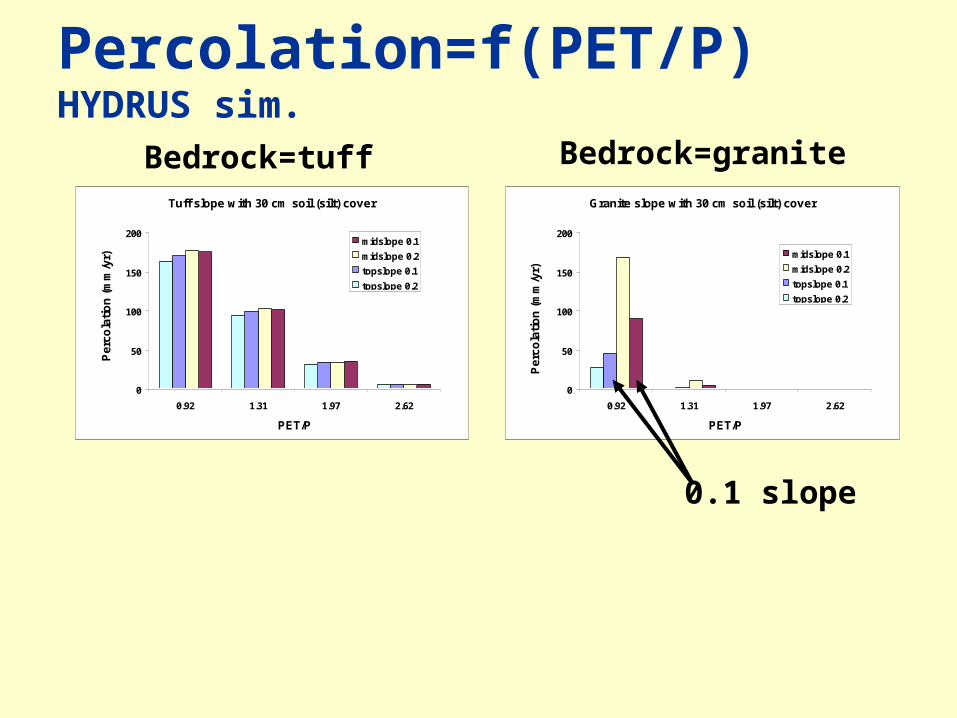
Percolation=f(PET/P) HYDRUS sim.
Bedrock=tuff Bedrock=graniteGranite slope with 30 cm soil (silt) cover
0
50
100
150
200
2.621.971.310.92
PET/P
Per
cola
tio
n (
mm
/yr)
midslope 0.1
midslope 0.2
topslope 0.1
topslope 0.2
Tuff slope with 30 cm soil (silt) cover
0
50
100
150
200
2.621.971.310.92
PET/P
Per
cola
tio
n (
mm
/yr)
midslope 0.1
midslope 0.2
topslope 0.1
topslope 0.2
0.1 slope
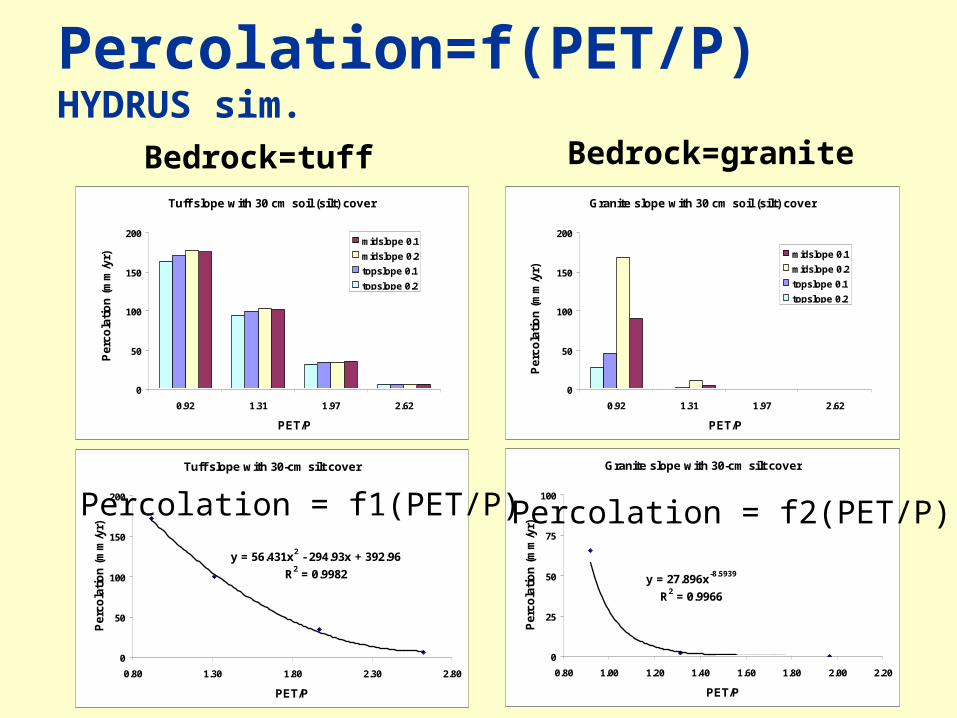
Tuff slope with 30-cm silt cover
y = 56.431x2 - 294.93x + 392.96
R2 = 0.9982
0
50
100
150
200
0.80 1.30 1.80 2.30 2.80
PET/P
Per
cola
tio
n (
mm
/yr)
Granite slope with 30-cm silt cover
y = 27.896x-8.5939
R2 = 0.9966
0
25
50
75
100
0.80 1.00 1.20 1.40 1.60 1.80 2.00 2.20
PET/P
Per
cola
tio
n (
mm
/yr)
Percolation=f(PET/P) HYDRUS sim.
Bedrock=tuff Bedrock=graniteGranite slope with 30 cm soil (silt) cover
0
50
100
150
200
2.621.971.310.92
PET/P
Per
cola
tio
n (
mm
/yr)
midslope 0.1
midslope 0.2
topslope 0.1
topslope 0.2
Tuff slope with 30 cm soil (silt) cover
0
50
100
150
200
2.621.971.310.92
PET/P
Per
cola
tio
n (
mm
/yr)
midslope 0.1
midslope 0.2
topslope 0.1
topslope 0.2
Percolation = f1(PET/P) Percolation = f2(PET/P)
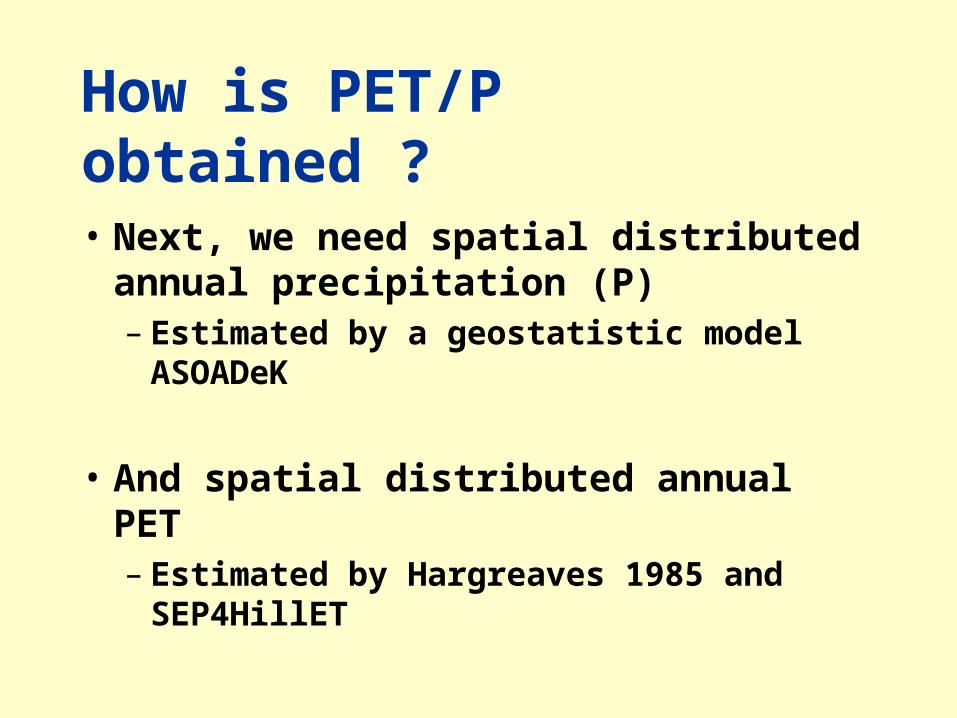
How is PET/P obtained ?
• Next, we need spatial distributed annual precipitation (P)– Estimated by a geostatistic model
ASOADeK
• And spatial distributed annual PET– Estimated by Hargreaves 1985 and
SEP4HillET
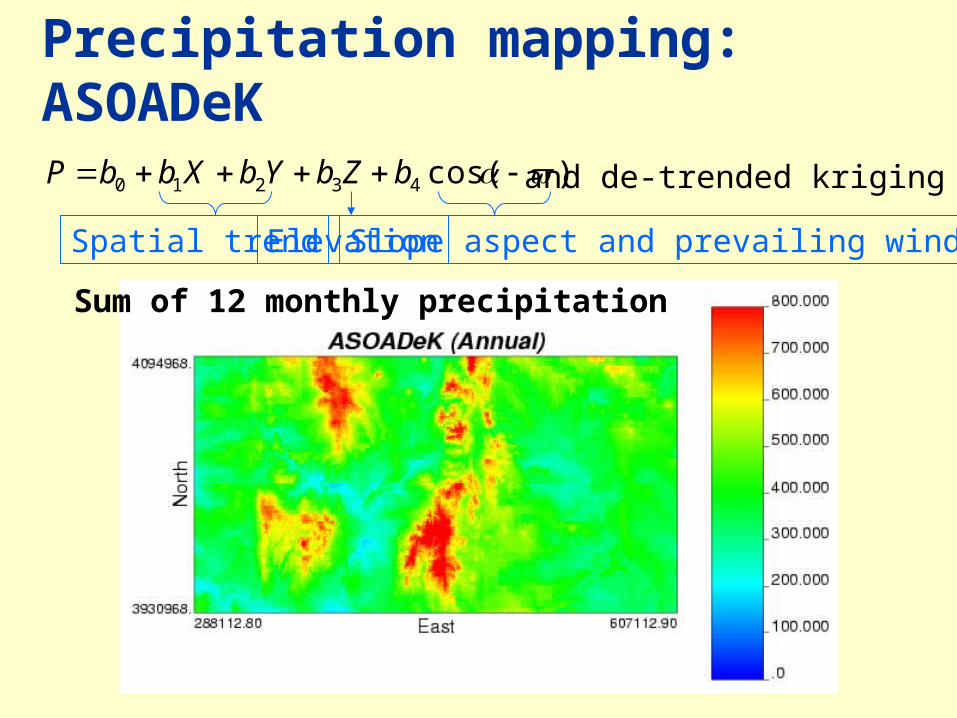
Precipitation mapping: ASOADeK
)cos(43210 bZbYbXbbP and de-trended kriging
Spatial trend Elevation Slope aspect and prevailing wind
Sum of 12 monthly precipitation
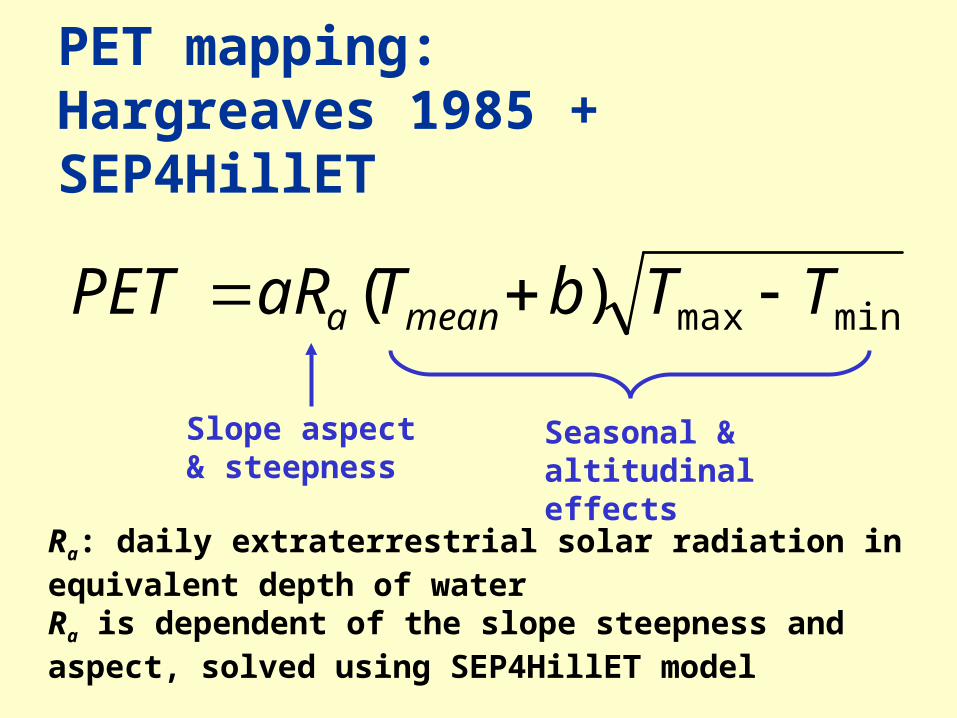
PET mapping: Hargreaves 1985 + SEP4HillET
minmax)( TTbTaRPET meana
Ra: daily extraterrestrial solar radiation in equivalent depth of waterRa is dependent of the slope steepness and aspect, solved using SEP4HillET model
Slope aspect & steepness
Seasonal & altitudinal effects
M1
M4
M2
M3
M5
M6
M12
M9
M11
M10
M8
M7
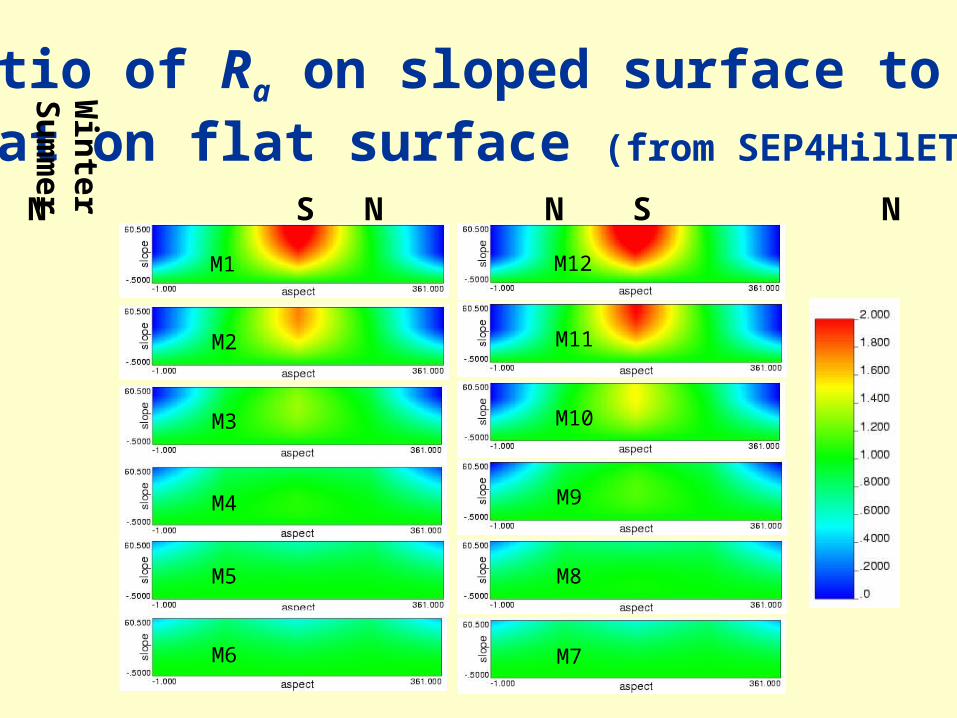
Ratio of Ra on sloped surface to that on flat surface (from SEP4HillET)
N S N N S NWin
ter S
um
mer
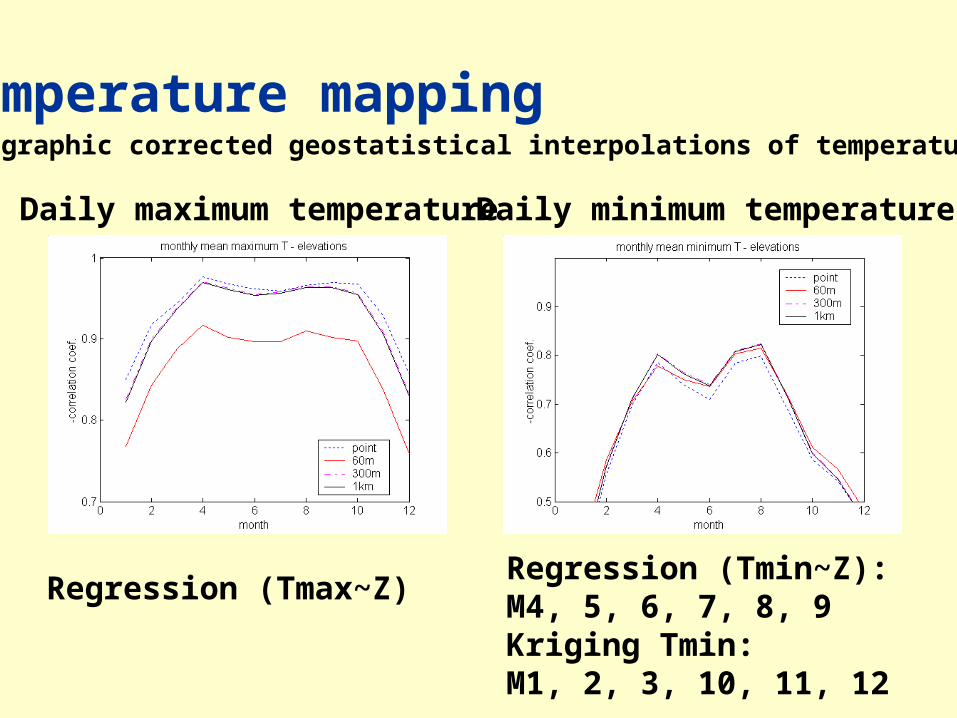
Temperature mappingTopographic corrected geostatistical interpolations of temperature
Daily maximum temperature Daily minimum temperature
Regression (Tmax~Z)Regression (Tmin~Z): M4, 5, 6, 7, 8, 9Kriging Tmin:M1, 2, 3, 10, 11, 12
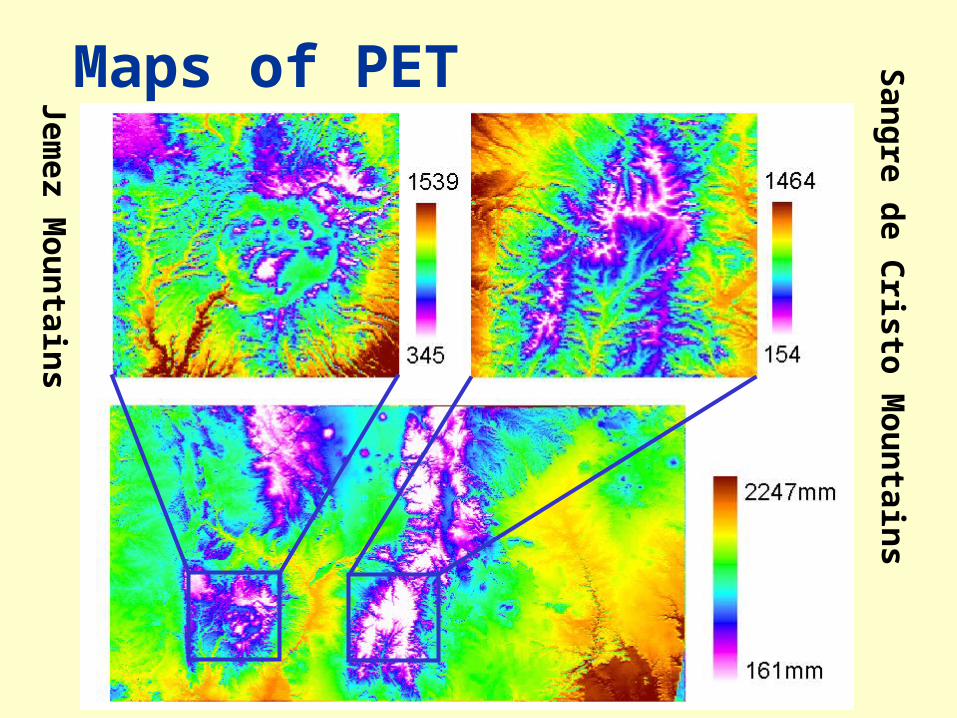
Maps of PET
Jemez M
ou
ntain
s
San
gre d
e Cristo
Mo
un
tains

Maps of potential distributed MBRat hypothetical northern NM mountains
Jemez Mountains Sangre de Cristo Mountains
Min: 0 Max: 193Mean: 47 Median: 42
Min: 0 Max: 113Mean: 16 Median: 0.44
Unit: mm/yr
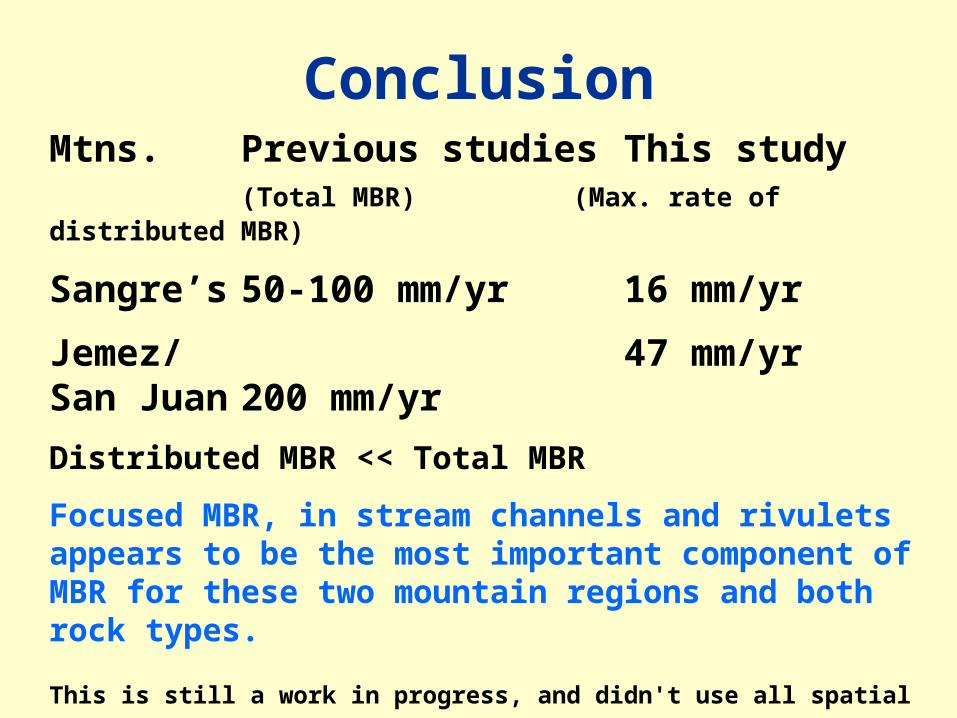
ConclusionMtns. Previous studies This study
(Total MBR) (Max. rate of distributed MBR)
Sangre’s 50-100 mm/yr 16 mm/yr
Jemez/ 47 mm/yrSan Juan 200 mm/yr
Distributed MBR << Total MBR
Focused MBR, in stream channels and rivulets appears to be the most important component of MBR for these two mountain regions and both rock types.
This is still a work in progress, and didn't use all spatial information on soil
and vegetative cover, etc.
ain
Thank you!