Embed Size (px)
Citation preview
Boise State UniversityScholarWorksCommunity and Environmental Health FacultyPublications and Presentations
Department of Community and EnvironmentalHealth
7-1-2010
Assessing Community Health Center (CHC)Assets and Capabilities for Recruiting andRetaining Physicians: The CHC CommunityApgar QuestionnaireDavid SchmitzBoise State University
Ed BakerBoise State University
Ayaka NukuiBoise State University
Benjamin TverdyBoise State University
This document was originally published by the United States Government in Idaho Department of Health and Welfare - State Office of Rural Health andPrimary Care. http://www.healthandwelfare.idaho.gov/LinkClick.aspx?fileticket=v3iuears44E%3d&tabid=104

Assessing Community Health Center (CHC) Assets and
Capabilities for Recruiting and Retaining Physicians:
The CHC Community Apgar Questionnaire
Prepared for:
State Office of Rural Health and Primary Care
Idaho Department of Health and Welfare
Prepared by:
David Schmitz, MD, Family Medicine Residency of Idaho
Ed Baker, PhD, Boise State University
Ayaka Nukui, MHS, Boise State University
Benjamin Tverdy, Boise State University
July 2010

2
Acknowledgements
This research was funded by the Idaho Department of Health and Welfare, State Office of Rural Health and
Primary Care through a grant from the U.S. Department of Health and Human Services, Health Resources
and Services Administration, Office of Rural Health Policy, CFDA #93.913. The authors thank Denise
Chuckovich, Executive Director and Katrina Hoff, Director of Workforce Development of the Idaho Primary
Care Association for their assistance in this research.

3
Table of Contents
Section Page
Acknowledgements ...................................................................................................... 2
Executive Summary………………………………………………………………….. 4
Introduction .................................................................................................................. 9
Methods ........................................................................................................................ 11
Results .......................................................................................................................... 14
Discussion .................................................................................................................... 25
References……………………………………………………………………………. 31
Tables ........................................................................................................................... 32
Figures .......................................................................................................................... 59
Appendix A – Community Health Center (CHC) Community Apgar Questionnaire . 102
Appendix B – Glossary of Terms ............................................................................... 106

4
Assessing Community Health Center (CHC) Assets and
Capabilities for Recruiting and Retaining Physicians:
The CHC Community Apgar Questionnaire
Executive Summary
Community factors play a key role in the recruitment and retention of physicians. While prior
workforce studies often investigated characteristics of the candidate-physician, the initial Critical Access
Hospital Community Apgar Questionnaire (CAH CAQ) study identified community factors at critical access
hospitals which help determine the success of achieving and maintaining an adequate local physician
workforce. The goals of the current study are to identify opportunities for improvement in physician
retention and recruitment in Idaho’s Community Health Center (CHC) systems and to develop a better
understanding of the community factors in this dynamic process.
Just as the Apgar score is used to quantify resources and capabilities of the newborn that are
indicative of current functioning, the Community Health Center Community Apgar Questionnaire (CHC
CAQ) seeks to serve the same purpose for physician recruitment to communities. It should be noted that the
Apgar score of a newborn is not necessarily prognostic of the longer-term outcome and similarly, the CHC
CAQ is designed to function as a real-time measure. As in the construction of the initial CAH CAQ tool, this
study for CHCs identified factors important in recruitment and retention by literature search, site visits
during years of prior research and in discussions with physicians and administrators working at CHCs.
Factors were categorized into one of the following five classes: geographic, economic, scope of practice,
medical support, or facility and community support. With each class containing ten factors, a total of 50
factors were used to comprise the CHC CAQ (this mirrored the 50 factor, five class approach for the CAH
CAQ). A series of 3 open-ended questions were also administered to validate the factors and identify any
factor seen as significant but not addressed within the CHC CAQ factors.
5
The CHC CAQ was administered in a structured interview to provide consistency of interpretation of
the questions amongst the respondents. A total of eleven Idaho communities with CHCs differing in
geography and other known variables were selected, some communities identified historically to have more
success in recruitment and retention (labeled alpha or A) and some historically noted to have more
challenges (labeled beta or B). In each community, the Chief Executive Officer or named administrator of
the CHC and also the physician identified to have recruiting responsibilities participated individually in the
interview. CHC CAQ scoring used a method of summing parameters within each category after being
weighted for perceived importance as judged by the respondent. In this way, the most important parameters
in physician recruitment, be it an advantage or disadvantage for that community, was weighed for its relative
importance and summed to form the scores. This is a quantitative method used to represent the interview
process. In some ways this interview was similar to that which would occur with a physician-applicant. The
overall summated score then provided each community with a cumulative Community Apgar score.
The primary limitation of this study is the number of communities surveyed. A total of 11 physicians
and 11 administrators participated in the survey. One community was unable to participate because of no
physicians providing patient care other than supervision of physician assistants. A second community was
eliminated due to this being the employer of a member of the primary research team. All other communities
invited to participate did so and were included in the study. A second limitation is that statistical power
associated with the use of small sample size analysis is low for this study. Another possible limitation is that
because factors were limited to 50, other factors may exist that also impact physician workforce. This
limitation was accounted for by asking open-ended questions to give each respondent the opportunity to
identify any significant missing parameters. Notably, these discussions identified factors already contained
within the CHC CAQ.
In these eleven communities results regarding self-perception of un-weighted advantages and
challenges identified recreational opportunities and loan repayment as the highest community advantages

6
with mental health provision of services by the physician and televideo support identified as the greatest
challenges. For all individual factors, there were no significant differences found between CHC administrator
and physician responses demonstrating internal consistency in the identification of advantages and
challenges for each factor. Significant differences in scores were seen between communities which
correlated to the historical recruitment trends identified as alpha or beta. Spousal satisfaction levels, patient
demographic characteristics, call and practice coverage, shopping, CME benefits, office GYN procedures,
plans for capital investment, and efficient delegation of services were factors where alpha communities
scored significantly higher than beta communities. Alpha communities also had significantly higher scores
in economic, geographic, facility and community support and scope of practice classes as well as the overall
score across classes.
Differences in importance ratings for individual factors occurred between alpha and beta
communities and but not between administrators and physicians. Alpha communities rated allied mental
health staffing and moonlighting opportunities as more important while beta communities rated recreational
opportunities and the rendering of emergency care to be of greater importance. Beta communities had
significantly higher importance ratings in the geographic class. No other within or across class differences
were noted. Generally, the overall importance scores demonstrated no practical differences between either
the alpha and beta communities or between the administrator and physician respondents although some
significant differences were identifies in a few individual factors. This suggests that whether these
parameters were seen as an advantage or disadvantage in recruitment to any particular community, their
relative importance in recruitment was consistently recognized. Salary, call and practice coverage, spousal
satisfaction and obstetrical deliveries/C-sections were rated as the highest areas of importance and were
amongst the most frequently mentioned greatest barriers in the opened-ended responses as well.
The overall rank ordering of classes by mean Community Apgar scores in these Idaho communities
was as follows: medical support; economic, geographic, facility and community support, scope of practice.

7
There are statistically significant differences within all classes and across classes with the exception of the
medical support class where alpha communities consistently score higher on mean Community Apgar scores.
These statistical differences are not found by respondent type within any class or across classes. Given these
findings, the CHC CAQ appears to consistently quantify self-report of community assets and capabilities and
furthermore correlates to historical experience in workforce trends for a particular community. Overall, the
highest Community Apgar scores were seen for recreational opportunities and loan repayment. The overall
lowest Community Apgar scores were seen for provision of mental health services by the physician,
televideo support, and spousal satisfaction. Alpha communities had significantly higher scores in spousal
satisfaction, demographic of patients, shopping and other services, CME benefit, retirement package, office
GYN procedures, call/ practice coverage, delegated physician patient services and plans for capital
improvement. Beta communities had significantly higher scores for mid-level supervision.
As in the case of the original critical access hospital tool, the CHC CAQ seems to discriminate
between communities with greater assets and capabilities and those with lesser assets and capabilities and
also appears to accurately correlate to historical community-specific workforce trends. This assessment
allows for identification of both modifiable and non-modifiable factors and also may suggest which factors
are most important for a community to address with limited available resources. The CHC CAQ may be
used by a community to assess that community’s relative strengths and weaknesses, their relative
importance, and to gain a better understanding of which factors are seen as most important from the
physician point-of-view. The CHC CAQ may have a role in a community’s self-evaluation, prioritization of
improvement plans, advertising considerations and negotiation strategy for successful recruitment and
retention of physicians in their Idaho community. Similar to the “Community Apgar Program” developed for
critical access hospitals, this tool may likewise be used to share successful strategies that communities have
used to overcome disadvantages which may be difficult or impossible to modify. These “Community Apgar
Solutions” allow the sharing of developed best practices through further research and collaboration. The

8
CHC CAQ can be used to track a community’s progress over time, similar to the clinical use of Apgar scores
in newborns, as this instrument is designed to be a real-time assessment tool providing guidance for the most
helpful interventions at the present.

9
Assessing Community Health Center (CHC) Assets and
Capabilities for Recruiting and Retaining Physicians:
The CHC Community Apgar Questionnaire
Introduction
Idaho has physician access and shortage issues. In 2007, Idaho had the second lowest total number of
physicians among 50 other states.
Approximately two physicians are available to provide services to 1,000
Idaho residents, which is 44% below the national average.1 The American Medical Association reported that
17.4% of Idaho residents live in a designated primary care shortage area, among the nation’s highest for any
state.2
Idaho also has the sixth oldest physician workforce in the country, and 40% of Idaho physicians
registered with the AMA were age 55 or older.1 The United States Census Bureau predicted that the United
States population of age 65 years or older will grow by 60% between 2000 and 2030.3
With a large projected
population growth, especially of persons 65 years old or older, Idaho will experience a significant decrease
in its physician workforce due to retirement and a substantial increase in the number of residents with greater
medical needs.4 The American Academy of Family Physicians identified Idaho as one of the five states that
would face serious shortages of family medicine physicians by 2020.5
Recruitment and retention strategies are critical to address physician shortage problems in Idaho and
communities are anxious to better understand the factors involved. In the setting of limited resources,
appreciating their relative importance from the physician’s perspective is crucial. The ability to recruit and
retain physicians directly affects the ability to provide adequate medical services to the community.6
The
recruitment and retention of physicians in underserved areas is affected by many factors. These factors can
be conceptualized into five classes which are geographic, financial, scope of practice, medical support and
facility and community support.7
The number of published reports that documented successful case studies and/or strategies regarding
community health center (CHC) physician recruitment is limited. As a result, many CHCs still rely on

10
expensive physician recruitment firms and/or their own experience-based recruitment strategies. Without
having an opportunity to identify their community’s assets and capabilities for physician recruitment and
retention, CHCs with a historical challenge in recruitment and retention of physicians continue to experience
physician shortage problems. Comparative analysis with peers can be difficult and addressing biases within
the community or between physicians and administrator views can be unintentional barriers.
The purpose of this study was to develop an evaluation instrument useful to Idaho communities in
their assessment of assets and capabilities related to physician recruitment and retention to CHCs which
serve these communities. Just as the Apgar score is used to quantify resources and capabilities of the
newborn that are indicative of current functioning, the Community Health Center Community Apgar
Questionnaire (CHC CAQ) seeks to serve the same purpose for physician recruitment to underserved
communities. The results of this study may help Idaho CHCs to find improvement opportunities for
physician recruitment and retention strategies.

11
Methods
Human Subjects Review and Approval
The research methods described in this section as well as the Community Health Center Community
Apgar Questionnaire (CHC CAQ) found in Appendix A were reviewed and approved by the Boise State
University Human Subjects Institutional Review Board on July 13, 2009. Drs. Baker and Schmitz were
identified as the co-principal investigators for the research and were responsible for the conduct of the study.
Survey Development
The CHC CAQ was developed by the researchers based on (1) a review of the published literature,
(2) statewide site visits to Idaho communities, (3) discussions with physicians and administrators of
community health centers (CHCs) and (4) discussions with members of the Idaho Primary Care Association
workforce committee. The CHC CAQ is constructed of 50 factors which represent specific elements related
to physician recruitment and retention in Idaho CHCs. These factors were classified into five major classes
based on their characteristics. The classes are labeled geographic, economic, scope of practice, medical
support and facility and community support. Each class contains ten factors. In addition, there are three
open-ended qualitative questions at the end of the instrument. The CHC CAQ is provided in Appendix A
and Appendix B provides a glossary of terms for the 50 factors in the CHC CAQ.
The CHC CAQ was designed to produce an assessment comparable to the Apgar score which is used
in clinical practice to assess an infant’s medical needs immediately after birth. The neonatal Apgar score is
obtained by summing individuals scores assigned to five critical dimensions associated with infant’s
observed physical conditions. The Community Apgar score, derived from the CHC CAQ, is similarly
constructed from the sum of the scores of the five classes of factors in the CHC CAQ to create a repeatable
measure of a community’s assets and capabilities. This measure is intended to prognosticate the success of a
CHC in recruiting and retaining physicians. In addition, the CHC CAQ is designed to be used to
differentially diagnose a community’s relative strengths and challenges in order to prioritize improvement

12
efforts. The CHC CAQ is modeled after an instrument developed for critical access hospitals (i.e., Critical
Access Hospital Community Apgar Questionnaire or CAH CAQ).
Selection and Recruitment of Target Populations
The target communities for the CHC CAQ were all thirteen CHCs in Idaho. One site was chosen per
CHC if the CHC had multiple service locations. The site within each system with the largest medical staff
and patient population served was selected as this site would be the major service access point for the CHC.
The degree of historical success in recruiting and retaining physicians in each community was identified by
the researchers prior to the data analysis. CHCs with more success in recruiting and retaining physicians
were labeled as alpha or “A” communities and those with less success were labeled as beta or “B”
communities. These assignments to either alpha or beta community status were based on statewide site visits,
input from Idaho Primary Care Association colleagues and by experience in placing physicians in Idaho
communities by physician leaders at the Family Medicine Residency of Idaho. The final sample included
seven alpha (A) and four beta (B) CHCs for a total of 11 CHCs. Two CHCs were excluded from the final
sample due to potential conflict of interest issues in one case (one principle investigator was employed by the
excluded CHC) and another cases was excluded as the CHC employed only physician assistants rendering
patient care.
The target population for the CHC CAQ was (1) the CHC administrator and (2) physician leaders in
these CHCs who had responsibilities for recruitment and retention activities. The physician leaders were
selected in consultation with the CHC administrator. The recruitment of these individuals was done by
phone and email by co-principal investigator David Schmitz, MD and was supported by the Idaho Primary
Care Association. There were 11 CHC administrators and 11 CHC physicians in the final sample for a total
of 22 respondents.

13
Survey Administration Process
The CHC administrators and physicians who agreed to participate in the study were mailed the CHC
CAQ and a consent form after agreeing to participate in the study. One hour interviews were scheduled for
each participant. CHC administrators and physicians were interviewed separately and in private locations.
Prior to the interviews, the consent form was reviewed with and executed by the participants. David
Schmitz, MD, reviewed the consent form with participants and conducted the interviews. The CHC CAQ
was completed during these structured interviews.
Data Processing, Analysis and Storage
The completed CHC CAQ’s were processed at Boise State University by researchers who entered
these data into an SPSS database. The qualitative questions were reviewed by the co-principal investigators
and these responses are discussed in the Results Section.
SPSS (Version 17.0) was used for the statistical analysis. Descriptive statistics were used to organize
respondent ratings to factors on the CHC CAQ. Numerical scores were constructed to describe sections in
the CHC CAQ that address advantages and challenges, importance and Apgar scores. These score
constructions are described more fully in the Results Section. Descriptive statistics were employed to
organize these results and Mann-Whitney U tests were used for all tests of statistical significance reported in
this research. The Mann-Whitney U test is the appropriate statistical test to assess differences in median
scores when sample sizes are low. It is a conservative statistical test with less power to detect statistically
significant differences than the t-test is. In other words, although the Mann-Whitney test is the appropriate
test to use in this situation, it may result in type II errors. That is, it may fail to detect statistically significant
differences when they actually exist.
These data have been stored in locked files and password protected hard drives at the Center for
Health Policy at the College of Health Sciences, Boise State University and the Family Medicine Residency
of Idaho. Access to the raw data has been limited to the principal investigators and qualified research staff.

14
Results
The results for this study are organized into six sections. First, general Community Health Center
Community Apgar Questionnaire (CHC CAQ) findings are presented. The second section portrays CHC
CAQ class and factor findings describing community health center (CHC) advantages and challenges. Third,
CHC’s assessment of the importance of CHC CAQ classes and factors are detailed. Fourth, the Community
Apgar scores are presented by CHC CAQ classes and factors. Fifth, data describing the differential
diagnosis capability of the CHC CAQ model are presented. And sixth, the qualitative results from the three
open-ended questions of the CAQ are described. The tables and figures supporting these results are found in
the Tables and Figures sections of the report.
General CHC CAQ Findings
As noted in the Methods section, 11 CHC administrators and 11 CHC physicians who had leadership
roles in recruitment and retention participated and completed a CHC CAQ in a structured interview format.
The overall responses (N=22) for the CHC CAQ are found in Table 1 while Table 2 and Table 3 provide the
CHC CAQ responses by hospital administrators (N=11) and physicians (N=11) respectively. Tables 1-3
provide responses for the 50 factors of the CHC CAQ within the five classes of the instrument.
CHC CAQ Advantages and Challenges Findings
The qualitative ratings of the CHC CAQ advantages and challenges section were converted to
numerical scores based on the following:
Major advantage = +2;
Minor advantage = +1;
Minor challenge = -1;
Major challenge = -2.
Average advantages and challenges scores were calculated for the 50 factors and five classes of the CHC
CAQ. The five classes are geographic, economic, scope of practice, medical support, and facility and
community support. The average scores for factors within and across each class were rank ordered and

15
statistical tests were conducted to identify differences between CHC administrator and physician scores, as
well as between community A and B scores within and across classes. These analyses are discussed below
by class and across classes.
Geographic
Table 4 and Figure 1 and 2 show the advantages and challenges mean scores for the ten factors in the
geographic class. Each table/figure also contains p-values for the statistical tests across occupation and
community types. Recreational opportunities were identified as the highest community advantage followed
by schools and climate. Spousal satisfaction was identified as the greatest community challenge followed by
perception of community and demographic: underserved/payor mix. There were no significant differences
between CHC administrator and physician scores. Comparisons between community types showed that A
communities had significantly higher scores in shopping and other services (p=0.02), demographic:
underserved/payor mix (p=0.01) and spousal satisfaction (p=0.03).
Economic
Table 5 and Figures 3 and 4 show the advantages and challenges mean scores for the ten factors in
the economic class. Each table/figure also contains p-values for the statistical tests across occupation and
community types. Loan repayment was identified as the highest community advantage followed by
retirement package, perceived fiscal stability and CME benefit. Production incentive was identified as the
greatest community challenge followed by salary and signing bonus/moving allowance. There were no
significant differences between CHC administrator and physician scores. Comparisons between community
types showed that A communities had significantly higher scores in CME benefit (p=0.03).

16
Scope of Practice
Table 6 and Figures 5 and 6 show the advantages and challenges mean scores for the ten factors in
the scope of practice class. Each table/figure also contains p-values for the statistical tests across occupation
and community types. Minor trauma (casting/suturing) was identified as the highest community advantage
followed by teaching and mid-level supervision. Mental health was identified as the greatest community
challenge followed by obstetrics: prenatal care, obstetrics: deliveries/C-section and administration. There
were no significant differences between CHC administrator and physician scores. Comparisons between
community types showed that A communities had significantly higher scores in office GYN procedures
(p<0.001).
Medical Support
Table 7 and Figures 7 and 8 show the advantages and challenges mean scores for the ten factors in
the medical support class. Each table/figure also contains p-values for the statistical tests across occupation
and community types. Perception of quality was identified as the highest community advantage followed by
mid-level provider workforce and ancillary staff workforce. Nursing workforce was identified as the greatest
community challenge followed by specialist availability and pharmacy services. There were no significant
differences between CHC administrator and physician scores. Comparisons between community types
showed that A communities had significantly higher scores in call/practice coverage (p=0.01).
Facility and Community Support
Table 8 and Figures 9 and 10 show the advantages and challenges mean scores for the ten factors in
the facility and community support class. Each table/figure also contains p-values for the statistical test
across occupation and community types. Community need/support of physician was identified as the highest
community advantage followed by medical reference resources, CHC leadership and moonlighting
opportunities. Televideo support was identified as the greatest community challenge followed by welcome

17
and recruitment program, physical plant and equipment and electronic medical records. There were no
significant differences between CHC administrator and physician scores. Comparisons between community
types showed that A communities had significantly higher scores in plans for capital investment (p=0.001)
and delegated physician patient services (p=0.003).
Advantages and Challenges Findings Across Classes
Table 9 and Figures 11-13 show the advantages and challenges mean scores for the five classes
within the CHC CAQ. Each table/figure also contains p-values for the statistical tests across occupation and
community types. Class scores were calculated by summing scores across all ten factors in a class. A
summary score across classes was constructed by summing the class scores in the CHC CAQ. Medical
support was identified as the highest community advantage followed by economic, geographic, facility and
community support and scope of practice. There were no significant differences between CHC administrator
and physician scores within or across classes. Comparisons between community types showed that A
communities had significantly higher scores within four of the five classes [economic (p=0.04), geographic
(p=0.05), facility and community support (p<0.001), and scope of practice (p=0.05)] and across classes
(p=0.001).
CHC CAQ Importance Findings
The qualitative ratings of the CHC CAQ importance section were converted to numerical scores
based on the following:
Very important = +4;
Important = +3;
Unimportant = +2;
Very unimportant = +1.
Average importance scores were calculated for the 50 factors and five classes of the CHC CAQ. The five
classes are geographic, economic, scope of practice, medical support and facility and community support.

18
The average scores for factors within and across each class were rank ordered and statistical tests were
conducted to identify differences between CHC administrator and physician scores and between community
A and B scores within and across classes. These analyses are discussed below by class and across classes.
Geographic
Table 10 and Figures 14 and 15 show the importance mean scores for the ten factors in the
geographic class. Each table/figure also contains p-values for the statistical tests across occupation and
community types. Spousal satisfaction was identified as the highest area of importance for the communities
followed by recreational opportunities and schools. Shopping/other services was identified as the lowest
area of importance for the community followed by climate and perception of community. There were no
significant differences between CHC administrator and physician scores. Comparisons between community
types showed that B communities had significantly higher importance ratings in recreational opportunities
(p=0.05).
Economic
Table 11 and Figures 16 and 17 show the importance mean scores for the ten factors in the economic
class. Each table/figure also contains p-values for the statistical tests across occupation and communities
types. Salary was identified as the highest area of importance for the communities followed by loan
repayment and competition. Production incentive was identified as the lowest area of importance for the
communities followed by length of contract flexibility and part-time opportunities. There were no
significant differences between CHC administrator and physician scores or A and B community scores.
Scope of Practice
Table 12 and Figures 18 and 19 show the importance mean scores for the ten factors in the scope of
practice class. Each table/figure also contains p-values for the statistical tests across occupation and
community types. Obstetrics: deliveries/C-section was identified as the highest area of importance for the

19
communities followed by obstetrics: prenatal care and mental health. Administration was identified as the
lowest area of importance for the communities followed by mid-level supervision, teaching and minor
trauma (casting/suturing). There were no significant differences between CHC administrator and physician
scores. Comparisons between community types showed that B communities had significantly higher
importance ratings for emergency/stabilization care (p=0.05).
Medical Support
Table 13 and Figures 20 and 21 show the importance mean scores for the ten factors in the medical
support class. Each table/figure also contains p-values for the statistical tests across occupation and
community types. Call/practice coverage was identified as the highest area of importance for the
communities followed by allied mental health workforce, stability of physician workforce and perception of
quality. Language services support was identified as the lowest area of importance for the community
followed by pharmacy services, ancillary staff workforce and mid-level provider workforce. There were no
significant differences between CHC administrators and physician scores. Comparisons between community
types showed that A communities had significantly higher scores for allied mental health workforce
(p=0.02).
Facility and Community Support
Table 14 and Figures 22 and 23 show the importance mean scores for the ten factors in the facility
and community support class. Each table/figure also contains p-values for the statistical tests across
occupation and community types. Community need/support of physician was identified as the highest area
of importance for the communities followed by medical reference resources and delegated physician patient
services. Televideo support was identified as the lowest area of importance for the communities followed by
moonlighting opportunities and plans for capital improvement. There were no significant differences

20
between CHC administrator and physician scores. Comparisons between community types showed that A
communities had significantly higher scores for moonlighting opportunities (p=0.04).
Importance Findings Across Classes
Table 15 and Figures 24-26 show the importance mean scores for the five classes within the CHC
CAQ. Each table/figure contains p-values for the statistical tests across occupation and community types.
Class scores were calculated by summing scores across all ten factors in a class. A summary score across
classes was constructed by summing the scores across classes in the CHC CAQ. Geographic was identified
as the highest area of importance for the communities followed by medical support, scope of practice,
economic and facility and community support. There were no significant differences between CHC
administrator and physician scores either within or across classes. Comparisons between community types
showed that B communities had significantly higher scores for the geographic class (p=0.05). There was no
across class significant difference in scores for A and B communities.
Community Apgar Scores
The numerically converted qualitative ratings of the CHC CAQ advantages/challenges and
importance sections were used in the following algorithm:
(Community advantage/challenge score)*(community importance score) = Community Apgar Score.
This algorithm creates a community asset and capability measure derived from a community
advantage/challenge score weighted by importance metric.
Average Community Apgar scores were calculated for the 50 factors and five classes of the CHC
CAQ. The five classes are geographic, economic, scope of practice, medical support and facility and
community support. The average Community Apgar scores for factors within and across each class were
21
rank ordered and statistical tests were conducted to identify differences between CHC administrator and
physician scores and between community A and B scores within and across classes. These analyses are
discussed below by class and across classes.
Geographic
Table 16 and Figures 27 and 28 show the mean Community Apgar scores for the ten factors in the
geographic class. Each table/figure also contains the p-values for the statistical tests across occupation and
community types. Recreational opportunities were identified as the most significant community asset and
capability followed by schools and access to larger communities. Spousal satisfaction was identified as the
least developed community asset and capability followed by perception of community and demographic:
underserved/payer mix. There were no significant differences between CHC administrator and physician
scores. Comparisons between community types showed that A communities had significantly higher scores
in shopping and other services (p=0.05) demographic: underserved/payer mix (p=0.04) and spousal
satisfaction (p=0.03).
Economic
Table 17 and Figures 29 and 30 show the mean Community Apgar scores for the ten factors in the
economic class. Each table/figure contains p-values for the statistical tests across occupation and community
types. Loan repayment was identified as the most significant community asset and capability followed by
retirement package and CME benefit. Salary was identified as the least developed community asset and
capability followed by production incentive and signing bonus/moving allowance. There were no significant
differences between CHC administrator and physician scores. Comparisons between community types
showed that A communities had significantly higher scores in retirement package (p=0.02) and CME benefit
(p=0.02).

22
Scope of Practice
Table 18 and Figures 31 and 32 show the mean Community Apgar scores for the ten factors in the
scope of practice class. Each table/figure contains p-values for the statistical tests across occupation and
community types. Minor trauma (casting/suturing) was identified as the most significant community asset
and capability followed by teaching and mid-level supervision. Mental health was identified as the least
developed community asset and capability followed by administration and obstetrics: prenatal care. There
were no significant differences between CHC administrator and physician scores. Comparisons between
community types showed that B communities had significantly higher scores in midlevel supervision
(p=0.04) while A communities had significantly higher scores in office GYN procedures (p<0.001).
Medical Support
Table 19 and Figures 33 and 34 show the mean Community Apgar scores for the ten factors in the
medical support class. Each table/figure contains p-values for the statistical tests across occupation and
community types. Perception of quality was identified as the most significant community asset and
capability followed by mid-level provider workforce and call/practice coverage. Nursing workforce was
identified as the least developed community asset and capability followed by specialist availability and
pharmacy services. There were no significant differences between CHC administrator and physician scores.
Comparisons between community types showed that A communities had significantly higher scores in
call/practice coverage (p=0.02).
Facility and Community Support
Table 20 and Figures 35 and 36 show the mean Community Apgar scores for the ten factors in the
facility and community support class. Each table/figure contains p-values for the statistical tests across
occupation and community types. Community need/support of physician was identified as the most

23
significant community asset and capability followed by medical reference resources and CHC leadership.
Televideo support was identified as the least developed community asset and capability followed by
welcome and recruitment program and electronic medical records. There were no significant differences
between CHC administrator and physician scores. Comparisons between community types showed that A
communities had significantly higher scores in plans for capital investment (p=0.007) and delegated
physician patient services (p=0.003).
Community Apgar Scores Across Classes
Table 21 and Figures 37-39 show the mean Community Apgar scores for the five classes within the
CHC CAQ. Each table/figure contains p-values for the statistical tests across occupation and community
types. Class scores were calculated by summing scores across all ten factors in a class. A summary score
across classes was constructed by summing the scores across classes in the CHC CAQ. Medical support was
identified as the most significant community asset and capability followed by economic, geographic, facility
and community support and scope of practice. There were no significant differences between CHC
administrator and physician scores either within or across classes. Comparisons between community types
showed that A communities had significantly higher scores within four of five classes [economic (p=0.01),
geographic (p=0.04), facility and community support (p=0.001) and scope of practice (p=0.05)] and across
classes (p=0.001).
Community Apgar Scores Across CHCs
Table 22 and Figure 40 show the cumulative Community Apgar score for each of the participating
CHCs. The cumulative Community Apgar score was derived by adding all Community Apgar scores for
each of the 50 factors of the CHC CAQ for each CHC. The cumulative Community Apgar scores range
from 389 to -44. Higher scores indicate greater community assets and capabilities.

24
Qualitative Results
The CHC CAQ contains three open-ended questions. These questions are listed below and a summary of
respondent answers are provided for each question.
1. What are your greatest barriers to recruitment and retention of Family Medicine physicians?
Small pool of candidate applicants. Direct competition from other recruiting entities. Offering a
competitive salary. Spousal satisfaction. Mental health needs of patient population. Call and practice
coverage demands. Physical plant adequacy.
2. What can be done to overcome these barriers?
Resident rotations. Flexible contracting. Pay increase. Reduce intensity of call. Teambuilding and
integration with community resources. Increase/improve patient care areas.
3. What reasons has a successful physician candidate given for not accepting a position in the
community? What did that person ultimately do instead (if you know)?
Insufficient salary. Burn out. Spousal dissatisfaction. Too small or isolated community (took position
in larger community).

25
Discussion
Research Limitations
The primary limitation of the research is the small number of communities (N=11) and Community
Health Center Community Apgar Questionnaire (CHC CAQ) respondents (N=22) which agreed to
participate in the study. The communities and respondents that participated in the research may not represent
the entire eligible respondent classes and thus may limit the ability to generalize the findings to other
communities. A second limitation of the research is that small sample sizes limited statistical power to
detect differences between groups. Increasing sample sizes and employing statistical tests with more power
(e.g., t-test) in these comparisons would enhance the probability of detecting statistically significant
differences between groups, if such differences actually exist. A third possible limitation of the research is
that because CHC CAQ factors were limited to 50, other factors may exist that also impact physician
workforce. This limitation was accounted for by asking open-ended questions to give each respondent the
opportunity to identify any significant missing parameters. Notably, these discussions identified factors
already contained within the CAQ.
Community Advantages and Challenges Scores
In these 11 communities results regarding self-perception of advantages and challenges identified
recreational opportunities and loan repayment as the highest community advantage with mental health
provision of services by the physician and televideo support identified as the greatest challenges. For each
factor, there were no significant differences between CHC administrator and physician responses,
demonstrating internal consistency in the identification of advantages and challenges for each factor.
Differences in scores were seen between communities identified as alpha or beta. These results suggest that
the CHC CAQ consistently quantifies self-report of community assets and capabilities and additionally
correlates to historical experience in workforce trends for a particular community.
26
Overall, spousal satisfaction levels, patient demographic characteristics, call and practice coverage
were each seen as challenges to recruitment in beta communities while shopping, CME benefits, office GYN
procedures, plans for capital investment, and efficient delegation of services were seen as advantageous in
alpha communities. Respondents explained that spousal satisfaction was frequently a challenge because of
isolation from desired community resources such as employment, ease of transportation (e.g., airports) and
other cultural and service opportunities. Patient demographics were described as challenging due to high
levels of mental health needs, economic poverty and geriatrics. In fact, mental health provision of care was
seen almost universally as a challenge, regardless of the community and practice setting. Availability of
ancillary mental health workforce then was seen as a key factor in relieving this stress. Call and practice
coverage requirements varied widely and less strenuous requirements were seen as an advantage. The
availability of office GYN procedures such as coloposcopy was seen as an advantage to provider
recruitment. Efficient delegation of services from the physician to the care team was seen as a distinct
advantage more often reported in alpha communities.
Community Importance Scores
Differences in importance ratings for individual factors occurred between alpha and beta
communities but not between administrators and physicians. Alpha communities rated allied mental health
staffing and moonlighting opportunities as more important while beta communities rated recreational
opportunities and the rendering of emergency care to be of greater importance. It is of interest that provision
of mental health services by the physician provider was the most challenging overall barrier to recruitment of
physicians and also that the importance of allied mental health staffing was ranked as significantly higher by
alpha communities than by beta communities. This was validated during the interviews where respondents
identified allied mental health staff as a potential key solution to relieving the stress of provision of mental
health services by the physicians alone to a population uniquely requiring those services. Beta communities’

27
ranking of recreational opportunities and the rendering of emergency care as more important may be due to
those beta communities being located in more rural or isolated geography than their alpha counterparts.
Overall by category, beta communities gave greater importance scores to the geographic class. This
again is likely a result of the beta communities being more rural or isolated geographically. Generally
however, the overall importance scores demonstrated no practical difference between either the alpha and
beta communities or between the administrator and physician respondents. This suggests that whether these
parameters were seen as an advantage or disadvantage in recruitment to any particular community, their
relative importance in recruitment was consistently recognized. Salary, call and practice coverage, spousal
satisfaction and obstetrical deliveries/C-sections were rated as the highest areas of importance and were
amongst the most frequently mentioned greatest barrier in the opened-ended responses as well.
Community Apgar Scores
The overall rank ordering of classes by mean Community Apgar scores in these Idaho communities
was as follows: medical support; economic, geographic, facility and community support, scope of practice.
This may reflect that the structure and financing of the community health center (CHC) entities is better
supported for their provision of a more limited scope of services as compared to critical access hospitals
while facing similar overall pressures for recruiting physicians as their other clinical facility counterparts.
There are statistically significant differences within all classes and across classes with the exception
of medical support where alpha communities consistently score higher on mean Community Apgar scores.
Again, the presence of less of a difference between alpha and beta CHC communities across the medical
support class may be in part to the scope of services and their organization as CHCs. Caution should be
exercised however given the limited sample size which makes further investigation of this point necessary.
Statistical differences are not found by respondent type within any class or across classes.
The results suggest that the CHC CAQ consistently both quantifies self-report of community assets
and capabilities and furthermore correlates to historical experience in workforce trends for a particular

28
community. While “Community 8” scored higher than two of its alpha counterparts, the trend clearly
identifies a gradient effect between the higher scoring alpha communities and the lower scoring beta
communities. The phenomenon of these findings can be explained by at least two observations. First,
communities do not remain static within their historical categorization of alpha or beta but do in fact improve
(or devolve) in their abilities and assets. Secondly, this pilot study enrolled all eligible CHCs with a gradient
from alpha to beta that was defined in relative terms to one another. The prior study of critical access
hospitals referenced earlier in this report was a sample of alpha and beta communities selecting eleven from
a total of twenty-six with distinct histories designated as most alpha or beta.
While individual communities had different Community Apgar scores for various factors, trends
reflecting the overall group as a whole were also identified. Overall, the highest Apgar scores were seen for
recreational opportunities and loan repayment. Similar to the critical access hospital study, recreational
opportunities represent a key factor for recruiting to Idaho communities. Loan repayment is a characteristic
of the CHC settings. The overall lowest Community Apgar scores were seen for provision of mental health
services by the physician, televideo support, and spousal satisfaction. The issues of mental health provision
of services by the physician are discussed above and are an area important for further study. Early
investigation of Community Apgar Solutions as a part of the Community Apgar Program for critical access
hospital communities is focused on mental health services and also physician contracting, each likely to play
a critical role in the improvement of CHC recruitment as well. Televideo support was much more notable as
a factor in the CHC study and may be both related to the location of televideo resources in hospital settings
as opposed to CHC settings and/or a historical context if in fact this 2009 data is demonstrating a time bias
from the 2008 critical access hospital study. This is also an area worthy of further study.
The responses to the open-ended questions validated the factors in the CHC CAQ and often provided
historical examples in physician recruitment, retention, or loss. The most frequently mentioned factors in the

29
failure of recruitment or retention of family physicians was inadequate salary, inadequate call/practice relief,
lack of spousal satisfaction and community isolation.
CAQ Utility as a Differential Diagnosis Tool
Similar to the critical access hospital CAQ study, the CHC CAQ seems to not only discriminate
between communities with greater assets and capabilities and those with lesser assets and capabilities but
also seems to accurately correlate to historical community-specific workforce trends. This assessment allows
for identification of both modifiable and non-modifiable factors and also may suggest which factors are most
important for a community to address with limited available resources. Therefore, the CHC CAQ may be
used by communities to assess their relative strengths and weaknesses, the relative importance of CHC CAQ
factors, and to gain a better understanding of which CHC CAQ factors are seen as most important from the
physician point-of-view. The CHC CAQ may also have a role in a community’s self-evaluation,
prioritization of improvement plans, advertising considerations and negotiation strategy for successful
recruitment and retention of physicians in their Idaho community. Following the work already underway in
critical access hospital communities, this tool may also be used to share successful strategies communities
have used to overcome disadvantages which may be difficult or impossible to modify. Specifically, the
“Community Apgar Program” has piloted “Community Apgar Solutions”, initially focusing on provision of
mental health services and physician contracting to address the identified modifiable recruitment factors
identified as importance issues by critical access hospitals.
The CHC CAQ could also be used to track a community’s progress over time, similar to the clinical
use of Apgar scores in newborns, as this instrument is designed to be a real-time assessment tool providing
guidance for the most helpful interventions at the present. This is currently being studied with critical access
hospitals and ongoing work with the critical access hospital CAQ tool in conjunction with the Community
Apgar Program designed to provide facilitated assistance to aid in improving recruitment and retention
efforts of physicians in a focused and most effective manner. The ongoing study of both community health

30
center and critical access hospital community settings in the framework of the Community Apgar
Questionnaire and the associated Community Apgar Program will provide both cross-study data between
these settings as well as ongoing temporal data for identification of longitudinal trends, aggregate analysis
and targeted individual community benefit.
31
References
1. Association of American Medical Colleges, Center for Workforce Studies. (2009). Recent studies and
reports on physician shortages in the U.S. Washington, DC: Author.
2. American Medical Association. (2009). Idaho needs health reform to fix the Medicare physician
payment formula. Retrieved on August 23, 2009, from http://www.ama-
assn.org/ama1/pub/upload/mm/399/sgr-states-id.pdf
3. United States Census Bureau. (n.d.). U.S. interim projections by age, sex, race, and Hispanic origin:
2000-2050. Retrieved on August 27, 2009, from
http://www.census.gov/population/www/projections/usinterimproj/
4. MGT of America, Inc. (2007). Medical education study final report for Medical Education Study
Committee, Idaho State Board of Education. Tallahassee, FL: Author.
5. American Academy of Family Physicians. (2006). Family physician workforce reform:
Recommendations of the American Academy of Family Physicians (Draft Reprint No. 305b).
Retrieved on August 22, 2009, from
http://www.aafp.org/online/etc/medialib/aafp_org/documents/about/congress/2006/bd-
rpts/brdrptp.Par.0001.File.dat/BoardReportPonPhysicianWorkforceReform.pdf.
6. Cohn, K.H., & Harlow, D.C. (2009). Field-tested strategies for physician recruitment and contracting.
Journal of Healthcare Management, 54, 151-158.
7. Schmitz, D., Baker, E., Epperly, T., Reed, A., & Nukui, A. (2008). Idaho rural family physician
workforce study: The Community Apgar Questionnaire (Rural Family Physician Work Force Study
Phase 2). Retrieved May 20, 2009, from the State Office of Rural Health and Primary Care, Idaho
Department of Health and Welfare Web site:
http://healthandwelfare.idaho.gov/Portals/0/Health/Rural%20Health/RuralWorkforceStudy2.pdf

32
Tables
Table 1: Overall Distribution of Survey Responses
Table 2: Hospital Administrator Distribution of Survey Responses
Table 3: Physician Distribution of Survey Responses
Table 4: Geographic Class CHC Community Advantages and Challenges Mean Scores: Rank Ordered
by Overall Score
Table 5: Economic Class CHC Community Advantages and Challenges Mean Scores: Rank Ordered
by Overall Score
Table 6: Scope of Practice Class CHC Community Advantages and Challenges Mean Scores: Rank
Ordered by Overall Score
Table 7: Medical Support Class CHC Community Advantages and Challenges Mean Scores: Rank
Ordered by Overall Score
Table 8: Facility and Community Support Class CHC Community Advantages and Challenges: Rank
Ordered by Overall Score
Table 9: Class CHC Community Advantages and Challenges Mean Scores: Rank Ordered by
Summary Score
Table 10: Geographic Class CHC Community Importance Mean Scores: Rank Ordered by Overall
Score
Table 11: Economic Class CHC Community Importance Mean Scores: Rank Ordered by Overall Score
Table 12: Scope of Practice Class CHC Community Importance Mean Scores: Rank Ordered by Overall
Score
Table 13: Medical Support Class CHC Community Importance Mean Scores: Rank Ordered by Overall
Score
Table 14: Facility and Community Support Class CHC Community Importance Mean Scores: Rank
Ordered by Overall Score
Table 15: Class Community Importance Mean Scores: Rank Ordered by Summary Score

33
Tables (Cont.)
Table 16: Geographic Class CHC Community Apgar Mean Scores: Rank Ordered by Overall Score
Table 17: Economic Class CHC Community Apgar Mean Scores: Rank Ordered by Overall Score
Table 18: Scope of Practice Class CHC Community Apgar Mean Scores: Rank Ordered by Overall
Score
Table 19: Medical Support Class CHC Community Apgar Mean Scores: Rank Ordered by Overall
Score
Table 20: Facility and Community Support Class CHC Community Apgar Mean Scores: Rank Ordered
by Overall Score
Table 21: Class CHC Community Apgar Mean Scores: Rank Ordered by Summary Score
Table 22: Cumulative CHC Community Apgar Score by Community Health Center: Rank Ordered by
Overall Cumulative Apgar Score
34
Table 1
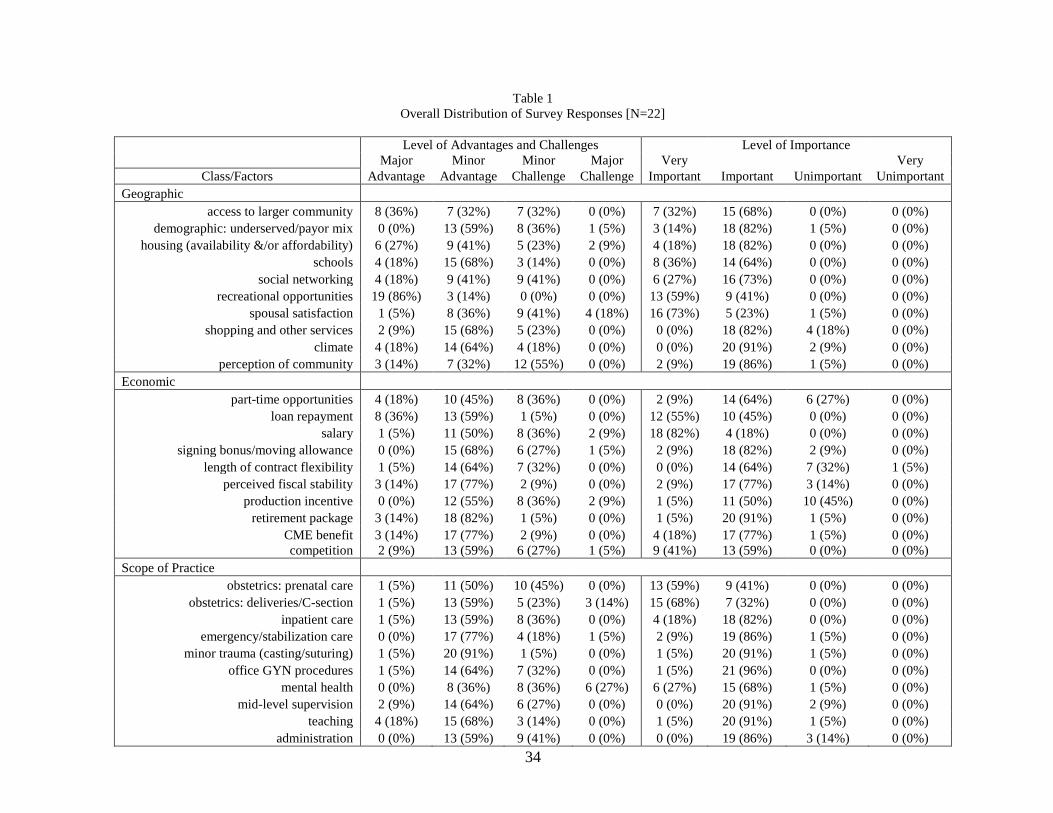
Overall Distribution of Survey Responses [N=22]
Level of Advantages and Challenges Level of Importance
Major Minor Minor Major Very Very
Class/Factors Advantage Advantage Challenge Challenge Important Important Unimportant Unimportant
Geographic
access to larger community 8 (36%) 7 (32%) 7 (32%) 0 (0%) 7 (32%) 15 (68%) 0 (0%) 0 (0%)
demographic: underserved/payor mix 0 (0%) 13 (59%) 8 (36%) 1 (5%) 3 (14%) 18 (82%) 1 (5%) 0 (0%)
housing (availability &/or affordability) 6 (27%) 9 (41%) 5 (23%) 2 (9%) 4 (18%) 18 (82%) 0 (0%) 0 (0%)
schools 4 (18%) 15 (68%) 3 (14%) 0 (0%) 8 (36%) 14 (64%) 0 (0%) 0 (0%)
social networking 4 (18%) 9 (41%) 9 (41%) 0 (0%) 6 (27%) 16 (73%) 0 (0%) 0 (0%)
recreational opportunities 19 (86%) 3 (14%) 0 (0%) 0 (0%) 13 (59%) 9 (41%) 0 (0%) 0 (0%)
spousal satisfaction 1 (5%) 8 (36%) 9 (41%) 4 (18%) 16 (73%) 5 (23%) 1 (5%) 0 (0%)
shopping and other services 2 (9%) 15 (68%) 5 (23%) 0 (0%) 0 (0%) 18 (82%) 4 (18%) 0 (0%)
climate 4 (18%) 14 (64%) 4 (18%) 0 (0%) 0 (0%) 20 (91%) 2 (9%) 0 (0%)
perception of community 3 (14%) 7 (32%) 12 (55%) 0 (0%) 2 (9%) 19 (86%) 1 (5%) 0 (0%)
Economic
part-time opportunities 4 (18%) 10 (45%) 8 (36%) 0 (0%) 2 (9%) 14 (64%) 6 (27%) 0 (0%)
loan repayment 8 (36%) 13 (59%) 1 (5%) 0 (0%) 12 (55%) 10 (45%) 0 (0%) 0 (0%)
salary 1 (5%) 11 (50%) 8 (36%) 2 (9%) 18 (82%) 4 (18%) 0 (0%) 0 (0%)
signing bonus/moving allowance 0 (0%) 15 (68%) 6 (27%) 1 (5%) 2 (9%) 18 (82%) 2 (9%) 0 (0%)
length of contract flexibility 1 (5%) 14 (64%) 7 (32%) 0 (0%) 0 (0%) 14 (64%) 7 (32%) 1 (5%)
perceived fiscal stability 3 (14%) 17 (77%) 2 (9%) 0 (0%) 2 (9%) 17 (77%) 3 (14%) 0 (0%)
production incentive 0 (0%) 12 (55%) 8 (36%) 2 (9%) 1 (5%) 11 (50%) 10 (45%) 0 (0%)
retirement package 3 (14%) 18 (82%) 1 (5%) 0 (0%) 1 (5%) 20 (91%) 1 (5%) 0 (0%)
CME benefit 3 (14%) 17 (77%) 2 (9%) 0 (0%) 4 (18%) 17 (77%) 1 (5%) 0 (0%)
competition 2 (9%) 13 (59%) 6 (27%) 1 (5%) 9 (41%) 13 (59%) 0 (0%) 0 (0%)
Scope of Practice
obstetrics: prenatal care 1 (5%) 11 (50%) 10 (45%) 0 (0%) 13 (59%) 9 (41%) 0 (0%) 0 (0%)
obstetrics: deliveries/C-section 1 (5%) 13 (59%) 5 (23%) 3 (14%) 15 (68%) 7 (32%) 0 (0%) 0 (0%)
inpatient care 1 (5%) 13 (59%) 8 (36%) 0 (0%) 4 (18%) 18 (82%) 0 (0%) 0 (0%)
emergency/stabilization care 0 (0%) 17 (77%) 4 (18%) 1 (5%) 2 (9%) 19 (86%) 1 (5%) 0 (0%)
minor trauma (casting/suturing) 1 (5%) 20 (91%) 1 (5%) 0 (0%) 1 (5%) 20 (91%) 1 (5%) 0 (0%)
office GYN procedures 1 (5%) 14 (64%) 7 (32%) 0 (0%) 1 (5%) 21 (96%) 0 (0%) 0 (0%)
mental health 0 (0%) 8 (36%) 8 (36%) 6 (27%) 6 (27%) 15 (68%) 1 (5%) 0 (0%)
mid-level supervision 2 (9%) 14 (64%) 6 (27%) 0 (0%) 0 (0%) 20 (91%) 2 (9%) 0 (0%)
teaching 4 (18%) 15 (68%) 3 (14%) 0 (0%) 1 (5%) 20 (91%) 1 (5%) 0 (0%)
administration 0 (0%) 13 (59%) 9 (41%) 0 (0%) 0 (0%) 19 (86%) 3 (14%) 0 (0%)

35
Table 1 (Cont.)
Overall Distribution of Survey Responses [N=22]
Level of Advantages and Challenges Level of Importance
Major Minor Minor Major Very Very
Class/Factors Advantage Advantage Challenge Challenge Important Important Unimportant Unimportant
Medical Support
perception of quality 1 (5%) 21 (96%) 0 (0%) 0 (0%) 9 (41%) 12 (55%) 1 (5%) 0 (0%)
stability of physician workforce 1 (5%) 17 (77%) 2 (9%) 2 (9%) 8 (36%) 14 (64%) 0 (0%) 0 (0%)
specialist availability 3 (14%) 9 (41%) 8 (36%) 2 (9%) 3 (14%) 19 (86%) 0 (0%) 0 (0%)
nursing workforce 0 (0%) 12 (55%) 10 (45%) 0 (0%) 5 (23%) 17 (77%) 0 (0%) 0 (0%)
mid-level provider workforce 2 (9%) 19 (86%) 1 (5%) 0 (0%) 1 (5%) 20 (91%) 1 (5%) 0 (0%)
ancillary staff workforce 2 (9%) 18 (82%) 2 (9%) 0 (0%) 1 (5%) 20 (91%) 1 (5%) 0 (0%)
pharmacy services 2 (9%) 10 (45%) 10 (45%) 0 (0%) 1 (5%) 17 (77%) 4 (18%) 0 (0%)
allied mental health workforce 3 (14%) 14 (64%) 4 (18%) 1 (5%) 10 (45%) 11 (50%) 1 (5%) 0 (0%)
language services support 4 (18%) 14 (64%) 4 (18%) 0 (0%) 2 (9%) 14 (64%) 6 (27%) 0 (0%)
call/practice coverage 11 (50%) 5 (23%) 2 (9%) 4 (18%) 19 (86%) 3 (14%) 0 (0%) 0 (0%)
Facility and Community Support
physical plant and equipment 3 (14%) 9 (41%) 10 (45%) 0 (0%) 3 (14%) 17 (77%) 2 (9%) 0 (0%)
plans for capital investment 1 (5%) 16 (73%) 5 (23%) 0 (0%) 1 (5%) 17 (77%) 4 (18%) 0 (0%)
electronic medical records 4 (18%) 8 (36%) 9 (41%) 1 (5%) 0 (0%) 22 (100%) 0 (0%) 0 (0%)
CHC leadership 2 (9%) 15 (68%) 5 (23%) 0 (0%) 2 (9%) 18 (82%) 2 (9%) 0 (0%)
televideo support 0 (0%) 5 (23%) 14 (64%) 3 (14%) 0 (0%) 5 (23%) 15 (68%) 2 (9%)
community need/support of physician 5 (23%) 14 (64%) 3 (14%) 0 (0%) 6 (27%) 16 (73%) 0 (0%) 0 (0%)
welcome and recruitment program 0 (0%) 13 (59%) 9 (41%) 0 (0%) 0 (0%) 21 (96%) 1 (5%) 0 (0%)
medical reference resources 1 (5%) 17 (77%) 4 (18%) 0 (0%) 2 (9%) 20 (91%) 0 (0%) 0 (0%)
delegated physician patient services 5 (23%) 8 (36%) 7 (32%) 2 (9%) 2 (9%) 20 (91%) 0 (0%) 0 (0%)
moonlighting opportunities 1 (5%) 17 (77%) 3 (14%) 1 (5%) 0 (0%) 12 (55%) 10 (45%) 0 (0%)
36
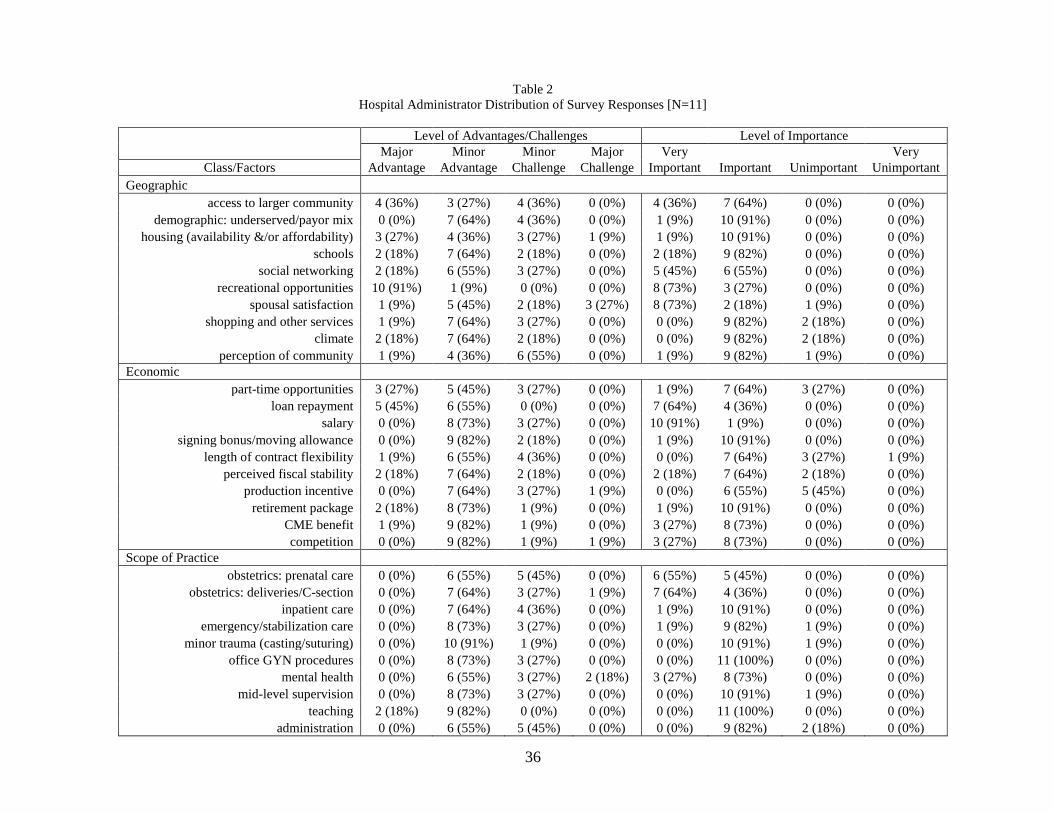
Table 2
Hospital Administrator Distribution of Survey Responses [N=11]
Level of Advantages/Challenges Level of Importance
Major Minor Minor Major Very Very
Class/Factors Advantage Advantage Challenge Challenge Important Important Unimportant Unimportant
Geographic
access to larger community 4 (36%) 3 (27%) 4 (36%) 0 (0%) 4 (36%) 7 (64%) 0 (0%) 0 (0%)
demographic: underserved/payor mix 0 (0%) 7 (64%) 4 (36%) 0 (0%) 1 (9%) 10 (91%) 0 (0%) 0 (0%)
housing (availability &/or affordability) 3 (27%) 4 (36%) 3 (27%) 1 (9%) 1 (9%) 10 (91%) 0 (0%) 0 (0%)
schools 2 (18%) 7 (64%) 2 (18%) 0 (0%) 2 (18%) 9 (82%) 0 (0%) 0 (0%)
social networking 2 (18%) 6 (55%) 3 (27%) 0 (0%) 5 (45%) 6 (55%) 0 (0%) 0 (0%)
recreational opportunities 10 (91%) 1 (9%) 0 (0%) 0 (0%) 8 (73%) 3 (27%) 0 (0%) 0 (0%)
spousal satisfaction 1 (9%) 5 (45%) 2 (18%) 3 (27%) 8 (73%) 2 (18%) 1 (9%) 0 (0%)
shopping and other services 1 (9%) 7 (64%) 3 (27%) 0 (0%) 0 (0%) 9 (82%) 2 (18%) 0 (0%)
climate 2 (18%) 7 (64%) 2 (18%) 0 (0%) 0 (0%) 9 (82%) 2 (18%) 0 (0%)
perception of community 1 (9%) 4 (36%) 6 (55%) 0 (0%) 1 (9%) 9 (82%) 1 (9%) 0 (0%)
Economic
part-time opportunities 3 (27%) 5 (45%) 3 (27%) 0 (0%) 1 (9%) 7 (64%) 3 (27%) 0 (0%)
loan repayment 5 (45%) 6 (55%) 0 (0%) 0 (0%) 7 (64%) 4 (36%) 0 (0%) 0 (0%)
salary 0 (0%) 8 (73%) 3 (27%) 0 (0%) 10 (91%) 1 (9%) 0 (0%) 0 (0%)
signing bonus/moving allowance 0 (0%) 9 (82%) 2 (18%) 0 (0%) 1 (9%) 10 (91%) 0 (0%) 0 (0%)
length of contract flexibility 1 (9%) 6 (55%) 4 (36%) 0 (0%) 0 (0%) 7 (64%) 3 (27%) 1 (9%)
perceived fiscal stability 2 (18%) 7 (64%) 2 (18%) 0 (0%) 2 (18%) 7 (64%) 2 (18%) 0 (0%)
production incentive 0 (0%) 7 (64%) 3 (27%) 1 (9%) 0 (0%) 6 (55%) 5 (45%) 0 (0%)
retirement package 2 (18%) 8 (73%) 1 (9%) 0 (0%) 1 (9%) 10 (91%) 0 (0%) 0 (0%)
CME benefit 1 (9%) 9 (82%) 1 (9%) 0 (0%) 3 (27%) 8 (73%) 0 (0%) 0 (0%)
competition 0 (0%) 9 (82%) 1 (9%) 1 (9%) 3 (27%) 8 (73%) 0 (0%) 0 (0%)
Scope of Practice
obstetrics: prenatal care 0 (0%) 6 (55%) 5 (45%) 0 (0%) 6 (55%) 5 (45%) 0 (0%) 0 (0%)
obstetrics: deliveries/C-section 0 (0%) 7 (64%) 3 (27%) 1 (9%) 7 (64%) 4 (36%) 0 (0%) 0 (0%)
inpatient care 0 (0%) 7 (64%) 4 (36%) 0 (0%) 1 (9%) 10 (91%) 0 (0%) 0 (0%)
emergency/stabilization care 0 (0%) 8 (73%) 3 (27%) 0 (0%) 1 (9%) 9 (82%) 1 (9%) 0 (0%)
minor trauma (casting/suturing) 0 (0%) 10 (91%) 1 (9%) 0 (0%) 0 (0%) 10 (91%) 1 (9%) 0 (0%)
office GYN procedures 0 (0%) 8 (73%) 3 (27%) 0 (0%) 0 (0%) 11 (100%) 0 (0%) 0 (0%)
mental health 0 (0%) 6 (55%) 3 (27%) 2 (18%) 3 (27%) 8 (73%) 0 (0%) 0 (0%)
mid-level supervision 0 (0%) 8 (73%) 3 (27%) 0 (0%) 0 (0%) 10 (91%) 1 (9%) 0 (0%)
teaching 2 (18%) 9 (82%) 0 (0%) 0 (0%) 0 (0%) 11 (100%) 0 (0%) 0 (0%)
administration 0 (0%) 6 (55%) 5 (45%) 0 (0%) 0 (0%) 9 (82%) 2 (18%) 0 (0%)

37
Table 2 (Cont.)
Hospital Administrator Distribution of Survey Responses [N=11]
Level of Advantages/Challenges Level of Importance
Major Minor Minor Major Very Very
Class/Factors Advantage Advantage Challenge Challenge Important Important Unimportant Unimportant
Medical Support
perception of quality 0 (0%) 11 (100%) 0 (0%) 0 (0%) 3 (27%) 7 (64%) 1 (9%) 0 (0%)
stability of physician workforce 1 (9%) 9 (82%) 0 (0%) 1 (9%) 5 (45%) 6 (55%) 0 (0%) 0 (0%)
specialist availability 2 (18%) 3 (27%) 6 (55%) 0 (0%) 1 (9%) 10 (91%) 0 (0%) 0 (0%)
nursing workforce 0 (0%) 6 (55%) 5 (45%) 0 (0%) 3 (27%) 8 (73%) 0 (0%) 0 (0%)
mid-level provider workforce 1 (9%) 10 (91%) 0 (0%) 0 (0%) 1 (9%) 10 (91%) 0 (0%) 0 (0%)
ancillary staff workforce 1 (9%) 10 (91%) 0 (0%) 0 (0%) 1 (9%) 10 (91%) 0 (0%) 0 (0%)
pharmacy services 1 (9%) 5 (45%) 5 (45%) 0 (0%) 0 (0%) 10 (91%) 1 (9%) 0 (0%)
allied mental health workforce 1 (9%) 8 (73%) 1 (9%) 1 (9%) 5 (45%) 5 (45%) 1 (9%) 0 (0%)
language services support 3 (27%) 5 (45%) 3 (27%) 0 (0%) 2 (18%) 6 (55%) 3 (27%) 0 (0%)
call/practice coverage 5 (45%) 4 (36%) 0 (0%) 2 (18%) 8 (73%) 3 (27%) 0 (0%) 0 (0%)
Facility and Community Support
physical plant and equipment 2 (18%) 4 (36%) 5 (45%) 0 (0%) 2 (18%) 7 (64%) 2 (18%) 0 (0%)
plans for capital investment 1 (9%) 8 (73%) 2 (18%) 0 (0%) 1 (9%) 8 (73%) 2 (18%) 0 (0%)
electronic medical records 2 (18%) 5 (45%) 4 (36%) 0 (0%) 0 (0%) 11 (100%) 0 (0%) 0 (0%)
CHC leadership 1 (9%) 9 (82%) 1 (9%) 0 (0%) 0 (0%) 10 (91%) 1 (9%) 0 (0%)
televideo support 0 (0%) 2 (18%) 7 (64%) 2 (18%) 0 (0%) 3 (27%) 7 (64%) 1 (9%)
community need/support of physician 3 (27%) 6 (55%) 2 (18%) 0 (0%) 2 (18%) 9 (82%) 0 (0%) 0 (0%)
welcome and recruitment program 0 (0%) 7 (64%) 4 (36%) 0 (0%) 0 (0%) 10 (91%) 1 (9%) 0 (0%)
medical reference resources 0 (0%) 9 (82%) 2 (18%) 0 (0%) 1 (9%) 10 (91%) 0 (0%) 0 (0%)
delegated physician patient services 2 (18%) 5 (45%) 4 (36%) 0 (0%) 0 (0%) 11 (100%) 0 (0%) 0 (0%)
moonlighting opportunities 1 (9%) 9 (82%) 1 (9%) 0 (0%) 0 (0%) 6 (55%) 5 (45%) 0 (0%)

38
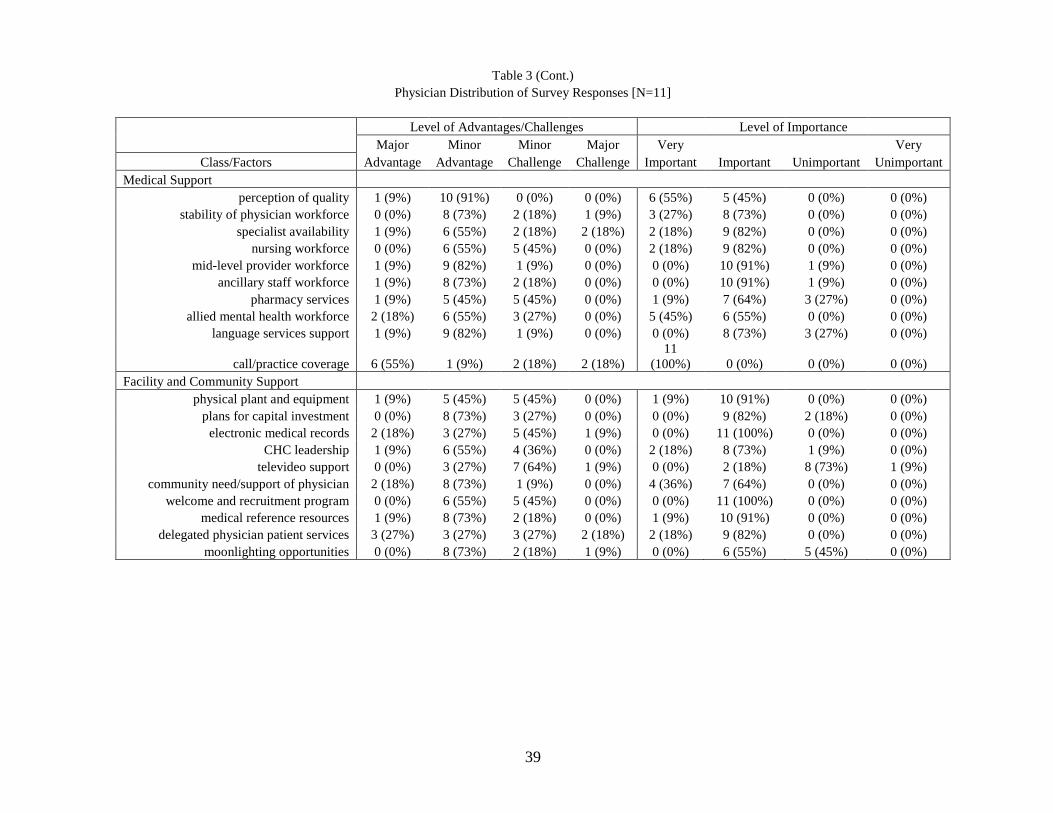
Table 3
Physician Distribution of Survey Responses [N=11]
Level of Advantages/Challenges Level of Importance
Major Minor Minor Major Very Very
Class/Factors Advantage Advantage Challenge Challenge Important Important Unimportant Unimportant
Geographic
access to larger community 4 (36%) 4 (36%) 3 (27%) 0 (0%) 3 (27%) 8 (73%) 0 (0%) 0 (0%)
demographic: underserved/payor mix 0 (0%) 6 (55%) 4 (36%) 1 (9%) 2 (18%) 8 (73%) 1 (9%) 0 (0%)
housing (availability &/or affordability) 3 (27%) 5 (45%) 2 (18%) 1 (9%) 3 (27%) 8 (73%) 0 (0%) 0 (0%)
schools 2 (18%) 8 (73%) 1 (9%) 0 (0%) 6 (55%) 5 (45%) 0 (0%) 0 (0%)
social networking 2 (18%) 3 (27%) 6 (55%) 0 (0%) 1 (9%) 10 (91%) 0 (0%) 0 (0%)
recreational opportunities 9 (82%) 2 (18%) 0 (0%) 0 (0%) 5 (45%) 6 (55%) 0 (0%) 0 (0%)
spousal satisfaction 0 (0%) 3 (27%) 7 (64%) 1 (9%) 8 (73%) 3 (27%) 0 (0%) 0 (0%)
shopping and other services 1 (9%) 8 (73%) 2 (18%) 0 (0%) 0 (0%) 9 (82%) 2 (18%) 0 (0%)
climate 2 (18%) 7 (64%) 2 (18%) 0 (0%) 0 (0%) 11 (100%) 0 (0%) 0 (0%)
perception of community 2 (18%) 3 (27%) 6 (55%) 0 (0%) 1 (9%) 10 (91%) 0 (0%) 0 (0%)
Economic
part-time opportunities 1 (9%) 5 (45%) 5 (45%) 0 (0%) 1 (9%) 7 (64%) 3 (27%) 0 (0%)
loan repayment 3 (27%) 7 (64%) 1 (9%) 0 (0%) 5 (45%) 6 (55%) 0 (0%) 0 (0%)
salary 1 (9%) 3 (27%) 5 (45%) 2 (18%) 8 (73%) 3 (27%) 0 (0%) 0 (0%)
signing bonus/moving allowance 0 (0%) 6 (55%) 4 (36%) 1 (9%) 1 (9%) 8 (73%) 2 (18%) 0 (0%)
length of contract flexibility 0 (0%) 8 (73%) 3 (27%) 0 (0%) 0 (0%) 7 (64%) 4 (36%) 0 (0%)
perceived fiscal stability 1 (9%) 10 (91%) 0 (0%) 0 (0%) 0 (0%) 10 (91%) 1 (9%) 0 (0%)
production incentive 0 (0%) 5 (45%) 5 (45%) 1 (9%) 1 (9%) 5 (45%) 5 (45%) 0 (0%)
retirement package 1 (9%) 10 (91%) 0 (0%) 0 (0%) 0 (0%) 10 (91%) 1 (9%) 0 (0%)
CME benefit 2 (18%) 8 (73%) 1 (9%) 0 (0%) 1 (9%) 9 (82%) 1 (9%) 0 (0%)
competition 2 (18%) 4 (36%) 5 (45%) 0 (0%) 6 (55%) 5 (45%) 0 (0%) 0 (0%)
Scope of Practice
obstetrics: prenatal care 1 (9%) 5 (45%) 5 (45%) 0 (0%) 7 (64%) 4 (36%) 0 (0%) 0 (0%)
obstetrics: deliveries/C-section 1 (9%) 6 (55%) 2 (18%) 2 (18%) 8 (73%) 3 (27%) 0 (0%) 0 (0%)
inpatient care 1 (9%) 6 (55%) 4 (36%) 0 (0%) 3 (27%) 8 (73%) 0 (0%) 0 (0%)
emergency/stabilization care 0 (0%) 9 (82%) 1 (9%) 1 (9%) 1 (9%) 10 (91%) 0 (0%) 0 (0%)
minor trauma (casting/suturing) 1 (9%) 10 (91%) 0 (0%) 0 (0%) 1 (9%) 10 (91%) 0 (0%) 0 (0%)
office GYN procedures 1 (9%) 6 (55%) 4 (36%) 0 (0%) 1 (9%) 10 (91%) 0 (0%) 0 (0%)
mental health 0 (0%) 2 (18%) 5 (45%) 4 (36%) 3 (27%) 7 (64%) 1 (9%) 0 (0%)
mid-level supervision 2 (18%) 6 (55%) 3 (27%) 0 (0%) 0 (0%) 10 (91%) 1 (9%) 0 (0%)
teaching 2 (18%) 6 (55%) 3 (27%) 0 (0%) 1 (9%) 9 (82%) 1 (9%) 0 (0%)
administration 0 (0%) 7 (64%) 4 (36%) 0 (0%) 0 (0%) 10 (91%) 1 (9%) 0 (0%)
39
Table 3 (Cont.)
Physician Distribution of Survey Responses [N=11]
Level of Advantages/Challenges Level of Importance
Major Minor Minor Major Very Very
Class/Factors Advantage Advantage Challenge Challenge Important Important Unimportant Unimportant
Medical Support
perception of quality 1 (9%) 10 (91%) 0 (0%) 0 (0%) 6 (55%) 5 (45%) 0 (0%) 0 (0%)
stability of physician workforce 0 (0%) 8 (73%) 2 (18%) 1 (9%) 3 (27%) 8 (73%) 0 (0%) 0 (0%)
specialist availability 1 (9%) 6 (55%) 2 (18%) 2 (18%) 2 (18%) 9 (82%) 0 (0%) 0 (0%)
nursing workforce 0 (0%) 6 (55%) 5 (45%) 0 (0%) 2 (18%) 9 (82%) 0 (0%) 0 (0%)
mid-level provider workforce 1 (9%) 9 (82%) 1 (9%) 0 (0%) 0 (0%) 10 (91%) 1 (9%) 0 (0%)
ancillary staff workforce 1 (9%) 8 (73%) 2 (18%) 0 (0%) 0 (0%) 10 (91%) 1 (9%) 0 (0%)
pharmacy services 1 (9%) 5 (45%) 5 (45%) 0 (0%) 1 (9%) 7 (64%) 3 (27%) 0 (0%)
allied mental health workforce 2 (18%) 6 (55%) 3 (27%) 0 (0%) 5 (45%) 6 (55%) 0 (0%) 0 (0%)
language services support 1 (9%) 9 (82%) 1 (9%) 0 (0%) 0 (0%) 8 (73%) 3 (27%) 0 (0%)
call/practice coverage 6 (55%) 1 (9%) 2 (18%) 2 (18%)
11
(100%) 0 (0%) 0 (0%) 0 (0%)
Facility and Community Support
physical plant and equipment 1 (9%) 5 (45%) 5 (45%) 0 (0%) 1 (9%) 10 (91%) 0 (0%) 0 (0%)
plans for capital investment 0 (0%) 8 (73%) 3 (27%) 0 (0%) 0 (0%) 9 (82%) 2 (18%) 0 (0%)
electronic medical records 2 (18%) 3 (27%) 5 (45%) 1 (9%) 0 (0%) 11 (100%) 0 (0%) 0 (0%)
CHC leadership 1 (9%) 6 (55%) 4 (36%) 0 (0%) 2 (18%) 8 (73%) 1 (9%) 0 (0%)
televideo support 0 (0%) 3 (27%) 7 (64%) 1 (9%) 0 (0%) 2 (18%) 8 (73%) 1 (9%)
community need/support of physician 2 (18%) 8 (73%) 1 (9%) 0 (0%) 4 (36%) 7 (64%) 0 (0%) 0 (0%)
welcome and recruitment program 0 (0%) 6 (55%) 5 (45%) 0 (0%) 0 (0%) 11 (100%) 0 (0%) 0 (0%)
medical reference resources 1 (9%) 8 (73%) 2 (18%) 0 (0%) 1 (9%) 10 (91%) 0 (0%) 0 (0%)
delegated physician patient services 3 (27%) 3 (27%) 3 (27%) 2 (18%) 2 (18%) 9 (82%) 0 (0%) 0 (0%)
moonlighting opportunities 0 (0%) 8 (73%) 2 (18%) 1 (9%) 0 (0%) 6 (55%) 5 (45%) 0 (0%)

40
Table 4
Geographic Class CHC Community Advantages and Challenges Mean Scores
Rank Ordered by Overall Score
Overall (1) Administrator Physician A Community B Community
Geographic Factors Score [N=22] Score [N=11] Score [N=11] p-value (2) Score [N=14] Score [N=8] p-value (3)
recreational opportunities 1.86 1.91 1.82 0.54 1.93 1.75 0.25
schools 0.91 0.82 1.00 0.72 1.00 0.75 0.28
climate 0.82 0.82 0.82 1.00 0.86 0.75 0.47
access to larger community 0.73 0.64 0.82 0.81 0.93 0.38 0.49
shopping and other services 0.64 0.55 0.73 0.69 1.00 0.00 0.02*
housing (availability &/or affordability) 0.55 0.45 0.64 0.81 0.93 -0.13 0.09
social networking 0.36 0.64 0.09 0.34 0.64 -0.13 0.17
demographic: underserved/payor mix 0.14 0.27 0.00 0.57 0.57 -0.63 0.01**
perception of community 0.05 0.00 0.09 0.85 -0.07 0.25 0.54
spousal satisfaction -0.32 -0.09 -0.55 0.55 0.07 -1.00 0.03*
(1) Higher scores indicate greater community advantage.
(2) Mann Whitney U statistical test employed to test for differences between administrator and physician scores.
(3) Mann Whitney U statistical test employed to test for differences between A and B community scores.
* Statistically significant at p≤ 0.05
** Statistically significant at p≤ 0.01

41
Table 5
Economic Class CHC Community Advantages and Challenges Mean Scores
Rank Ordered by Overall Score
Overall (1) Administrator Physician A Community B Community
Economic Factors Score [N=22] Score [N=11] Score [N=11] p-value (2) Score [N=14] Score [N=8] p-value (3)
loan repayment 1.27 1.45 1.09 0.29 1.29 1.25 0.58
retirement package 1.05 1.00 1.09 0.96 1.21 0.75 0.08
perceived fiscal stability 0.95 0.82 1.09 0.69 1.07 0.75 0.21
CME benefit 0.95 0.91 1.00 0.65 1.21 0.50 0.03*
part-time opportunities 0.45 0.73 0.18 0.26 0.64 0.13 0.34
length of contract flexibility 0.41 0.36 0.45 0.91 0.50 0.25 0.54
competition 0.41 0.55 0.27 0.71 0.57 0.13 0.35
signing bonus/moving allowance 0.32 0.64 0.00 0.16 0.57 -0.13 0.14
salary 0.05 0.45 -0.36 0.13 0.21 -0.25 0.39
production incentive 0.00 0.18 -0.18 0.46 -0.07 0.13 0.70
(1) Higher scores indicate greater community advantage.
(2) Mann Whitney U statistical test employed to test for differences between administrator and physician scores.
(3) Mann Whitney U statistical test employed to test for differences between A and B community scores.
* Statistically significant at p≤ 0.05
** Statistically significant at p≤ 0.01

42
Table 6
Scope of Practice Class CHC Community Advantages and Challenges Mean Scores
Rank Ordered by Overall Score
Overall (1) Administrator Physician A Community B Community
Scope of Practice Factors Score [N=22] Score [N=11] Score [N=11] p-value (2) Score [N=14] Score [N=8] p-value (3)
minor trauma (casting/suturing) 0.95 0.82 1.09 0.17 1.07 0.75 0.15
teaching 0.91 1.18 0.64 0.28 1.07 0.63 0.30
mid-level supervision 0.55 0.45 0.64 0.54 0.29 1.00 0.08
emergency/stabilization care 0.50 0.45 0.55 0.72 0.71 0.13 0.19
office GYN procedures 0.41 0.45 0.36 0.91 1.07 -0.75 < 0.001**
inpatient care 0.32 0.27 0.36 0.79 0.50 0.00 0.27
administration 0.18 0.09 0.27 0.67 0.14 0.25 0.81
obstetrics: deliveries/C-section 0.18 0.18 0.18 0.91 0.43 -0.25 0.22
obstetrics: prenatal care 0.14 0.09 0.18 0.82 0.21 0.00 0.64
mental health -0.55 -0.09 -1.00 0.11 -0.36 -0.88 0.35
(1) Higher scores indicate greater community advantage.
(2) Mann Whitney U statistical test employed to test for differences between administrator and physician scores.
(3) Mann Whitney U statistical test employed to test for differences between A and B community scores.
* Statistically significant at p≤ 0.05
** Statistically significant at p≤ 0.01

43
Table 7
Medical Support Class CHC Community Advantages and Challenges Mean Scores
Rank Ordered by Overall Score
Overall (1) Administrator Physician A Community B Community
Medical Support Factors Score [N=22] Score [N=11] Score [N=11] p-value (2) Score [N=14] Score [N=8] p-value (3)
perception of quality 1.05 1.00 1.09 0.32 1.07 1.00 0.45
mid-level provider workforce 1.00 1.09 0.91 0.58 1.00 1.00 0.65
ancillary staff workforce 0.91 1.09 0.73 0.33 1.00 0.75 0.31
language services support 0.82 0.73 0.91 1.00 0.93 0.63 0.47
call/practice coverage 0.77 0.91 0.64 0.97 1.50 -0.50 0.01**
allied mental health workforce 0.64 0.64 0.64 0.94 0.57 0.75 0.94
stability of physician workforce 0.59 0.82 0.36 0.21 0.79 0.25 0.31
pharmacy services 0.18 0.18 0.18 1.00 0.29 0.00 0.54
specialist availability 0.14 0.09 0.18 0.97 0.36 -0.25 0.33
nursing workforce 0.09 0.09 0.09 1.00 0.14 0.00 0.75
(1) Higher scores indicate greater community advantage.
(2) Mann Whitney U statistical test employed to test for differences between administrator and physician scores.
(3) Mann Whitney U statistical test employed to test for differences between A and B community scores.
* Statistically significant at p≤ 0.05
** Statistically significant at p≤ 0.01

44
Table 8
Facility and Community Support Class CHC Community Advantages and Challenges Mean Scores
Rank Ordered by Overall Score
Overall Administrator Physician A Community B Community
Facility and Community Support Factors Score [N=22] Score [N=11] Score [N=11] p-value (2) Score [N=14] Score [N=8] p-value (3)
community need/support of physician 0.95 0.91 1.00 0.97 1.14 0.63 0.22
medical reference resources 0.68 0.64 0.73 0.69 0.93 0.25 0.07
CHC leadership 0.64 0.91 0.36 0.23 0.86 0.25 0.13
moonlighting opportunities 0.64 0.91 0.36 0.16 0.57 0.75 0.85
plans for capital investment 0.59 0.73 0.45 0.42 1.07 -0.25 0.001**
delegated physician patient services 0.32 0.45 0.18 0.73 1.00 -0.88 0.003**
electronic medical records 0.23 0.45 0.00 0.44 0.43 -0.13 0.27
physical plant and equipment 0.23 0.27 0.18 0.83 0.50 -0.25 0.20
welcome and recruitment program 0.18 0.27 0.09 0.67 0.29 0.00 0.52
televideo support -0.68 -0.82 -0.55 0.49 -0.50 -1.00 0.52
(1) Higher scores indicate greater community advantage.
(2) Mann Whitney U statistical test employed to test for differences between administrator and physician scores.
(3) Mann Whitney U statistical test employed to test for differences between A and B community scores.
* Statistically significant at p≤ 0.05
** Statistically significant at p≤ 0.01

45
Table 9
Class CHC Community Advantages and Challenges Mean Scores
Rank Ordered by Summary Score
Overall Administrator Physician A Community B Community
Survey Classes Score [N=22] Score [N=11] Score [N=11] p-value (2) Score [N=14] Score [N=8] p-value (3)
Medical Support 6.18 6.64 5.73 0.29 7.64 3.63 0.10
Economic 5.86 7.09 4.64 0.09 7.21 3.50 0.04*
Geographic 5.73 6.00 5.45 0.64 7.86 2.00 0.05*
Facility and Community Support 3.77 4.73 2.82 0.34 6.29 -0.63 <0.001**
Scope of Practice 3.59 3.91 3.27 0.72 5.14 0.88 0.05*
Sum of Mean Scores Across Classes 25.14 28.36 21.91 0.37 34.14 9.38 0.001**
(1) Higher scores indicate greater community advantage.
(2) Mann Whitney U statistical test employed to test for differences between administrator and physician scores.
(3) Mann Whitney U statistical test employed to test for differences between A and B community scores.
* Statistically significant at p≤ 0.05
** Statistically significant at p≤ 0.01

46
Table 10
Geographic Class CHC Community Importance Mean Scores
Rank Ordered by Overall Score
Overall (1) Administrator Physician A Community B Community
Geographic Factors Score [N=22] Score [N=11] Score [N=11] p-value (2) Score [N=14] Score [N=8] p-value (3)
spousal satisfaction 3.68 3.64 3.73 0.90 3.57 3.88 0.24
recreational opportunities 3.59 3.73 3.45 0.20 3.43 3.88 0.05*
schools 3.36 3.18 3.55 0.08 3.43 3.25 0.41
access to larger community 3.32 3.36 3.27 0.65 3.29 3.38 0.67
social networking 3.27 3.45 3.09 0.06 3.14 3.50 0.08
housing (availability &/or affordability) 3.18 3.09 3.27 0.28 3.07 3.38 0.08
demographic: underserved/payor mix 3.09 3.09 3.09 0.96 3.21 2.88 0.08
perception of community 3.05 3.00 3.09 0.58 3.07 3.00 0.65
climate 2.91 2.82 3.00 0.15 2.93 2.88 0.68
shopping and other services 2.82 2.82 2.82 1.00 2.71 3.00 0.10
(1) Higher scores indicate greater community importance.
(2) Mann Whitney U statistical test employed to test for differences between administrator and physician scores.
(3) Mann Whitney U statistical test employed to test for differences between A and B community scores.
* Statistically significant at p≤ 0.05
** Statistically significant at p≤ 0.01
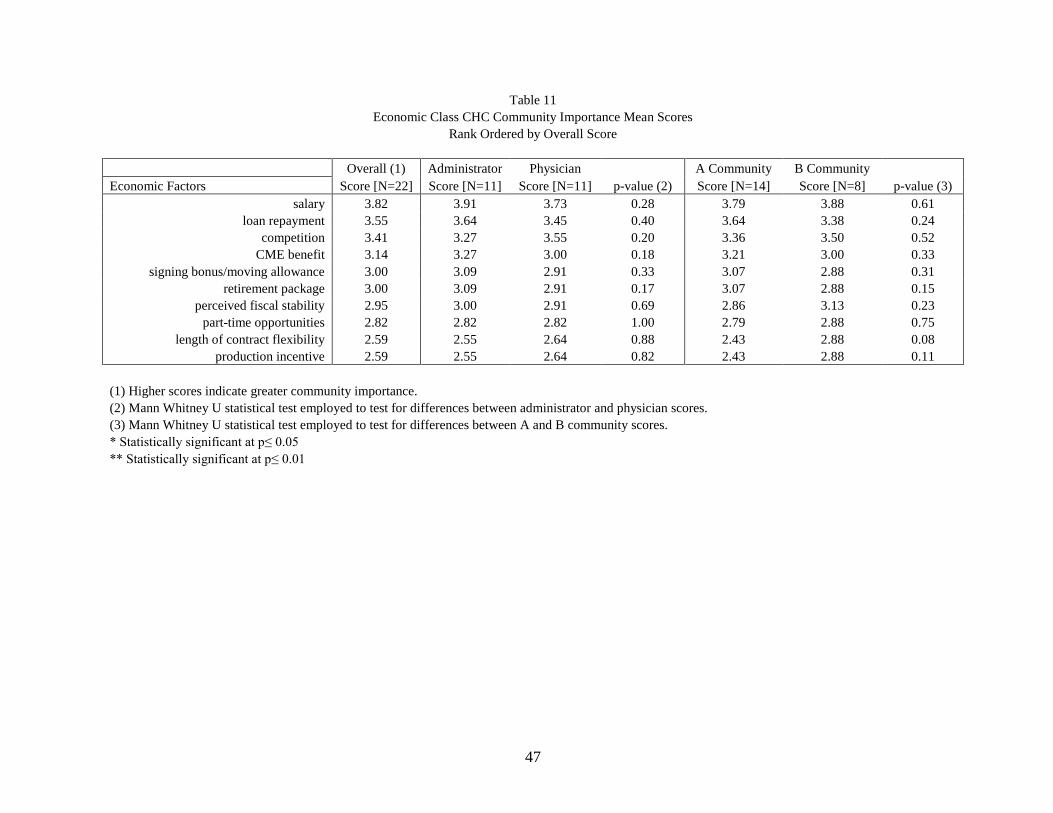
47
Table 11
Economic Class CHC Community Importance Mean Scores
Rank Ordered by Overall Score
Overall (1) Administrator Physician A Community B Community
Economic Factors Score [N=22] Score [N=11] Score [N=11] p-value (2) Score [N=14] Score [N=8] p-value (3)
salary 3.82 3.91 3.73 0.28 3.79 3.88 0.61
loan repayment 3.55 3.64 3.45 0.40 3.64 3.38 0.24
competition 3.41 3.27 3.55 0.20 3.36 3.50 0.52
CME benefit 3.14 3.27 3.00 0.18 3.21 3.00 0.33
signing bonus/moving allowance 3.00 3.09 2.91 0.33 3.07 2.88 0.31
retirement package 3.00 3.09 2.91 0.17 3.07 2.88 0.15
perceived fiscal stability 2.95 3.00 2.91 0.69 2.86 3.13 0.23
part-time opportunities 2.82 2.82 2.82 1.00 2.79 2.88 0.75
length of contract flexibility 2.59 2.55 2.64 0.88 2.43 2.88 0.08
production incentive 2.59 2.55 2.64 0.82 2.43 2.88 0.11
(1) Higher scores indicate greater community importance.
(2) Mann Whitney U statistical test employed to test for differences between administrator and physician scores.
(3) Mann Whitney U statistical test employed to test for differences between A and B community scores.
* Statistically significant at p≤ 0.05
** Statistically significant at p≤ 0.01

48
Table 12
Scope of Practice Class CHC Community Importance Mean Scores
Rank Ordered by Overall Score
Overall (1) Administrator Physician A Community B Community
Scope of Practice Factors Score [N=22] Score [N=11] Score [N=11] p-value (2) Score [N=14] Score [N=8] p-value (3)
obstetrics: deliveries/C-section 3.68 3.64 3.73 0.65 3.79 3.50 0.18
obstetrics: prenatal care 3.59 3.55 3.64 0.67 3.71 3.38 0.13
mental health 3.23 3.27 3.18 0.75 3.29 3.13 0.43
inpatient care 3.18 3.09 3.27 0.28 3.21 3.13 0.61
emergency/stabilization care 3.05 3.00 3.09 0.58 2.93 3.25 0.05*
office GYN procedures 3.05 3.00 3.09 0.32 3.07 3.00 0.45
minor trauma (casting/suturing) 3.00 2.91 3.09 0.17 3.00 3.00 1.00
teaching 3.00 3.00 3.00 1.00 3.00 3.00 1.00
mid-level supervision 2.91 2.91 2.91 1.00 2.93 2.88 0.68
administration 2.86 2.82 2.91 0.54 2.86 2.88 0.91
(1) Higher scores indicate greater community importance.
(2) Mann Whitney U statistical test employed to test for differences between administrator and physician scores.
(3) Mann Whitney U statistical test employed to test for differences between A and B community scores.
* Statistically significant at p≤ 0.05
** Statistically significant at p≤ 0.01

49
Table 13
Medical Support Class CHC Community Importance Mean Scores
Rank Ordered by Overall Score
Overall (1) Administrator Physician A Community B Community
Medical Support Factors Score [N=22] Score [N=11] Score [N=11] p-value (2) Score [N=14] Score [N=8] p-value (3)
call/practice coverage 3.86 3.73 4.00 0.07 3.79 4.00 0.17
allied mental health workforce 3.41 3.36 3.45 0.82 3.64 3.00 0.02*
stability of physician workforce 3.36 3.45 3.27 0.39 3.36 3.38 0.93
perception of quality 3.36 3.18 3.55 0.16 3.36 3.38 0.97
nursing workforce 3.23 3.27 3.18 0.62 3.29 3.13 0.40
specialist availability 3.14 3.09 3.18 0.54 3.14 3.13 0.91
mid-level provider workforce 3.00 3.09 2.91 0.17 3.00 3.00 1.00
ancillary staff workforce 3.00 3.09 2.91 0.17 3.00 3.00 1.00
pharmacy services 2.86 2.91 2.82 0.59 2.86 2.88 0.89
language services support 2.82 2.91 2.73 0.54 2.86 2.75 0.75
(1) Higher scores indicate greater community importance.
(2) Mann Whitney U statistical test employed to test for differences between administrator and physician scores.
(3) Mann Whitney U statistical test employed to test for differences between A and B community scores.
* Statistically significant at p≤ 0.05
** Statistically significant at p≤ 0.01

50
Table 14
Facility and Community Support Class CHC Community Importance Mean Scores
Rank Ordered by Overall Score
Overall (1) Administrator Physician A Community B Community
Facility and Community Support Factors Score [N=22] Score [N=11] Score [N=11] p-value (2) Score [N=14] Score [N=8] p-value (3)
community need/support of physician 3.27 3.18 3.36 0.35 3.14 3.50 0.08
medical reference resources 3.09 3.09 3.09 1.00 3.07 3.13 0.68
delegated physician patient services 3.09 3.00 3.18 0.15 3.14 3.00 0.27
physical plant and equipment 3.05 3.00 3.09 0.69 3.07 3.00 0.74
electronic medical records 3.00 3.00 3.00 1.00 3.00 3.00 1.00
CHC leadership 3.00 2.91 3.09 0.33 2.93 3.13 0.31
welcome and recruitment program 2.95 2.91 3.00 0.32 2.93 3.00 0.45
plans for capital investment 2.86 2.91 2.82 0.69 2.86 2.88 0.89
moonlighting opportunities 2.55 2.55 2.55 1.00 2.71 2.25 0.04*
televideo support 2.14 2.18 2.09 0.69 2.07 2.25 0.43
(1) Higher scores indicate greater community importance.
(2) Mann Whitney U statistical test employed to test for differences between administrator and physician scores.
(3) Mann Whitney U statistical test employed to test for differences between A and B community scores.
* Statistically significant at p≤ 0.05
** Statistically significant at p≤ 0.01

51
Table 15
Class Community Importance Mean Scores
Rank Ordered by Summary Score
Overall (1) Administrator Physician A Community B Community
Survey Factors Score [N=22] Score [N=11] Score [N=11] p-value (2) Score [N=14] Score [N=8] p-value (3)
Geographic 32.27 32.18 32.36 0.89 31.86 33.00 0.05*
Medical Support 32.05 32.09 32.00 0.79 32.29 31.63 0.53
Scope of Practice 31.55 31.18 31.91 0.44 31.79 31.13 0.40
Economic 30.86 31.18 30.55 0.56 30.64 31.25 0.34
Facility and Community Support 29.00 28.73 29.27 0.44 28.93 29.13 0.60
Sum of Mean Scores Across Classes 155.73 155.36 156.09 0.37 155.50 156.13 0.78
(1) Higher scores indicate greater community importance.
(2) Mann Whitney U statistical test employed to test for differences between administrator and physician scores.
(3) Mann Whitney U statistical test employed to test for differences between A and B community scores.
* Statistically significant at p≤ 0.05
** Statistically significant at p≤ 0.01

52
Table 16
Geographic Class CHC Community Apgar Mean Scores
Rank Ordered by Overall Score
Overall (1) Administrator Physician A Community B Community
Geographic Factors Score [N=22] Score [N=11] Score [N=11] p-value (2) Score [N=14] Score [N=8] p-value (3)
recreational opportunities 6.73 7.09 6.36 0.34 6.64 6.88 0.38
schools 3.18 2.73 3.64 0.22 3.57 2.50 0.17
access to larger community 2.64 2.55 2.73 0.87 3.36 1.38 0.42
climate 2.36 2.27 2.45 0.61 2.50 2.13 0.50
shopping and other services 1.77 1.64 1.91 0.77 2.79 0.00 0.05*
housing (availability &/or affordability) 1.64 1.18 2.09 0.66 2.93 -0.63 0.12
social networking 1.23 2.00 0.45 0.70 2.21 -0.50 0.09
demographic: underserved/payor mix 0.41 0.73 0.09 0.86 1.64 -1.75 0.04*
perception of community 0.18 0.00 0.36 0.75 -0.14 0.75 0.61
spousal satisfaction -1.45 -0.64 -2.27 0.36 0.07 -4.13 0.03*
(1) Higher scores indicate greater community assets and capabilities
(2) Mann Whitney U statistical test employed to test for differences between administrator and physician scores.
(3) Mann Whitney U statistical test employed to test for differences between A and B community scores.
* Statistically significant at p≤ 0.05
** Statistically significant at p≤ 0.01

53
Table 17
Economic Class CHC Community Apgar Mean Scores
Rank Ordered by Overall Score
Overall (1) Administrator Physician A Community B Community
Economic Factors Score [N=22] Score [N=11] Score [N=11] p-value (2) Score [N=14] Score [N=8] p-value (3)
loan repayment 4.50 5.27 3.73 0.14 4.71 4.13 0.46
retirement package 3.14 3.09 3.18 0.45 3.71 2.13 0.02*
CME benefit 3.09 2.91 3.27 0.93 4.00 1.50 0.02*
perceived fiscal stability 2.64 2.18 3.09 0.78 2.93 2.13 0.28
part-time opportunities 1.73 2.45 1.00 0.37 2.21 0.88 0.37
competition 1.27 1.64 0.91 0.92 1.86 0.25 0.52
length of contract flexibility 1.27 1.18 1.36 0.81 1.50 0.88 0.97
signing bonus/moving allowance 1.05 2.00 0.09 0.14 1.79 -0.25 0.14
production incentive 0.23 0.73 -0.27 0.44 0.00 0.63 0.62
salary 0.23 1.73 -1.27 0.13 1.00 -1.13 0.24
(1) Higher scores indicate greater community assets and capabilities
(2) Mann Whitney U statistical test employed to test for differences between administrator and physician scores.
(3) Mann Whitney U statistical test employed to test for differences between A and B community scores.
* Statistically significant at p≤ 0.05
** Statistically significant at p≤ 0.01

54
Table 18
Scope of Practice Class CHC Community Apgar Mean Scores
Rank Ordered by Overall Score
Overall (1) Administrator Physician A Community B Community
Scope of Practice Factors Score [N=22] Score [N=11] Score [N=11] p-value (2) Score [N=14] Score [N=8] p-value (3)
minor trauma (casting/suturing) 2.91 2.36 3.45 0.09 3.29 2.25 0.42
teaching 2.86 3.55 2.18 0.32 3.43 1.88 0.25
mid-level supervision 1.64 1.45 1.82 0.85 0.79 3.13 0.04*
emergency/stabilization care 1.32 1.18 1.45 0.45 2.07 0.00 0.28
office GYN procedures 1.32 1.36 1.27 0.91 3.36 -2.25 <0.001**
inpatient care 1.00 0.91 1.09 0.80 1.64 -0.13 0.23
obstetrics: deliveries/C-section 0.68 0.55 0.82 0.54 1.64 -1.00 0.18
obstetrics: prenatal care 0.59 0.27 0.91 0.50 0.86 0.13 0.78
administration 0.59 0.45 0.73 0.91 0.43 0.88 0.59
mental health -1.68 -0.27 -3.09 0.16 -1.21 -2.50 0.53
(1) Higher scores indicate greater community assets and capabilities
(2) Mann Whitney U statistical test employed to test for differences between administrator and physician scores.
(3) Mann Whitney U statistical test employed to test for differences between A and B community scores.
* Statistically significant at p≤ 0.05
** Statistically significant at p≤ 0.01

55
Table 19
Medical Support Class CHC Community Apgar Mean Scores
Rank Ordered by Overall Score
Overall (1) Administrator Physician A Community B Community
Medical Support Factors Score [N=22] Score [N=11] Score [N=11] p-value (2) Score [N=14] Score [N=8] p-value (3)
perception of quality 3.55 3.18 3.91 0.13 3.64 3.38 0.88
mid-level provider workforce 3.00 3.36 2.64 0.21 3.00 3.00 0.71
call/practice coverage 2.91 3.27 2.55 0.76 5.71 -2.00 0.02*
ancillary staff workforce 2.86 3.45 2.27 0.31 3.21 2.25 0.29
language services support 2.55 2.45 2.64 0.78 2.93 1.88 0.61
allied mental health workforce 2.23 2.27 2.18 0.70 2.07 2.50 0.64
stability of physician workforce 2.05 2.73 1.36 0.39 2.79 0.75 0.38
pharmacy services 0.82 0.64 1.00 0.70 1.21 0.13 0.42
specialist availability 0.59 0.45 0.73 0.84 1.29 -0.63 0.41
nursing workforce 0.23 0.18 0.27 0.86 0.43 -0.13 0.61
(1) Higher scores indicate greater community assets and capabilities
(2) Mann Whitney U statistical test employed to test for differences between administrator and physician scores.
(3) Mann Whitney U statistical test employed to test for differences between A and B community scores.
* Statistically significant at p≤ 0.05
** Statistically significant at p≤ 0.01

56
Table 20
Facility and Community Support Class CHC Community Apgar Mean Scores
Rank Ordered by Overall Score
Overall (1) Administrator Physician A Community B Community
Facility and Community Support Factors Score [N=22] Score [N=11] Score [N=11] p-value (2) Score [N=14] Score [N=8] p-value (3)
community need/support of physician 3.09 3.00 3.18 0.86 3.57 2.25 0.47
medical reference resources 2.14 2.00 2.27 0.69 2.86 0.88 0.18
CHC leadership 1.95 2.82 1.09 0.11 2.71 0.63 0.17
moonlighting opportunities 1.73 2.45 1.00 0.36 1.71 1.75 0.24
plans for capital investment 1.68 2.00 1.36 0.37 3.00 -0.63 0.007**
delegated physician patient services 1.14 1.36 0.91 0.84 3.29 -2.63 0.003**
physical plant and equipment 1.00 1.36 0.64 0.63 1.79 -0.38 0.18
electronic medical records 0.68 1.36 0.00 0.44 1.29 -0.38 0.27
welcome and recruitment program 0.59 0.91 0.27 0.54 0.93 0.00 0.43
televideo support -1.50 -1.82 -1.18 0.37 -1.07 -2.25 0.46
(1) Higher scores indicate greater community assets and capabilities
(2) Mann Whitney U statistical test employed to test for differences between administrator and physician scores.
(3) Mann Whitney U statistical test employed to test for differences between A and B community scores.
* Statistically significant at p≤ 0.05
** Statistically significant at p≤ 0.01

57
Table 21
Class CHC Community Apgar Mean Scores
Rank Ordered by Overall Score
Overall (1) Administrator Physician A Community B Community
Survey Classes Score [N=22] Score [N=11] Score [N=11] p-value (2) Score [N=14] Score [N=8] p-value (3)
Medical Support 20.77 22.00 19.55 0.34 26.29 11.13 0.09
Economic 19.14 23.18 15.09 0.11 23.71 11.13 0.01**
Geographic 18.68 19.55 17.82 0.69 25.57 6.63 0.04*
Facility and Community Support 12.50 15.45 9.55 0.32 20.07 -0.75 0.001**
Scope of Practice 11.23 11.82 10.64 0.77 16.29 2.38 0.05*
Sum of Mean Scores Across Classes 82.32 92.00 72.64 0.45 111.93 30.50 0.001**
(1) Higher scores indicate greater community assets and capabilities
(2) Mann Whitney U statistical test employed to test for differences between administrator and physician scores.
(3) Mann Whitney U statistical test employed to test for differences between A and B community scores.
* Statistically significant at p≤ 0.05
** Statistically significant at p≤ 0.01
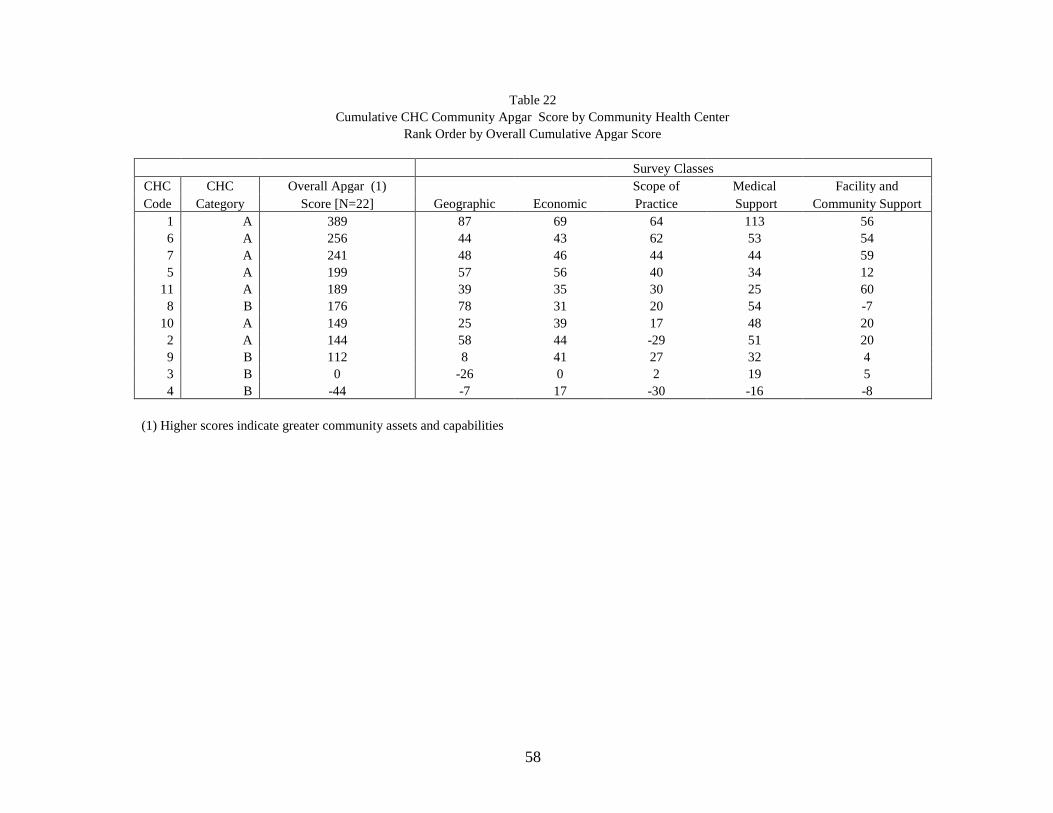
58
Table 22
Cumulative CHC Community Apgar Score by Community Health Center
Rank Order by Overall Cumulative Apgar Score
Survey Classes
CHC CHC Overall Apgar (1)
Geographic Economic
Scope of Medical Facility and
Code Category Score [N=22] Practice Support Community Support
1 A 389 87 69 64 113 56
6 A 256 44 43 62 53 54
7 A 241 48 46 44 44 59
5 A 199 57 56 40 34 12
11 A 189 39 35 30 25 60
8 B 176 78 31 20 54 -7
10 A 149 25 39 17 48 20
2 A 144 58 44 -29 51 20
9 B 112 8 41 27 32 4
3 B 0 -26 0 2 19 5
4 B -44 -7 17 -30 -16 -8
(1) Higher scores indicate greater community assets and capabilities

59
Figures
Figure 1: Geographic Class CHC Community Advantages/Challenges Mean Score: Administrator vs.
Physician
Figure 2: Geographic Class CHC Community Advantages/Challenges Mean Score: A Community vs. B
Community
Figure 3: Economic Class CHC Community Advantages/Challenges Mean Score: Administrator vs.
Physician
Figure 4: Economic Class CHC Community Advantages/Challenges Mean Score: A Community vs. B
Community
Figure 5: Scope of Practice Class CHC Community Advantages/Challenges Mean Score: Administrator
vs. Physician
Figure 6: Scope of Practice Class CHC Community Advantages/Challenges Mean Score: A Community
vs. B Community
Figure 7: Medical Support Class CHC Community Advantages/Challenges Mean Score: Administrator
vs. Physician
Figure 8: Medical Support Class CHC Community Advantages/Challenges Mean Score: A Community
vs. B Community
Figure 9: Facility and Community Support Class CHC Community Advantages/Challenges Mean
Score: Administrator vs. Physician
Figure 10: Facility and Community Support Class CHC Community Advantages/Challenges Mean
Score: A Community vs. B Community
Figure 11: Class CHC Community Advantages and Challenges Mean Score: Administrator vs. Physician
Figure 12: Class CHC Community Advantages and Challenges Mean Score: A Community vs. B
Community
Figure 13: Summary Class CHC Community Advantages and Challenges Mean Scores: Overall by
Respondent and Community Type

60
Figures (Cont.)
Figure 14: Geographic Class CHC Community Importance Mean Score: Administrator vs. Physician
Figure 15: Geographic Class CHC Community Importance Mean Score: A Community vs. B
Community
Figure 16: Economic Class CHC Community Importance Mean Score: Administrator vs. Physician
Figure 17: Economic Class CHC Community Importance Mean Score: A Community vs. B Community
Figure 18: Scope of Practice Class CHC Community Importance Mean Score: Administrator vs.
Physician
Figure 19: Scope of Practice Class CHC Community Importance Mean Score: A Community vs. B
Community
Figure 20: Medical Support Class CHC Community Importance Mean Score: Administrator vs.
Physician
Figure 21: Medical Support Class CHC Community Importance Mean Score: A Community vs. B
Community
Figure 22: Facility and Community Support CHC Class Community Importance Mean Score:
Administrator vs. Physician
Figure 23: Facility and Community Support CHC Class Community Importance Mean Score: A
Community vs. B Community
Figure 24: Class CHC Community Importance Mean Score: Administrator vs. Physician
Figure 25: Class CHC Community Importance Mean Score: A Community vs. B Community
Figure 26: Summary Class CHC Community Importance Mean Score: Overall by Respondent and
Community Type
Figure 27: Geographic Class CHC Community Apgar Mean Score: Administrator vs. Physician
Figure 28: Geographic Class CHC Community Apgar Mean Score: A Community vs. B Community
Figure 29: Economic Class CHC Community Apgar Mean Score: Administrator vs. Physician
Figure 30: Economic Class CHC Community Apgar Mean Score: A Community vs. B Community
Figure 31: Scope of Practice Class CHC Community Apgar Mean Score: Administrator vs. Physician

61
Figures (Cont.)
Figure 32: Scope of Practice Class CHC Community Apgar Mean Score: A Community vs. B
Community
Figure 33: Medical Support Class CHC Community Apgar Mean Score: Administrator vs. Physician
Figure 34: Medical Support Class CHC Community Apgar Mean Score: A Community vs. B
Community
Figure 35: Facility and Community Support Class CHC Community Apgar Mean Score: Administrator
vs. Physician
Figure 36: Facility and Community Support Class CHC Community Apgar Mean Score: A Community
vs. B Community
Figure 37: Class CHC Community Apgar Mean Score: Administrator vs. Physician
Figure 38: Class CHC Community Apgar Mean Score: A Community vs. B Community
Figure 39: Summary Class CHC Community Apgar Mean Score: Overall by Respondent and
Community Type
Figure 40: Cumulative CHC Community Apgar Score by Community Health Center

62
-2.00
-1.50
-1.00
-0.50
0.00
0.50
1.00
1.50
2.00
Mea
n S
core
recreational
opportunities
schools climate access to larger
community
shopping and
other services
housing
(availability
&/or
affordability)
social
networking
demographic:
underserved
/payor mix
perception of
community
spousal
satisfaction
Geographic Factor
Figure 1
Geographic Class CHC Community Advantages/Challenges Mean Score
Administrator vs. Physician
Overall Administrator Physician

63
-2.00
-1.50
-1.00
-0.50
0.00
0.50
1.00
1.50
2.00
Mea
n S
core
recreational
opportunities
schools climate access to larger
community
shopping and
other services
housing
(availability
&/or
affordability)
social
networking
demographic:
underserved
/payor mix
perception of
community
spousal
satisfaction
Geographic Factor
Figure 2
Geographic Class CHC Community Advantages/Challenges Mean Score
A Community vs. B Community
Overall A Community B Community
p = 0.02
p = 0.01
p = 0.03

64
-2.0
-1.5
-1.0
-0.5
0.0
0.5
1.0
1.5
2.0
Mea
n S
core
loan repayment retirement
package
perceived fiscal
stability
CME benefit part-time
opportunities
length of
contract
flexibility
competition signing
bonus/moving
allowance
salary production
incentive
Economic Factor
Figure 3
Economic Class CHC Community Advantages and Challenges Mean Score
Administrator vs. Physician
Overall Administrator Physician

65
-2.0
-1.5
-1.0
-0.5
0.0
0.5
1.0
1.5
2.0
Mea
n S
core
loan repayment retirement
package
perceived fiscal
stability
CME benefit part-time
opportunities
length of
contract
flexibility
competition signing
bonus/moving
allowance
salary production
incentive
Economic Factor
Figure 4
Economic Class CHC Community Advantages and Challenges Mean Score
A Community vs. B Community
Overall A Community B Community
p = 0.03

66
-2.0
-1.5
-1.0
-0.5
0.0
0.5
1.0
1.5
2.0
Mea
n S
core
minor trauma
(casting/
suturing)
teaching mid-level
supervision
emergency/
stabilization
care
office GYN
procedures
inpatient care administration obstetrics:
deliveries/ C-
section
obstetrics:
prenatal care
mental health
Scope of Practice Factor
Figure 5
Scope of Practice Class CHC Community Advantages and Challenges Mean Score
Administrator vs. Physician
Overall Administrator Physician

67
-2.0
-1.5
-1.0
-0.5
0.0
0.5
1.0
1.5
2.0
Mea
n S
core
minor trauma
(casting/
suturing)
teaching mid-level
supervision
emergency/
stabilization
care
office GYN
procedures
inpatient care administration obstetrics:
deliveries/ C-
section
obstetrics:
prenatal care
mental health
Scope of Practice Factor
Figure 6
Scope of Practice Class CHC Community Advantages and Challenges Mean Score
A Community vs. B Community
Overall A Community B Community
p < 0.001

68
-2.0
-1.5
-1.0
-0.5
0.0
0.5
1.0
1.5
2.0
Mea
n S
core
perception of
quality
mid-level
provider
workforce
ancillary staff
workforce
language
services support
call/practice
coverage
allied mental
health
workforce
stability of
physician
workforce
pharmacy
services
specialist
availability
nursing
workforce
Medical Support Factor
Figure 7
Medical Support Class CHC Community Advantages and Challenges Mean Score
Administrator vs. Physician
Overall Administrator Physician
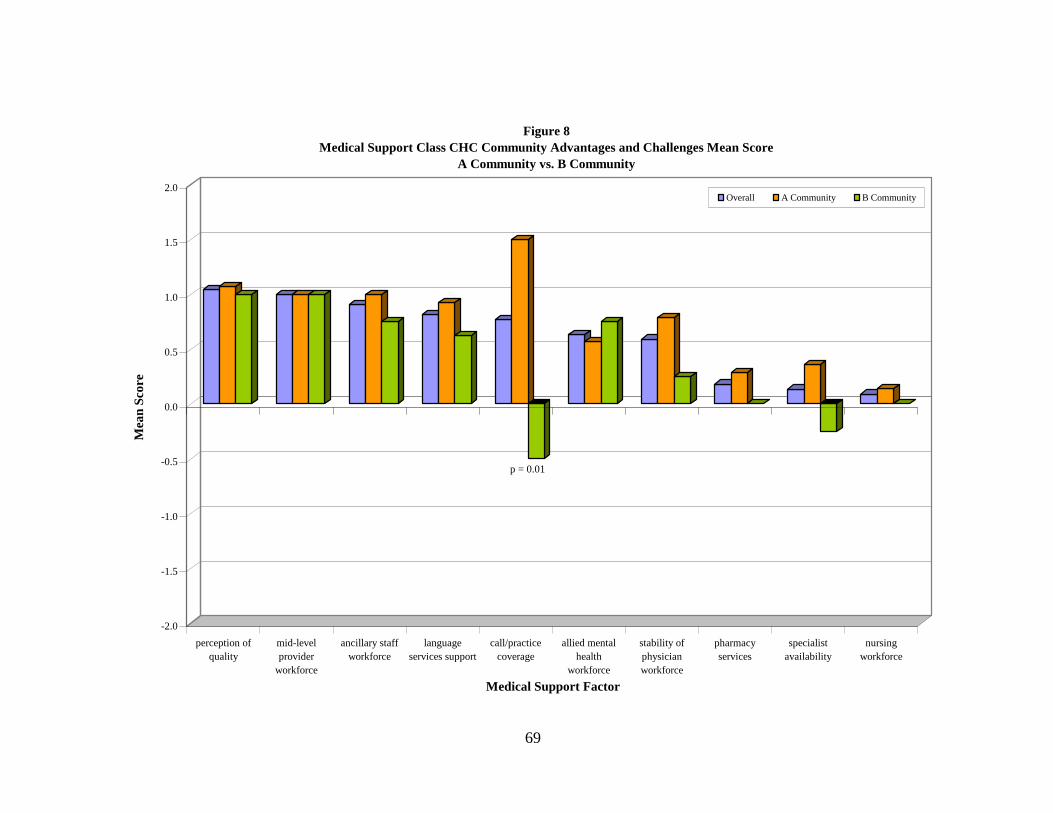
69
-2.0
-1.5
-1.0
-0.5
0.0
0.5
1.0
1.5
2.0
Mea
n S
core
perception of
quality
mid-level
provider
workforce
ancillary staff
workforce
language
services support
call/practice
coverage
allied mental
health
workforce
stability of
physician
workforce
pharmacy
services
specialist
availability
nursing
workforce
Medical Support Factor
Figure 8
Medical Support Class CHC Community Advantages and Challenges Mean Score
A Community vs. B Community
Overall A Community B Community
p = 0.01

70
-2.0
-1.5
-1.0
-0.5
0.0
0.5
1.0
1.5
2.0
Mea
n S
core
community
need/support of
physician
medical
reference
resources
CHC leadership moonlighting
opportunities
plans for capital
investment
delegated
physician
patient services
electronic
medical records
physical plant
and equipment
welcome and
recruitment
program
televideo
support
Facility and Community Support Factor
Figure 9
Facility and Community Support Class CHC Community Advantages and Challenges Mean Score
Administrator vs. Physician
Overall Administrator Physician

71
-2.0
-1.5
-1.0
-0.5
0.0
0.5
1.0
1.5
2.0
Mea
n S
core
community
need/support of
physician
medical
reference
resources
CHC leadership moonlighting
opportunities
plans for capital
investment
delegated
physician
patient services
electronic
medical records
physical plant
and equipment
welcome and
recruitment
program
televideo
support
Facility and Community Support Factor
Figure 10
Facility and Community Support Class CHC Community Advantages and Challenges Mean Score
A Community vs. B Community
Overall A Community B Community
p = 0.001 p = 0.003

72
-1.0
0.0
1.0
2.0
3.0
4.0
5.0
6.0
7.0
8.0
Mea
n S
core
Medical Support Economic Geographic Facility and Community Support Scope of Practice
CHC Community Advantages and Challenges Class
Figure 11
Class CHC Community Advantages and Challenges Mean Score
Administrator vs. Physician
Overall Administrator Physician

73
-1.0
0.0
1.0
2.0
3.0
4.0
5.0
6.0
7.0
8.0
Mea
n S
core
Medical Support Economic Geographic Facility and Community Support Scope of Practice
CHC Community Advantages and Challenges Class
Figure 12
Class CHC Community Advantages and Challenges Mean Score
A Community vs. B Community
Overall A Community B Communityp = 0.04 p = 0.05
p < 0.001
p = 0.05

74
0
5
10
15
20
25
30
35
40
45
50
Mea
n S
core
Overall Administrator Physician A Community B Community
Figure 13
Summary Class CHC Community Advantages and Challenges Mean Score
Overall by Respondent and Community Type
p = .001

75
0.0
0.5
1.0
1.5
2.0
2.5
3.0
3.5
4.0
Mea
n S
core
spousal
satisfaction
recreational
opportunities
schools access to larger
community
social
networking
housing
(availability
&/or
affordability)
demographic:
underserved
/payor mix
perception of
community
climate shopping and
other services
Geographic Factor
Figure 14
Geographic Class CHC Community Importance Mean Score
Administrator vs. Physician
Overall Administrator Physician

76
0.0
0.5
1.0
1.5
2.0
2.5
3.0
3.5
4.0
Mea
n S
core
spousal
satisfaction
recreational
opportunities
schools access to larger
community
social
networking
housing
(availability
&/or
affordability)
demographic:
underserved
/payor mix
perception of
community
climate shopping and
other services
Geographic Factor
Figure 15
Geographic Class CHC Community Importance Mean Score
A Community vs. B Community
Overall A Community B Community
p = 0.05

77
0.0
0.5
1.0
1.5
2.0
2.5
3.0
3.5
4.0
Mea
n S
core
salary loan repayment competition CME benefit signing
bonus/moving
allowance
retirement
package
perceived fiscal
stability
part-time
opportunities
length of
contract
flexibility
production
incentive
Economic Factor
Figure 16
Economic Class CHC Community Importance Mean Score
Administrator vs. Physician
Overall Administrator Physician

78
0.0
0.5
1.0
1.5
2.0
2.5
3.0
3.5
4.0
Mea
n S
core
salary loan repayment competition CME benefit signing
bonus/moving
allowance
retirement
package
perceived fiscal
stability
part-time
opportunities
length of
contract
flexibility
production
incentive
Economic Factor
Figure 17
Economic Class CHC Community Importance Mean Score
A Community vs. B Community
Overall A Community B Community

79
0.0
0.5
1.0
1.5
2.0
2.5
3.0
3.5
4.0
Mea
n S
core
obstetrics:
deliveries/C-
section
obstetrics:
prenatal care
mental health inpatient care emergency/
stabilization
care
office GYN
procedures
minor trauma
(casting/
suturing)
teaching mid-level
supervision
administration
Scope of Practice Factor
Figure18
Scope of Practice Class CHC Community Importance Mean Score
Administrator vs. Physician
Overall Administrator Physician
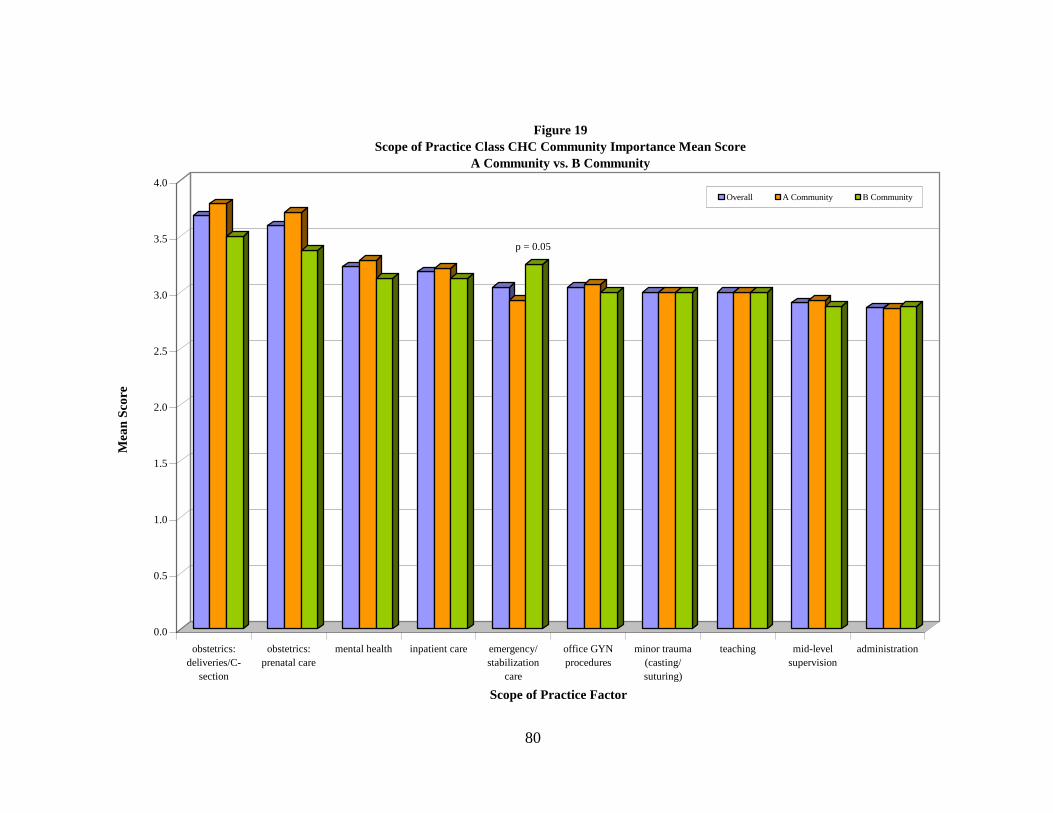
80
0.0
0.5
1.0
1.5
2.0
2.5
3.0
3.5
4.0
Mea
n S
core
obstetrics:
deliveries/C-
section
obstetrics:
prenatal care
mental health inpatient care emergency/
stabilization
care
office GYN
procedures
minor trauma
(casting/
suturing)
teaching mid-level
supervision
administration
Scope of Practice Factor
Figure 19
Scope of Practice Class CHC Community Importance Mean Score
A Community vs. B Community
Overall A Community B Community
p = 0.05

81
0.0
0.5
1.0
1.5
2.0
2.5
3.0
3.5
4.0
Mea
n S
core
call/practice
coverage
allied mental
health
workforce
stability of
physician
workforce
perception of
quality
nursing
workforce
specialist
availability
mid-level
provider
workforce
ancillary staff
workforce
pharmacy
services
language
services support
Medical Support Factor
Figure 20
Medical Support Class CHC Community Importance Mean Score
Administrator vs. Physician
Overall Administrator Physician

82
0.0
0.5
1.0
1.5
2.0
2.5
3.0
3.5
4.0
Mea
n S
core
call/practice
coverage
allied mental
health
workforce
stability of
physician
workforce
perception of
quality
nursing
workforce
specialist
availability
mid-level
provider
workforce
ancillary staff
workforce
pharmacy
services
language
services support
Medical Support Factor
Figure 21
Medical Support Class CHC Community Importance Mean Score
A Community vs. B Community
Overall A Community B Communityp = 0.02

83
0.0
0.5
1.0
1.5
2.0
2.5
3.0
3.5
4.0
Mea
n S
core
community
need/support of
physician
medical
reference
resources
delegated
physician
patient services
physical plant
and equipment
electronic
medical records
CHC leadership welcome and
recruitment
program
plans for capital
investment
moonlighting
opportunities
televideo
support
Facility and Community Support Factor
Figure 22
Facility and Community Support Class CHC Community Importance Mean Score
Administrator vs. Physician
Overall Administrator Physician

84
0.0
0.5
1.0
1.5
2.0
2.5
3.0
3.5
4.0
Mea
n S
core
community
need/support of
physician
medical
reference
resources
delegated
physician
patient services
physical plant
and equipment
electronic
medical records
CHC leadership welcome and
recruitment
program
plans for capital
investment
moonlighting
opportunities
televideo
support
Facility and Community Support Factor
Figure 23
Facility and Community Support Class CHC Community Importance Mean Score
A Community vs. B Community
Overall A Community B Community
p = 0.04
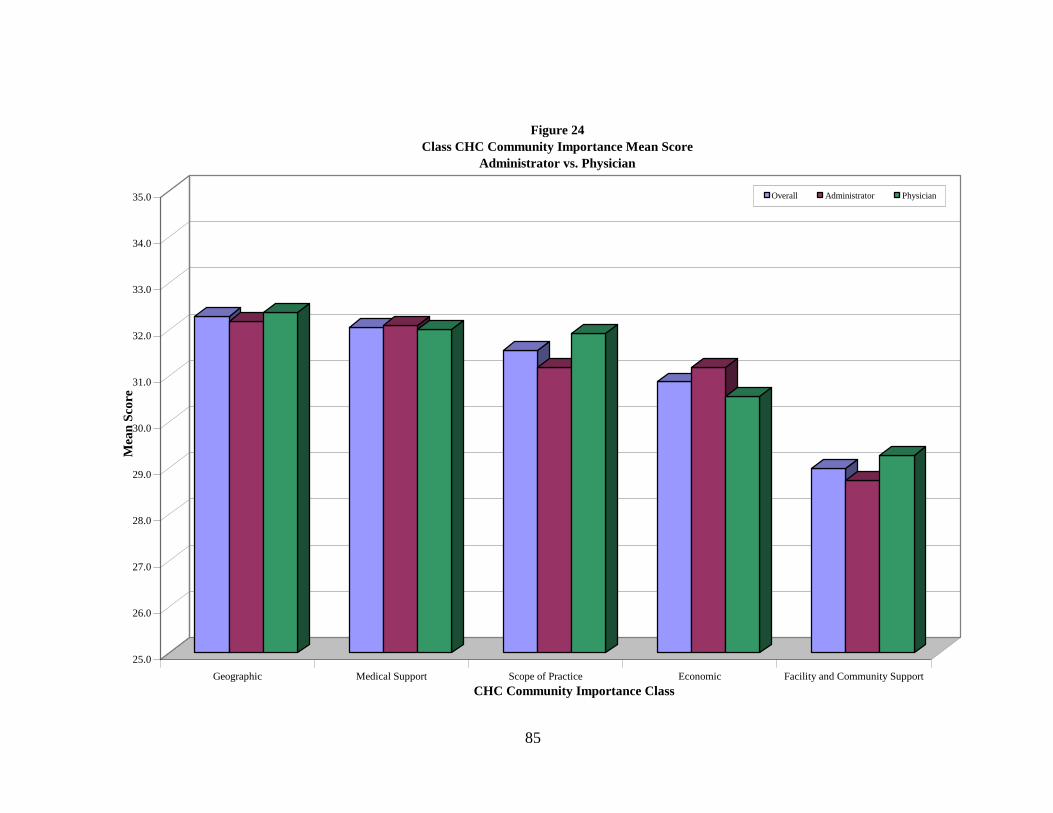
85
25.0
26.0
27.0
28.0
29.0
30.0
31.0
32.0
33.0
34.0
35.0
Mea
n S
core
Geographic Medical Support Scope of Practice Economic Facility and Community Support
CHC Community Importance Class
Figure 24
Class CHC Community Importance Mean Score
Administrator vs. Physician
Overall Administrator Physician

86
25.0
26.0
27.0
28.0
29.0
30.0
31.0
32.0
33.0
34.0
35.0
Mea
n S
core
Geographic Medical Support Scope of Practice Economic Facility and Community Support
CHC Community Importance Class
Figure 25
Class CHC Community Importance Mean Score
A Community vs. B Community
Overall A Community B Community
p = 0.05

87
0
20
40
60
80
100
120
140
160
180
200
Mea
n S
core
Overall Administrator Physician A Community B Community
Figure 26
Summary Class CHC Community Importance Mean Score
Overall by Respondent and Community Type
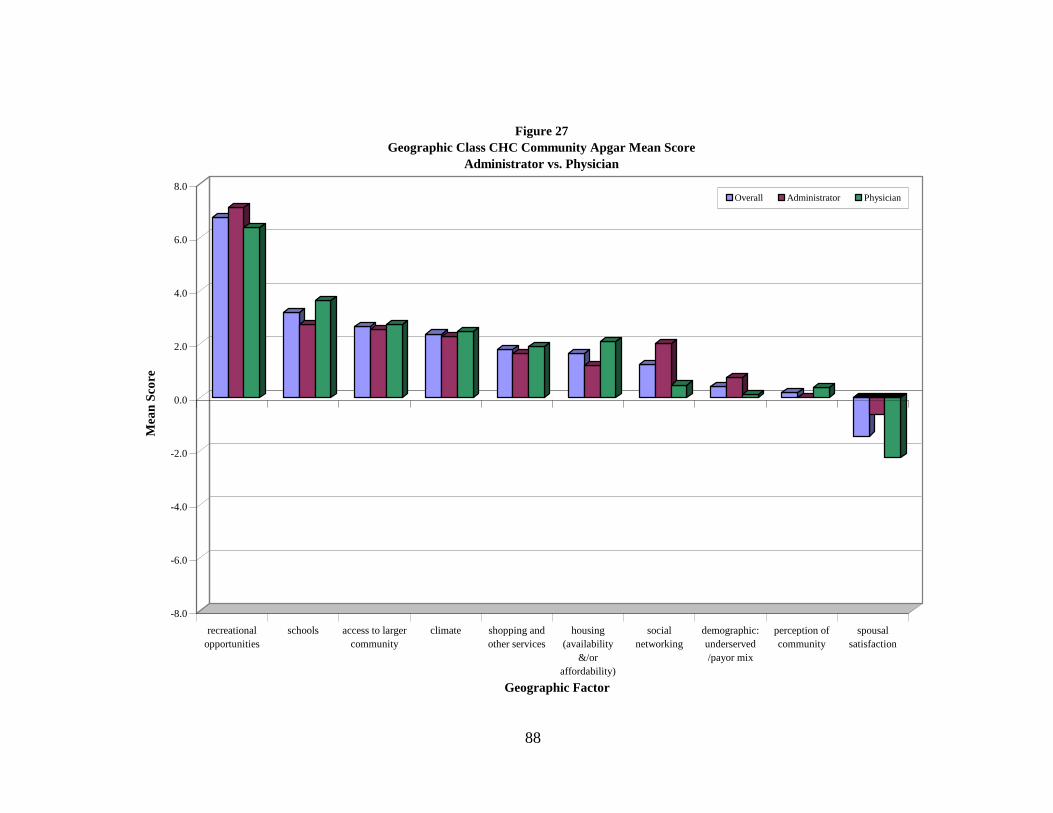
88
-8.0
-6.0
-4.0
-2.0
0.0
2.0
4.0
6.0
8.0
Mea
n S
core
recreational
opportunities
schools access to larger
community
climate shopping and
other services
housing
(availability
&/or
affordability)
social
networking
demographic:
underserved
/payor mix
perception of
community
spousal
satisfaction
Geographic Factor
Figure 27
Geographic Class CHC Community Apgar Mean Score
Administrator vs. Physician
Overall Administrator Physician

89
-8.0
-6.0
-4.0
-2.0
0.0
2.0
4.0
6.0
8.0
Mea
n S
core
recreational
opportunities
schools access to larger
community
climate shopping and
other services
housing
(availability
&/or
affordability)
social
networking
demographic:
underserved
/payor mix
perception of
community
spousal
satisfaction
Geographic Factor
Figure 28
Geographic Class CHC Community Apgar Mean Score
A Community vs. B Community
Overall A Community B Community
p = 0.05
p = 0.04
p = 0.03

90
-8.0
-6.0
-4.0
-2.0
0.0
2.0
4.0
6.0
8.0
Mea
n S
core
loan repayment retirement
package
CME benefit perceived fiscal
stability
part-time
opportunities
competition length of
contract
flexibility
signing
bonus/moving
allowance
production
incentive
salary
Economic Factor
Figure 29
Economic Class CHC Community Apgar Mean Score
Administrator vs. Physician
Overall Administrator Physician

91
-8.0
-6.0
-4.0
-2.0
0.0
2.0
4.0
6.0
8.0
Mea
n S
core
loan repayment retirement
package
CME benefit perceived fiscal
stability
part-time
opportunities
competition length of
contract
flexibility
signing
bonus/moving
allowance
production
incentive
salary
Economic Factor
Figure 30
Economic Class CHC Community Apgar Mean Score
A Community vs. B Community
Overall A Community B Community
p = 0.02 p = 0.02

92
-8.0
-6.0
-4.0
-2.0
0.0
2.0
4.0
6.0
8.0
Mea
n S
core
minor trauma
(casting/
suturing)
teaching mid-level
supervision
emergency/
stabilization
care
office GYN
procedures
inpatient care obstetrics:
deliveries/C-
section
obstetrics:
prenatal care
administration mental health
Scope of Practice Factor
Figure 31
Scope of Practice Class CHC Community Apgar Mean Score
Administrator vs. Physician
Overall Administrator Physician

93
-8.0
-6.0
-4.0
-2.0
0.0
2.0
4.0
6.0
8.0
Mea
n S
core
minor trauma
(casting/
suturing)
teaching mid-level
supervision
emergency/
stabilization
care
office GYN
procedures
inpatient care obstetrics:
deliveries/C-
section
obstetrics:
prenatal care
administration mental health
Scope of Practice Factor
Figure 32
Scope of Practice Class CHC Community Apgar Mean Scores
A Community vs. B Community
Overall A Community B Community
p = 0.04
p < 0.001

94
-8.0
-6.0
-4.0
-2.0
0.0
2.0
4.0
6.0
8.0
Mea
n S
core
perception of
quality
mid-level
provider
workforce
call/practice
coverage
ancillary staff
workforce
language
services support
allied mental
health
workforce
stability of
physician
workforce
pharmacy
services
specialist
availability
nursing
workforce
Medical Support Factor
Figure 33
Medical Support Class CHC Community Apgar Mean Score
Administrator vs. Physician
Overall Administrator Physician

95
-8.0
-6.0
-4.0
-2.0
0.0
2.0
4.0
6.0
8.0
Mea
n S
core
perception of
quality
mid-level
provider
workforce
call/practice
coverage
ancillary staff
workforce
language
services support
allied mental
health
workforce
stability of
physician
workforce
pharmacy
services
specialist
availability
nursing
workforce
Medical Support Factor
Figure 34
Medical Support Class CHC Community Apgar Mean Score
A Community vs. B Community
Overall A Community B Community
p = 0.02

96
-8.0
-6.0
-4.0
-2.0
0.0
2.0
4.0
6.0
8.0
Mea
n S
core
community
need/support of
physician
medical
reference
resources
CHC leadership moonlighting
opportunities
plans for capital
investment
delegated
physician
patient services
physical plant
and equipment
electronic
medical records
welcome and
recruitment
program
televideo
support
Facility and Community Support Factor
Figure 35
Facility and Community Support Class CHC Community Apgar Mean Score
Administrator vs. Physician
Overall Administrator Physician

97
-8.0
-6.0
-4.0
-2.0
0.0
2.0
4.0
6.0
8.0
Mea
n S
core
community
need/support of
physician
medical
reference
resources
CHC leadership moonlighting
opportunities
plans for capital
investment
delegated
physician
patient services
physical plant
and equipment
electronic
medical records
welcome and
recruitment
program
televideo
support
Facility and Community Support Factor
Figure 36
Facility and Community Support Class CHC Community Apgar Mean Score
A Community vs. B Community
Overall A Community B Community
p = 0.007 p = 0.003

98
-5.0
0.0
5.0
10.0
15.0
20.0
25.0
30.0
Mea
n S
core
Medical Support Economic Geographic Facility and Community Support Scope of Practice
CHC Community Apgar Class
Figure 37
Class CHC Community Apgar Mean Score
Administrator vs. Physician
Overall Administrator Physician

99
-5.0
0.0
5.0
10.0
15.0
20.0
25.0
30.0
Mea
n S
core
Medical Support Economic Geographic Facility and Community Support Scope of Practice
CHC Community Apgar Class
Figure 38
Class CHC Community Apgar Mean Score
A Community vs. B Community
Overall A Community B Community
p = 0.01
p = 0.04
p = 0.001
p = 0.05

100
0
20
40
60
80
100
120
Mean Score
Overall Administrator Physician A Community B Community
Figure 39 Summary Class CHC Community Apgar Mean Score
Overall by Respondent and Community Type
p < 0.001

101
-100
-50
0
50
100
150
200
250
300
350
Cu
mu
lati
ve
CH
C A
pg
ar
Sco
re
1 6 7 5 11 8 10 2 9 3 4
Community Health Center Code
Figure 40
Cumulative CHC Community Apgar Score by Community Health Center
A Community B Community
mean cumulative CHC Apgar

102
Appendix A
Community Health Center (CHC)
Community Apgar Questionnaire

103
CHC Community Apgar Questionnaire
Site Code: Subject Code:
Instructions: The interviewer will ask the subject to assess how each of the following factors,
organized into five classes, impacts recruitment and retention of Family Medicine
physicians in their community health center. Each factor will be rated on two dimensions:
relative advantage or challenge for their community and relative importance to
recruiting Family Medicine physicians to the community.
Major Minor Minor Major Very Very
Class/Factor Advantage Advantage Challenge Challenge Important Important Unimportant Unimportant
Geographic
Access to larger
community
Demographics:
Underserved/
Payor mix
Housing
(availability &/or
affordability)
Schools
Social networking
Recreational
opportunities
Spousal
satisfaction
(education, work,
general)
Shopping and
other services
Climate
Perception of
community
Economic
Part-time
opportunities
Loan repayment
Salary (amount)
Signing bonus/
moving
allowance
Length of
contract
flexibility
Perceived fiscal
stability
Production
incentive
Retirement
package
CME benefit
Competition

104
Major Minor Minor Major Very Very
Class/Factor Advantage Advantage Challenge Challenge Important Important Unimportant Unimportant
Scope of
Practice
Obstetrics:
parental care
Obstetrics:
deliveries/C-
section
Inpatient care
Emergency/
stabilization care
Minor trauma
(casting/suturing)
Office GYN
procedures
Mental health
Mid-level
supervision
Teaching
Administration
Medical
Support
Perception of
quality
Stability of
physician
workforce
Specialist
availability
Nursing
workforce
Mid-level
provider
workforce
Ancillary staff
workforce
Pharmacy
services
Allied mental
health workforce
Language
services support
Call/practice
coverage

105
Major Minor Minor Major Very Very
Class/Factor Advantage Advantage Challenge Challenge Important Important Unimportant Unimportant
Facility and
Community
Support
Physical plant
and equipment
Plans for capital
investment
Electronic
medical records
(EMR)
CHC leadership
Televideo
support
Community
need/support of
physician
Welcome and
recruitment
program
Medical
reference
resources
Delegated
physician patient
services
Moonlighting
opportunities
Open-ended
questions
1. What are your greatest barriers to recruitment and retention of Family Medicine physicians?
2. What can be done to overcome these barriers?
3. What reasons has a successful physician candidate given for not accepting a position in the community? What
did that person ultimately do instead (if you know)?

106
Appendix B
Glossary of Terms

107
Community Health Center
Community Apgar Questionnaire
Glossary of Terms
Geographic Class Factors
Access to larger community
The ability to access or ease of access to a larger community
Demographics: Underserved / Payor mix
The demographics of patients in the community including ability to access recommended or
rendered care, age, gender, race or other
Housing (availability &/or affordability)
The availability and affordability of desirable housing as viewed by physicians
Schools
Adequacy of schools for the physician’s children
Social networking
Opportunities or ease of socializing for the physician and family
Recreational opportunities
Opportunities for local, enjoyable non-work time activities
Spousal satisfaction (education, work, general)
Overall satisfaction of the spouse in regard to local community living such as education, work,
and in general
Shopping and other services
Adequacy of local access to shopping or services for physician and family
Climate
Weather
Perception of community
Perception of the community overall by someone not from the community
108
Economic Class Factors
Part-time opportunities
Whether or not a desire for part-time work status is available or supported
Loan repayment
Whether or not loan repayment is available for qualifying physician
Salary (amount)
The competitiveness of the overall end-of-year physician earnings
Signing bonus / Moving allowance
Whether or not a signing bonus is available for new physician and whether or not a moving
allowance is available for new physician
Length of contract flexibility
Whether or not a physician can expect flexibility with regard to the length in term of a working
agreement or contract
Perceived fiscal stability
The degree of perceived financial stability of the hiring CHC institution
Production incentive
The existence and favorability of a production incentive for physician work and income
Retirement package
The existence and favorability of a physician retirement package or program
CME benefit
The existence and favorability of a Continuing Medical Education benefit and/or program
Competition
The sense of competition amongst primary care providers for patients and resultant environment
for sharing care between physicians

109
Scope of Practice Class Factors
Obstetrics: Prenatal care
The impact of whether or not prenatal care obstetrics is an option, not an option, or mandatory.
Obstetrics: Deliveries / C-section
The impact of whether or not vaginal deliveries and/or C-Sections is an option, not an option, or
mandatory.
Inpatient care
The impact of whether or not inpatient hospital care is an option, not an option, or mandatory.
Emergency / Stabilization care
The impact of whether or not ER or stabilization and transfer coverage is an option, not an
option, or mandatory.
Minor trauma (casting/suturing)
The impact of whether or not minor trauma care such as casting or suturing is an option, not an
option, or mandatory.
Office GYN procedures
The impact of whether or not office GYN procedures such as colposcopy and/or LEEP is an
option, not an option, or mandatory.
Mental health
The impact of whether or not mental health care by the physician is an option, not an option, or
mandatory.
Mid-level supervision
The impact of whether or not mid-level supervision by the physician is an option, not an option,
or mandatory.
Teaching
The impact of whether or not teaching residents or medical students by physicians is an option,
not an option, or mandatory.
Administration
The impact of whether or not administrative duties for the physician is an option, not an option,
or mandatory.

110
Medical Support Class Factors
Perception of quality
The overall reputation for quality of medical care for this community as seen by someone not
from this community
Stability of physician workforce
The stability of the physician workforce and longevity of the retained physicians
Specialist availability
The availability of specialists and sub-specialist for patient care; either on site or by other means
Nursing workforce
The adequacy of nursing workforce for both quantity and quality
Mid-level provider workforce
The adequacy of mid-level provider for both quantity and quality
Ancillary staff workforce
The adequacy of ancillary staff (such as laboratory, x-ray technician, respiratory therapy,
physical therapy, occupational therapy) workforce for both quantity and quality
Pharmacy services
The availability and adequacy of pharmacy services for CHC patients
Allied mental health workforce
The adequacy of allied mental health workforce for both quantity and quality
Language services support
The availability and adequacy of language support services for CHC patients
Call / Practice coverage
The adequacy of call coverage and practice coverage for physician leave, holidays and vacation
111
Facility and Community Support Class Factors
Physical plant and equipment
The current adequacy of the facilty physical plant and equipment
Plans for capital investment
The adequacy of the CHC institutional plans for capital investment in the facility
Electronic medical records (EMR)
The existence and adequacy of electronic medical records in the facility environments
CHC leadership
The adequacy of CHC leadership including the administrators and CHC board functions
Televideo support
The existence and adequacy of televideo capability in the community for patient care or other
communications
Community need / Support of physician
The perceived sense of need for and/or community support of a new physician
Welcome and recruitment program
The existence and adequacy of any recruitment plan and/or welcome for an interviewing or
newly recruited physician
Medical reference resources
The adequacy and quality of medical reference resources for physician use in patient care
Delegated physician patient services
The adequacy and quality of task performance when physicians appropriately delegate an aspect
of patient service
Moonlighting opportunities
The availability and quality of local physician work opportunities outside of the routine CHC
provision of care