Embed Size (px)
Citation preview

ASPECT BASED OPINION MINING ONTURKISH TWEETS
a thesis
submitted to the department of computer engineering
and the graduate school of engineering and science
of bilkent university
in partial fulfillment of the requirements
for the degree of
master of science
By
Esra Akbas
July, 2012

I certify that I have read this thesis and that in my opinion it is fully adequate,
in scope and in quality, as a thesis for the degree of Master of Science.
Assoc. Prof. Dr. Hakan Ferhatosmanoglu (Advisor)
I certify that I have read this thesis and that in my opinion it is fully adequate,
in scope and in quality, as a thesis for the degree of Master of Science.
Prof. Dr. Altay Guvenir
I certify that I have read this thesis and that in my opinion it is fully adequate,
in scope and in quality, as a thesis for the degree of Master of Science.
Assoc. Prof. Dr. Bulent Tavlı
Approved for the Graduate School of Engineering and
Science:
Prof. Dr. Levent OnuralDirector of the Graduate School
ii

ABSTRACT
ASPECT BASED OPINION MINING ON TURKISHTWEETS
Esra Akbas
M.S. in Computer Engineering
Supervisor: Assoc. Prof. Dr. Hakan Ferhatosmanoglu
July, 2012
Understanding opinions about entities or brands is instrumental in reputation
management and decision making. With the advent of social media, more people
are willing to publicly share their recommendations and opinions. As the type
and amount of such venues increase, automated analysis of sentiment on textual
resources has become an essential data mining task. Sentiment classification aims
to identify the polarity of sentiment in text. The polarity is predicted on either
a binary (positive, negative) or a multi-variant scale as the strength of sentiment
expressed. Text often contains a mix of positive and negative sentiments, hence
it is often necessary to detect both simultaneously. While classifying text based
on sentiment polarity is a major task, analyzing sentiments separately for each
aspect can be more useful in many applications.
In this thesis, we investigate the problem of mining opinions by extracting
aspects of entities/topics on collection of short texts. We focus on Turkish tweets
that contain informal short messages. Most of the available resources such as
lexicons and labeled corpus in the literature of opinion mining are for the English
language. Our approach would help enhance the sentiment analyses to other
languages where such rich sources do not exist. After a set of preprocessing
steps, we extract the aspects of the product(s) from the data and group the tweets
based on the extracted aspects. In addition to our manually constructed Turkish
opinion word list, an automated generation of the words with their sentiment
strengths is proposed using a word selection algorithm. Then, we propose a new
representation of the text according to sentiment strength of the words, which we
refer to as sentiment based text representation. The feature vectors of the text
are constructed according to this new representation. We adapt machine learning
methods to generate classifiers based on the multi-variant scale feature vectors to
iii

iv
detect mixture of positive and negative sentiments and to test their performance
on Turkish tweets.
Keywords: Opinion mining, Sentiment analysis, Twitter, Text mining, Summa-
rization.

OZET
TURKCE TWEETLERDE KONU BAZLI DUSUNCEANALIZI
Esra Akbas
Bilgisayar Muhendisligi, Yuksek Lisans
Tez Yoneticisi: Assoc. Prof. Dr. Hakan Ferhatosmanoglu
Haziran, 2012
Kisiler ve markalar hakkındaki gorusleri anlamak, itibar yonetimi ve karar verme
konularında yardımcı olur. Sosyal medyanın gelisiyle, daha cok insan tavsiye ve
goruslerini aleni sekilde paylasmaya istekli hale gelmistir. Sosyal alanların tip
ve miktarı arttıgı icin, metinsel kaynaklardaki duygu analizini otomatize etmek,
zaruri bir veri madenciligi gorevi haline gelmistir. Duygu sınıflandırma, metindeki
duygu kutuplulugunu belirlemeyi amaclar. Kutupluluk, duygunun guclulugu be-
lirtildigi kadar, ya ikili (pozitif, negatif) ya da cok degiskenli skalada tahmin
edilir. Metinler cogu kez pozitif ve negatif duyguların karısımını ihtiva ederler;
dolayısıyla, bu iki tip duyguyu sıkca aynı anda saptamak gereklidir. Metni duygu
kutupluluguna gore sınıflandırmak ana bir gorev iken, duyguları her alt konular
icin ayrı ayrı analiz etmek, cogu uygulama icin daha faydalı olabilir.
Biz bu calısmada, bir kısa metin koleksiyonu uzerinde kisi ve baslıklar
hakkındaki alt konuları cıkararak, dusunce analizi problemi uzerinde inceleme
yapmaktayız. Resmi olmayan kısa mesajlar iceren Turkce tweetler uzerinde
yogunlasmaktayız. Dusunce analizi uzerinde literaturde yer alan kelime sozlugu
ve etiketli derlemler gibi kaynakların cogu Ingilizce icindir. Bizim yaklasımımızın,
boyle zengin kaynakların olmadıgı diger diller icin duygu analizini gelistirmeye
yardımcı olması mumkundur. Birtakım onisleme adımlarından sonra, veriden
urun(ler) hakkındaki alt konular cıkarıp, bu konulara dayanarak tweetleri gru-
plamaktayız. Elle isletilerek olusturdugumuz Turkce duygusal kelime listesine
ek olarak, bir kelime secme algoritması kullanıp, kelimelerin duygu guclulugu ile
birlikte bir otomatize olusum yontemi gelistirildi. Daha sonra, duygu tabanlı
metin gosterim sekli olarak ifade edilen, kelimelerin duygu guclulugune gore met-
nin yeni bir gosterim sekli olusturuldu. Metinlerin oznitelik vektoru, bu yeni
gosterim sekline gore olusturulmaktadır. Pozitif ve negatif duygu karısımını be-
lirlemek icin cok degiskenli skalada oznitelik vektorlerine dayanan sınıflandırıcıları
v

vi
olusturmak ve bunların performansını Twitter API vasıtasıyla zamanla toplanan
Turkce tweet verisinde test etmek icin makine ogrenmesi yontemlerini uyarla-
maktayız.
Anahtar sozcukler : Dusunce Analizi, Twitter, Yazı madenciligi, Ozetleme.

Acknowledgement
I would like to express my deepest gratitude to my supervisor Assoc. Prof. Dr.
Hakan Ferhatosmanoglu and co-superviser Dr. Aynur Dayanık for their excellent
guidances, valuable suggestions .
I would like to thank to Prof. Dr. Altay Guvenir and Assoc. Prof. Dr. Bulent
Tavlı for reading this thesis.
I am grateful to my family members for their love and their support in every
stage of my life.
I would like to thank Burcu Dal and Elif Eser who have supported me in any
way during the creation period of this thesis.
I would like to thank to TUBITAK for financial support during the formation
of my thesis.
vii

Contents
1 Introduction 1
2 Background 5
2.1 Sentiment Analysis . . . . . . . . . . . . . . . . . . . . . . . . . . 5
2.1.1 The lexical (Unsupervised) Approaches . . . . . . . . . . . 6
2.1.2 Supervised Approaches . . . . . . . . . . . . . . . . . . . . 9
2.2 Machine learning Methods . . . . . . . . . . . . . . . . . . . . . . 15
2.2.1 Naive Bayes . . . . . . . . . . . . . . . . . . . . . . . . . . 15
2.2.2 Support Vector Machine . . . . . . . . . . . . . . . . . . . 16
2.2.3 Decision Tree . . . . . . . . . . . . . . . . . . . . . . . . . 16
2.3 Clustering text based on aspects of the topics . . . . . . . . . . . 19
3 Mixture Model for Aspect Based Sentiment Analysis 23
3.1 Data . . . . . . . . . . . . . . . . . . . . . . . . . . . . . . . . . . 23
3.2 Preprocessing . . . . . . . . . . . . . . . . . . . . . . . . . . . . . 26
3.3 Extracting Subtopics . . . . . . . . . . . . . . . . . . . . . . . . . 28
viii

CONTENTS ix
3.4 Extracting Sentiment Orientation . . . . . . . . . . . . . . . . . . 31
3.4.1 Constructing sentiment word list . . . . . . . . . . . . . . 31
3.4.2 Twitter Sentiment strength detection . . . . . . . . . . . . 31
4 Experimental Testbed, Application and Results 35
4.1 Experiment . . . . . . . . . . . . . . . . . . . . . . . . . . . . . . 36
4.1.1 Aspect based Clustering . . . . . . . . . . . . . . . . . . . 36
4.1.2 Opinion Mining . . . . . . . . . . . . . . . . . . . . . . . . 38
4.2 Application . . . . . . . . . . . . . . . . . . . . . . . . . . . . . . 47
5 Conclusion 51

List of Figures
1.1 The sentiment of tweets over time for the three major Wireless Carriers 2
2.1 BT algorithm: selecting the positive and negative words, the best rep-
resenter of the documents . . . . . . . . . . . . . . . . . . . . . . . 14
2.2 An example of SVM, Linear separating hyperplanes for the separable
case. The support vectors are circled . . . . . . . . . . . . . . . . . 17
2.3 An example of Decision Tree . . . . . . . . . . . . . . . . . . . . . 17
3.1 Structure of our system . . . . . . . . . . . . . . . . . . . . . . . 24
4.1 Precision, recall and accuracy results for clustering based on similarity
versus value of threshold . . . . . . . . . . . . . . . . . . . . . . . . 38
4.2 Precision, recall and accuracy results for clustering based on maxfreq
versus value of threshold . . . . . . . . . . . . . . . . . . . . . . . . 39
4.3 Accuracy results of ”grouped automatic” algorithm according to thresh-
old value for positive sentiment strength . . . . . . . . . . . . . . . 40
4.4 Accuracy results of ”grouped automatic” algorithm according to thresh-
old value for negative sentiment strength . . . . . . . . . . . . . . . 41
4.5 Number of tweets over 2 months . . . . . . . . . . . . . . . . . . . . 47
x

LIST OF FIGURES xi
4.6 Z value of Quality aspect of tree brands over time . . . . . . . . . . 49
4.7 Z value of Cost aspect of tree brands over time . . . . . . . . . . . . 50
4.8 Z value of two aspect of brand y over time . . . . . . . . . . . . . . 50

List of Tables
2.1 Frequently used emoticons . . . . . . . . . . . . . . . . . . . . . . 11
3.1 Emoticon list, their corresponding sentiments and symbols used to
replace . . . . . . . . . . . . . . . . . . . . . . . . . . . . . . . . . 26
4.1 Distribution of the aspects of the products . . . . . . . . . . . . . 37
4.2 Results of clustering with different algorithm . . . . . . . . . . . . 37
4.3 Distribution of class in the dataset . . . . . . . . . . . . . . . . . 39
4.4 Performance of algorithms on positive sentiment strength detection 42
4.5 Performance of algorithms on negative sentiment strength detection 42
4.6 Performance of various algorithms on positive sentiment strength
detection (Accuracy) . . . . . . . . . . . . . . . . . . . . . . . . . 43
4.7 Performance of various algorithms on positive sentiment strength
detection (Accuracy ±1 class) . . . . . . . . . . . . . . . . . . . . 44
4.8 Performance of various algorithms on negative sentiment strength
detection (Accuracy) . . . . . . . . . . . . . . . . . . . . . . . . . 44
4.9 Performance of various algorithms on negative sentiment strength
detection (Accuracy ±1 class) . . . . . . . . . . . . . . . . . . . . 45
xii
LIST OF TABLES xiii
4.10 Performance of various algorithms on positive sentiment strength
detection (Baseline) . . . . . . . . . . . . . . . . . . . . . . . . . . 46
4.11 Performance of various algorithms on negative sentiment strength
detection (Baseline) . . . . . . . . . . . . . . . . . . . . . . . . . . 46
4.12 Average of positive, negative sentiment strength and z value of two
aspects, quality and cost, and general of three brands . . . . . . . 48

Chapter 1
Introduction
While making decisions, people usually rely on opinions of other people and ask
recommendations. Thanks to public social media, people share their recommen-
dations online. According to a survey [8], users generally do an online search
about a product before buying it, and online reviews about the product affect
their opinion significantly. Learning peoples opinions and preferences are more
valuable for companies to get feedback on their products both through the public
web and private channels of information. They can monitor their brand rep-
utation, analyze how peoples opinion changes over time and decide whether a
marketing campaign is effective. Figure 1.1 shows a simple example that we
produced which illustrates the sentiment of tweets over time for the three ma-
jor Wireless Carriers in Turkey, which we refer to as Carrier-X, Carrier-Y, and
Carrier-Z in this thesis.
As the type and amount of venues for sharing opinions increase, getting use-
ful information of sentiments on textual resources has become an essential data
mining goal. The task of sentiment classification aims to identify the polarity
of sentiment in text. In other words, text is classified according to sentiment
type. The text unit can be a word, phrase, sentence or a document. The polarity
is predicted on either a binary (positive, negative) or multi-variant scale as the
strength of sentiment expressed in the text. However, a text often contains a mix
of positive and negative sentiment, hence it is often necessary to detect both of
1

CHAPTER 1. INTRODUCTION 2
Figure 1.1: The sentiment of tweets over time for the three major Wireless Carriers
them simultaneously [27]. An example of mixture text that shows this mixture
is:
”Z kalitelisin ama cok pahalısın”
It is stated in the example that Z has quality but its cost is also too high. These
are negative and positive aspects of the product in the same text.
Extracting polarity from textual resources involves many challenges. Distin-
guishing positive text from negative text is relatively easy for human, especially in
comparison to other traditional text mining problems such as topic categorization.
However, automated identification of keywords that convey sentiment polarity is
more difficult as the topics are often identifiable by keywords alone. Moreover,
sentiment can be expressed in a more hidden attitude, as a result of this, it is
difficult to be identified by any of a sentence or documents terms [8]. Note that
a sentence that includes opinion word does not necessarily indicate sentiment;
and a sentence that does not include any opinion words may contain sentiment.
Additionally, sentiment is context sensitive and domain dependent because same
or similar words can indicate different sentiment in different domains.
A major challenge in our work has been handling a non-English and informal
short-text in Twitter. Current studies typically focus on sentiment classification
on English reviews, e.g., on movies and restaurants, blogs, and news. These data

CHAPTER 1. INTRODUCTION 3
sets often consist of relatively well-formed, coherent and at least paragraph-length
pieces of text. Furthermore, resources such as polarity lexicons, and parsers are
usually available for these domains and for English. Sentiment analysis on Twit-
ter, however, is different from the sentiment analysis models on reviews or blogs
based on machine learning. In a tweet message, a sentiment is conveyed in one
or two sentence passages, which are rather informal, including abbreviations and
typos. These messages are less consistent in terms of language usage, and usually
cover a much wider array of topics. Also, sentiment is not always as obvious when
discussing human-generated status updates; many tweets are ambiguous even to
a human reader as to their sentiment. Finally, a considerably large fraction of
tweets convey no sentiment whatsoever, such as advertisements and links to news
articles, which provide some difficulties in data gathering, training and testing [5].
There are many studies to detect sentiment of a text written in English. Most of
them use supervised machine learning methods with the raw word representation
as features to construct a model. Some follows a lexical approach which uses a
dictionary of sentiment words with associated strength measures.
While classifying text based on sentiment polarity is a major task, a more
useful variant is usually to mine the opinions based on the particular aspects
(features) of entities or topics. Instead of extracting the overall sentiment of
a topic, analyzing sentiments separately for each aspect can be more useful in
many applications. For instance, while users may like the quality of a product,
they may not be satisfied with its cost. So, exploring more detailed information
about a product is better for sentiment analysis done by users of a product or a
company. This summarization task includes three steps [26]:
• Extracting features/aspects of entity/topic
• Mining opinions in each text and their polarity
• Producing a useful aspect based summary from the results such as number
of positive and negative reviews about an aspect, average of sentiment, life
cycle of sentiment of an aspect over time
Several methods are proposed to identify the aspect of the products. There

CHAPTER 1. INTRODUCTION 4
are different features of a product that opinions are expressed on, and same or
similar aspects of a product can be expressed with different words. So, after
extracting the aspects, they need to be grouped to obtain an effective summary.
A contribution of this thesis is the methods to generate aspect based senti-
ments on short Turkish texts. Most of the available resources such as lexicons
and labeled corpus in the literature are in English. We focus on Turkish texts in
Twitter that contain informal short messages and show a methodology to con-
struct resources, lexicon and corpus for non-English languages. Our approach
would help enhance the sentiment analyses to other languages where such rich
sources do not exist. After constructing the Turkish data set and applying a set
of preprocessing steps, we propose an algorithm to extract the words for specified
aspects of the topic and group text according to words of aspects. Then, we com-
bine machine learning and lexical methods to measure the sentiment strength of
the text. In addition to the manually constructed Turkish opinion word list, an
automated generation of the words with their sentiment strengths is developed
using a proposed word selection algorithm. Then, we propose a new representa-
tion of the text according to sentiment strength of the words, called sentiment
based text representation. Feature vectors of the text are constructed according
to the new representation. We adapt machine learning methods to generate clas-
sifiers based on these new type of feature vectors to detect mixture of positive
and negative sentiments and to test their performance on a Turkish tweet data
collected over time via Twitter API.
The rest of the thesis is organized as follows: Section 2 gives background in-
formation about topic extraction and sentiment analysis and presents the related
work. Section 3 describes the details of our model. In Section 4, our experimen-
tal results are discussed and some applications results of our model are given.
Finally, we conclude and include future work in Section 5.

Chapter 2
Background
2.1 Sentiment Analysis
Opinion mining is one of the tasks of sentiment analysis, which is to track atti-
tudes and feelings in an opinionated document with classifying it as either positive
or negative according to the sentiment expressed in it. As an important discipline
in the areas of NLP, text mining and information retrieval, it dates back to the
late 1990s but it has gained a lot of interest in the recent years [8].
A large collection of research on mining opinions from text is done. Most
of these works detect sentiment as positive-negative, or add a natural class to
them. There are also some studies [27, 31] that detect positive-negative senti-
ment strength with predicting the human ratings on a scale (e.g. Sentiment in
the text is classified as 2 in the scale between 0-10 (extremely negative - ex-
tremely positive). Also some recent approaches try to extract multiple emotions
and their strengths from an informal text [27, 30]. These methods are commonly
performed on large texts, e.g., newspaper articles and movie reviews. Recently,
many researches are done on short texts such as Twitter corpora to mine public
opinion and interesting trends using different approaches. Most existing senti-
ment extraction approaches assumes that the document includes only subjective
5

CHAPTER 2. BACKGROUND 6
expression as opinion of the author. However, text materials usually contain mix-
ture information as opinion and facts, objective information about events and
entities. Therefore, some of applications try to separate factual and opinion texts
as document level subjectivity classification (e.g. The document is subjective or
objective) before extracting sentiment of the text.
Although most of sentiment extraction approaches are based on supervised
learning, some approaches use unsupervised methods as well.
2.1.1 The lexical (Unsupervised) Approaches
The lexical approach utilizes a dictionary or a lexicon of pre-tagged (positive-
negative or strength of sentiment) opinion words known as polar words and sen-
timent words. Positive opinion words are used to state positive sentiment (e.g.
iyi, guzel). On the other hand, negative opinion words are used to state negative
sentiment (e.g. kotu, cirkin) [25, 12]. Each word that presents in a text is com-
pared against the dictionary and sentiment of the text, according to the results
of some functions based on occurring positive and negative opinion words in the
dictionary is determined [27, 21, 20]. Especially, polarity of the text is computed
with counting how often words in the dictionary occur in the text. Moreover,
there are some other works that use negation terms and words that enhance sen-
timent of the upcoming words to improve the results of extracting sentiment of
text[36]. It is enough to look at the number of positive and negative terms in
a text to determine sentiment of the text. If number of the positive words is
higher than number of the negative terms, the text is classified as positive and
as negative if it contains more negative terms. If the numbers of them are equal,
it is classified as neutral [21]. GI [35], which contains information about English
word senses, as positive, negative, negation, overstatement, or understatement,
is used as a dictionary of opinion words.
In some works [27, 31], strength of positive-negative sentiment is detected on
a scale. The lexicon used in these works not only contains negative and positive
words but also contains sentiment strength of them in a scale. The polarity

CHAPTER 2. BACKGROUND 7
weighted strength of each word is accumulated to compute the sentiment strength
xt of a text t. It is defined formally as:
xt =∑n
i=1(pi ∗ si)
where n is the number of words in the text, pi ∈ { -1,+1 } is the word polarity
and si ∈ { 1,2,3,4 } is the word strength.
Opinion Lexicon Generation
There are different types of this dictionary. Some of them include only adjec-
tives and adverbs such as iyi, kotu and cirkin. The reason of it is that adjectives
and adverbs are more important than the other words such as noun and verbs for
sentiment classification. Although, some of them has also noun and verbs that
indicate sentiment such as sevmek, eglenmek, aldatmak. Different approaches
can be used to construct this word list. The first one is manual approach. Each
term is labeled as positive-negative or in scale as sentiment strength by humans.
However, constructing it manually is a time consuming task and finishing the
construction in a short time is more difficult. The second one is dictionary based
approach. It starts with collecting a small set of opinion words manually with
known orientations and then to grow this set by searching in an online dictionary,
e.g. Wordnet [33] for their synonyms and antonyms. Another one is corpus based
approach based on co-occurrence patterns of words in a large corpus [25].
• Dictionary Based Approach
Kampus et al [20], construct the opinion word list using wordnet. The geodesic
distance s used to measure the similarity of meaning of word. GI to words, ”good”
and ”bad” is computed for each adjective in a dictionary, According to a function
EVA, a value between -1 (for words on the bad side of the lexicon) to 1 (for words
on the good side of the lexicon) is assigned to each word.
EV A(w) = (d(w, bad)− d(w, good))/d(good, bad)

CHAPTER 2. BACKGROUND 8
765 positive and 873 negative words are obtained by this way. The percentage of
agreement between their word list and the General Inquirer list is 68.19 %.
• Corpus Based Approach
Hatzivassiloglou and mckeown [18] propose a novel approach to extract se-
mantic orientation of a set of adjectives based on linguistic features. They try
to find semantic orientation of other adjectives in large corpus with using a set
of linguistic constraints and a small list of opinion adjective words. They look
whether an adjective is linked to another one known as positive or negative by a
conjunction or disjunction or not. They assume that adjectives, which co-occur
more frequently in conjunction such as ”and” , have same sentiment orientation
where as adjectives, co-occur more frequently in disjunction such as but, usually
share opposite sentiment orientation. According to this assumption, they extract
some adjectives with their semantic orientation from the corpus. The algorithm
is tested with 1.336 manually labeled adjectives and approximately 78% accuracy
is obtained. They use four steps in this method:
1. All conjunctions of adjectives are extracted from the corpus.
2. Using a log-linear regression model constructed with training set, it is de-
termined that whether each two conjoined adjectives are same or opposite
orientation. According to the result of the model on the different test sets, a
graph is obtained. Nodes of it are adjectives and links of it show orientation
between adjectives.
3. According to a clustering algorithm, the graphs is partitioned into two sets.
4. Items are labeled as positive and negative based on frequency of positive
adjectives in the sets.
In [32] similar to [18], the pointwise mutual information is used to label phrases
with their semantic orientations according to two set of positive and negative seed
words ;

CHAPTER 2. BACKGROUND 9
Sp = { good,nice,excellent,positive,fortunate,correct,superior }
Sp = { bad,nasty,poor,negative,unfortunate,wrong,inferior }
Phrases that includes adjective and adverbs are extracted from the text using a
part of speech tagger. The point wise mutual information (PMI) between words
is calculates by using word co-occurrence statistics that is defined as follows:
PMI(word1, word2) = log2(p(word1&word2)/p(word1)p(word2))
p(word1&word2) shows the co-occurrence statistics of word1 and word2.
After computing PMI between seed words and extracted words, labels
(semanticorientation = SO) of these extracted words is given according to a
formula as follows;
SO(t) =∑
ti∈SpPMI(t, ti)−
∑tj∈Sn
PMI(t, tj)
Then, the sentiment of the text is predicted as the average of SO scores of the
extracted phrases in it. This approach finds domain specific opinion words. Since
it is difficult to construct a list that cover all opinion words in the language using a
small corpus [25]. This fact differs this approach from dictionary based approach.
This may be both an advantage and disadvantage for sentiment classification. As
an advantage, some words can be used in different meanings in different corpora.
Therefore, we can extract this information with this approach. On the other
hand, this constructed list may not be used for a different domain.
2.1.2 Supervised Approaches
Similar to other topic based text classification in the machine learning approach,
a classifier is trained with a collection of tagged corpus using a chosen feature

CHAPTER 2. BACKGROUND 10
vector and a supervised machine learning method, such as Support vector ma-
chines (SVM), decision tree, Naive Bayes and maximum entropy. For using in
classification, there are different kinds of feature vector that text is converted
into. When all terms in the corpus are used as feature, dimensionality of feature
vector becomes very high. Moreover, entire document does not contain senti-
ment information. This redundant information can reduce the effectiveness of
data mining. Hence, different feature extraction and feature selection algorithms
are applied in the literature of text classification and sentiment analysis for faster
learning and better classification results.
Feature Types
A basic feature is terms and their frequency that are individual words or word
n-grams. Each document d is represented by a vector of frequencies of the terms
in it:
d = (tf1, tf2, ..., tfm)
As an alternative to term frequency tf , inverse document frequency (idf) is
also used as a feature. Furthermore, presence of terms is used as binary-valued
feature vector that a feature shows whether a term occurs 1 n the document or not
(0). Pang et al. [7] show that using presence of the terms rather than frequency
gives better results. Moreover, n-grams, i.e. a contiguous sequence of n terms
from a given sequence of text are used in the feature vector. In [7], it is reported
that unigrams yield better results than bigrams. Another approach is using part
of speech tags such as adjectives, nouns, verbs and adverbs for sentiment analysis.
However, other tags also contribute to expression of sentiment [24]. In addition
to these, emoticons, punctuation e.g., ?, !, .., opinion and negation word and the
number of them are also exploited as a feature type [25, 16]. Emoticons are
textual expressions that represent facial expressions. Table 2.1 lists frequently
used emoticons.
In [10], sentence length in words, number of ”!” and ”?” characters in the
sentence, number of quotes in the sentence and number of capitalized/all capitals

CHAPTER 2. BACKGROUND 11
Glyph Meaning
: −), :) Smile
;−),; ) Wink
: −(, : ( Frown
: −D, : D Wide grin
: −P, : P Tongue sticking out
: −O, : O Surprise
:′ ( Crying
: −| Disappointed
: −S, : S Confused
: −@ Angry
: −$ Embarrassed
Table 2.1: Frequently used emoticons
words in the sentence are used as features.
Most commonly, the raw word representation (n-grams) is chosen as the fea-
ture vector for text classification. However, there are lots of words that have no
effect on the classification. Also, computing complexity increases as a result of
high dimensionality. For long texts, effective results can be obtained using bag of
words approach, since each document includes many words and they may have
same words. However, the frequency of the words in short text is relatively low
in comparison with their frequency in long documents while both cardinalities
of their corpus is high. Therefore, short text has spare feature vector that has
hundreds or thousands of dimensions but there is a few feature of this vector that
has a value different from 0. As a solution for these problems, different feature
selection and extraction algorithms are applied for text classification. In addition
to these, many research are done such as expanding and enriching the sparse texts
for overcoming sparsity of short text. Furthermore, domain specific solutions are
also developed [6]. One of them is to classify using a small set of domain-specific
features, such as the author information and features extracted from the tweets

CHAPTER 2. BACKGROUND 12
Feature Selection Algorithms
An important difficulty of text mining is the high dimensionality of the feature
space. All terms, whose number may be more than thousands in the corpus of
documents, do not contain essential information. Feature selection algorithms
try to extract these essential knowledge with removing non-informative terms
according to corpus statistics [38]. Basically, one can select words that have
sufficient frequency using a threshold, since too specific terms may not have any
effect on the sentiment of the text. In addition to this, a score is given to each
of the features after evaluating all of them independently using some evaluation
function on a single feature. According to the assigning score, best features are
selected as a subset. The number of features can be predefined or a threshold
can be used for score of features [29, 11].
There are different evaluation function used for scoring. Some of them are as
follows [11]:
• Docfrequency(f, Ci) = P (f |Ci)
• Odds Ratio(f, Ci) = ((P (f |Ci) ∗ (1− P (f |Ci)))/((P (f |Ci) ∗ (1− P (f |Ci)))
• Entropy(f) = P (f)∑
i P (Ci|f) log(P (Ci|f)/P (Ci))(Entropy)
• Infgain(f) = P (f)∑
i P (Ci|f) log(P (Ci|f)/P (Ci))+P (f)∑
i P (Ci|f) log(P (Ci|f)/P (Ci))
(Information Gain)
• MI(f ;C) = P (f, C) ∗ log ((P (f, C))/(P (f) ∗ P (C))) (Mutual Information)
Information Gain, Infgain (f), is commonly used in decision tree for selection
of best discriminative feature. Mutual Information, MI (f; C), is used to measure
dependency between 2 variables. It is one of the most commonly used feature
selection method in text mining. It selects features according to mutual depen-
dency between a term f and a class C (positive or negative) [29]. P(f; C) is the
conditional probability of the feature f occurring in class C.
In the best term (BT) approach [11], for each class C, all documents in C
are examined and a set of positive words, as given in the definition 1 below, that

CHAPTER 2. BACKGROUND 13
are more frequent are selected as good predictors of that class. A top scoring
positive feature is selected for each document. Documents that do not contain
at least one of the positive words eliminated with the thought of not including
useful information after extracting positive words for all class. Later, a set of
negative features, as given in definition 2, are selected as a good representer of
that documents with looking documents that are not in C. For each documents
out of class C the top scoring negative feature is selected.
Definition 1: A feature w is called positive for a class c if and only if the
following relation holds:
P (c|w) > 0.5 ∗ p+ 0.5 ∗ P (c)
where p is a parameter that is used in order to counteract the cases where the sim-
pler relation P (c|w) > P (c) leads to a trivial acceptor/rejecter, for too small/large
values of P(c).
Definition 2: A feature w is called negative for a class c if and only if the
following relation holds:
P (c|w) > 0.5p+ 0.5P (c)
P (c|w) < 0.5(1− p) + 0.5P (c)
The algorithm has a linear time complexity with respect to the number of
training documents. Complexity does not depend on the number of vocabularies
but depends on the number of documents as different from the other feature
selection algorithms. In the Figure 2.1, a more detailed presentation of the BT
algorithm is given.
Short Text Enrichment Methodologies
In [19], three enrichment approaches are explored. First one is the lexical-
based enrichment where word and character n-grams and orthogonal sparse word

CHAPTER 2. BACKGROUND 14
Figure 2.1: BT algorithm: selecting the positive and negative words, the best repre-senter of the documents
CHAPTER 2. BACKGROUND 15
bigrams are applied to enrich the sparse text. Second one is the external based
enrichment in which each text is enlarged with features extracted from an external
resource, such as Wikipedia. Moreover, web pages linked by URLs in the text
give useful information to expand the short text. One can also use WorldNet to
extract relationships among words. In another approach, associated words are
identified with examining collections. The closeness between words is measured
using an association measure between words based on the count of occurrence of
words and co-occurrences between pair of words.
Pinto et al.[9] present a novel methodology called self-term expansion to im-
prove the representation of short text. It is based on replacing terms of a docu-
ment with a set of co-related terms using only the corpus instead of any external
resource. In order to do this, a co-occurrence term list is constructed using the
point-wise mutual information (PMI) measure. After expanding the short text,
three different term selection techniques which are document frequency, term
strength and transition point, are used to filter unnecessary words and to de-
crease the number of them cite25.
2.2 Machine learning Methods
2.2.1 Naive Bayes
Naive Bayes is a classification algorithm based on Bayes’ Theorem that uses
conditional probabilities by counting the frequency of values and combinations
of them in a data set. It is commonly used in text categorization and works well
on it. The algorithm calculates the probability of B given A with counting the
number of cases where A and B occur together and dividing it by the number of
cases where A occurs.
For sentiment classification, when a document d, that contains m terms
f1, ..., fm is given, Naive Bayes classifier aims to find the class (positive or nega-
tive) with the highest probability with using the following formula;
CHAPTER 2. BACKGROUND 16
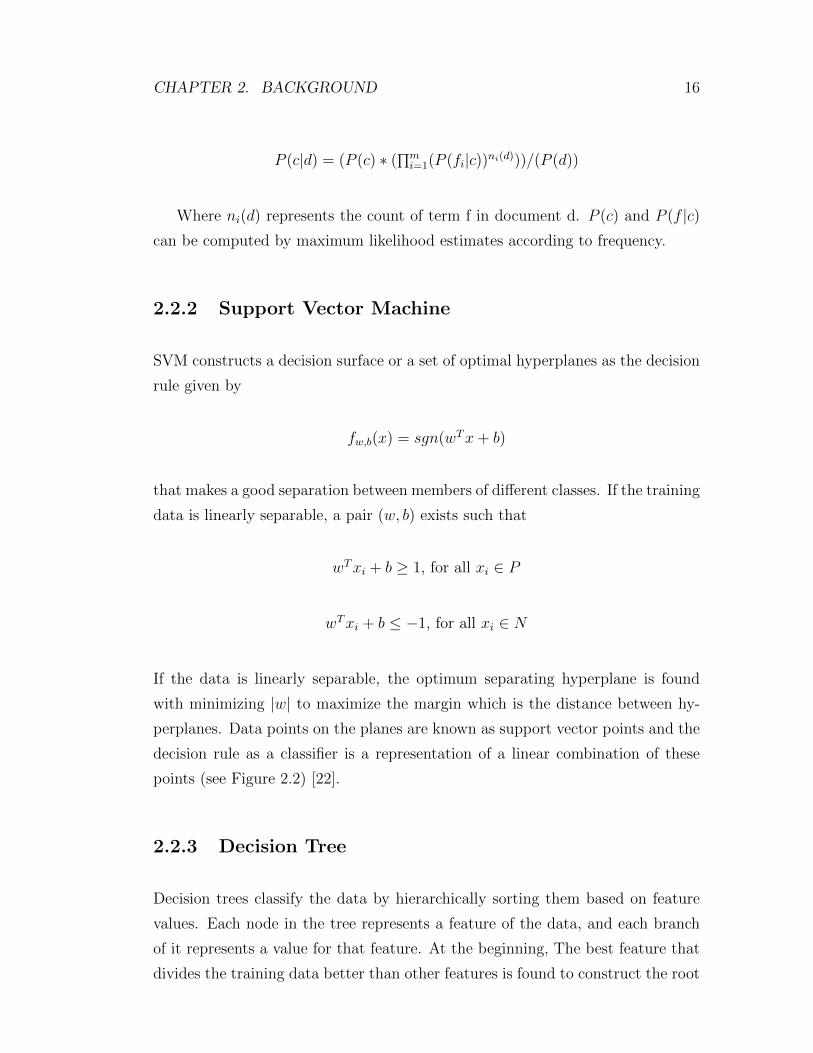
P (c|d) = (P (c) ∗ (∏m
i=1(P (fi|c))ni(d)))/(P (d))
Where ni(d) represents the count of term f in document d. P (c) and P (f |c)can be computed by maximum likelihood estimates according to frequency.
2.2.2 Support Vector Machine
SVM constructs a decision surface or a set of optimal hyperplanes as the decision
rule given by
fw,b(x) = sgn(wTx+ b)
that makes a good separation between members of different classes. If the training
data is linearly separable, a pair (w, b) exists such that
wTxi + b ≥ 1, for all xi ∈ P
wTxi + b ≤ −1, for all xi ∈ N
If the data is linearly separable, the optimum separating hyperplane is found
with minimizing |w| to maximize the margin which is the distance between hy-
perplanes. Data points on the planes are known as support vector points and the
decision rule as a classifier is a representation of a linear combination of these
points (see Figure 2.2) [22].
2.2.3 Decision Tree
Decision trees classify the data by hierarchically sorting them based on feature
values. Each node in the tree represents a feature of the data, and each branch
of it represents a value for that feature. At the beginning, The best feature that
divides the training data better than other features is found to construct the root

CHAPTER 2. BACKGROUND 17
Figure 2.2: An example of SVM, Linear separating hyperplanes for the separable case.The support vectors are circled
Figure 2.3: An example of Decision Tree

CHAPTER 2. BACKGROUND 18
node of the tree. Different methods are used to select the best feature. Most
commonly used ones are entropy and information gain measure. At each step,
the best feature is selected according to information gain which is obtained by
separating the data using the feature. Feature selection is continued until a stop
condition is obtained. New data is classified with starting from the root node of
the tree. At each node, value of the selected feature in the node of the data is
compared with the value of the branch of that node. Figure 2.3 is an example of
a decision tree [22].
Previous researches in the literature
As a baseline in this area, Pang et al. [7] classify documents according to their
sentiment as positive or negative. They use different machine learning algorithms
(Naive Bayes, maximum entropy classification and support vector machines) and
analyze their effectiveness on sentiment classification. For this work, they use
standard bag of words feature vector as f1, f2, ..., fm and compare the different
types of feature which are unigrams, bigrams, frequency-presence, part of speech
and position. According to their experiment, although accuracy results are not as
good as standard topic classification, SVM gives best results (82.9%) for sentiment
classification with unigrams and presence as feature type on the movie review
corpus.
Similar to [7], Alec et al. [17] propose an approach to classify Twitter mes-
sages as either positive or negative automatically. Instead of labeling the tweets
manually to construct training data set, they use distant supervision where each
tweet is labeled with emoticons that it includes. For instance, while tweets with
:) is labeled as positive, tweets with :( is labeled as negative. Then, they omit
emoticons from text and use other non-emotion terms as features. Additionally,
some feature reduction processes are applied to reduce the number of features.
Each term starting with @ indicates user name in Twitter that is replaced with
token ”USERNAME”. Then the links in the tweets are converted to the token
”URL”. Finally repeated letters are removed from terms. Similar to Pang et al.
[7], results of different feature types are analyzed and best accuracy results are
obtained with SVM with Unigrams and presence as feature type on the Twitter

CHAPTER 2. BACKGROUND 19
corpus.
In [34], Kim and Hovy construct a system called Crystal to analyze the pre-
dictive opinions about an election on the Web. After extracting lexical patterns
that people frequently use from opinions about a coming election posted on the
Web, SVM-based supervised learning is applied to predict the result of the elec-
tion using an n- gram feature pattern. Firstly, valence of sentence s computes
and then with combining them final valence of parties are computed and one that
has maximum valence is selected as winner.
There are also some studies that have sentiment categories different from
positive-negative. In [4], a psychological text analysis is given called Text Inves-
tigator for Psychological Disorders (TIPD). Four categories of sentiment phrases;
depressed, non-depressed, anxious and non-anxious are detected for Turkish lan-
guage. With different types of features are used to construct feature vector. These
are;
• Words mostly used by each group of documents
• Frequency of tenses used in the documents(simple present, past, perfect ...)
• Frequency values of pronouns (ben, sen, o, biz ...)
• Bag of words
A system is constructed and tested Using Naive Bayes and Support Vector
Machines as machine learning algorithm .
2.3 Clustering text based on aspects of the top-
ics
An important task of opinion mining is to extract opinions on features of a product
from online text. This is different from traditional text summarization task that

CHAPTER 2. BACKGROUND 20
a subset of sentence from review is selected or rewrite to extract main points in
the text [26].
As a simple method, reviews about a product can be clustered/categorized
based on the features of the product and then each cluster/category is assigned
to an aspect of the it. However, as a result of the high dimensionality of the data,
traditional clustering algorithms cannot perform well on text documents. Also
sparseness of the short text is a particularly challenging task, as the similarity
between two short texts usually is small or equal to zero.
To overcome this problem, different clustering algorithms are proposed. One
of them is frequent term-based text clustering [15]. Instead of using all words in
the collection as features in the feature vector, it uses low dimensional frequent
term sets, whose co-occurrences in the text is higher than a threshold. A cluster
is constructed with documents containing all terms of a frequent term set after
extracting frequent item sets using an association rule mining algorithm, Aprori .
Selection of the frequent item set for constructing cluster is done according to the
overlap and selects the one that has minimum overlap. Overlapping is calculated
based on distribution of the documents in the cluster candidates.
Extracting and Grouping Aspects of Products
There are also methods to summarize customer reviews in which different
features/aspects of a product is detected and reviews are grouped according to
these features. For extracting features of a product, different studies were done
[26, 14, 23]. Also, same features of a product can be expressed with different
words, these can be synonyms or not. For instance, picture and photo have
same meaning for cameras although appearance and design do not have the same
meaning, they can be used for same aspects of the product. So for effective
summary, extracted aspect words should be grouped. However grouping manually
is time consuming and difficult since there is so many feature expression in a text
corpus [39].
In [26], for identifying product features, association rules are used. It is
thought that in a sentence noun or noun phrase are the candidate of aspects

CHAPTER 2. BACKGROUND 21
of products. There are lots of words(noun/noun phrase) but not all of them are
directly an aspect of a product, frequent words are usually used to express an
aspect. So, after identifying part of speech tags of the word, they extract frequent
itemset of noun/ noun phrases as possible feature with running the association
miner CBA based on Apriori Algorithm. Then some of them are eliminated using
two different pruning methods. In the first one, compactness of candidate phrase
is checked with looking position of the words in the phrase and sentences and if
not it is deleted. As a second one, redundant phrase are eliminated according to
p-support value.
In [14], Popescu and Etzioni use the pointwise mutual information between
the candidate feature and product class is computed to evaluate the noun phrases
and extract the explicit features. The comparison with [26] show a precision 22%
better than Hu’s precision and a recall 3% lower than the others.
For grouping similar aspects of products, Zhai at al. [39] apply a semi-
supervised learning algorithm with using sharing words and lexical similarity.
Expectation maximization algorithm is run to assign a label to an aspect of a
feature. Besides, topic modeling approaches as a clustering algorithm can be used
for this purpose. One of the most popular topic modeling method is LDA.
According to some study [13, 40], standard Latent Dirichlet Allocation (LDA)
is not sufficient for detecting aspect in product reviews since global topics are ex-
tracted with it instead of domain aspects. To overcome this problem, different
types of LDA are proposed with applying some changes on it. In[13], an unsu-
pervised aspect extraction system is introduced as local topic modeling based on
LDA. With evaluating the output of the LDA, optimal number of the aspects is
determined. After scoring nouns based on probabilities obtained from LDA, top
k words are selected as the representatives of the aspects.
Z. Zhai et al [40] use prior knowledge as constraint in the LDA models to
improve grouping of features by LDA. They extract must link and cannot-link
constraint from the corpus. Must link indicates that two features must be in the
same group while cannot-link restricts that two features cannot be in the same
group. These constraints are extracted automatically. If at least one of the terms

CHAPTER 2. BACKGROUND 22
of two product features are same, they are considered to be in the same group as
must link. On the other hand, if two features are expressed in the same sentence
without conjunction ”and”, they are considered as different feature and should
be in different groups as cannot-link.

Chapter 3
Mixture Model for Aspect Based
Sentiment Analysis
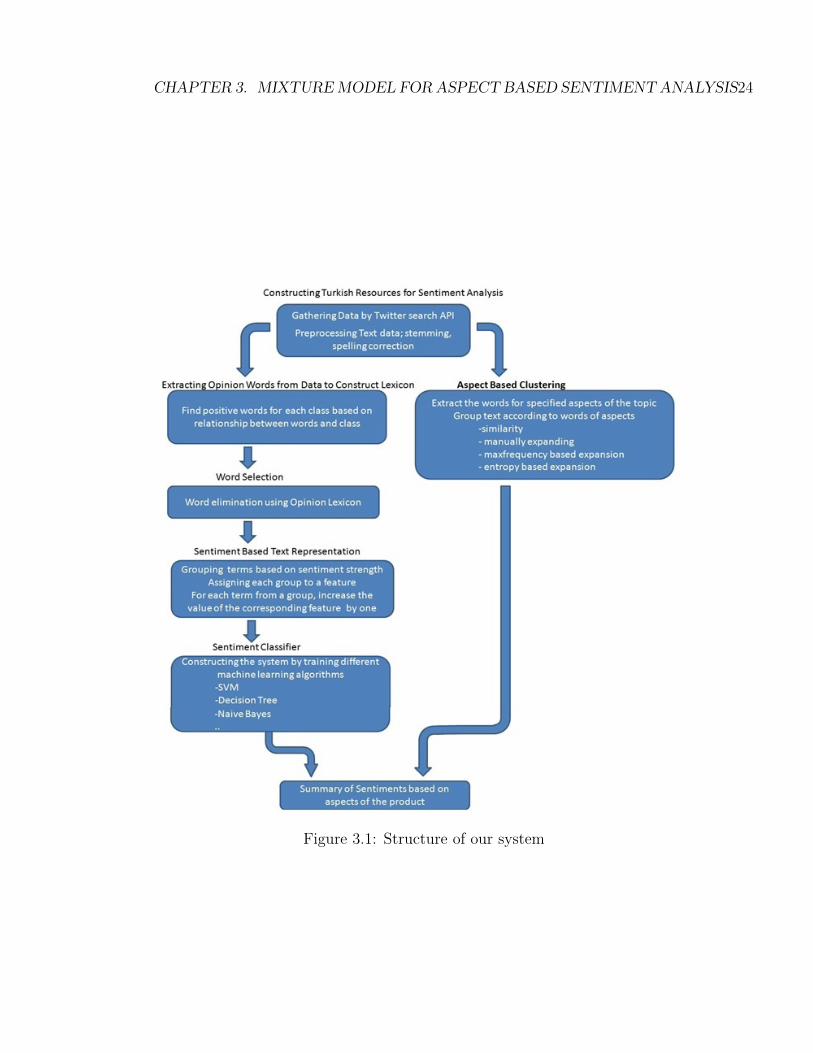
In this section, we present the steps and details of our proposed methodology, as
summarized in Figure 3.1. First, we gathered data and applied preprocessing on
them. We also applied manual labeling only for the methods that use them, as
not all do. Then, in addition to lexicon constructed manually, we construct the
opinion lexicon automatically using labeled data. After obtaining lexicon, word
selection is done according to that. Later, text data are transformed into a set
of feature vectors. For this transformation, a novel sentiment based text repre-
sentation is proposed as a new feature vector type, as discussed later. Finally, a
system is then trained and tested using a variety of machine learning algorithms.
3.1 Data
Twitter is a popular microblogging service that has several millions of users.
Each user submits periodic status updates, known as tweets, that consist of short
messages of maximum size 140 characters as informal text. Most of them include
opinions of users about several topics relevant to users daily lives. The number
of the tweets posted per day has an exponential increase as shown in [2].
23
CHAPTER 3. MIXTUREMODEL FORASPECT BASED SENTIMENT ANALYSIS24
Figure 3.1: Structure of our system

CHAPTER 3. MIXTUREMODEL FORASPECT BASED SENTIMENT ANALYSIS25
A collection of tweets is used as the corpus for our experiments and telecommu-
nication is chosen as a good example involving competition. There are three ma-
jor Turkish companies on Wireless Communication, namely Carrier-X, Carrier-Y,
and Carrier-Z. These are defined as keywords for querying tweets. Tweets posted
hourly are gathered over 3 months by querying the Twitter search API. Each
record in the corpus contains the time at which the tweet was written, user nick-
name and the actual tweet body. Firstly, over ten thousands tweets collected in
approximately a month are selected from the gathered tweets to be judged on a
5 point scale as follows for both positive and negative sentiment as in [27]. We
eliminate junk tweets that include no information about a subject because we try
to measure sentiment of users about aspects of that topic. Moreover, we remove
same tweets posted by several times from the training data. At the end, training
data set included 1420 tweets. Other tweets in the next 2 months are used in the
application part. There is no manual elimination on this part.
The following shows the 5-point scales for positive and negative sentiment
strengths respectively.
[ no positive emotion or energy] 1 - 2 - 3 - 4 - 5 [very strong positive emotion]
[no negative emotion] 1 - 2 - 3 - 4 - 5 [very strong negative emotion]
Emotions are perceived differently by individuals, because of their life expe-
riences, personality issues and genders. Two coders were selected for labeling
manually and the mean of the their results was assigned to the tweet as the la-
bels of it. These labels are used as the gold standard for our experiments. Final
manually labeled corpus includes tweets with two labels as positive and negative
sentiment strength from 1; 5 (-1; -5). According to this labeling process, we have
10 different class labels in the corpus. An example of labeled tweet:
”X tarifelerin ok gzel ama kaliten sfr bizim evi getim darda bile ful ekmiy-
orsun” p:+3 n:-4 (for this particular tweet, the positive and negative sentiment
scores are 3 and -4, respectively. It roughly states that Carrier-X has very good
deals but the quality is zero.)

CHAPTER 3. MIXTUREMODEL FORASPECT BASED SENTIMENT ANALYSIS26
Then, we generate Turkish lexicon using dictionary based approaches as our
opinion word list. After constructing a small list of opinion words manually, it is
expanded by searching in online same and significantly closer meaning dictionary
of TDK. The constructed lexicon includes 220 positive and negative words, each
with a value from 1 to 5 and -1 to-5, following the format in SentiStrength [27]
such as harika: 5, berbat: -5.
There is also a booster word list that contains words that boost or reduce the
emotion of subsequent words such as ”fazla”, ” cok”.
3.2 Preprocessing
Different processes are applied before converting text into feature vectors. As
the first one, punctuation marks are removed. Username are used as a different
feature in the tweets to see the effect of it on the sentiment. Thus, it is removed
from the text part of the tweets. Then, @user tags which are used to state another
user are replaced with only @ symbol since users are special words and may not
have any effect on the sentiment of the tweet.
There are different types of emoticons in the text. While some of them are
used to express positive sentiment, some of them are used for negative emotion.
So, they are grouped according to their corresponding sentiment value as positive,
negative and others. After searching emoticons in , the list, they are replaced
with their sentiment symbols. the list of emoticons and their symbols are given
in Table 3.1 .
Emoticon Meaning Symbol
: −), :), ;−), ; ), :)), : −)), : −D, : D, := D, :=),=),= D, Positive Post
: −(, : (, :′ (, : −|, : |, : −@, : ||, : (( Negative Negv
: −p, : p, : −S, : S, : −, :, : −o, : o Others Oth
Table 3.1: Emoticon list, their corresponding sentiments and symbols used toreplace

CHAPTER 3. MIXTUREMODEL FORASPECT BASED SENTIMENT ANALYSIS27
In addition to these, there are many words that have been misspelled, because
tweets are written informally. Hence spelling correction was also applied to iden-
tify the correct spellings of the misspelled words. Firstly, the words are checked
to see whether they are misspelled or not. If a word is not correctly written, re-
peated letters are searched in the words. Since people may write some letters of
the words more than ones to emphasize. If there are some repeated letters, these
are deleted. Then, a spell checker tries to find the correct words with comparing
misspelled one against a correctly spelled word list. During this process, if more
than one option is obtained for both stemming and spelling correction, first one
is used.
There are a lot of words using the same root with different suffixes in Turkish,
and these suffixes do not usually change the sentiment of the words that is added.
To avoid using two different features for two words with the same root but dif-
ferent suffixes, we apply a stemming process and discard the suffixes except the
negation suffix. In Turkish, negation is expressed with addition (-me-ma) to the
end of the word. If a word has a negator, the word is changed to root of the word
with extra word degil to express the negation of it. Otherwise, only the root of
it is kept.
A morphological analyzer can be used to achieve this process. We utilize
Turkish parser Zemberek [1] for capturing negation, stemming and spell checking
of the data. Zemberek is most commonly used and publicly available NLP tool
for Turkish. It is an open source program and has java libraries which can be
embedded in an application code. However it is not perfect. There are some
words that Zemberek cannot find its root or correct spelling. Thus, words like
this are left without any changes.
Furthermore, we remove stop words from the tweets. Since these words in-
cludes redundant information and do not have effect on the sentiment of the text
positively, but may have negative effect with increasing number of features. For
these processes, the stop word list from Fatih University NLP Group is used [3].
Besides, numbers in the tweet are removed from text with the idea that they have
no influence on the sentiment.

CHAPTER 3. MIXTUREMODEL FORASPECT BASED SENTIMENT ANALYSIS28
As an example of a tweet after preprocessing;
A raw tweet ;
”aaa Carrier-Z niye byle yapyorsun? Ne gerei vard imdi 5 mb internetin? Nasl
sevindim? Nasl mutluyum? Anlatamam..”
After preprocessing;
”a Carrier-Z niye boyle yap ne gerek var simdi mb internetin? Nasil sevin
nasil mutlu degil anlat”
3.3 Extracting Subtopics
To understand and summarize people’s opinions about a product, tweets are clus-
tered based on the aspects of the product. After extracting the aspects from the
data, text are grouped based on these aspects. General structure of our proposed
algorithm used to extract aspects and to cluster tweets based on extracted aspects
is given in Algorithm 1.
An LDA based approach is used to extract the aspects. As mentioned before,
standard Latent Dirichlet Allocation (LDA) is not sufficient for detecting aspect
in product reviews since global topics are extracted with it instead of domain
aspects. Therefore, after finding topics and their words, they are matched with
the manual aspects of the product given by the user.
The words of topics obtained by LDA that has higher frequency are used for
this process. From these words, one term is selected for each manual aspect as a
representative of it. However, these particular terms are not sufficient to group
the tweets and more representative terms of the aspects are needed. Since all
tweets about an aspect may not include that particular term of the aspect and
one aspect of the product can be expressed with different words. In other words,
these aspect words should be expanded to obtain better clusters. As a result of
constructing clusters using only one term for each aspect, small portion of the
data can be clustered. To cluster remaining data, we should find more words for

CHAPTER 3. MIXTUREMODEL FORASPECT BASED SENTIMENT ANALYSIS29
Algorithm 1: General structure of proposed algorithm to construct groupsof tweet based on aspects of the product
Data: A set of tweets D, A user defined threshold : pResult: WL: representative words of the aspects, groups of tweets
{D1, D2, ..., Dk}1 WL = ∅2 FWL: Extract Frequent Word List using LDA3 WL=select one word from FWL as the representative of each aspect k
aspects4 {D1, D2, ..., Dk, Dr} = find tweets of each k Aspect based on selected terms
of the aspect {Dr = remaning tweets that can not be clustered}5 Assign remaining tweets Dr To {D1, D2, Dk} based on one of the proposed
algorithms using p6 Return {D1, D2, ..., Dk, Dr}, WL
each aspect or apply different algorithm for the remaining ones.
In our first solution, we utilize similarity measures to assign remaining tweets
to the clusters. For each cluster, similarity between a tweet and tweets of the
cluster is computed and accumulated. Then it is divided by the number of the
tweets in the cluster to obtain the average similarity as the similarity between
that tweet and the cluster. After computing this for all clusters, the cluster that
has the highest similarity is found for each tweet. If the similarity of that cluster is
higher than a threshold, the tweet is assigned to that cluster. Otherwise, it is said
that the tweet is out-of-clusters. However, since tweets contain a small number
of terms as short text, any two of them do not usually include the same terms.
Thus, similarity between tweets may not always provide meaningful results.
As a second solution, we expand the representative terms of the aspects. Be-
sides expanding them manually, the dataset can be used for automatic expansion.
For expansion, two different approaches are proposed.
In the first approach, clusters are obtained with initial one representative
terms of the aspects. Then, a word list is constructed with their frequency in the
clusters. For each term in the list, ”max frequency” is computed. It is defined as
Maxfreq(WT , CI) = α ∗∑Cj∈C,j 6=i P (WT |CJ) + β ∗ p(WT |CI)

CHAPTER 3. MIXTUREMODEL FORASPECT BASED SENTIMENT ANALYSIS30
P (WT |CJ) =(Number of documents in cluster j that contains word WT (freq.
Of the WT in CJ))/(Number of the documents in cluster Cj)
It is expected that if the probability of a word being in the documents of
the Cluster Ci is high and also the total probability of the word being in the
documents of the other clusters is low, it is an important word for that cluster
and can be a representative word for it. After computing ’max frequency’ for
each term, a number of the term that has high ’max frequency’ is selected until
the number of the remaining tweets is smaller than a defined threshold p .
In our second approach, an entropy measure is used to expand representative
terms of the aspect. At the beginning, a word list is obtained with LDA. After
running LDA in some iterations, words that has higher frequency is extracted.
Each word in the list is considered as a representative term of a cluster and the
tweets that contain these words are found and then they are clustered based
on these terms. The entropy of each cluster is computed according to aspects.
For this process, representative words of aspects are used. If most of tweets in a
cluster include representative words of same aspect, the entropy of the cluster be-
comes low and the term of that cluster can be considered as associative with that
representative word of the aspect that has high frequency in the cluster. If they
include representative words of different aspects, its entropy becomes high and
term of that cluster cannot be considered as representative word of any aspect.
So, after computing entropy of each cluster, cluster that has minimum entropy
is selected and word of that cluster is associated with the representative words
of the aspect that has highest frequency in the cluster. This process is repeated
until the stopping condition is obtained. A user defined Iteration number, p, is
used as the stopping condition in this work.
After selecting one term for each aspect, tweets are grouped based on them.
Firstly, tweets that include the term are found as a separate group for each term.
Then, the group that has the highest number of tweets is selected and selection
is continued until there is no aspect that has not been selected. At the end of
this process, tweets that contain one of the representative terms of the aspect
are group to obtain a cluster for each aspect. To cluster the remaining tweets,

CHAPTER 3. MIXTUREMODEL FORASPECT BASED SENTIMENT ANALYSIS31
after expanding representative words of the aspects, tweets are assigned to groups
based on expanded word list.
3.4 Extracting Sentiment Orientation
3.4.1 Constructing sentiment word list
Constructing sentiment word list manually is time consuming. Therefore, we need
some automated methods for this process. As mentioned before, there are some
works on constructing word lists automatically using dictionary based and corpus
based approaches. They are based on co-occurrence of the words in the corpus
with the words in the seed list. Most of the time, they use unlabeled data. As an
alternative to the existing approaches, we propose to extract opinion words and
their sentiment strength from labeled corpus using relationships between words
and classes. We use different measure to calculate the relationships.
In [11], positive and negative words are selected for each document. Similar to
[11], we select only positive words for each class using equation given in definition
1 in the part 2.1.2 with different p, threshold, values. We have both 10 class values
and 10 sentiment strength values for words from 1 to 5 and -1 to -5. So, we give
class values to the selected words of that class as sentiment strength of them.
The intuition is that if a word is seen more frequently in the documents that
have high sentiment strength, sentiment strength of that words should be also
high and vice versa. Structure of the algorithm is given as Algorithm 2.
3.4.2 Twitter Sentiment strength detection
We construct two systems to measure the sentiment strength of tweets. In the
first one, lexical and machine learning approaches are combined. In the second
one, a new feature type is used to represent the tweets. In addition to these two
systems, Sentistrength [27] is configured for Turkish as the third system.

CHAPTER 3. MIXTUREMODEL FORASPECT BASED SENTIMENT ANALYSIS32
Algorithm 2: Our Proposed Sentiment Lexicon Construction Algorithm
Data: A set of tweets D, A user defined threshold : pResult: Fp(wi, c) : A set of opinion words, wi, with their sentiment
strengths, c1 WL = ∅2 for each class c do3 for each word wi ∈ D do4 if P (c|wi) > 0.5 ∗ p+ 0.5 ∗ P (c) then5 Fp = Fp ∪ {wi, c}6 end
7 end
8 end
3.4.2.1 Feature Selection Using Sentiment Lexicon
In the machine learning approach, text is converted into feature vectors using the
bag-of-words approach that construct a feature set, where each element represents
the frequency or presence of a word in the document. While this approach is
applicable to general cases, all words in the text do not contribute to the sentiment
of the text. Therefore, different feature selection methods are applied to select
a subset of the features that is sufficient for learning. We use our lexicon to
eliminate the words that do not affect the sentiment of the text. Instead of
looking only presence of these words in the tweets as in the lexical approaches,
we train a system using the words in the lexicon as the features. For this goal,
two lexicons are used. One of them is constructed manually and the other one is
constructed automatically as mentioned in the Section 3.4.1.
3.4.2.2 Opinion Based Text Representation
Different approaches are used to represent the text as feature vectors. Most
commonly used one is bag of words and it constructs high dimensional feature
vectors. Each word in the documents represents a feature in the feature vector.
However two words that have the same sentiment strength would have the same
effect on the overall strength of the text. So, we do not need to consider them
separately. For example, two synonymous words have same influence on the

CHAPTER 3. MIXTUREMODEL FORASPECT BASED SENTIMENT ANALYSIS33
sentiment strength of the text, so, it does not matter which one is in the text. A
feature can represent the presence of both of them.
Therefore, words are grouped according to their sentiment strength. Since
there are 5 groups for positive and 5 groups for negative sentiment strength of the
words, ten groups are obtained. Also one group for negation words such as degil,
hayır and one group for booster word such as ”cok”, ”fazla” are added to them.
In this new representation, each dimension of the feature vector corresponds to
each group of the words.
The emotion words from a group in the word list are searched in the text.
If found, value of the corresponding dimension of the feature vector of that text
based on sentiment strength of the emotion words is raised to 1. For instance,
the word ”guzel” has strength of 3 as the positive sentiment. If a text includes
this word, third dimension of its feature vector is increased by one. As another
example, the word ”iskence” has strength of -4 value as negative sentiment. One
is added to the value of the ninth ( 5+(-(-4)) dimension of the feature vector of
the text that contains this word. The last dimension of the feature vector is used
to represent the sentiment strength (positive-negative) of the tweet as the class
value. Here is an example of the process of the converting a text to a feature
vector.
A tweet;
”Carrier-Z tarifelerin cok guzel ama kaliten sıfır bizim evi gectim dısarda bile
full cekmiyorsun” p:3 n:−4
Feature vector of the tweet; < 0, 0, 2, 1, 0, 0, 1, 0, 1, 0, 1, 2, (2, 4) >
This shows that there are two words from group three and one word from
group 4 and so on. After constructing feature vectors of tweets according to the
proposed representation, a classifier with one of machine learning algorithms is
trained and used to find the sentiment of test data.

CHAPTER 3. MIXTUREMODEL FORASPECT BASED SENTIMENT ANALYSIS34
3.4.2.3 An Alternative Approach: Turkish Configuration of Sen-
tiStrength
In [27], a dual 5-point system for positive and negative sentiment is introduced.
It utilizes several novel methods to simultaneously measure positive and negative
sentiment strength from short informal text in English. It uses a dictionary of
sentiment words with associated strength measures from 1 to 5 as positive or
negative and exploits a range of recognized nonstandard spellings and other com-
mon textual methods of expressing sentiment. Also a machine learning approach
is used to optimize sentiment term weightings, methods for extracting sentiment
from repeated-letter nonstandard spelling informal text and a related spelling
correction method.
It is designed for English since its source are in English. To use it for Turkish
text, we changed its source. We use our lexicon that includes words with their
sentiment strength and booster and negation words, as explained before. Then
the sentiment of tweets are found with it.
Chapter 4
Experimental Testbed,
Application and Results
Tools.We utilize a list of tools for developing our system and for experimental
evaluation purposes. These are listed as follows.
• Weka. Weka [37] is an open source java library that can be used in dif-
ferent java project code. It includes several well known machine learning
algorithm as classifier used to train and test on different data set. It also
prove algorithm to convert text into feature vector.
• Zemberek. It[1] a Turkish morphological analyzer used for capturing nega-
tion, stemming and spell checking of the data. It is most commonly used
and publicly available NLP tool for Turkish. It is an open source program
and has java libraries which can be embedded in the code.
• Mallet. MALLET [28] is a Java-based package for statistical natural lan-
guage processing, document classification, clustering, topic modeling, infor-
mation extraction, and other machine learning applications to text. In this
thesis, it is used for topic modeling. The MALLET topic modeling toolkit
contains efficient, sampling-based implementations of Latent Dirichlet Al-
location, Pachinko Allocation, and Hierarchical LDA.
35

CHAPTER 4. EXPERIMENTAL TESTBED, APPLICATION ANDRESULTS36
Evaluation Measures. Precision, Recall and accuracy measure are used to
evaluate the proposed clustering and to measure the performance of classifiers
trained by proposed sentiment algorithms. Precision is obtained by dividing the
number of the relevant items by the number of relevant items in the dataset, and
Recall is obtained by dividing the number of the relevant items by the number of
retrieved(clustered). R precision is the precision obtained with retrieving R items
that is the number of the relevant items in the data set. Accuracy is defined as the
percentage of correct classification. Here are the formulas to calculate precision
and recall.
precision = number of relevant items / total number of items retrieved
recall = number of relevant items retrieved / number of relevant items in
collection
In our data set, relevant items are the tweets that are labeled as about an
aspect of the topic. We try to measure how many of them are accurately clustered
by our systems.
4.1 Experiment
4.1.1 Aspect based Clustering
To test and compare the proposed algorithms that are used to extract aspects of
the products, a pre-classified data set is needed. A manual aspect list is specified
for the product. It includes 5 aspects of the product. For evaluation, 370 tweets
are selected randomly from the sentiment data set, and classified manually based
on specified aspects of the products. One more class is used for tweets out of
these aspects. If a tweet is not about one of the specified aspects of the product,
it is classified as the remaining. 35% of the 370 tweets is out of specified aspects.
Table 4.1 shows the specified aspect of the product and their distribution in the
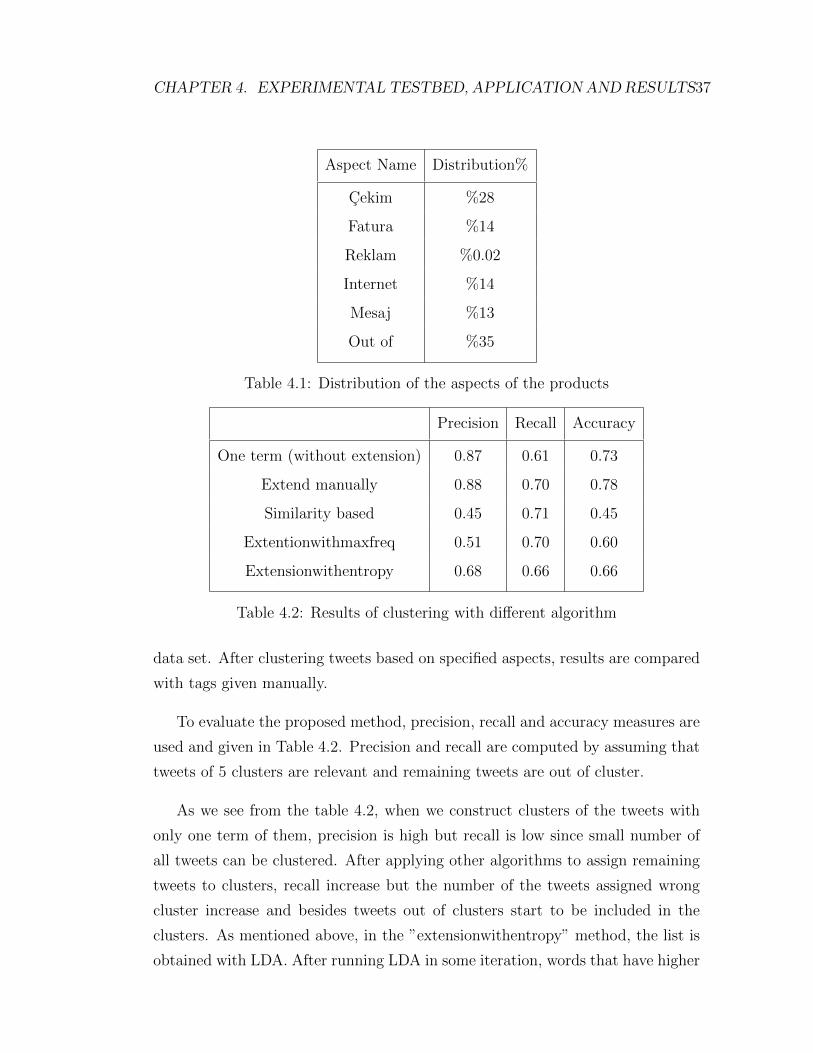
CHAPTER 4. EXPERIMENTAL TESTBED, APPLICATION ANDRESULTS37
Aspect Name Distribution%
Cekim %28
Fatura %14
Reklam %0.02
Internet %14
Mesaj %13
Out of %35
Table 4.1: Distribution of the aspects of the products
Precision Recall Accuracy
One term (without extension) 0.87 0.61 0.73
Extend manually 0.88 0.70 0.78
Similarity based 0.45 0.71 0.45
Extentionwithmaxfreq 0.51 0.70 0.60
Extensionwithentropy 0.68 0.66 0.66
Table 4.2: Results of clustering with different algorithm
data set. After clustering tweets based on specified aspects, results are compared
with tags given manually.
To evaluate the proposed method, precision, recall and accuracy measures are
used and given in Table 4.2. Precision and recall are computed by assuming that
tweets of 5 clusters are relevant and remaining tweets are out of cluster.
As we see from the table 4.2, when we construct clusters of the tweets with
only one term of them, precision is high but recall is low since small number of
all tweets can be clustered. After applying other algorithms to assign remaining
tweets to clusters, recall increase but the number of the tweets assigned wrong
cluster increase and besides tweets out of clusters start to be included in the
clusters. As mentioned above, in the ”extensionwithentropy” method, the list is
obtained with LDA. After running LDA in some iteration, words that have higher

CHAPTER 4. EXPERIMENTAL TESTBED, APPLICATION ANDRESULTS38
Figure 4.1: Precision, recall and accuracy results for clustering based on similarityversus value of threshold
frequency are extracted. For LDA, Mallet topic modeling toolkit is used.
There are thresholds of proposed algorithms and results are change accord-
ing to value of the thresholds. So, precision, recall and accuracy results versus
threshold are given in Figure 4.1 and 4.2 below.
As we see from the Figure 4.1 and 4.2, with increasing precision and accuracy
recall start to decrease. Since with assigning reaming tweets to clusters, there are
some tweets that are assigned to cluster but not be.
4.1.2 Opinion Mining
We test the new feature vectors constructed according to proposed sentiment
based text representation, called Grouped in the following and proposed algo-
rithms on the 1420 Turkish tweet data set with using cross-validation approach.
Algorithm with new representation is called as Grouped automatic when word
list is ”constructed automatically” and ”Grouped manual” when word list is con-
structed manually. Also, the algorithms that we make feature selection with
lexicons are called combination manual” and ”combination automatic”. In the

CHAPTER 4. EXPERIMENTAL TESTBED, APPLICATION ANDRESULTS39
Figure 4.2: Precision, recall and accuracy results for clustering based on maxfreqversus value of threshold
1 2 3 4 5
DistributionPositive 74.54 % 5.06% 7.24% 10.47% 2.67%
Negative 19.33% 3.51% 15.82% 43.10% 18.21%
Table 4.3: Distribution of class in the dataset
dataset, positive sentiment strength of 74.54% of the tweets is 1. The distribution
of the sentiment polarity of the tweets in the training data set is given in table
4.3.
To train classifiers and to test our new feature type and algorithm, we per-
form 10-fold cross validation using different machine leaning algorithms. These
are Support Vector Machine(SMO), SMO Logistic, Naive Bayes, Decision tree,
Decision Table, Jrip. These classification algorithms are used from Weka Data
mining tool [37]. The results were compared to the baseline majority class classi-
fication, results of classification obtained using bag of words feature vectors type
and results of SentiStrength configured for Turkish. Also effects of adding differ-
ent features such as author and time and applying preprocessing are examined
and results are given in tables below.
When we change p threshold values in the sentiment word list construction

CHAPTER 4. EXPERIMENTAL TESTBED, APPLICATION ANDRESULTS40
Figure 4.3: Accuracy results of ”grouped automatic” algorithm according to thresholdvalue for positive sentiment strength
algorithm, different words are selected. According to selected words, the results
of classifications change. Firstly, to find the best threshold value in the sentiment
word list construction and to select one of machine learning algorithms that give
best result, a test is done with different value of threshold and using different
machine learning algorithms. Accuracy results according to threshold value are
given in Figures 4.3 and 4.4. Based on this result, one of threshold value and
machine learning methods that give the best result based on baseline is selected
for other test. After selecting words, instances that do not contain any of selected
words are removed from the data set with the thought of not including useful
information. Feature vectors of them only consist of zero regardless of their class
values. So, we cannot do any learning from them. As a result of these elimination,
baseline of data set is changed according to selected words.
Then, the accuracy results of selected threshold value and machine learning
algorithm are given in Table 4.4 and 4.5 for positive and negative sentiment
strength with the results of other methods used for comparison. We select the
threshold value that gives the best result based on baseline. As we see from Fig-
ure 4.3 and 4.4, the best threshold value is 0.4 for negative sentiment strength
and 0.8 for positive. From Figure 4.3, the accuracy results of 1 for threshold
value is the highest one but baseline is also highest at that point. So, it is not the

CHAPTER 4. EXPERIMENTAL TESTBED, APPLICATION ANDRESULTS41
Figure 4.4: Accuracy results of ”grouped automatic” algorithm according to thresholdvalue for negative sentiment strength
best one. So, with looking difference between results of classifier and baseline,
the best threshold value is selected among machine learning algorithms, SMO
logistic gives best result for positive and negative sentiment strength detection
with the selected threshold values. Accuracy to within one class is also given in
the tables. There is no big difference between 2 sentiment strength such as 3 and
4 or 4 and 5. So, this measure also important for our experiment.
As we see from the Table 4.4 and 4.5, using bag of word feature types is not
sufficient for both positive and negative sentiment learning. Since all words does
not affect the sentiment of the text and much feature cause harder the learning
and get worse the results. After selecting features with using lexicon results get
better but not best. After grouping them based on their sentiment strength, we
obtain best results. Also, constructing lexicon automatically instead of manu-
ally give better results. Since it is constructed based on data set, sentiment and
strength of words may be different in different datasets. So, sentiment of words
in the lexicon constructed manually may be different from the data set, so, result
may not be good. Only constructing word list automatically get worse the results
of positive sentiment strength with combination feature type.

CHAPTER 4. EXPERIMENTAL TESTBED, APPLICATION ANDRESULTS42
Algorithms Accuracy Accuracy ±1
Baseline 74.54% 79.60%
BofW 57.45% 79.25%
SentiStrength 56.90% 73.17%
CombinationManual Lexicon 74.51% 82.78%
Automatic Lexicon 55.70% 74.54%
GroupedManual Lexicon 75.50% 82.21%
Automatic Lexicon 78.95% 86.99%
Table 4.4: Performance of algorithms on positive sentiment strength detection
Algorithms Accuracy Accuracy ±1
Baseline 43.10% 77.14%
BofW 40.08% 73.14%
SentiStrength 30.77% 47.11%
CombinationManual Lexicon 48.42% 79.71%
Automatic Lexicon 56.27% 81.59%
GroupedManual Lexicon 49.96% 81.17%
Automatic Lexicon 62.94% 84.32%
Table 4.5: Performance of algorithms on negative sentiment strength detection

CHAPTER 4. EXPERIMENTAL TESTBED, APPLICATION ANDRESULTS43
Pos ML Algorithm
Accuracy
BofWCombination Grouped
Manual Automatic Manual Autamatic
Baseline 74.54% 75.87% 74.54% 75.41% 75.02%
SVM (SVO) 71.02% 76.47% 74.05% 75.68% 78.10%
Decision Table 75.17% 76.13% 75.04% 75.85% 77.95%
Naive Bayes 68.14% 71.36% 72.01% 72.80% 78.17%
J48 74.82% 76.39% 74.89% 76.20% 78.02%
Jrip 74.26% 75.70% 74.26% 75.50% 76.59%
SMO logistic 57.45% 74.51% 55.70% 75.50% 78.95%
Table 4.6: Performance of various algorithms on positive sentiment strength de-tection (Accuracy)
Result of different machine learning algorithms
In addition to these, accuracy results of other different machine learning al-
gorithms used to train classifier and to compare results of our new feature type
with other methods and algorithms are also given in Table 4.6, 4.7, 4.8 and 4.9
for positive and negative sentiment strength.
As seen from the tables 4.6-4.9, for all machine learning algorithms, the best
result is obtained with grouped feature types that word list is constructed auto-
matically. Constructing word list automatically improve the results of grouped
feature type for all machine learning algorithms. However, for some learning algo-
rithms, results of combination feature type are decreased. When we compare the
results with baseline and results of BofW, for most of learning algorithm, results
of our four different proposed feature types is higher than baseline and results
of BofW feature type. Although there is no big improvement on the result of
positive sentiment, the increase of accuracy of positive sentiment is significantly
important, especially with ”grouped automatic” feature type.

CHAPTER 4. EXPERIMENTAL TESTBED, APPLICATION ANDRESULTS44
Pos ML Algorithm
Accuracy ±1 class
BofWCombination Grouped
Manual Automatic Manual Autamatic
Baseline 79.60% 81.32% 79.60% 80.99% 79.60%
SVM (SVO) 82.21% 83.29% 81.93% 82.65% 86.01%
Decision Table 81.43% 82.95% 81.29% 82.48% 85.30%
Naive Bayes 82.14% 82.95% 80.59% 80.56% 86.50%
J48 82.63% 83.46% 81.22% 82.65% 85.86%
Jrip 79.47% 81.50% 79.75% 81.08% 81.43%
SMO logistic 79.25% 82.78% 74.54% 82.21% 86.99%
Table 4.7: Performance of various algorithms on positive sentiment strength de-tection (Accuracy ±1 class)
Pos ML Algorithm
Accuracy
BofWCombination Grouped
Manual Automatic Manual Autamatic
Baseline 43.10% 43.47% 44.52% 43.41% 43.10%
SVM (SVO) 43.95% 49.28% 56.59% 48.47% 61.11%
Decision Table 47.96% 48.42% 40.07% 47.34% 55.98%
Naive Bayes 40.50% 47.06% 51.41% 47.17% 61.04%
J48 41.49% 48.76% 50.77% 49.26% 59.70%
Jrip 45.21% 48.68% 47.53% 46.38% 59.99%
SMO logistic 40.08% 48.42% 56.27% 49.96% 62.94%
Table 4.8: Performance of various algorithms on negative sentiment strengthdetection (Accuracy)

CHAPTER 4. EXPERIMENTAL TESTBED, APPLICATION ANDRESULTS45
Pos ML Algorithm
Accuracy ±1 class
BofWCombination Grouped
Manual Automatic Manual Autamatic
Baseline 77.14% 79.19% 77.61% 78.72% 77.14%
SVM (SVO) 74.54% 80.05% 81.59% 80.12% 84.25%
Decision Table 79.18% 82.01% 79.37% 80.99% 82.49%
Naive Bayes 75.53% 79.62% 79.92% 78.73% 84.25%
J48 72.22% 81.33% 80.56% 80.47% 82.91%
Jrip 77.85% 81.50% 78.97% 79.25% 84.67%
SMO logistic 73.14% 79.71% 81.59% 81.17% 84.32%
Table 4.9: Performance of various algorithms on negative sentiment strengthdetection (Accuracy ±1 class)
Comparison of effect of preprocessing and different feature types
As we see from the table 4.10 and 4.11, especially for negative sentiment
strength, preprocessing step has an important effect on the result. It increases the
accuracy of all classifiers for negative sentiment strength. For positive sentiment,
it improves the result of classifier that use grouped feature type with automatic
word list construction.
To understand the effect of author and time information on the sentiment of
the text, we add an extra feature to feature vector to represent the author ad
time information of the text. The intuition of author feature is that, most of the
time, authors have an opinion about a topic that they like or dislike. So, it is
expected that adding author feature increase the accuracy. However, there is no
significant changes on the result and while some of classifier get worse a little,
some of them get better with adding author or time feature.

CHAPTER 4. EXPERIMENTAL TESTBED, APPLICATION ANDRESULTS46
Accuracy
BofWCombination Grouped
Manual Automatic Manual Autamatic
Standard 57.45% 76.47(75.87)% 75.04(74.54)% 75.50(75.41)% 78.95(75.02)%
Without Pre-processing
55.32% 76.63(76.73)% 75.14(74.64)% 74.40(74.39)% 76.85(74.87)%
Author 56.82% 75.10(74.54)% 75.03(74.54)% 75.67(75.41)% 79.09(75.01)%
Time 56.82% 75.10(74.54)% 75.03(74.54)% 75.67(75.41)% 79.09(75.01)%
Table 4.10: Performance of various algorithms on positive sentiment strengthdetection (Baseline)
Accuracy
BofWCombination Grouped
Manual Automatic Manual Autamatic
Standard 40.08% 49.28(43.47)% 56.27(44.52)% 49.95(43.41)% 62.94(43.10)%
Without Pre-processing
38.20% 44.15(43.86)% 51.66(44.20)% 45.96(42.33)% 61.60(43.46)%
Author 39.78% 47.46(43.10)% 53.86(43.10)% 50.13(43.41)% 61.88(43.10)%
Time 40.68% 47.25(43.10)% 54.14(43.10)% 49.78(43.41)% 62.23(43.10)%
Table 4.11: Performance of various algorithms on negative sentiment strengthdetection (Baseline)

CHAPTER 4. EXPERIMENTAL TESTBED, APPLICATION ANDRESULTS47
4.2 Application
As we see from Figure 4.5, number of tweets changes over the time. There are
different reasons of this changing. These reason may also have effect on the
opinion of the people. So, sentiment of products are changed over the time.
Aspect based review summary
Using the proposed tools, one can summarize the sentiments of the tweets by
clustering them according to their topics and then finding sentiment strength of
each of them. Table 12 shows an example of summarized results for our 3 different
carriers. We show average of positive and negative sentiment strength of tweets
in two sub topics of our data set that contains tweets written about 3 different
telecommunication brands in Turkey. With these results, we can compare sub
topics of a brand, we can understand that which part of a brand is liked or
disliked and also we can compare different brands based on one aspect.
In our dataset, each tweet has 2 labels as positive and negative sentiment
strength. As an aggregate measure, we define a z value for a day as the proportion
of average of positive sentiment strength of tweets written in a day ’d’ about an
aspect ’a’ of the topic. If it is higher than 1, people are more positive but it is
lower than 1 people are more negative about that aspect in that day. Also higher
z value states higher positive sentiment while comparing two aspects or topics.
Zd,a = avgpd,a/avgnd
Figure 4.5: Number of tweets over 2 months

CHAPTER 4. EXPERIMENTAL TESTBED, APPLICATION ANDRESULTS48
Average of positive sentiment strength of tweets written in day d about aspect a
avgpd,a = (∑
i∈d,a pi)/t
Average of negative sentiment strength of tweets written in day d about as-
pect a
avgnd,a = (∑
i∈d,a ni)/t
pi: positive sentiment strength of tweet in written in day d about aspect a
ni: negative sentiment strength of tweet in written in day d about aspect a
For instance, according to the results given in Table 4.12, the strength of
positive sentiment expressed about the quality aspect of Carrier-Z is higher than
its cost aspect, and the strength of negative sentiment expressed about quality
of Carrier-Z is lower than about its cost.
Quality Cost General
P N Z P N Z P N Z
X(a) 0.75 2.25 0.33 0.43 2.62 0.16 0.54 2.46 0.22
Y(v) 1.43 1.60 0.89 0.74 2.18 0.34 1.12 1.75 0.64
Z(t) 1.15 1.62 0.71 0.98 1.85 0.53 1.20 1.75 0.69
Table 4.12: Average of positive, negative sentiment strength and z value of twoaspects, quality and cost, and general of three brands
Aspect Sentiment Life Cycle
After extracting aspects of the products and clustering tweets based on these
aspects, each tweet is associated with positive and negative sentiment strength.
From the sentiment strength dynamics of a topic, the user can get deeper un-
derstanding of how the opinions about a topic or one specific aspect of the topic

CHAPTER 4. EXPERIMENTAL TESTBED, APPLICATION ANDRESULTS49
Figure 4.6: Z value of Quality aspect of tree brands over time
change over time, which aspect of the topic is best or worst. In figure 14,15 and
16, examples of results of application are given. We apply a simple moving av-
erage to smooth out short-term fluctuations and highlight longer-term trends or
cycle.
Zsma,i = Zi−1 + Zi + Zi+1
In Figure 4.6 and 4.7 z value of quality and cost aspects of 3 different brands
during about 2 months are given. With these figures, we can see that people do
not like both aspect of brand x. Moreover, at the beginning, people find better
quality of brand z than quality of brand y but after a while it gets worse than
the other. In Figure 4.8 z value of quality and cost aspects of Carrier-y during
about 2 months are given. as we understand from the figure, while people like
quality of it, they do not satisfied with the cost of it.

CHAPTER 4. EXPERIMENTAL TESTBED, APPLICATION ANDRESULTS50
Figure 4.7: Z value of Cost aspect of tree brands over time
Figure 4.8: Z value of two aspect of brand y over time

Chapter 5
Conclusion
In this thesis, we constructed a system for extracting aspect based sentiment
summaries on Turkish tweets. Our work represents the first study of this type
on informal short text. For extracting aspects of topics and finding sentiments,
a methodology is presented which can be applied to other languages. Our algo-
rithms are tested on Turkish tweet data collected over time via Twitter API.
To construct sentiment summaries, the aspects are extracted and the tweets
are grouped according to these aspects. Manually extracted aspect list are ex-
panded with algorithms to assign tweets to groups. After clustering the tweets,
their opinion polarity are determined as their sentiment strength. Novel feature
types are proposed for sentiment extraction, and feature selection is applied using
sentiment lexicons, where novel methods are proposed to construct the lexicon.
The performance evaluation illustrates significant improvements over the methods
adapted from the literature.
We built an overall system that puts all the pieces together to enable analyses
and generate useful aspect based sentiment summaries.
51

Bibliography
[1] Zemberek. an open source nlp library for turkic languages,
http://code.google.com/p/zemberek/, 2009.
[2] Twitters exponential growth, http://memex.naughtons.org/archives/2010/09/15/11815,
2012.
[3] Turkish stop word list 1.1, http://nlp.ceng.fatih.edu.tr/?p=101, January
26th, 2010.
[4] N. B. ALBAYRAK. Opinion and sentiment analysis using natural language
processing techniques. Master’s thesis, Fatih University, 2011.
[5] D.-T. Asli Celikyilmaz and J. Feng. Probabilistic model-based sentiment
analysis of twitter messages. In Proceedings of the IEEE Workshop on Spoken
Language Technology, P. 7984.
[6] E. D. H. F. M. D. Bharath Sriram, D.F. Short text classification in twitter
to improve information filtering. the 33rd annual international ACM SIGIR
conference on Research and development in information retrieval, 2010.
[7] S. V. Bo Pang, L.L., editor. Thumbs up? Sentiment Classification using
Machine Learning Techniques, 2002.
[8] P. Casoto. Sentiment Analysis for the Italian language. PhD thesis, Udina
Univ.,Udina, 2011.
[9] P. D. Pinto and H. Jimenez. A self-enriching methodology for clustering nar-
row domain short texts. The Computer Journal, doi:10.1093/comjnl/bxq069,
2010.
52

BIBLIOGRAPHY 53
[10] T. O. Davidov, D. and A. Rappoport. Enhanced sentiment learning using
twitter hashtags and smileys. In COLING.
[11] D. Dimitris Fragoudis. Spiridon likothanassis, best terms: an efficient
feature-selection algorithm for text categorization. Knowledge and Infor-
mation Systems, 2005.
[12] B. L. Ding, X. and P. S. Yu. A holistic lexicon-based approach to opinion
mining. In Proceedings of WSDM 2008.
[13] S. Elhadad. An unsupervised aspect-sentiment model for online reviews. In
Human Language Technologies: The 2010 Annual Conference of the North
American Chapter of the Association for Computational Linguistics.
[14] A. Etzioni. Extracting product features and opinions from reviews. In
the Conference on Empirical Methods in Natural Language Processing
(EMNLP).
[15] M. F. Beil and X. Xu. Frequent term-based text clustering. In 8th Int. Conf.
On Knowledge Discovery and Data Mining (KDD)2002. Edmonton, Alberta,
Canada.
[16] L. Feng. Robust sentiment detection on twitter from biased and noisy data.
In Proceedings of the 23rd International Conference on Computational Lin-
guistics(COLING).
[17] R. B. Go, A. and L. Huang. Twitter sentiment classification using distant
supervision. Technical report, Stanford Digital Library Technologies Project,
2009.
[18] M. K. Hatzivassiloglou, V. Predicting the semantic orientation of adjectives.
In Proceedings of the 35th Annual Meeting of the ACL and the 8th Conference
of the European Chapter of the ACL, New Brunswick, NJ. P. 174-181.
[19] J. Kamath, K.Y.C. Expert-driven topical classification of short message
streams. In Privacy, Security, Risk and Trust (PASSAT), 2011 IEEE Third
International Conference on and 2011 IEEE Third International Confernece
on Social Computing (socialcom).

BIBLIOGRAPHY 54
[20] M. M. M. R. J. Kamps, J. Using wordnet to measure semantic orientation
of adjectives. In LREC 2004. IV: p. 1115-1118.
[21] I. D. Kennedy, A. Sentiment classiffication of movie and product reviews
using contextual valence shifters. In Computational Intelligence, p. 110-125.
[22] S. Kotsiantis. Supervised machine learning: A review of classification tech-
niques. Informatica 31, 2007.
[23] S. H. L. L. Zhang, B.L. and E. O’Brien-Strain. Extracting and ranking
product features in opinion documents. In the 23rd International Conference
on Computational Linguistics: Posters, COLING ’10.
[24] B. Lee. Opinion mining and sentiment analysis. In Foundations and Trends
in Information Retrieval.
[25] B. Liu. Sentiment analysis and subjectivity. In In Handbook of Natural
Language Processing.
[26] M. Liu. Mining and summarizing customer reviews. In KDD, Seattle, WA.
P. 168177.
[27] G. P. D. C. M. Thelwall, K. Buckley and A. Kappas. Sentiment strength
detection in short informal text. In Journal of the American Society for
Information Science and Technology.
[28] A. Mccallum. Mallet: A machine learning for language toolkit,
http://mallet.cs.umass.edu, 2002.
[29] D. Mladenic. Feature subset selection in text-learning. In the 10th European
Conference on Machine Learning ECML98.
[30] P. H. . I. M. Neviarouskaya, A. Textual affect sensing for sociable and
expressive online communication. In Lecture Notes in Computer Science, p.
218-229.
[31] L. Pang, B. Lee. Seeing stars: Exploiting class relationships for sentiment
categorization with respect to rating scales. In Proceedings of the 43rd Annual
Meeting of the ACL.

BIBLIOGRAPHY 55
[32] M. Peter D. Turney. Unsupervised learning of semantic orientation from a
hundred-billion-word corpus. In Corr.
[33] M. Riesenfeld. Wordnet: An electronic lexical database. In In Proceedings
of 11th Eurographics Workshop on Rendering. MIT Press.
[34] E. Soo-Min Kim. Crystal: Analyzing predictive opinions on the web. In the
2007 Joint Conference on Empirical Methods in Natural Language Processing
and Computational Natural Language Learning.
[35] D. D. C. S. M. S. O. D. M. STONE, P.J. The general inquirer: A computer
approach to content analysis. In The MIT Press.
[36] P. Turney. Thumbs up or thumbs down? semantic orientation applied to
unsupervised classification of reviews. In Proceedings of the 40th Annual
Meeting of the Association forcomputational Linguistics (ACL), P. 417-424.
[37] I. Witten and F. E. Data Mining: Practical machine learning tools and
techniques, 2005.
[38] J. Y. Yang mid. A comparative study on feature selection in text catego-
rization. In International Conference on Machine Learning (ICML).
[39] H. X. P. J. Zhongwu Zhai, B.L. Clustering product features for opinion
mining. WSDM 2011, .
[40] H. X. P. J. Zhongwu Zhai, B.L. Constrained lda for grouping product features
in opinion mining. PAKDD, 2011.