Embed Size (px)
Citation preview
ASML 2015 Second Quarter Results
July 15, 2015
ASML reports Q2 results in line with guidance on track for record 2015 sales
Veldhoven, the Netherlands
Public
15 July 2015
Slide 2
Public
Forward looking statements
This document contains statements relating to certain projections and business trends that are forward-looking, including statements with
respect to our outlook, including expectations for the third quarter and second half of 2015, backlog, expected customer demand in
specified market segments including memory, logic and foundry, expected trends, expected levels of service sales, systems backlog,
expected financial results, including expected sales, other income, gross margin, earnings per share and R&D and SG&A expenses and
effective tax rate, annual revenue opportunity for ASML, productivity of our tools and systems performance, TWINSCAN and EUV system
performance (such as endurance tests), expected industry trends, statements with respect to expected system shipments, including the
number of EUV systems expected to be shipped and timing of shipments and other EUV targets (including availability, productivity and
shipments), the expected continuation of Moore's law, expected annual revenue growth and goals for holistic lithography, intention to
return excess cash to shareholders, and statements about our dividend policy and intention to repurchase shares. You can generally
identify these statements by the use of words like "may", "will", "could", "should", "project", "believe", "anticipate", "expect", "plan",
"estimate", "forecast", "potential", "intend", "continue" and variations of these words or comparable words.
These statements are not historical facts, but rather are based on current expectations, estimates, assumptions and projections about the
business and our future financial results and readers should not place undue reliance on them. Forward-looking statements do not
guarantee future performance and involve risks and uncertainties. These risks and uncertainties include, without limitation, economic
conditions, product demand and semiconductor equipment industry capacity, worldwide demand and manufacturing capacity utilization
for semiconductors (the principal product of our customer base), including the impact of general economic conditions on consumer
confidence and demand for our customers' products, competitive products and pricing, the impact of manufacturing efficiencies and
capacity constraints, performance of our systems, the continuing success of technology advances and the related pace of new product
development and customer acceptance of new products, the number and timing of EUV systems expected to be shipped and recognized
in revenue, our ability to enforce patents and protect intellectual property rights, the risk of intellectual property litigation, availability of raw
materials and critical manufacturing equipment, trade environment, changes in exchange rates, changes in tax rates, available cash,
distributable reserves for dividend payments and share repurchases, and other risks indicated in the risk factors included in ASML's
Annual Report on Form 20-F and other filings with the US Securities and Exchange Commission. These forward-looking statements are
made only as of the date of this document. We do not undertake to update or revise the forward-looking statements, whether as a result
of new information, future events or otherwise.

• Investor key messages
• Business highlights
• Business environment
• Outlook
• Technology highlights
• Financial statements
Agenda
15 July 2015
Slide 3
Public
Investor key messages
15 July 2015
Slide 4
Public
Investor key messages
• Shrink is the key industry driver supporting innovation and providing long term industry growth
• Moore’s Law will continue and be affordable
• Lithography enables affordable shrink and therefore delivers compelling value for our customers
• ASML’s strategy of large R&D investments in lithography product roadmaps supports future
industry needs
• DUV product improvement roadmaps and Holistic Litho enable multi-pass immersion patterning
today, with Holistic Litho supporting EUV in future. These highly differentiated products provide
unique value drivers for us and our customers
• EUV faces normal new technology introduction challenges but its adoption is now a matter of
WHEN not IF. EUV will continue to enable Moore’s Law and will drive long term value for ASML
• ASML models an annual revenue opportunity of €10 billion by 2020 and given the significant
leverage in our financial model this will allow a potential tripling of EPS by the end of this decade
thereby creating significant value for all stakeholders
• We expect to continue to return excess cash to our shareholders through dividends that are
stable or growing and regularly timed share buybacks in line with our policy
Slide 5
Public
15 July 2015
Business highlights
15 July 2015
Slide 6
Public
15 July 2015
Slide 7
Public
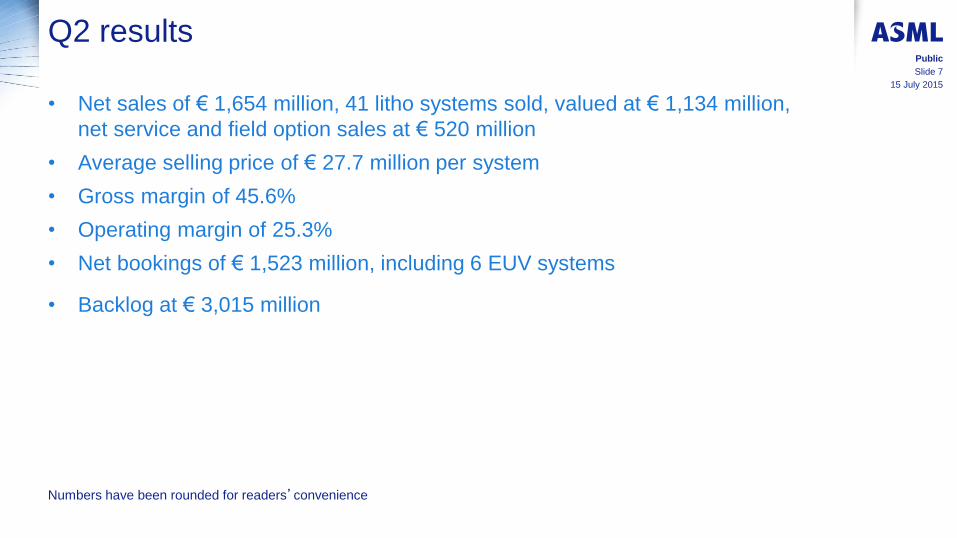
Q2 results
• Net sales of € 1,654 million, 41 litho systems sold, valued at € 1,134 million,
net service and field option sales at € 520 million
• Average selling price of € 27.7 million per system
• Gross margin of 45.6%
• Operating margin of 25.3%
• Net bookings of € 1,523 million, including 6 EUV systems
• Backlog at € 3,015 million
Numbers have been rounded for readers’convenience
15 July 2015
Slide 8
Public
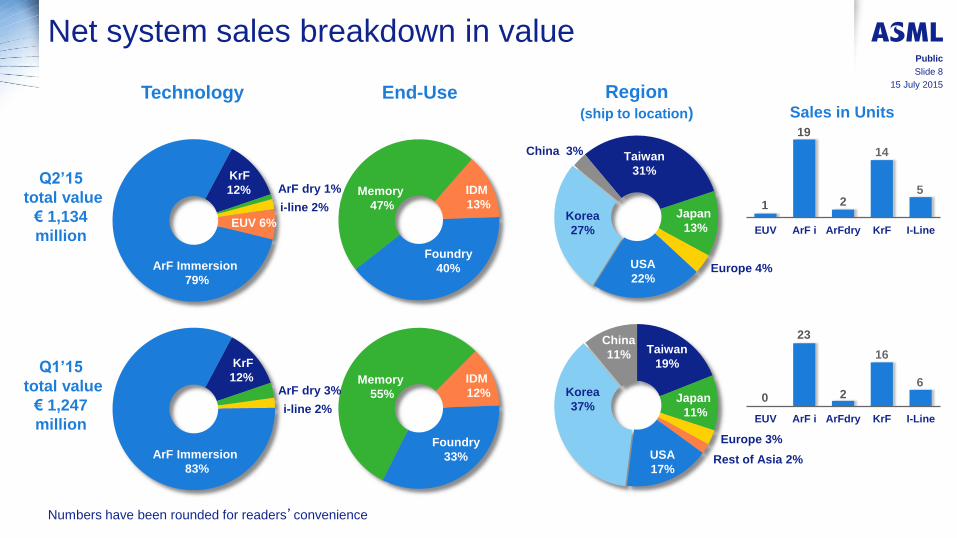
Net system sales breakdown in value
Foundry
40%
Memory
47%
IDM
13%
End-Use
Numbers have been rounded for readers’convenience
Korea
27%
Taiwan
31%
USA
22%
Region (ship to location)
Japan
13%
Technology
ArF Immersion
79%
KrF
12%
i-line 2%
ArF dry 1% Q2’15
total value
€ 1,134
million EUV ArF i ArFdry KrF I-Line
Sales in Units 19
14
1 2 5
Europe 4%
China 3%
Foundry
33%
Memory
55%
IDM
12%
China
11%
Korea
37%
Taiwan
19%
USA
17% Rest of Asia 2%
Japan
11%
ArF Immersion
83%
KrF
12%
i-line 2%
ArF dry 3%
Q1’15
total value
€ 1,247
million EUV ArF i ArFdry KrF I-Line
23
16
0 2
EUV 6%
Europe 3%
6
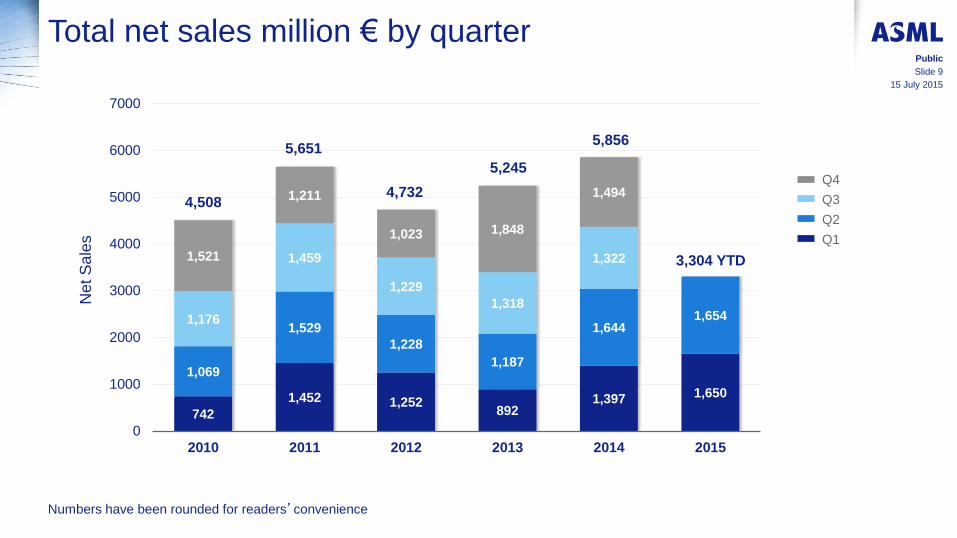
742
1,452 1,252 892
1,397 1,650
1,069
1,529
1,228
1,187
1,644 1,654 1,176
1,459
1,229
1,318
1,322 1,521
1,211
1,023 1,848
1,494
0
1000
2000
3000
4000
5000
6000
7000
2010 2011 2012 2013 2014 2015
Net S
ale
s
3,304 YTD
15 July 2015
Slide 9
Public
Total net sales million € by quarter
Numbers have been rounded for readers’convenience
4,508
5,651
Q4
Q3
Q2
Q1
4,732
5,245
5,856
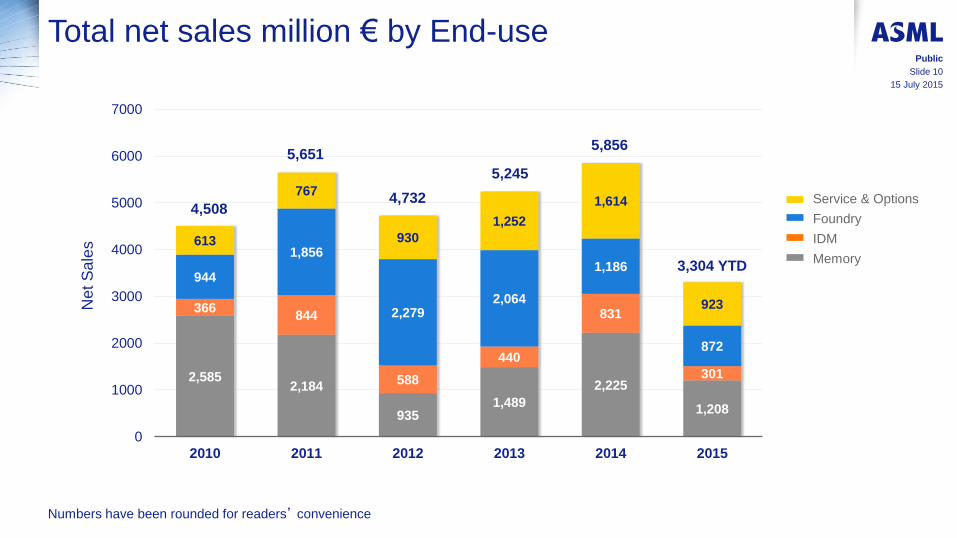
2,585 2,184
935 1,489
2,225
1,208
366 844
588
440
831
301
944
1,856
2,279 2,064
1,186
872
613
767
930
1,252
1,614
923
0
1000
2000
3000
4000
5000
6000
7000
2010 2011 2012 2013 2014 2015
Net S
ale
s
3,304 YTD
15 July 2015
Slide 10
Public
Total net sales million € by End-use
Numbers have been rounded for readers’ convenience
4,508
5,651
Service & Options
Foundry
IDM
Memory
4,732
5,245
5,856
15 July 2015
Slide 11
Public
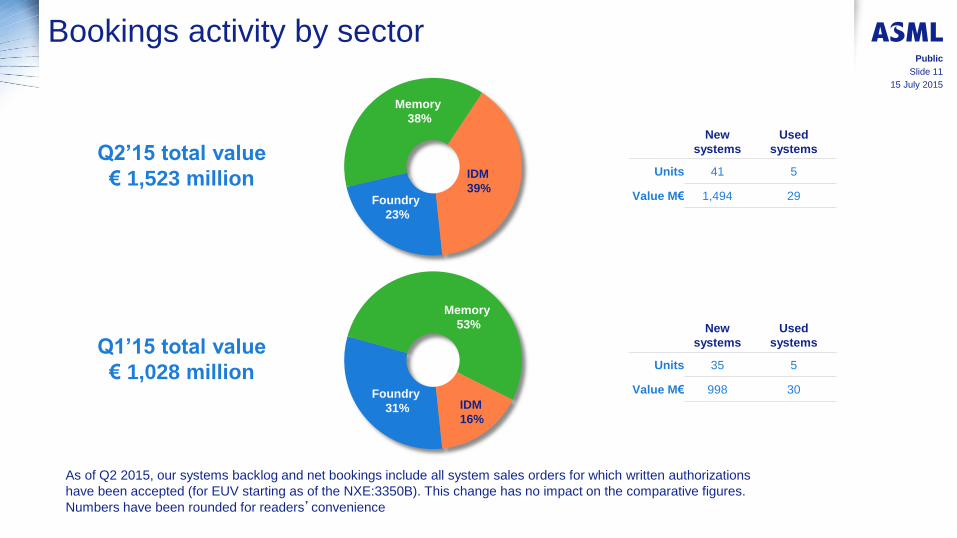
Bookings activity by sector
IDM
39%
Memory
38%
Foundry
23%
Q2’15 total value
€ 1,523 million
New
systems
Used
systems
Units 41 5
Value M€ 1,494 29
IDM
16%
Memory
53%
Foundry
31%
Q1’15 total value
€ 1,028 million
New
systems
Used
systems
Units 35 5
Value M€ 998 30
As of Q2 2015, our systems backlog and net bookings include all system sales orders for which written authorizations
have been accepted (for EUV starting as of the NXE:3350B). This change has no impact on the comparative figures.
Numbers have been rounded for readers’convenience
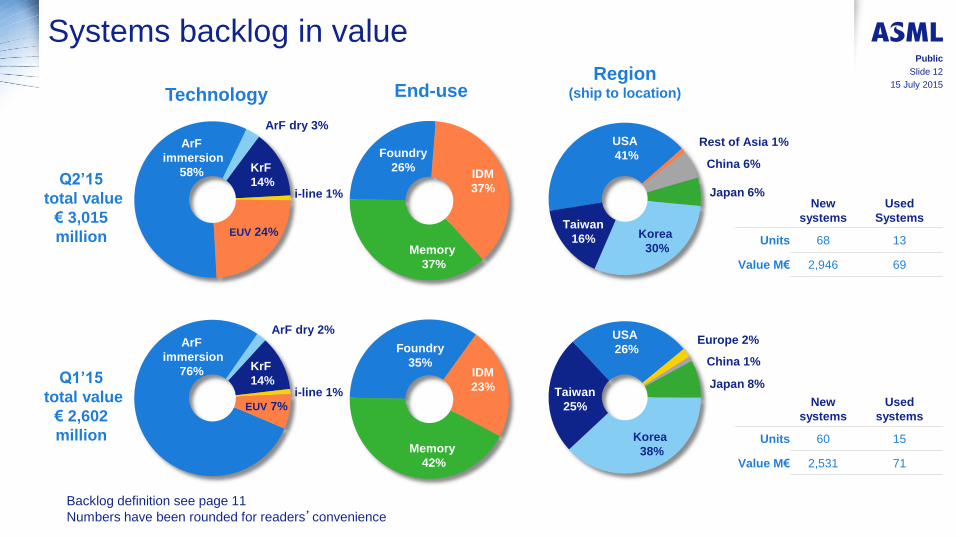
New
systems
Used
Systems
Units 68 13
Value M€ 2,946 69
15 July 2015
Slide 12
Public
Systems backlog in value
Backlog definition see page 11
Numbers have been rounded for readers’convenience
End-use
Foundry
26%
Memory
37%
IDM
37%
Technology
ArF
immersion
58% KrF
14%
ArF dry 3%
i-line 1%
EUV 24%
Q2’15
total value
€ 3,015
million
Region (ship to location)
USA
41%
Korea
30%
China 6%
Japan 6%
Taiwan
16%
New
systems
Used
systems
Units 60 15
Value M€ 2,531 71
Foundry
35%
Memory
42%
IDM
23%
ArF
immersion
76% KrF
14%
ArF dry 2%
i-line 1% EUV 7%
Q1’15
total value
€ 2,602
million
USA
26%
Korea
38%
Europe 2%
China 1%
Japan 8% Taiwan
25%
Rest of Asia 1%
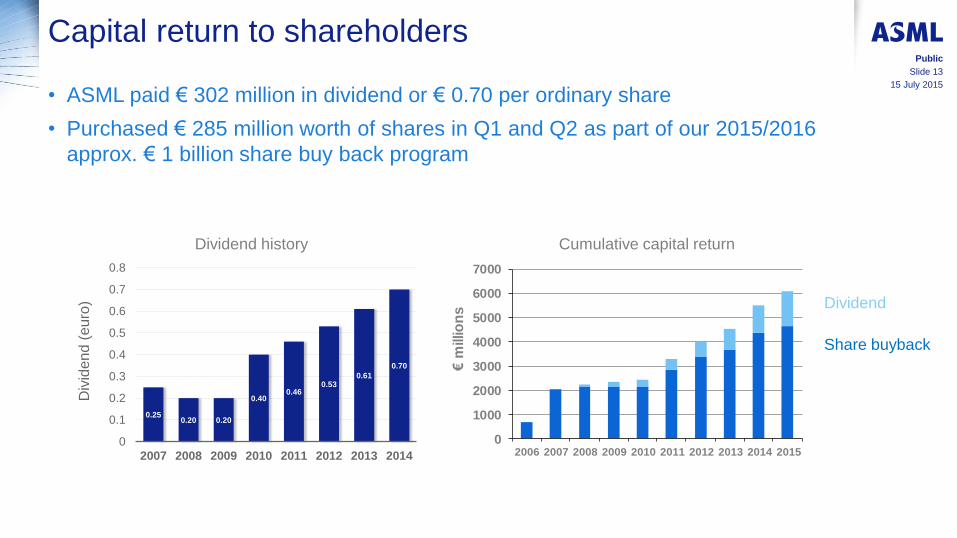
Capital return to shareholders
• ASML paid € 302 million in dividend or € 0.70 per ordinary share
• Purchased € 285 million worth of shares in Q1 and Q2 as part of our 2015/2016
approx. € 1 billion share buy back program
15 July 2015
Public
Slide 13
0.25 0.20 0.20
0.40 0.46
0.53 0.61
0.70
0
0.1
0.2
0.3
0.4
0.5
0.6
0.7
0.8
2007 2008 2009 2010 2011 2012 2013 2014
Div
iden
d (
euro
)
Dividend history
0
1000
2000
3000
4000
5000
6000
7000
2006 2007 2008 2009 2010 2011 2012 2013 2014 2015€
mill
ion
s
Cumulative capital return
Dividend
Share buyback
Business environment
15 July 2015
Slide 14
Public
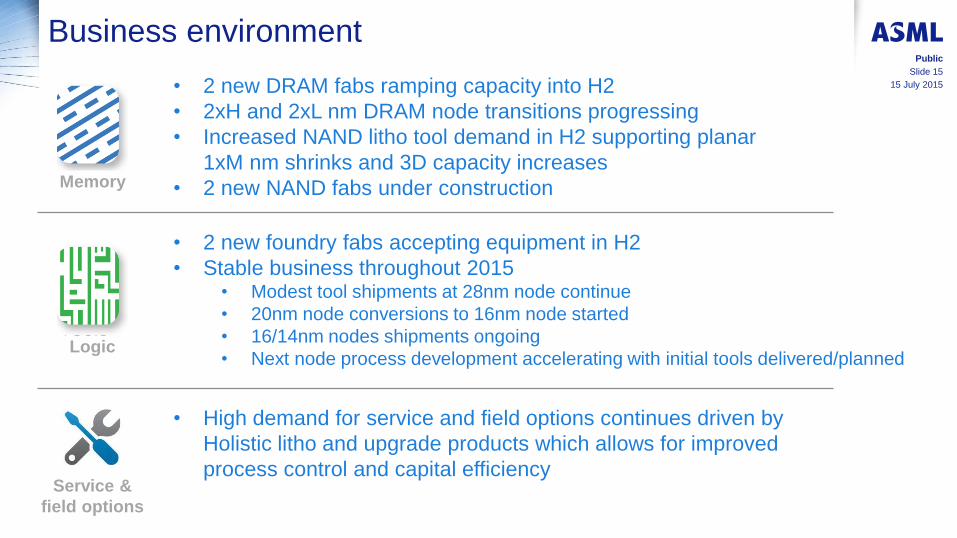
Business environment
15 July 2015
Public
Slide 15
• 2 new foundry fabs accepting equipment in H2
• Stable business throughout 2015 • Modest tool shipments at 28nm node continue
• 20nm node conversions to 16nm node started
• 16/14nm nodes shipments ongoing
• Next node process development accelerating with initial tools delivered/planned
• 2 new DRAM fabs ramping capacity into H2
• 2xH and 2xL nm DRAM node transitions progressing
• Increased NAND litho tool demand in H2 supporting planar
1xM nm shrinks and 3D capacity increases
• 2 new NAND fabs under construction Memory
Service &
field options
• High demand for service and field options continues driven by
Holistic litho and upgrade products which allows for improved
process control and capital efficiency
Logic

Outlook
15 July 2015
Slide 16
Public
15 July 2015
Slide 17
Public
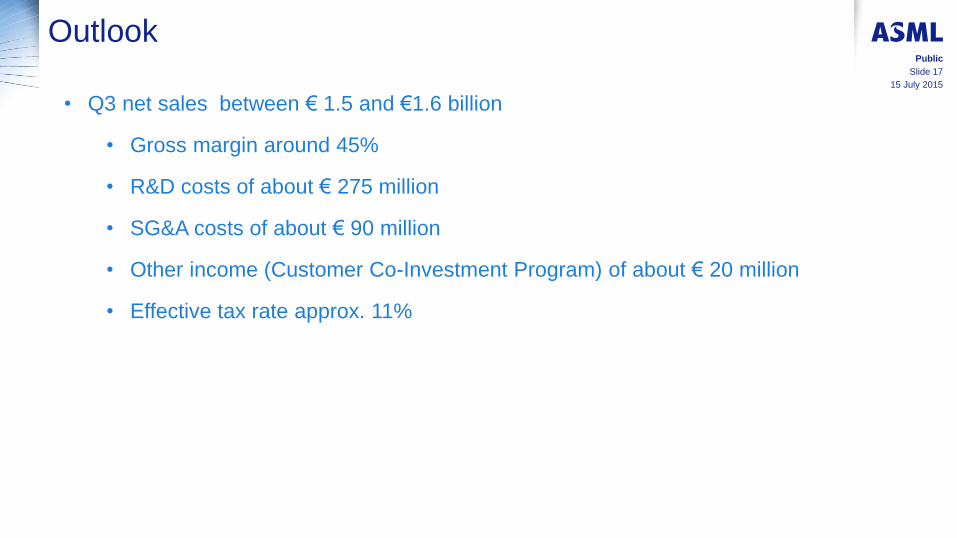
Outlook
• Q3 net sales between € 1.5 and €1.6 billion
• Gross margin around 45%
• R&D costs of about € 275 million
• SG&A costs of about € 90 million
• Other income (Customer Co-Investment Program) of about € 20 million
• Effective tax rate approx. 11%

Technology highlights
15 July 2015
Slide 18
Public

EUV program: priorities for 2015
15 July 2015
Slide 19
Public
In 2015, we will focus on:
• Improving stability and availability
• Continuing progress on productivity
• Shipping the NXE:3350B, our 4th
generation EUV tool
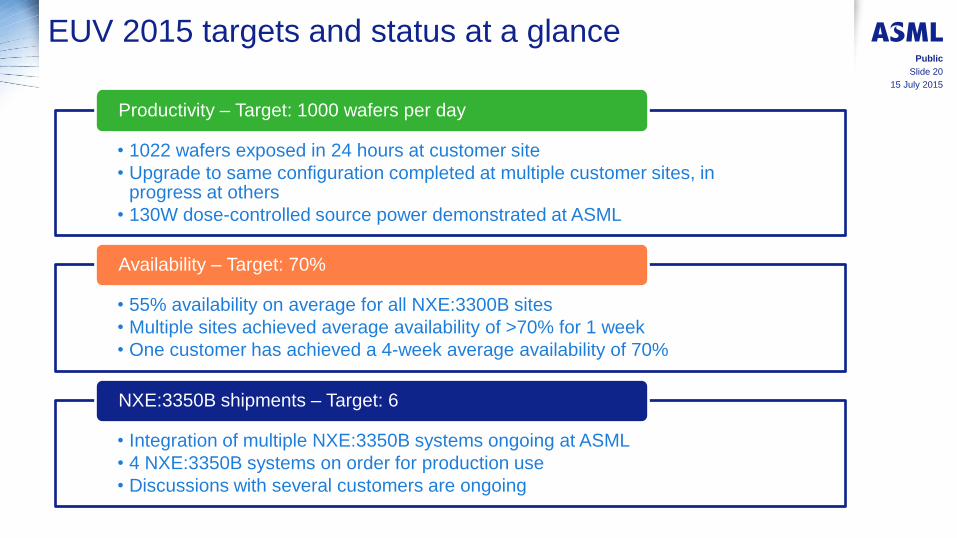
EUV 2015 targets and status at a glance
• 1022 wafers exposed in 24 hours at customer site
• Upgrade to same configuration completed at multiple customer sites, in progress at others
• 130W dose-controlled source power demonstrated at ASML
Productivity – Target: 1000 wafers per day
• 55% availability on average for all NXE:3300B sites
• Multiple sites achieved average availability of >70% for 1 week
• One customer has achieved a 4-week average availability of 70%
Availability – Target: 70%
• Integration of multiple NXE:3350B systems ongoing at ASML
• 4 NXE:3350B systems on order for production use
• Discussions with several customers are ongoing
NXE:3350B shipments – Target: 6
15 July 2015
Public
Slide 20
15 July 2015
Slide 21
Public
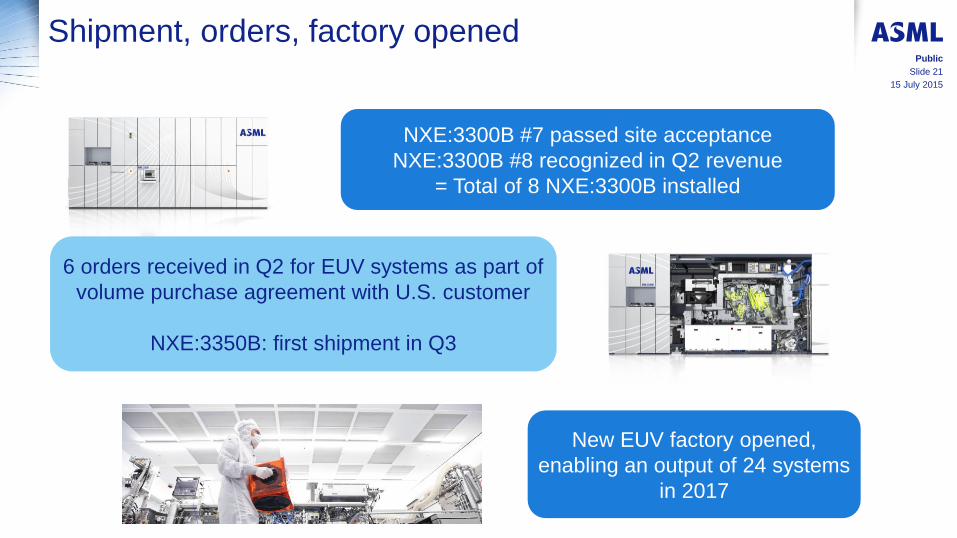
Shipment, orders, factory opened
New EUV factory opened,
enabling an output of 24 systems
in 2017
NXE:3300B #7 passed site acceptance
NXE:3300B #8 recognized in Q2 revenue
= Total of 8 NXE:3300B installed
6 orders received in Q2 for EUV systems as part of
volume purchase agreement with U.S. customer
NXE:3350B: first shipment in Q3
15 July 2015
Slide 22
Public
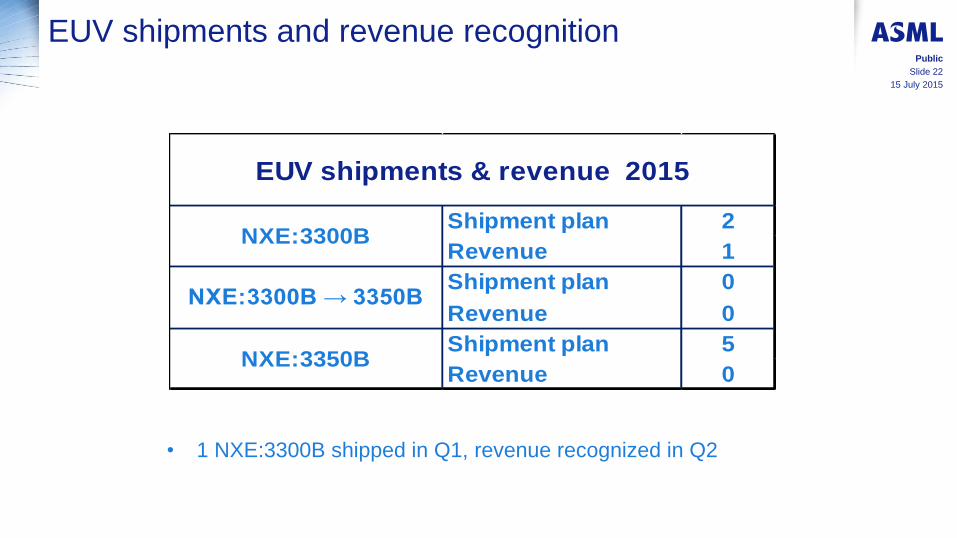
EUV shipments and revenue recognition
EUV shipments & revenue 2015
Shipment plan 2
Revenue 1
Shipment plan 0
Revenue 0
Shipment plan 5
Revenue 0
NXE:3300B
NXE:3300B → 3350B
NXE:3350B
• 1 NXE:3300B shipped in Q1, revenue recognized in Q2
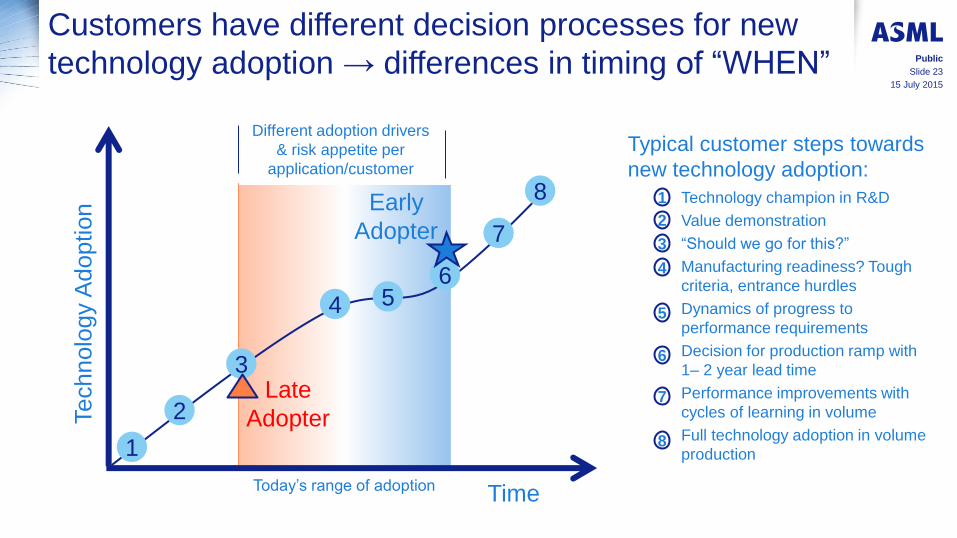
Customers have different decision processes for new
technology adoption → differences in timing of “WHEN”
Time
Technolo
gy A
doption
15 July 2015
Public
Slide 23
Technology champion in R&D
Value demonstration
“Should we go for this?”
Manufacturing readiness? Tough
criteria, entrance hurdles
Dynamics of progress to
performance requirements
Decision for production ramp with
1– 2 year lead time
Performance improvements with
cycles of learning in volume
Full technology adoption in volume
production
1
2
3
4
5
6
7
8
Typical customer steps towards
new technology adoption:
1
2
3
4 5 6
7
Early
Adopter
Late
Adopter
8
Different adoption drivers
& risk appetite per
application/customer
Today’s range of adoption
15 July 2015
Slide 24
Public
Q2 product highlights DUV and Holistic Litho
DUV
• We have demonstrated a 30% overlay improvement with our TWINSCAN NXT:1980Di system, which will ship this year. The system will also offer a step up in productivity from 250 to 275 wafers per hour
• Average availability of our world-wide installed base of more than 300 TWINSCAN NXT tools increased to above 96%, demonstrating ASML’s focus on extending the performance of systems already in production
Holistic Litho
• All immersion systems shipped during the quarter had one or several Holistic Lithography products attached. The integrated YieldStar metrology system is well established, contributing to a total installed base of more than 250 YieldStar systems
• ASML application experts are engaged at all major customers to assist with the production ramp of 10nm logic node and 1x nm memory nodes
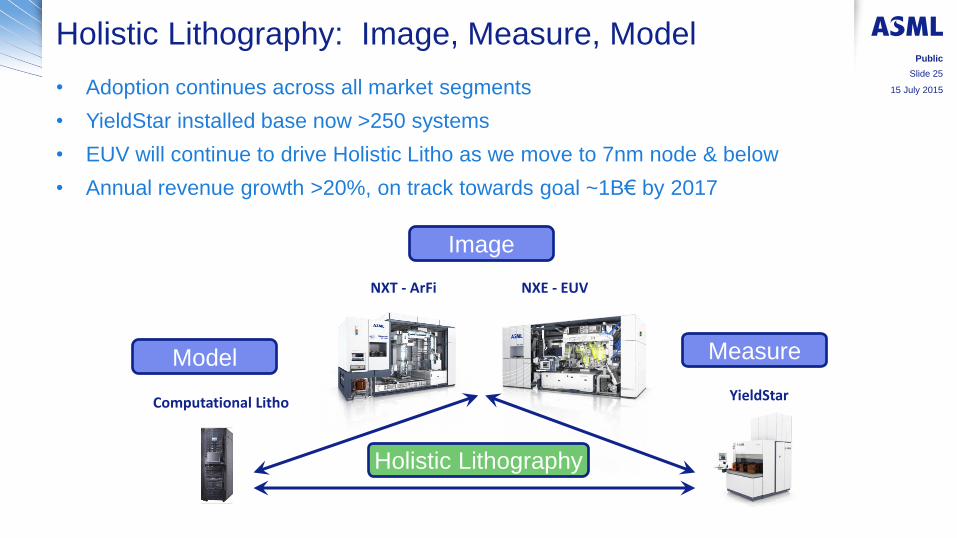
Holistic Lithography: Image, Measure, Model
• Adoption continues across all market segments
• YieldStar installed base now >250 systems
• EUV will continue to drive Holistic Litho as we move to 7nm node & below
• Annual revenue growth >20%, on track towards goal ~1B€ by 2017
Public
Slide 25
Image
NXT - ArFi NXE - EUV
Measure
YieldStar
Model
Computational Litho
Holistic Lithography
15 July 2015
Financial statements
15 July 2015
Slide 26
Public
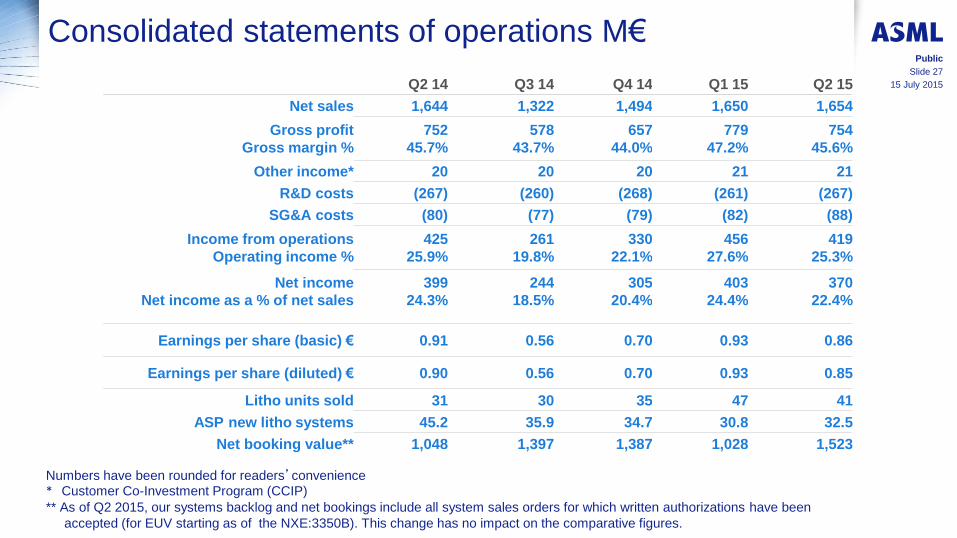
Consolidated statements of operations M€
Numbers have been rounded for readers’convenience * Customer Co-Investment Program (CCIP)
** As of Q2 2015, our systems backlog and net bookings include all system sales orders for which written authorizations have been
accepted (for EUV starting as of the NXE:3350B). This change has no impact on the comparative figures.
Q2 14 Q3 14 Q4 14 Q1 15 Q2 15
Net sales 1,644 1,322 1,494 1,650 1,654
Gross profit 752 578 657 779 754
Gross margin % 45.7% 43.7% 44.0% 47.2% 45.6%
Other income* 20 20 20 21 21
R&D costs (267) (260) (268) (261) (267)
SG&A costs (80) (77) (79) (82) (88)
Income from operations 425 261 330 456 419
Operating income % 25.9% 19.8% 22.1% 27.6% 25.3%
Net income 399 244 305 403 370
Net income as a % of net sales 24.3% 18.5% 20.4% 24.4% 22.4%
Earnings per share (basic) € 0.91 0.56 0.70 0.93 0.86
Earnings per share (diluted) € 0.90 0.56 0.70 0.93 0.85
Litho units sold 31 30 35 47 41
ASP new litho systems 45.2 35.9 34.7 30.8 32.5
Net booking value** 1,048 1,397 1,387 1,028 1,523
15 July 2015
Public
Slide 27
15 July 2015
Slide 28
Public
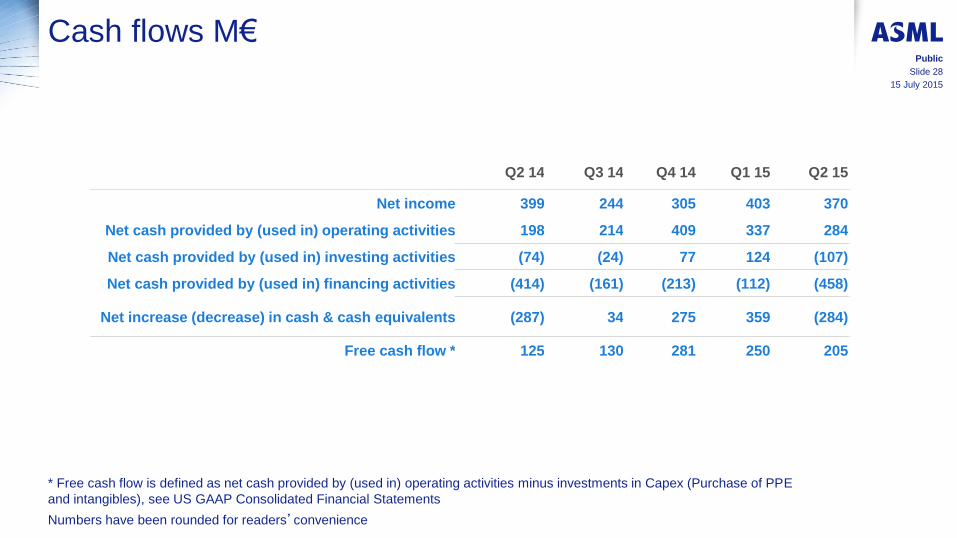
Cash flows M€
* Free cash flow is defined as net cash provided by (used in) operating activities minus investments in Capex (Purchase of PPE
and intangibles), see US GAAP Consolidated Financial Statements
Numbers have been rounded for readers’convenience
Q2 14 Q3 14 Q4 14 Q1 15 Q2 15
Net income 399 244 305 403 370
Net cash provided by (used in) operating activities 198 214 409 337 284
Net cash provided by (used in) investing activities (74) (24) 77 124 (107)
Net cash provided by (used in) financing activities (414) (161) (213) (112) (458)
Net increase (decrease) in cash & cash equivalents (287) 34 275 359 (284)
Free cash flow * 125 130 281 250 205
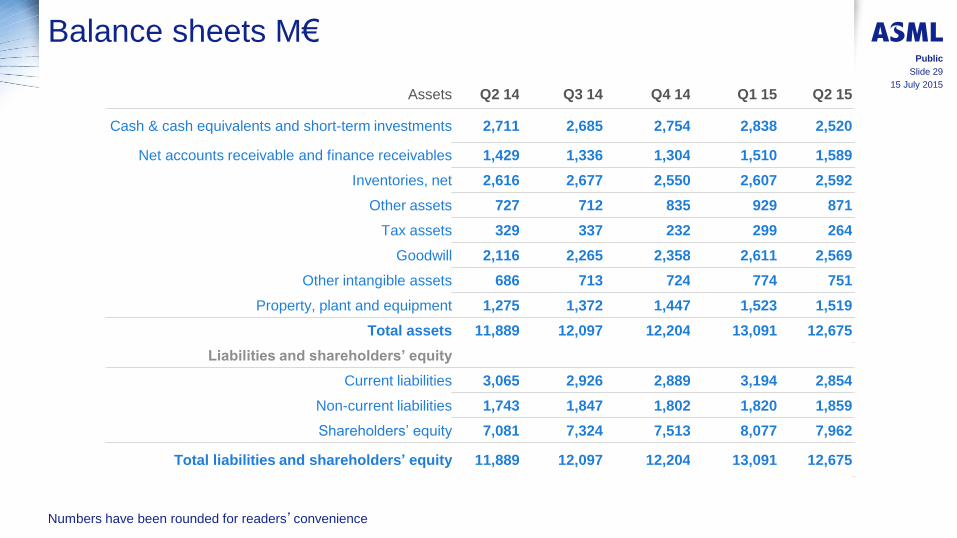
Balance sheets M€
Numbers have been rounded for readers’convenience
Assets Q2 14 Q3 14 Q4 14 Q1 15 Q2 15
Cash & cash equivalents and short-term investments 2,711 2,685 2,754 2,838 2,520
Net accounts receivable and finance receivables 1,429 1,336 1,304 1,510 1,589
Inventories, net 2,616 2,677 2,550 2,607 2,592
Other assets 727 712 835 929 871
Tax assets 329 337 232 299 264
Goodwill 2,116 2,265 2,358 2,611 2,569
Other intangible assets 686 713 724 774 751
Property, plant and equipment 1,275 1,372 1,447 1,523 1,519
Total assets 11,889 12,097 12,204 13,091 12,675
Liabilities and shareholders’ equity
Current liabilities 3,065 2,926 2,889 3,194 2,854
Non-current liabilities 1,743 1,847 1,802 1,820 1,859
Shareholders’ equity 7,081 7,324 7,513 8,077 7,962
Total liabilities and shareholders’ equity 11,889 12,097 12,204 13,091 12,675
15 July 2015
Public
Slide 29