Embed Size (px)
Citation preview

1 © 2015 Experian Information Solutions, Inc. All rights reserved.
Experian Public. © 2015 Experian Information Solutions, Inc. All rights reserved. Experian and the marks used herein are service marks or registered trademarks of Experian Information Solutions, Inc. Other product and company names mentioned
herein are the trademarks of their respective owners. No part of this copyrighted work may be reproduced, modified, or distributed in any form or manner without the prior written permission of Experian. Experian Public
State of the Automotive Finance Market Second Quarter 2015 Melinda Zabritski Sr. Director | Financial Solutions

2 © 2015 Experian Information Solutions, Inc. All rights reserved.
Experian Public.
Market overview
Outstanding loan balances
Portfolio risk distributions
Delinquency rates
Originations
New and Used financing
Lender and transaction types
Loan/lease characteristics & scores
Session overview

3 © 2015 Experian Information Solutions, Inc. All rights reserved.
Experian Public.
Score ranges
Category VantageScore® 3.0
Super prime 781 – 850
Prime 661 – 780
Nonprime 601 – 660
Subprime 501 – 600
Deep subprime 300 – 500
VantageScore 3.0 ranges

4 © 2015 Experian Information Solutions, Inc. All rights reserved.
Experian Public.
INSERT
PICTURE
HERE
Originations
New and used lending

5 © 2015 Experian Information Solutions, Inc. All rights reserved.
Experian Public.
80.2
%
81.1
%
82.6
%
84.5
%
85.0
%
85.8
%
47.2
%
49.4
%
52.7
%
52.9
%
53.8
%
55.5
%
0%
10%
20%
30%
40%
50%
60%
70%
80%
90%
100%
Q2 2010 Q2 2011 Q2 2012 Q2 2013 Q2 2014 Q2 2015
Percentage of vehicles with financing
New Used
Growing reliance upon financing
Source: Experian Automotive

6 © 2015 Experian Information Solutions, Inc. All rights reserved.
Experian Public.
0%
10%
20%
30%
40%
50%
60%
70%
80%
90%
100%
2015
2014
2013
2012
20
11
2010
2009
2008
2007
2006
2005
2004
2003
2002
2001
2000
19
99
1998
1997
1996
1995
1994
1993
1992
1991
<=
1990
Percentage of used model year vehicles without loans
Source: Experian Automotive
63.2% of all vehicles financed
in Q2 2015 were used

7 © 2015 Experian Information Solutions, Inc. All rights reserved.
Experian Public.
10.49% 10.66% 11.36% 12.96%
14.46% 14.82%
23.79% 23.62% 24.40%
27.64%
30.16% 31.38%
19.0% 19.1% 20.1%
23.4% 25.63%
26.92%
0%
5%
10%
15%
20%
25%
30%
35%
Q2 2010 Q2 2011 Q2 2012 Q2 2013 Q2 2014 Q2 2015
Lease % of total
Lease % of new financing
Lease % of all new
Consumer leasing
Source: Experian Automotive

8 © 2015 Experian Information Solutions, Inc. All rights reserved.
Experian Public.
Leasing and consumer credit
717 716
608 623
300
400
500
600
700
800
Q2 2014 Q2 2015
Average lease scores
New
Used6.88% 7.24%
17.19% 17.50%
48.83% 48.48%
26.74% 26.36%
0%
10%
20%
30%
40%
50%
60%
70%
80%
90%
100%
Q2 2014 Q2 2015
New leasing by risk segment
Deep subprime Subprime Nonprime
Prime Super prime
New 96.7% Used
3.3%
Lease by vehicle type
Source: Experian Automotive

9 © 2015 Experian Information Solutions, Inc. All rights reserved.
Experian Public.
3.5%
2.9%
2.8%
2.6%
2.3%
2.2%
2.1%
2.1%
2.0%
1.8%
3.9%
3.2%
2.9%
3.1%
2.5%
2.5%
2.4%
1.8%
1.4%
2.2%
0.0% 0.5% 1.0% 1.5% 2.0% 2.5% 3.0% 3.5% 4.0% 4.5%
CIVIC
ACCORD
CAMRY
CR-V
ESCAPE
COROLLA
FUSION
RAV4
EQUINOX
ALTIMA
Q2 2015
Q2 2014
Top 10 new models based on share of the new lease market
Source: Experian Automotive

10 © 2015 Experian Information Solutions, Inc. All rights reserved.
Experian Public.
69
0
71
8
711
74
3
72
6
68
3
70
2
72
6
71
2
68
0
70
1 71
2
70
6
72
7
71
6
68
9 7
01
71
4
72
1
70
7
640
650
660
670
680
690
700
710
720
730
740
750
CIVIC ACCORD CAMRY CR-V ESCAPE COROLLA FUSION RAV4 EQUINOX ALTIMA
Loan score Lease score
Average score comparison on top new leased models
Source: Experian Automotive

11 © 2015 Experian Information Solutions, Inc. All rights reserved.
Experian Public.
$407
$394
$375
$385
$395
$405
$415
$425
$435
$445
Q2 2014 Q2 2015
Average monthly payment
9.72%
67.36%
22.28%
0.56% 0%
10%
20%
30%
40%
50%
60%
70%
80%
13 - 24 25 - 36 37 - 48 49 - 60
Term distribution
Average new lease characteristics
Source: Experian Automotive
Average term
= 36 months

12 © 2015 Experian Information Solutions, Inc. All rights reserved.
Experian Public.
$3
62
$4
31
$4
27
$4
21
$4
12
$3
57
$4
08
$4
36
$4
24
$4
24
$2
51
$3
18
$3
03
$3
25
$3
16
$2
63
$3
00
$3
28
$2
93
$2
98
$
$50
$100
$150
$200
$250
$300
$350
$400
$450
$500
CIVIC ACCORD CAMRY CR-V ESCAPE COROLLA FUSION RAV4 EQUINOX ALTIMA
Loan payment Lease payment
Average payment comparison on top new leased models
Source: Experian Automotive

13 © 2015 Experian Information Solutions, Inc. All rights reserved.
Experian Public.
Bank 34.72%
BHPH 7.15% Captive
26.80%
Credit Union 16.83%
Finance 14.46%
Q2 2015 total loan market share
Automotive finance by lender type
Source: Experian Automotive
-0.5%
-5.6%
-1.5%
0.8%
6.5%
-10% -5% 0% 5% 10%
YOY change in market share
Captive
BHPH
Bank
Credit Union
Finance

14 © 2015 Experian Information Solutions, Inc. All rights reserved.
Experian Public.
34.70% 34.74%
0.18% 13.02%
49.85%
7.39%
10.26%
22.35%
5.01%
22.50%
0%
10%
20%
30%
40%
50%
60%
70%
80%
90%
100%
New loan Used loan
Q2 2015 market share by lender type
Bank BHPH Captive
Credit Union Finance
Automotive finance by lender type
Source: Experian Automotive
1.6%
-3.0%
-1.3%
1.9%
-1.4%
-2.3%
-6.9%
5.4%
-0.3%
7.0%
-8%
-6%
-4%
-2%
0%
2%
4%
6%
8%
YOY Change in market share
New
Used
Captive BHPH Bank Credit
Union
Finance

15 © 2015 Experian Information Solutions, Inc. All rights reserved.
Experian Public.
5.9
2%
5.4
5%
4.1
8%
4.0
6%
3.9
1%
3.4
3%
2.8
2%
2.7
7%
2.1
4%
1.8
3%
1.7
1%
1.4
7%
1.2
0%
1.1
9%
1.1
5%
0.9
9%
0.9
9%
0.9
9%
0.9
7%
0.9
3%
0%
1%
2%
3%
4%
5%
6%
7%
Top 20 lenders in the retail loan market
Source: Experian Automotive
Top 20 represent 48.1% of
all retail loans
16 © 2015 Experian Information Solutions, Inc. All rights reserved.
Experian Public.
7.9
9%
7.7
1%
7.5
5%
6.8
6%
6.4
2%
4.9
9%
4.3
0%
3.4
7%
3.3
9%
2.3
9%
2.1
5%
1.9
0%
1.8
7%
1.5
3%
1.4
2%
1.3
6%
1.3
6%
1.3
3%
1.2
3%
1.1
4%
0%
1%
2%
3%
4%
5%
6%
7%
8%
9%
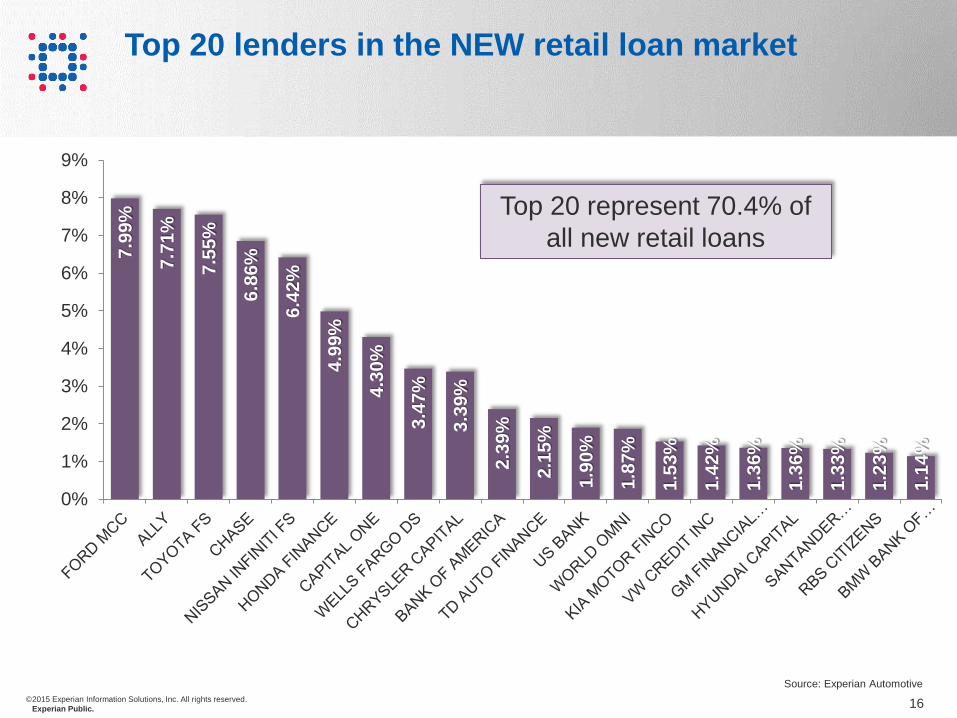
Top 20 lenders in the NEW retail loan market
Source: Experian Automotive
Top 20 represent 70.4% of
all new retail loans

17 © 2015 Experian Information Solutions, Inc. All rights reserved.
Experian Public.
6.6
0%
4.8
8%
4.1
1%
3.6
8%
2.4
2%
1.8
6%
1.8
1%
1.7
9%
1.5
1%
1.2
0%
1.0
6%
1.0
2%
1.0
1%
0.9
1%
0.8
8%
0.8
7%
0.8
4%
0.8
0%
0.7
8%
0.7
5%
0%
1%
2%
3%
4%
5%
6%
7%
Top 20 lenders in the USED retail loan market
Source: Experian Automotive
Top 20 represent 38.8% of
all used retail loans

18 © 2015 Experian Information Solutions, Inc. All rights reserved.
Experian Public.
717
734 722
711 709
646 658
647 644 645
580
600
620
640
660
680
700
720
740
760
Q2 2008 Q2 2010 Q2 2012 Q2 2014 Q2 2015
New Used
Average loan credit scores by vehicle type
Source: Experian Automotive

19 © 2015 Experian Information Solutions, Inc. All rights reserved.
Experian Public.
0.64% 0.79% 10.49% 11.17%
17.69% 18.02%
43.82% 43.04%
27.36% 26.98%
0%
10%
20%
30%
40%
50%
60%
70%
80%
90%
100%
Q2 2014 Q2 2015
New loans
Automotive loans by risk segment
Source: Experian Automotive
6.18% 5.93%
28.30% 28.17%
21.72% 22.08%
33.36% 33.27%
10.44% 10.54%
0%
10%
20%
30%
40%
50%
60%
70%
80%
90%
100%
Q2 2014 Q2 2015
Used loans
Super prime Prime Nonprime Subprime Deep subprime

20 © 2015 Experian Information Solutions, Inc. All rights reserved.
Experian Public.
0.8%
20.5%
1.1% 0.8% 10.8% 12.7%
49.9%
13.3% 11.7%
55.5%
21.4%
14.2%
19.3% 23.2%
20.3%
45.0%
12.3%
40.7% 47.0%
10.5% 20.1%
3.1%
25.7% 17.3%
2.8%
0%
10%
20%
30%
40%
50%
60%
70%
80%
90%
100%
Bank BHPH Captive CreditUnion
Finance
Risk distribution of market share
Deep subprime Subprime Nonprime
Prime Super prime
0.2%
-1.8%
10.1%
-5.6%
-1.4%
-8%
-6%
-4%
-2%
0%
2%
4%
6%
8%
10%
12%
Bank BHPH Captive CreditUnion
Finance
YOY change in highest risk (<600) segment
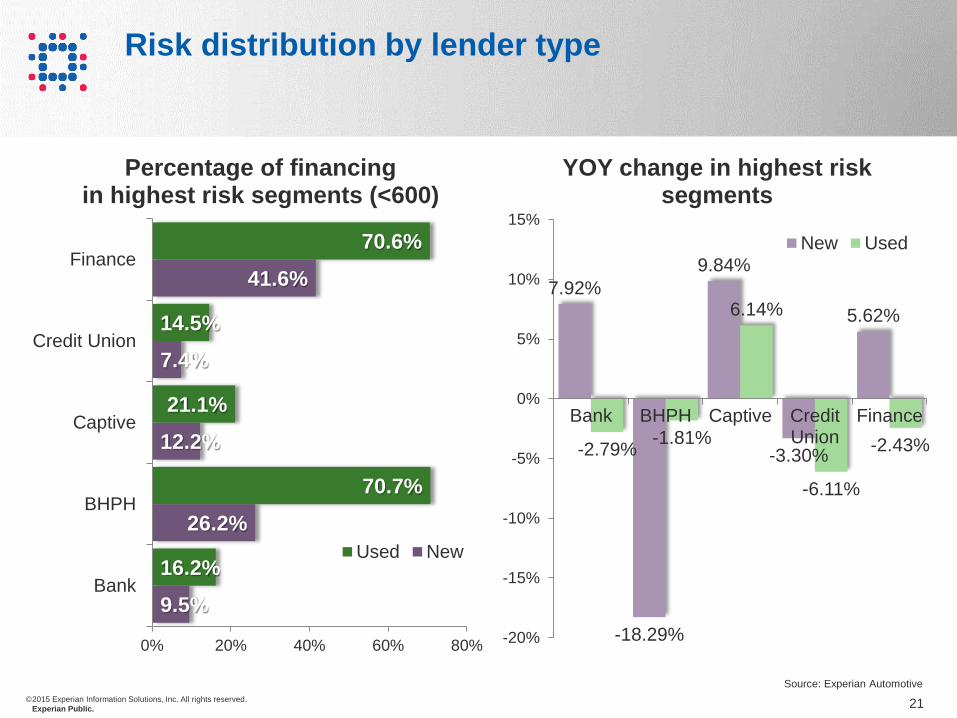
Risk distribution by lender type
Source: Experian Automotive
21 © 2015 Experian Information Solutions, Inc. All rights reserved.
Experian Public.
9.5%
26.2%
12.2%
7.4%
41.6%
16.2%
70.7%
21.1%
14.5%
70.6%
0% 20% 40% 60% 80%
Bank
BHPH
Captive
Credit Union
Finance
Percentage of financing in highest risk segments (<600)
Used New
7.92%
-18.29%
9.84%
-3.30%
5.62%
-2.79% -1.81%
6.14%
-6.11%
-2.43%
-20%
-15%
-10%
-5%
0%
5%
10%
15%
Bank BHPH Captive CreditUnion
Finance
YOY change in highest risk segments
New Used
Risk distribution by lender type
Source: Experian Automotive
22 © 2015 Experian Information Solutions, Inc. All rights reserved.
Experian Public.
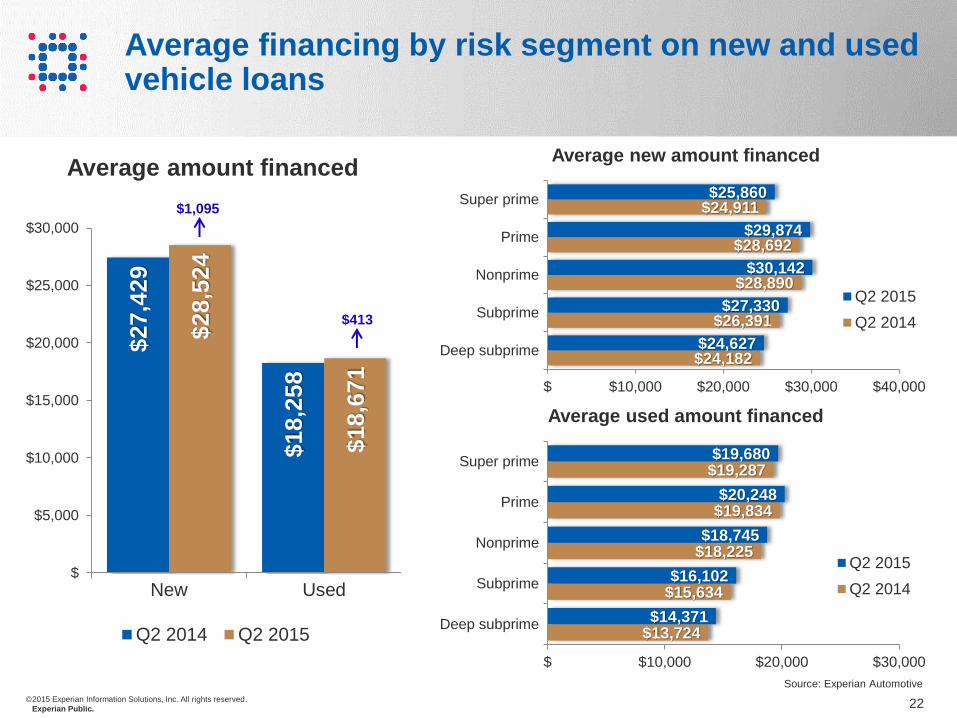
Average financing by risk segment on new and used vehicle loans
$27,4
29
$18,2
58
$28,5
24
$18,6
71
$
$5,000
$10,000
$15,000
$20,000
$25,000
$30,000
New Used
Average amount financed
Q2 2014 Q2 2015
Source: Experian Automotive
$24,182
$26,391
$28,890
$28,692
$24,911
$24,627
$27,330
$30,142
$29,874
$25,860
$ $10,000 $20,000 $30,000 $40,000
Deep subprime
Subprime
Nonprime
Prime
Super prime
Average new amount financed
Q2 2015
Q2 2014
$13,724
$15,634
$18,225
$19,834
$19,287
$14,371
$16,102
$18,745
$20,248
$19,680
$ $10,000 $20,000 $30,000
Deep subprime
Subprime
Nonprime
Prime
Super prime
Average used amount financed
Q2 2015
Q2 2014
$1,095
$413

23 © 2015 Experian Information Solutions, Inc. All rights reserved.
Experian Public.
Average payments by risk segment on new and used vehicle loans
$467
$355
$483
$361
$
$100
$200
$300
$400
$500
$600
New Used
Average monthly payment
Q2 2014 Q2 2015
Source: Experian Automotive
$484
$491
$484
$470
$445
$509
$512
$504
$484
$456
$400 $420 $440 $460 $480 $500 $520
Deep subprime
Subprime
Nonprime
Prime
Super prime
Average new payment
Q1 2015
Q1 2014
$373
$372
$355
$347
$347
$381
$378
$363
$351
$351
$330 $340 $350 $360 $370 $380 $390
Deep subprime
Subprime
Nonprime
Prime
Super prime
Average used payment
Q1 2015
Q1 2014
$16
$6

24 © 2015 Experian Information Solutions, Inc. All rights reserved.
Experian Public.
$112 $103 $101
$106 $112
$122
$
$20
$40
$60
$80
$100
$120
$140
Q2 2010 Q2 2011 Q2 2012 Q2 2013 Q2 2014 Q2 2015
Average payment difference between new & used car loans
Payment gap grows between new and used loans
Source: Experian Automotive

25 © 2015 Experian Information Solutions, Inc. All rights reserved.
Experian Public.
Average term by risk segment on new and used vehicle loans
66
61
67
62
58
59
60
61
62
63
64
65
66
67
68
New Used
Average term
Q2 2014 Q2 2015
Source: Experian Automotive
71.35
71.35
70.63
67.47
60.34
72.08
71.97
71.59
68.49
61.22
48 60 72 84
Deep subprime
Subprime
Nonprime
Prime
Super prime
Average new term
Q2 2015
Q2 2014
54.69
59.16
62.91
63.80
60.13
57.69
60.93
64.11
64.62
60.80
48 60 72 84
Deep subprime
Subprime
Nonprime
Prime
Super prime
Average used term
Q2 2015
Q2 2014
1 mo
1 mo

26 © 2015 Experian Information Solutions, Inc. All rights reserved.
Experian Public.
3.2% 4.8%
21.2%
40.9%
28.8%
5.9% 11.6%
23.6%
41.0%
16.1%
0%
10%
20%
30%
40%
50%
60%
70%
80%
90%
100%
25-36 37-48 49-60 61-72 73-84
Vehicle financing by term
New Used
Distribution of loan term
Source: Experian Automotive
-0.6%
19.7%
4.27%
14.8%

27 © 2015 Experian Information Solutions, Inc. All rights reserved.
Experian Public.
Average rate by risk segment on new and used vehicle loans
4.5
9%
8.8
2%
4.8
1%
9.1
3%
0.00%
1.00%
2.00%
3.00%
4.00%
5.00%
6.00%
7.00%
8.00%
9.00%
10.00%
New Used
Average rate
Q2 2014 Q2 2015
Source: Experian Automotive
13.16%
10.57%
6.26%
3.59%
2.61%
14.51%
10.91%
6.46%
3.63%
2.66%
0.00% 5.00% 10.00% 15.00% 20.00%
Deep subprime
Subprime
Nonprime
Prime
Super prime
Average new rate
Q2 2015
Q2 2014
19.37%
16.05%
9.51%
5.12%
3.32%
19.78%
16.35%
9.79%
5.19%
3.36%
0.00% 5.00% 10.00% 15.00% 20.00% 25.00%
Deep subprime
Subprime
Nonprime
Prime
Super prime
Average used rate
Q2 2015
Q2 2014
22 bps
31 bps

28 © 2015 Experian Information Solutions, Inc. All rights reserved.
Experian Public.
INSERT
PICTURE
HERE
Overall
Automotive
Finance Market
Market overview and
delinquency

29 © 2015 Experian Information Solutions, Inc. All rights reserved.
Experian Public.
A look at automotive loan balances
Source: Experian-Oliver Wyman Market Intelligence Reports

30 © 2015 Experian Information Solutions, Inc. All rights reserved.
Experian Public.
Open loan overview
Source: Experian-Oliver Wyman Market Intelligence Reports
Super prime Prime Nonprime
Subprime Deep subprime

31 © 2015 Experian Information Solutions, Inc. All rights reserved.
Experian Public.
Recent automotive delinquency: 30 day delinquency
Source: Experian-Oliver Wyman Market Intelligence Reports

32 © 2015 Experian Information Solutions, Inc. All rights reserved.
Experian Public.
30-day delinquency balances by state
Source: Experian-Oliver Wyman Market Intelligence Reports
HI = 1.55%
1.26

33 © 2015 Experian Information Solutions, Inc. All rights reserved.
Experian Public.
Recent automotive delinquency: 60 day delinquency
Source: Experian-Oliver Wyman Market Intelligence Reports

34 © 2015 Experian Information Solutions, Inc. All rights reserved.
Experian Public.
60-day delinquency balances by state
Source: Experian-Oliver Wyman Market Intelligence Reports
HI = 0.31%
0.33%

35 © 2015 Experian Information Solutions, Inc. All rights reserved.
Experian Public.
Balances at risk
Source: Experian-Oliver Wyman Market Intelligence Reports

36 © 2015 Experian Information Solutions, Inc. All rights reserved.
Experian Public.
Leasing reaches all-time highs and lease payments drop
Modest high risk growth for new financing; used down YOY
Loan amounts continue to grow; used payments reach all-time highs with gap between new and used payments rising
Terms continue to lengthen while rates creep for new and used financing
Open balances reach all-time highs with majority of loans/balances in prime+
Fewer loans becoming delinquent (30 dpd) yet increases in balances tied to delinquent loans
In summary

37 © 2012 Experian Information Solutions, Inc. All rights reserved.
Experian Public.
37 © 2012 Experian Information Solutions, Inc. All rights reserved.
Experian Public.


![[XLS]upmsp.edu.in · Web view92.8 91.8 91.8 90 89.6 89.2 88.4 88 87.8 87.4 87.2 86.8 86.8 86.8 86.8 86.8 86.8 86.6 86.6 86.4 86.2 86.2 85.8 85.8 85.4 85.4 85.4 85.4 85.2 85.2 85 85](https://img.pdfslide.us/doc/110x75/5ae6d2da7f8b9ae1578e34e1/xlsupmspeduin-view928-918-918-90-896-892-884-88-878-874-872-868-868.jpg)


![[XLS]upmsp.edu.in · Web view91.6 91.4 91 90.4 90.4 90.2 90.2 90.2 90 89.6 89 89 88.6 88.2 88.2 87.8 87.4 87.4 87.2 87 86.8 86.6 86.6 86.4 86.2 86.2 86 85.8 85.8 85.6 85.4 85.4 85.2](https://img.pdfslide.us/doc/110x75/5ac03a7f7f8b9a4e7c8ba3b5/xlsupmspeduin-view916-914-91-904-904-902-902-902-90-896-89-89-886-882.jpg)