Embed Size (px)
Citation preview
EUR Prev. 2010A Prev. 2011A Prev. 2012E Prev. 2013E
Rev. (MM) -- 4,507.9 -- 5,651.0 4,762.5 4,782.0 6,476.6 5,229.9
EV/Rev 4.2x 3.3x 4.0x 3.6x
EPS
Mar -- 0.25 -- 0.90 -- 0.68A -- 0.43
Jun -- 0.54 -- 1.00 -- 0.71A -- 0.65
Sep -- 0.61 -- 0.84 0.69 0.65 -- 0.98
Dec -- 0.93 -- 0.68 0.56 0.60 -- 1.12
FY Dec -- 2.33 -- 3.42 2.64 2.65 4.54 3.18
FY P/E 17.9x 12.2x 15.7x 13.1x
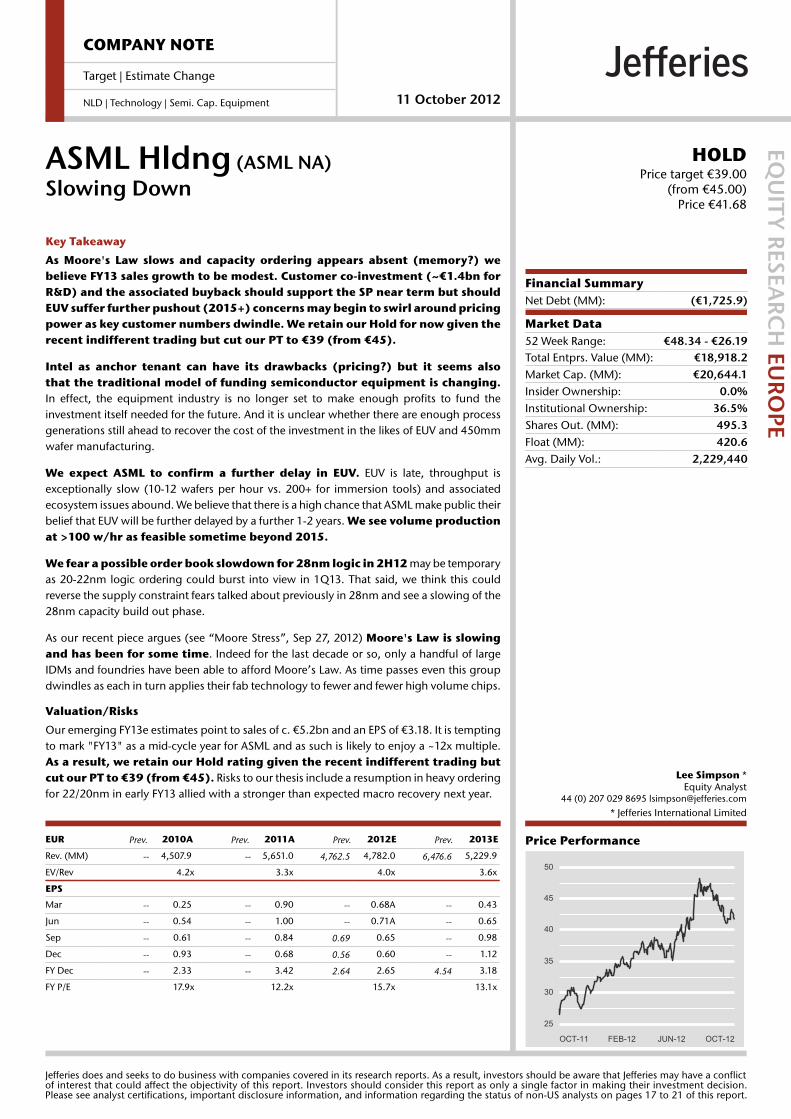
Price Performance
OCT-11 FEB-12 JUN-12 OCT-12
50
45
40
35
30
25
COMPANY NOTE
Target | Estimate Change
NLD | Technology | Semi. Cap. Equipment 11 October 2012
ASML Hldng (ASML NA)Slowing Down
EQU
ITY R
ESEARC
H EU
ROPE
HOLDPrice target €39.00
(from €45.00)Price €41.68
Financial SummaryNet Debt (MM): (€1,725.9)
Market Data52 Week Range: €48.34 - €26.19Total Entprs. Value (MM): €18,918.2Market Cap. (MM): €20,644.1Insider Ownership: 0.0%Institutional Ownership: 36.5%Shares Out. (MM): 495.3Float (MM): 420.6Avg. Daily Vol.: 2,229,440
Lee Simpson *Equity Analyst
44 (0) 207 029 8695 [email protected]
* Jefferies International Limited
Key Takeaway
As Moore's Law slows and capacity ordering appears absent (memory?) webelieve FY13 sales growth to be modest. Customer co-investment (~€1.4bn forR&D) and the associated buyback should support the SP near term but shouldEUV suffer further pushout (2015+) concerns may begin to swirl around pricingpower as key customer numbers dwindle. We retain our Hold for now given therecent indifferent trading but cut our PT to €39 (from €45).
Intel as anchor tenant can have its drawbacks (pricing?) but it seems alsothat the traditional model of funding semiconductor equipment is changing.In effect, the equipment industry is no longer set to make enough profits to fund theinvestment itself needed for the future. And it is unclear whether there are enough processgenerations still ahead to recover the cost of the investment in the likes of EUV and 450mmwafer manufacturing.
We expect ASML to confirm a further delay in EUV. EUV is late, throughput isexceptionally slow (10-12 wafers per hour vs. 200+ for immersion tools) and associatedecosystem issues abound. We believe that there is a high chance that ASML make public theirbelief that EUV will be further delayed by a further 1-2 years. We see volume productionat >100 w/hr as feasible sometime beyond 2015.
We fear a possible order book slowdown for 28nm logic in 2H12 may be temporaryas 20-22nm logic ordering could burst into view in 1Q13. That said, we think this couldreverse the supply constraint fears talked about previously in 28nm and see a slowing of the28nm capacity build out phase.
As our recent piece argues (see “Moore Stress”, Sep 27, 2012) Moore's Law is slowingand has been for some time. Indeed for the last decade or so, only a handful of largeIDMs and foundries have been able to afford Moore’s Law. As time passes even this groupdwindles as each in turn applies their fab technology to fewer and fewer high volume chips.
Valuation/Risks
Our emerging FY13e estimates point to sales of c. €5.2bn and an EPS of €3.18. It is temptingto mark "FY13" as a mid-cycle year for ASML and as such is likely to enjoy a ~12x multiple.As a result, we retain our Hold rating given the recent indifferent trading butcut our PT to €39 (from €45). Risks to our thesis include a resumption in heavy orderingfor 22/20nm in early FY13 allied with a stronger than expected macro recovery next year.
Jefferies does and seeks to do business with companies covered in its research reports. As a result, investors should be aware that Jefferies may have a conflictof interest that could affect the objectivity of this report. Investors should consider this report as only a single factor in making their investment decision.Please see analyst certifications, important disclosure information, and information regarding the status of non-US analysts on pages 17 to 21 of this report.
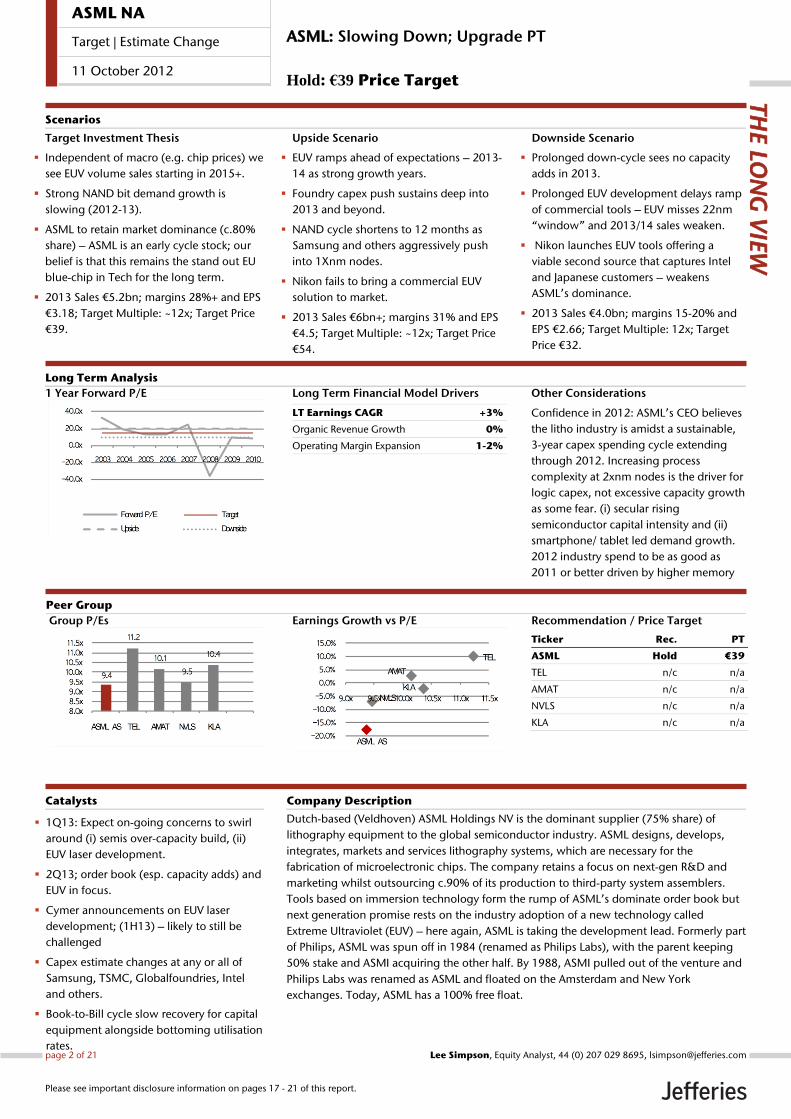
Long Term Financial Model Drivers
LT Earnings CAGR +3%
Organic Revenue Growth 0%
Operating Margin Expansion 1-2%
Other Considerations
Confidence in 2012: ASML’s CEO believes
the litho industry is amidst a sustainable,
3-year capex spending cycle extending
through 2012. Increasing process
complexity at 2xnm nodes is the driver for
logic capex, not excessive capacity growth
as some fear. (i) secular rising
semiconductor capital intensity and (ii)
smartphone/ tablet led demand growth.
2012 industry spend to be as good as
2011 or better driven by higher memory
spend and higher capital intensity at
1 Year Forward P/E
Dutch-based (Veldhoven) ASML Holdings NV is the dominant supplier (75% share) of
lithography equipment to the global semiconductor industry. ASML designs, develops,
integrates, markets and services lithography systems, which are necessary for the
fabrication of microelectronic chips. The company retains a focus on next-gen R&D and
marketing whilst outsourcing c.90% of its production to third-party system assemblers.
Tools based on immersion technology form the rump of ASML’s dominate order book but
next generation promise rests on the industry adoption of a new technology called
Extreme Ultraviolet (EUV) – here again, ASML is taking the development lead. Formerly part
of Philips, ASML was spun off in 1984 (renamed as Philips Labs), with the parent keeping
50% stake and ASMI acquiring the other half. By 1988, ASMI pulled out of the venture and
Philips Labs was renamed as ASML and floated on the Amsterdam and New York
exchanges. Today, ASML has a 100% free float.
1Q13: Expect on-going concerns to swirl
around (i) semis over-capacity build, (ii)
EUV laser development.
2Q13; order book (esp. capacity adds) and
EUV in focus.
Cymer announcements on EUV laser
development; (1H13) – likely to still be
challenged
Capex estimate changes at any or all of
Samsung, TSMC, Globalfoundries, Intel
and others.
Book-to-Bill cycle slow recovery for capital
equipment alongside bottoming utilisation
rates.
Catalysts
Target Investment Thesis
Independent of macro (e.g. chip prices) we
see EUV volume sales starting in 2015+.
Strong NAND bit demand growth is
slowing (2012-13).
ASML to retain market dominance (c.80%
share) – ASML is an early cycle stock; our
belief is that this remains the stand out EU
blue-chip in Tech for the long term.
2013 Sales €5.2bn; margins 28%+ and EPS
€3.18; Target Multiple: ~12x; Target Price
€39.
Upside Scenario
EUV ramps ahead of expectations – 2013-
14 as strong growth years.
Foundry capex push sustains deep into
2013 and beyond.
NAND cycle shortens to 12 months as
Samsung and others aggressively push
into 1Xnm nodes.
Nikon fails to bring a commercial EUV
solution to market.
2013 Sales €6bn+; margins 31% and EPS
€4.5; Target Multiple: ~12x; Target Price
€54.
Downside Scenario
Prolonged down-cycle sees no capacity
adds in 2013.
Prolonged EUV development delays ramp
of commercial tools – EUV misses 22nm
“window” and 2013/14 sales weaken.
Nikon launches EUV tools offering a
viable second source that captures Intel
and Japanese customers – weakens
ASML’s dominance.
2013 Sales €4.0bn; margins 15-20% and
EPS €2.66; Target Multiple: 12x; Target
Price €32.
Long Term Analysis
Scenarios
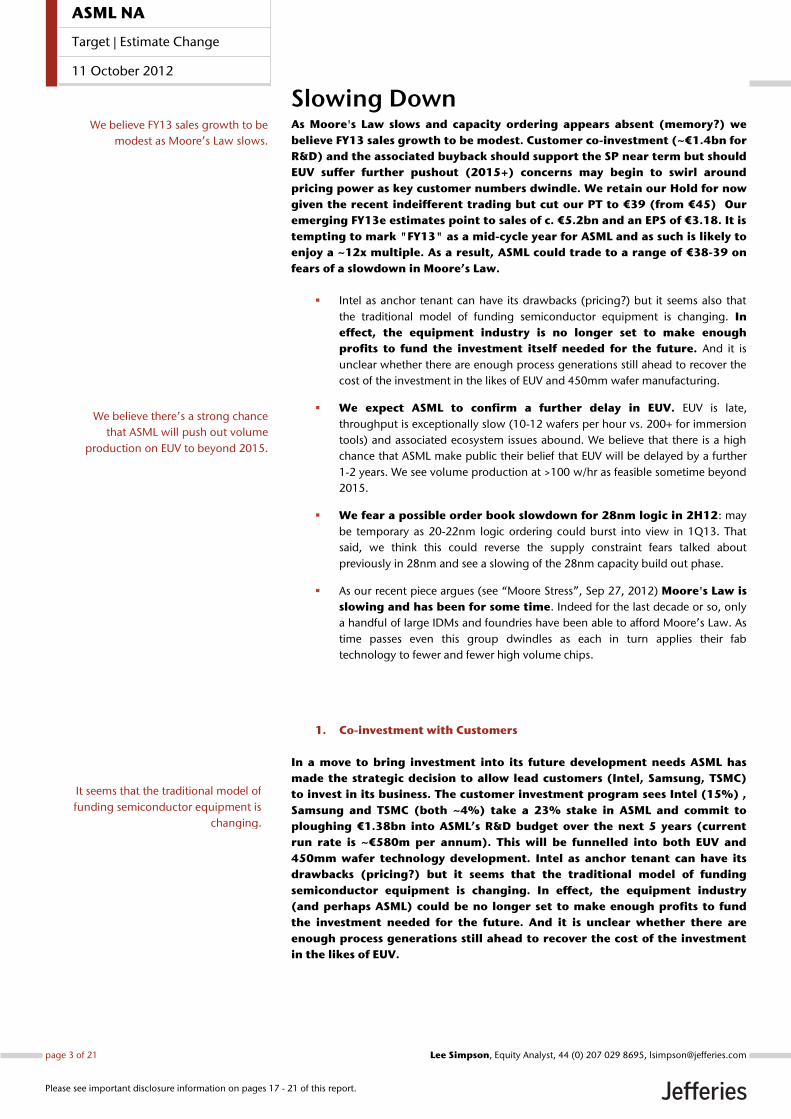
Group P/Es
Earnings Growth vs P/E
Recommendation / Price Target
Ticker Rec. PT
ASML Hold €39
TEL n/c n/a
AMAT n/c n/a
NVLS n/c n/a
KLA n/c n/a
Company Description
THE LO
NG
VIE
W
Peer Group
ASML: Slowing Down; Upgrade PT
Hold: €39 Price Target
page 2 of 21 , Equity Analyst, 44 (0) 207 029 8695, [email protected] Simpson
Please see important disclosure information on pages 17 - 21 of this report.
ASML NA
Target | Estimate Change
11 October 2012
Slowing Down As Moore's Law slows and capacity ordering appears absent (memory?) we
believe FY13 sales growth to be modest. Customer co-investment (~€1.4bn for
R&D) and the associated buyback should support the SP near term but should
EUV suffer further pushout (2015+) concerns may begin to swirl around
pricing power as key customer numbers dwindle. We retain our Hold for now
given the recent indeifferent trading but cut our PT to €39 (from €45) Our
emerging FY13e estimates point to sales of c. €5.2bn and an EPS of €3.18. It is
tempting to mark "FY13" as a mid-cycle year for ASML and as such is likely to
enjoy a ~12x multiple. As a result, ASML could trade to a range of €38-39 on
fears of a slowdown in Moore’s Law.
Intel as anchor tenant can have its drawbacks (pricing?) but it seems also that
the traditional model of funding semiconductor equipment is changing. In
effect, the equipment industry is no longer set to make enough
profits to fund the investment itself needed for the future. And it is
unclear whether there are enough process generations still ahead to recover the
cost of the investment in the likes of EUV and 450mm wafer manufacturing.
We expect ASML to confirm a further delay in EUV. EUV is late,
throughput is exceptionally slow (10-12 wafers per hour vs. 200+ for immersion
tools) and associated ecosystem issues abound. We believe that there is a high
chance that ASML make public their belief that EUV will be delayed by a further
1-2 years. We see volume production at >100 w/hr as feasible sometime beyond
2015.
We fear a possible order book slowdown for 28nm logic in 2H12: may
be temporary as 20-22nm logic ordering could burst into view in 1Q13. That
said, we think this could reverse the supply constraint fears talked about
previously in 28nm and see a slowing of the 28nm capacity build out phase.
As our recent piece argues (see ‚Moore Stress‛, Sep 27, 2012) Moore's Law is
slowing and has been for some time. Indeed for the last decade or so, only
a handful of large IDMs and foundries have been able to afford Moore’s Law. As
time passes even this group dwindles as each in turn applies their fab
technology to fewer and fewer high volume chips.
1. Co-investment with Customers
In a move to bring investment into its future development needs ASML has
made the strategic decision to allow lead customers (Intel, Samsung, TSMC)
to invest in its business. The customer investment program sees Intel (15%) ,
Samsung and TSMC (both ~4%) take a 23% stake in ASML and commit to
ploughing €1.38bn into ASML’s R&D budget over the next 5 years (current
run rate is ~€580m per annum). This will be funnelled into both EUV and
450mm wafer technology development. Intel as anchor tenant can have its
drawbacks (pricing?) but it seems that the traditional model of funding
semiconductor equipment is changing. In effect, the equipment industry
(and perhaps ASML) could be no longer set to make enough profits to fund
the investment needed for the future. And it is unclear whether there are
enough process generations still ahead to recover the cost of the investment
in the likes of EUV.
Comment ###
We believe FY13 sales growth to be
modest as Moore’s Law slows.
Comment ###
We believe there’s a strong chance
that ASML will push out volume
production on EUV to beyond 2015.
It seems that the traditional model of
funding semiconductor equipment is
changing.
page 3 of 21 , Equity Analyst, 44 (0) 207 029 8695, [email protected] Simpson
Please see important disclosure information on pages 17 - 21 of this report.
ASML NA
Target | Estimate Change
11 October 2012
Near-term, shares supported by buybacks. ASML are issuing ~23% (of existing
stock) as new stock, as part of the synthetic buyback. This is to be a 100/77 reverse stock
split. The price of the share issue is fixed at €39.91 (20 day average prior to the initial Intel
deal announcement). These new shares (no voting rights) will be issued to the three
customers with all existing investors (at time of deal announce) getting the equivalent of
€9.81 per share in cash (all €1.7bn of net proceeds returned to existing investors). This has
been 98% approved at EGM and looks set to go ahead during Nov ’12. ASML issued
shares to Intel and Samsung during Sep ’12 and will issue shares to TSMC by the end of
this month (Oct ’12). ASML expects to execute the Synthetic Buyback sometime after 11th
Nov ’12 with the cash payment date expected in early Dec ’12. Note, of course that the
buyback will have zero effect on total number of shares outstanding before and after issue
– so should have no difference on EPS as a result.
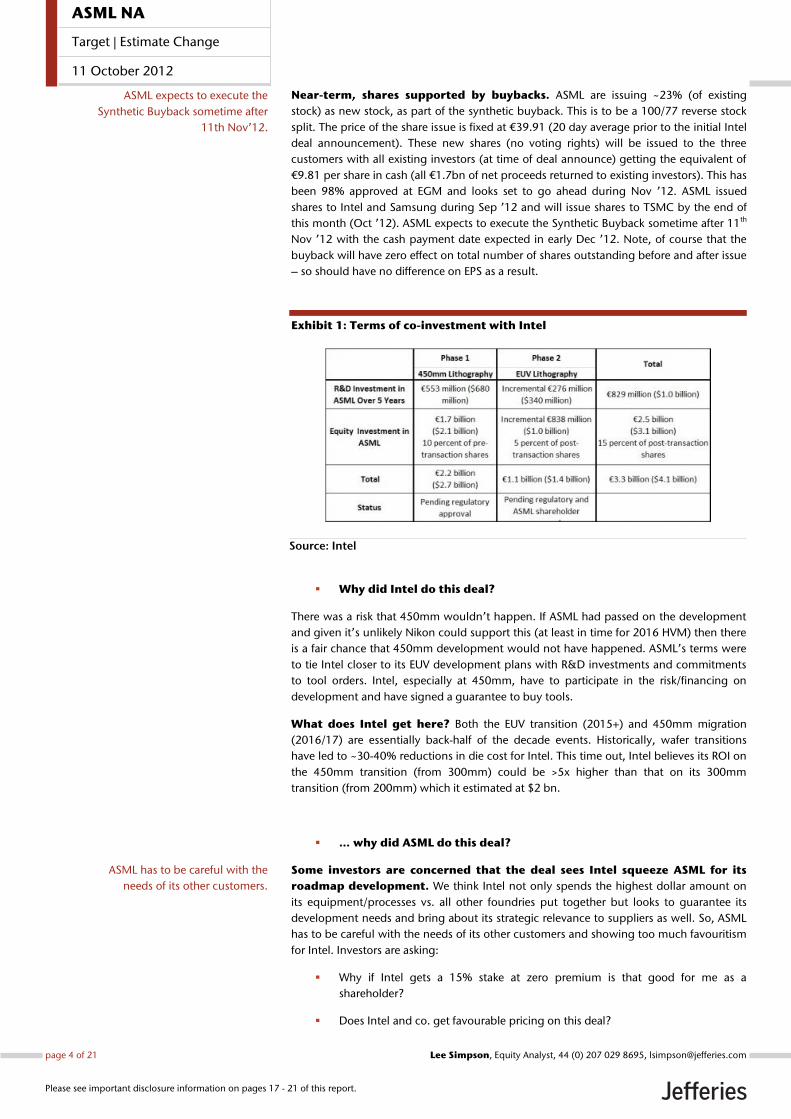
Exhibit 1: Terms of co-investment with Intel
Source: Intel
Why did Intel do this deal?
There was a risk that 450mm wouldn’t happen. If ASML had passed on the development
and given it’s unlikely Nikon could support this (at least in time for 2016 HVM) then there
is a fair chance that 450mm development would not have happened. ASML’s terms were
to tie Intel closer to its EUV development plans with R&D investments and commitments
to tool orders. Intel, especially at 450mm, have to participate in the risk/financing on
development and have signed a guarantee to buy tools.
What does Intel get here? Both the EUV transition (2015+) and 450mm migration
(2016/17) are essentially back-half of the decade events. Historically, wafer transitions
have led to ~30-40% reductions in die cost for Intel. This time out, Intel believes its ROI on
the 450mm transition (from 300mm) could be >5x higher than that on its 300mm
transition (from 200mm) which it estimated at $2 bn.
… why did ASML do this deal?
Some investors are concerned that the deal sees Intel squeeze ASML for its
roadmap development. We think Intel not only spends the highest dollar amount on
its equipment/processes vs. all other foundries put together but looks to guarantee its
development needs and bring about its strategic relevance to suppliers as well. So, ASML
has to be careful with the needs of its other customers and showing too much favouritism
for Intel. Investors are asking:
Why if Intel gets a 15% stake at zero premium is that good for me as a
shareholder?
Does Intel and co. get favourable pricing on this deal?
ASML expects to execute the
Synthetic Buyback sometime after
11th Nov’12.
ASML has to be careful with the
needs of its other customers.
page 4 of 21 , Equity Analyst, 44 (0) 207 029 8695, [email protected] Simpson
Please see important disclosure information on pages 17 - 21 of this report.
ASML NA
Target | Estimate Change
11 October 2012
Is it negative for TSMC and Samsung that Intel has a bigger stake?
We try and address this below. That all said, (i) ASML gets to squeeze out Nikon, (ii) has
product commitment from the one customer that could guarantee success for EUV, and
(iii) has a fair slug of its development costs paid for by customer base. Overall, investors
diluted but income streams accelerated. If Moore’s Law is ‚re-booted‛ (by EUV) ASML’s
multiple will likely expand again; it has dropped cycle-on-cycle for the last three we
believe on fear of a Moore’s Law slowdown.
No voting rights or board seat for Intel as part of this deal. ASML claim
that there are no price guarantees to Intel as part of this deal and state that in
fact machines will be made available to all customers not just through a specific
customer development. Intel also don’t get a board seat and have no voting
rights on their shares. How fully ASML can maintain its independence in light of
such a hefty investment should be something to be mindful of (e.g., look at how
SVG developed under a one customer agreement). So ASML must continue
to strike a balance across the needs of various sectors (e.g. ,for a
memory fab you need a different toolset configuration to that for logic say).
TSMC, Samsung did not match Intel size in EUV (Intel took 5% in EUV;
10% was 450mm). The offer was for a maximum equity stake of 25% for
customers (split 10% for 450mm migration and 15% for EUV transition). Intel
has secured up to 5% of the 15% available for EUV (and, unsurprisingly all of the
450mm). Yet when offered, TSMC and Samsung did not match Intel’s size in the
consortium even in EUV. We believe that Samsung and TSMC are cautious
investors in the scheme. Intel has, arguably, a 2-4 year lead on rivals with its
22nm FinFET process technology. Previous break-throughs such as High-K Metal
Gate (HKMG) delivered similar leads in the past. Moore's Law scaling, however,
remains key to Intel's lead meaning EUV commitment can't be seen as a
complete surprise. Why should TSMC and Samsung get involved? It may
be perceived that Intel is pressing these two to play their game and this could
create reactions for the likes of ASML. But without this investment ASML believe
they couldn’t have had an accelerated EUV tool program – higher ASPs and
faster throughputs at better resolutions – in time for 2015+. But for a zero
premium equity stake, Samsung and TSMC get an equity play (and a
dividend check) as ‚rebate‛ against the rising cost of EUV to them,
which could just be attractive enough.
What’s the upside for ASML’s EUV program? ASML tells us that Intel gets
(i) new tech and (ii) earlier; but so will other customers. Meantime, EUV
guidance is being increased given Intel commitments – development should
allow for new tools, for smaller EUV resolutions and with higher ASPs than
previously stated. There is no $-impact mentioned but the presentation deck
talks of a rough development roadmap where there will be 450mm tools in
2015 (for immersion and dry) and in 2016 for EUV (volume in 2018).
Why didn’t ASML finance this out of their own B/S? But put another
way, how would the market have reacted should ASML have financed this on
their own — would increasing R&D in EUV by up to €2bn over the next 5 years
been anything other than a disaster for ASML’s SP. Again, ASML claim that
without this deal there could not be an accelerated EUV development program
and thus limited revenue growth in the longer term. Intel as anchor tenant
can have its drawbacks (pricing?) but it seems also that the
traditional model of funding semiconductor equipment is changing.
In effect, the equipment industry (and perhaps ASML) is no longer set
to make enough profits to fund the investment needed for the future.
And it is unclear whether there are enough process generations still
ahead to recover the cost of the investment in the likes of EUV.
How about Nikon? It’s unlikely such a stake by Intel does not come with
guarantees beyond just commitment by ASML to 450mm migration
A Moore’s Law re-boot would see
multiples expand.
ASML sees the investment program
as crucial to EUV delivery.
page 5 of 21 , Equity Analyst, 44 (0) 207 029 8695, [email protected] Simpson
Please see important disclosure information on pages 17 - 21 of this report.
ASML NA
Target | Estimate Change
11 October 2012
development. Instead, Intel may have to seek assurances on price or perhaps
even some early embargo on new EUV toolsets in favour of "lead" partners. Both
of which ASML deny as being in the deal. Nonetheless, it’s tempting to think that
Nikon may be the net loser here anyway - often seen as Intel's weapon of
last resort in keeping ASML's pricing keen, Nikon may now be being
squeezed out of EUV. Recent discussions with ASML management alerted us
to the possibility that Nikon may even have to pay a royalty to ASML for any EUV
use.
2. EUV: We expect a further Pushout!
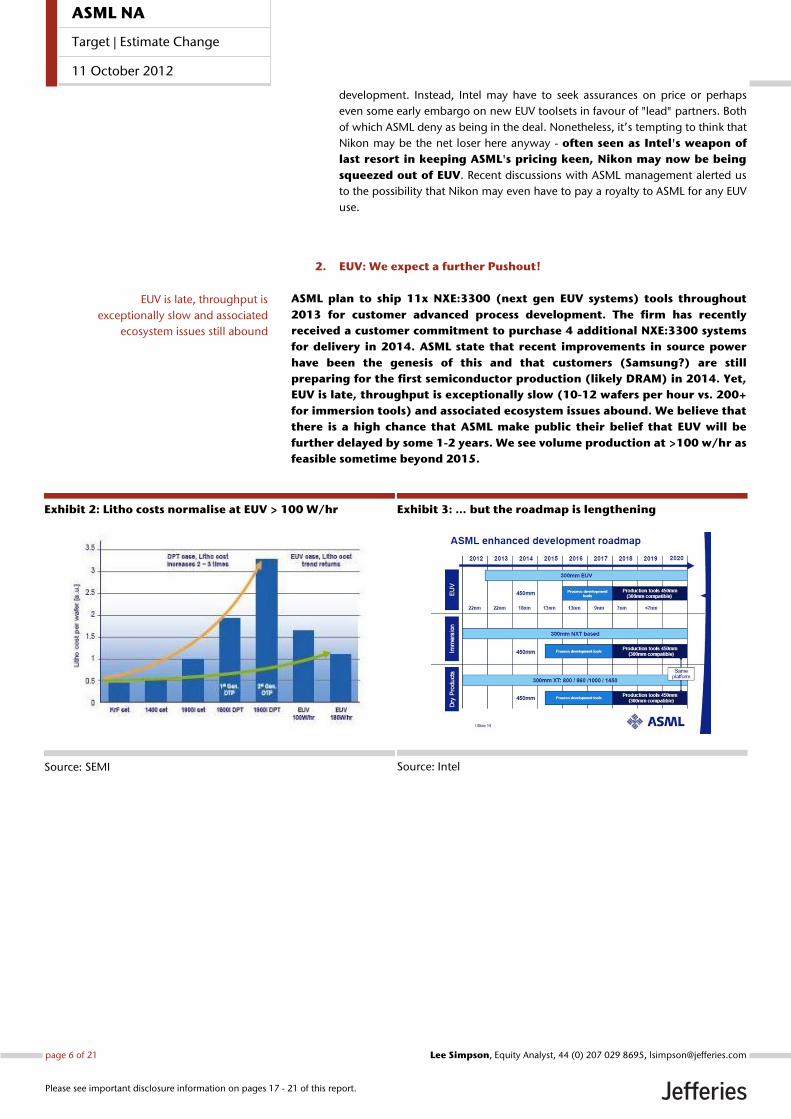
ASML plan to ship 11x NXE:3300 (next gen EUV systems) tools throughout
2013 for customer advanced process development. The firm has recently
received a customer commitment to purchase 4 additional NXE:3300 systems
for delivery in 2014. ASML state that recent improvements in source power
have been the genesis of this and that customers (Samsung?) are still
preparing for the first semiconductor production (likely DRAM) in 2014. Yet,
EUV is late, throughput is exceptionally slow (10-12 wafers per hour vs. 200+
for immersion tools) and associated ecosystem issues abound. We believe that
there is a high chance that ASML make public their belief that EUV will be
further delayed by some 1-2 years. We see volume production at >100 w/hr as
feasible sometime beyond 2015.
Exhibit 2: Litho costs normalise at EUV > 100 W/hr
Source: SEMI
Exhibit 3: … but the roadmap is lengthening
Source: Intel
Comment ###
EUV is late, throughput is
exceptionally slow and associated
ecosystem issues still abound
page 6 of 21 , Equity Analyst, 44 (0) 207 029 8695, [email protected] Simpson
Please see important disclosure information on pages 17 - 21 of this report.
ASML NA
Target | Estimate Change
11 October 2012
ASML has already compromised on its target of 60 wafers/hr for EUV by YE’12 - that first
shipment of the 3rd gen EUV system (NXE:3300) is now expected in 1H13 although a total
of 11 systems have been ordered for 2013 shipment. Even the testing process can add
delay; laser power development is (i) tested at Cymer (San Diego) but then needs to be
put into final tool parts and then (ii) shipped to and tested again (approval) back at
ASML’s Veldhoven site before being (iii) shipped to the customer and validated there. All
this occurs before the customer can begin to run its own process on the tools and start to
determine volume production at 60 w/hr. We still expect this target to be a real challenge
for ASML and don’t see tools at customers’ sites running 60 wafers/hr unhindered by
YE’13.
The primary reason lies with the numerous issues that continue to hinder EUV production
development:
Resist chemicals have been developed (or at least the raw materials
determined) to give adequate resolutions at 22nm. But the solution is ‘thicker’
than is ideal meaning it has to be exposed to the light longer thus slowing the
throughput of the tool. There is also a paucity of EUV tools available to resist
developers and a question mark over whether photoresist makers can make a
return on investment, should they even arrive at the right solution, given the
high cost of EUV machinery they would need to test on.
Line width roughness (LWR) continues to be a problem and may need to be
solved with a non-lithographic clean-up.
Light sources are one or two orders of magnitude dimmer than they should be
and it can take 30kW to create the 30W of EUV light. That said, ASML have
shown a 50W power capability that can run for over 5 hours. Yet it is assumed
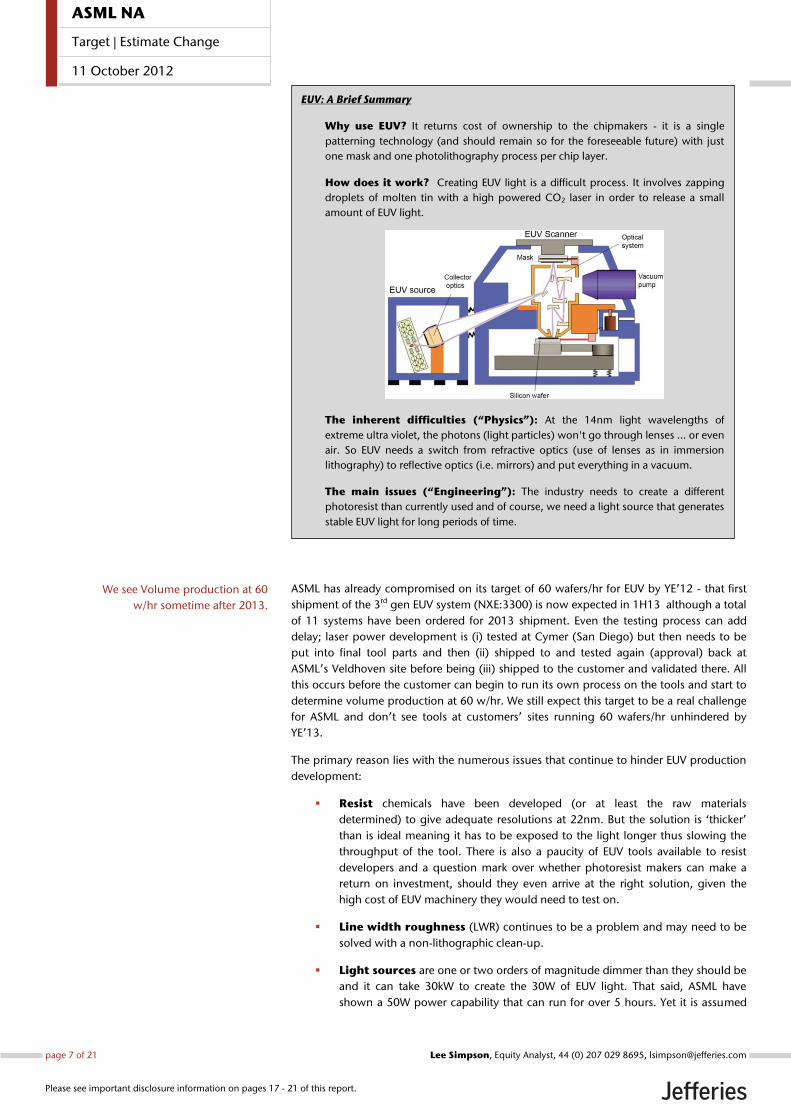
EUV: A Brief Summary
Why use EUV? It returns cost of ownership to the chipmakers - it is a single
patterning technology (and should remain so for the foreseeable future) with just
one mask and one photolithography process per chip layer.
How does it work? Creating EUV light is a difficult process. It involves zapping
droplets of molten tin with a high powered CO2 laser in order to release a small
amount of EUV light.
The inherent difficulties (‚Physics‛): At the 14nm light wavelengths of
extreme ultra violet, the photons (light particles) won't go through lenses … or even
air. So EUV needs a switch from refractive optics (use of lenses as in immersion
lithography) to reflective optics (i.e. mirrors) and put everything in a vacuum.
The main issues (‚Engineering‛): The industry needs to create a different
photoresist than currently used and of course, we need a light source that generates
stable EUV light for long periods of time.
We see Volume production at 60
w/hr sometime after 2013.
page 7 of 21 , Equity Analyst, 44 (0) 207 029 8695, [email protected] Simpson
Please see important disclosure information on pages 17 - 21 of this report.
ASML NA
Target | Estimate Change
11 October 2012
that ~100W is needed to deliver 60 wafers/hour with volume production
unlikely before 2014.
Defect-free Mask blanks are still hard to produce - any particle that gets on the
mask is in the focal plane of the mask and so will print on the wafer. This is
unlike refractive masks that have a pellicle to keep particles away from the plane
of the mask itself.
Debris in the system is a by-product of using metal plasma. Tin particles can
build up on the mirror surfaces which means optics have to be cleaned or
replaced every week or so. Indeed we have heard of simple problems with the
delivery nozzle where tin has built up at the nozzle head blocking or impeding
delivery of the tin and thus disturbing the light source sustainability.
Recently our Japanese analyst (Yoshihiro Azuma) has talked about problems the
glass makers have with the reflectivity needed on mirrors used in EUV systems
(see ‚Obstacles for EUVL‛, Oct 9, ’12). It seems even the decision on which
material is best suited to make the mirrors is in some dispute. Secondly, these
mirrors reflect light due to multi-layer interference and mean that even with
good mirrors, only ~70% of the EUV light is reflected. Since the optics need >8
mirrors to focus the light first on the mask and then on the wafer, very little of
the light you start with (~4%) ends up hitting the photoresist increasing the
pressures on the light source.
Triple patterning carries a hefty cost. Triple patterning is essentially the same
machine as used for double patterning only with a head change. Because EUV is late, we
are starting to see some triple patterning tools in development fabs already. Market
leaders such as Intel are not waiting for EUV to be mature enough to start using and so
continue to develop double patterning techniques alongside preparing EUV. But given
EUV development at customers is very early stage, big customers are betting on Triple
patterning too. ASML believe that one of its customers has a chip with 1 layer using triple
patterning – this, however, needs 5 exposures (for single layer) and yields are
horrible meaning customer cost of ownership is too high. These will be high ASP
machines and will ship with computational lithography (Brion) alongside. All in, we
believe that there are unlikely to be more than 2 or 3 triple patterning tools in the order
book for next year.
3. Moore Stress: This could be rough for pricing power…
ASML dominates (~80%) the lithography space with its Twinscan systems and
so has a vested interest in the cadence of Moore’s Law. Indeed it’s often
claimed that Moore’s Law is actually supported by the speed of lithographic
product cycles and innovation. But as our recent piece argues (see ‚Moore
Stress‛, Sep ’12) Moore's Law is slowing and has been for some time. Indeed
for the last decade or so, only a handful of large IDMs and foundries have
been able to afford Moore’s Law. As time passes even this group dwindles as
each in turn applies their fab technology to fewer and fewer high volume
chips. This means an ever diminishing pool of engineering talent is at the
‘coal-face’ of the leading edge process design. With EUV late (estimates range
from 4-6 years late) the cost/transistor has ticked up.
Over the next 3 to 5 years, we think exponential growth in leading edge factory costs will
undermine the cost per transistor declines the industry has come to rely on. We expect
this will translate to a structural shift that will benefit integrators on mature process nodes,
challenge fabless players on the leading edge, and drive unexpected share gains for Intel
and Samsung. For ASML this could drastically reduce its serviceable market of customers
Comment ###
Our cycle metrics are mixed but
shows at least that much of the value
of this cycle reflected.
page 8 of 21 , Equity Analyst, 44 (0) 207 029 8695, [email protected] Simpson
Please see important disclosure information on pages 17 - 21 of this report.
ASML NA
Target | Estimate Change
11 October 2012
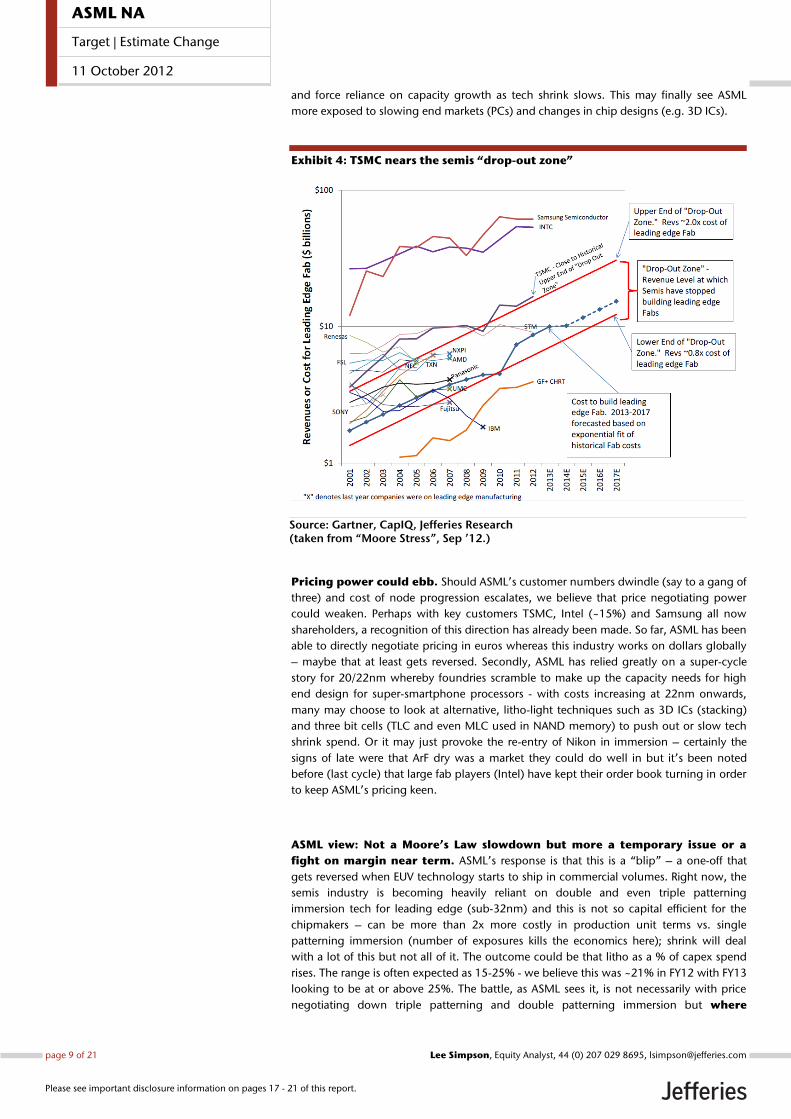
and force reliance on capacity growth as tech shrink slows. This may finally see ASML
more exposed to slowing end markets (PCs) and changes in chip designs (e.g. 3D ICs).
Exhibit 4: TSMC nears the semis ‚drop-out zone‛
Source: Gartner, CapIQ, Jefferies Research (taken from “Moore Stress”, Sep ’12.)
Pricing power could ebb. Should ASML’s customer numbers dwindle (say to a gang of
three) and cost of node progression escalates, we believe that price negotiating power
could weaken. Perhaps with key customers TSMC, Intel (~15%) and Samsung all now
shareholders, a recognition of this direction has already been made. So far, ASML has been
able to directly negotiate pricing in euros whereas this industry works on dollars globally
– maybe that at least gets reversed. Secondly, ASML has relied greatly on a super-cycle
story for 20/22nm whereby foundries scramble to make up the capacity needs for high
end design for super-smartphone processors - with costs increasing at 22nm onwards,
many may choose to look at alternative, litho-light techniques such as 3D ICs (stacking)
and three bit cells (TLC and even MLC used in NAND memory) to push out or slow tech
shrink spend. Or it may just provoke the re-entry of Nikon in immersion – certainly the
signs of late were that ArF dry was a market they could do well in but it’s been noted
before (last cycle) that large fab players (Intel) have kept their order book turning in order
to keep ASML’s pricing keen.
ASML view: Not a Moore’s Law slowdown but more a temporary issue or a
fight on margin near term. ASML’s response is that this is a ‚blip‛ – a one-off that
gets reversed when EUV technology starts to ship in commercial volumes. Right now, the
semis industry is becoming heavily reliant on double and even triple patterning
immersion tech for leading edge (sub-32nm) and this is not so capital efficient for the
chipmakers – can be more than 2x more costly in production unit terms vs. single
patterning immersion (number of exposures kills the economics here); shrink will deal
with a lot of this but not all of it. The outcome could be that litho as a % of capex spend
rises. The range is often expected as 15-25% - we believe this was ~21% in FY12 with FY13
looking to be at or above 25%. The battle, as ASML sees it, is not necessarily with price
negotiating down triple patterning and double patterning immersion but where
page 9 of 21 , Equity Analyst, 44 (0) 207 029 8695, [email protected] Simpson
Please see important disclosure information on pages 17 - 21 of this report.
ASML NA
Target | Estimate Change
11 October 2012
foundries will let their margins drift to vs. how much pain (cost) the fabless
chipmakers (e.g. NVidia) will just suck up this time.
4. Possible order book ‚air-gap‛?
We believe that the logic order book is still 28nm in the main but 22nm
(which has a 37% exposure increase on 28nm) is set to build from 2Q/3Q13
(previously we thought 1Q). Our recent site visit showed a facility ready to
deliver the €1.2bn sales guided in 3Q. The company has already converted
75% of its XT cabins to NXT and the site tour made it obvious to us that there
was a lot of work on NXT (Twinscan 1950i) tools afoot. Yet we believe drivers
in logic (28nm) and memory (esp. NAND) are already greying (2H12) as end
demand weakens (China, EU). Compounding this may be the flattening need
for new 28nm capacity at foundries even in smartphones and tablets. Yet this
pattern may be short-lived - we expect build schedules for 20-22nm to start
up in 2H13, albeit more slowly than 28nm.
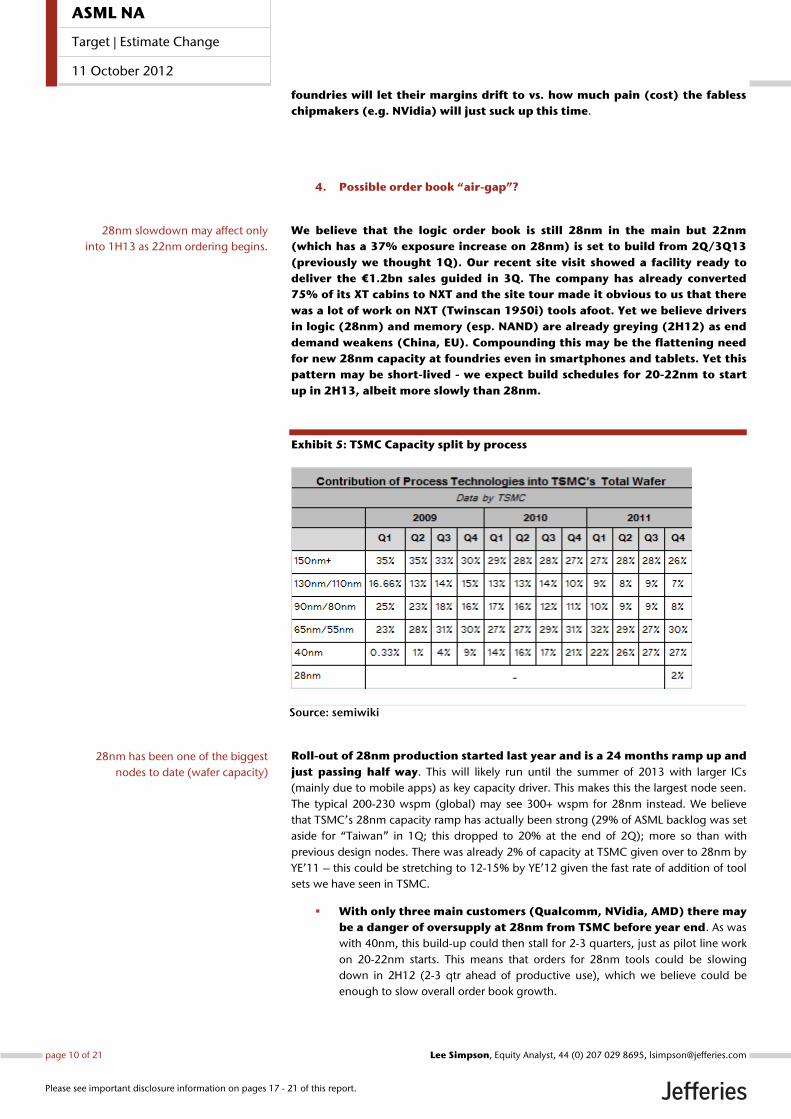
Exhibit 5: TSMC Capacity split by process
Source: semiwiki
Roll-out of 28nm production started last year and is a 24 months ramp up and
just passing half way. This will likely run until the summer of 2013 with larger ICs
(mainly due to mobile apps) as key capacity driver. This makes this the largest node seen.
The typical 200-230 wspm (global) may see 300+ wspm for 28nm instead. We believe
that TSMC’s 28nm capacity ramp has actually been strong (29% of ASML backlog was set
aside for ‚Taiwan‛ in 1Q; this dropped to 20% at the end of 2Q); more so than with
previous design nodes. There was already 2% of capacity at TSMC given over to 28nm by
YE’11 – this could be stretching to 12-15% by YE’12 given the fast rate of addition of tool
sets we have seen in TSMC.
With only three main customers (Qualcomm, NVidia, AMD) there may
be a danger of oversupply at 28nm from TSMC before year end. As was
with 40nm, this build-up could then stall for 2-3 quarters, just as pilot line work
on 20-22nm starts. This means that orders for 28nm tools could be slowing
down in 2H12 (2-3 qtr ahead of productive use), which we believe could be
enough to slow overall order book growth.
Comment ###
28nm slowdown may affect only
into 1H13 as 22nm ordering begins.
28nm has been one of the biggest
nodes to date (wafer capacity)
page 10 of 21 , Equity Analyst, 44 (0) 207 029 8695, [email protected] Simpson
Please see important disclosure information on pages 17 - 21 of this report.
ASML NA
Target | Estimate Change
11 October 2012
20-22nm logic as driver? Looking into 2H13e we see an order rebound
(Immersion, KrF) as the semis industry marks a cyclical upswing in spending in
response to: (i) end of pause in 28nm investment in 2H12, (ii) a new shrink and
return to spend in NAND and (iii) increasing critical layers in logic at 22nm. Both
65 and 40nm were cost reduction shrink – it’s possible that 20/22nm will be the
same but we think this will be more driven by competitive needs given Intel’s
lead.
2013: Are we really in a logic super-cycle? In the past, TSMC were masters at
balancing demand and capacity, often putting customers on ‚allocation‛ if new. Now
rivals Samsung and GlobalFoundries are spending heavily forcing TSMC’s hand and
changing their capex spending habits – now aim to have capacity to make 10-15% more
chips as buffer. This has hastened the changing capital efficiency at TSMC. The question is
will the trend stay like this? Intel may be key. We note Intel’s plans to have 14nm in
production using double patterning immersion during 2013. We also believe there are
plans to start up an EUV pilot line (initially using an NXE3100 machine) at some point next
year too. At 10nm, Intel will likely use complementary patterning – a mix of EUV and ArF
immersion techniques. With Intel moving to high-volume 14nm production (critical layers
double) in 2013/14 we should see continued spend by Intel on Fab equipment through
2013. But this can be satisfied to some degree by excess capacity at 22nm.
5. Memory Softness: More downside possible
NAND: We don’t expect ASML’s NAND sales to pick up again until 2Q/3Q13.
We are still seeing 70-80% bit growth this year but despite shortages (spot
price squeeze?) we believe this slows to ~50% next year as production cuts
(30% at Toshiba) impact. The recent over-capacity in 1H gave way to spot price
softness and recent moves to cut capacity. The advent of 3-bits per cell (or TLC) means
rather than shrinking the die to improve density/capacity, TLC just increases the number
of bits per cell. TLC is working better than expected due to controllers (software)
distinguishing the levels. Elsewhere, some customer DRAM capacity is being converted to
NAND capacity.
With NAND, most of the bit supply growth this year (~50%) should come through shrink
with the balance coming from moderate capacity adds. Yet we believe that NAND capacity
will remain stable or increase only slightly next year. NAND suppliers just went
through another period of hard learning in 1H12, and that is likely to
translate to capacity add moderation in FY13. The market for Flash cards (aka
memory cards), which has traditionally represented 50%+ of the NAND market, is
shrinking to ~30% or lower fraction of the NAND market in CY12. Solid state drives (SSDs)
are still too nascent in market size and smartphone NAND is unlikely to grow within the
device. But it is still macro uncertainty and a proclivity for chipmakers to under ship
consumption to maintain pricing that carries the greatest risk to order flow in memory.
DRAM: PC pain goes on
Some mid-year glimmers of hope for DRAM capex (pricing recovery) were
extinguished with poor PC traction. Bit demand hovers below 40% per annum. There’s no
more than 4GB DRAM in Win8 devices and Apple is picked up just 0.5GB in the new iPad.
Ultrabooks can be thought of as a mandatory project for Intel and MSFT (otherwise big
product cycle pressure there) but the relative size of the market means this is unlikely a
genuine driver for ASML vs. mobility drivers. We see DRAM bit growth capped below 40%
annually with a chance that DRAM capacity taken is actually transferred out. Bit demand
growth of c.40% can be satisfied on upgrades and new shrinks only. So there is no real
need for new fabs.
Early signs are that 2013 order book
should resume growth
Bit demand growth for both NAND
and DRAM is too narrow to support
order book.
Comment ###
page 11 of 21 , Equity Analyst, 44 (0) 207 029 8695, [email protected] Simpson
Please see important disclosure information on pages 17 - 21 of this report.
ASML NA
Target | Estimate Change
11 October 2012
6. The 450mm Migration
Many SPE players note that the size of the 450mm opportunity is smaller than
the opportunity at 300mm was, which was in turn smaller than the
opportunity at 200mm. Meaning, equipment suppliers will not see as many
orders for 450mm tools as they did in the previous wafer size transitions. A
small number of chip makers dominate the industry now, however, and if
those suppliers begin to really demand 450mm, equipment makers will need
to support the move. A tie up between Intel/ASML here is (i) skewed much
more to the needs of Intel, and (ii) puts inevitable pressure on other
equipment makers to follow course. This will likely see a lot more chip
fab/supply chain collaboration – recent consolidation in the chip
manufacturing sector could actually improve supply chain collaboration, as
tool suppliers and infrastructure support companies build R&D teams around
‚mega companies‛ making chips.
There has been a perceived issue for ASML in past that with 450mm, being
more than double the size of surface area than 300mm, demand for
individual machines would be crunched. Firstly, ASML would likely re-use as much
of the same modular design in their machines (laser, lens, supply, etc.) as they could. But
things like the wafer platform (stage) and also the chassis will have to size up to
accommodate bigger wafer size. There may also have to be a change to the motors for
stepping but likely a more trivial change.
So ASML may have something like a 1.3-1.5x component cost (just a total guess here) for
something that does a similar task to 300mm equivalent – it’s conjecture on my part but
likely that with Intel as the main customer they will be able to get say a 1.2x ASP
equivalent for 450mm vs. 300mm with perhaps a bit more elasticity in price with other
customers. This is crude but suggests we have a smaller margin. More worrying for me is
that demand needs are covered more by these bigger wafers. This is a 2015+ story but
something that might appear as a headwind for the story just as EUV goes into volume
production. I'm just playing with darker side of the story here.
The cost for the chipmaker What goes into making a cleanroom 450mm accessible?
Higher ceilings, increased weight-bearing specifications, and more room for tools like
extreme ultraviolet (EUV) lithography scanners. Litho equipment that needs new wafer
stages that move at high speeds through various environments (air, liquid, etc.) is just one
piece in the puzzle.
How is the ecosystem developing? The annual SPE conference, SEMICON West, is on
right now and there's lots of buzz around 450mm.
KLA-Tencor installed its first process control systems for handling and inspecting
unpatterned 450mm wafers (Surfscan SP3 450). KLA-Tencor says it has received
multiple orders for its 450mm-capable tool and shipped several systems (IMEC,
the research institute, is using one).
Elsewhere, CyberOptics came out with a 450mm version of its WaferSense Auto
Vibration System, AVS450. The product is a wireless wafer-life vibration
monitoring device that measures vibrations of wafer transfers in x, y and z
dimensions during semiconductor processes.
We also note that IMEC has a €100m grant from the Belgian government to
build 450mm wafer fab cleanrooms, which means they are working on process
challenges, throughput enhancement, etc., for the 10nm/14nm node.
So, you can see the ecosystem is starting to build.
Comment ###
page 12 of 21 , Equity Analyst, 44 (0) 207 029 8695, [email protected] Simpson
Please see important disclosure information on pages 17 - 21 of this report.
ASML NA
Target | Estimate Change
11 October 2012
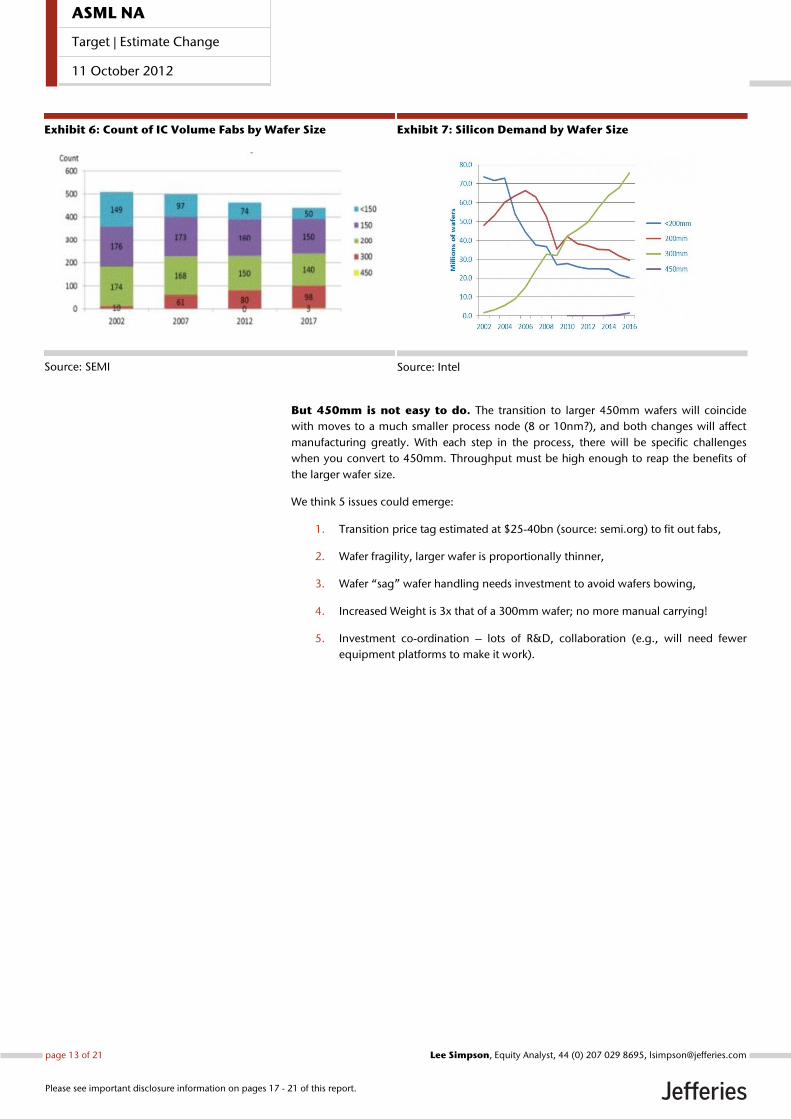
Exhibit 6: Count of IC Volume Fabs by Wafer Size
Source: SEMI
Exhibit 7: Silicon Demand by Wafer Size
Source: Intel
But 450mm is not easy to do. The transition to larger 450mm wafers will coincide
with moves to a much smaller process node (8 or 10nm?), and both changes will affect
manufacturing greatly. With each step in the process, there will be specific challenges
when you convert to 450mm. Throughput must be high enough to reap the benefits of
the larger wafer size.
We think 5 issues could emerge:
1. Transition price tag estimated at $25-40bn (source: semi.org) to fit out fabs,
2. Wafer fragility, larger wafer is proportionally thinner,
3. Wafer ‚sag‛ wafer handling needs investment to avoid wafers bowing,
4. Increased Weight is 3x that of a 300mm wafer; no more manual carrying!
5. Investment co-ordination – lots of R&D, collaboration (e.g., will need fewer
equipment platforms to make it work).
page 13 of 21 , Equity Analyst, 44 (0) 207 029 8695, [email protected] Simpson
Please see important disclosure information on pages 17 - 21 of this report.
ASML NA
Target | Estimate Change
11 October 2012
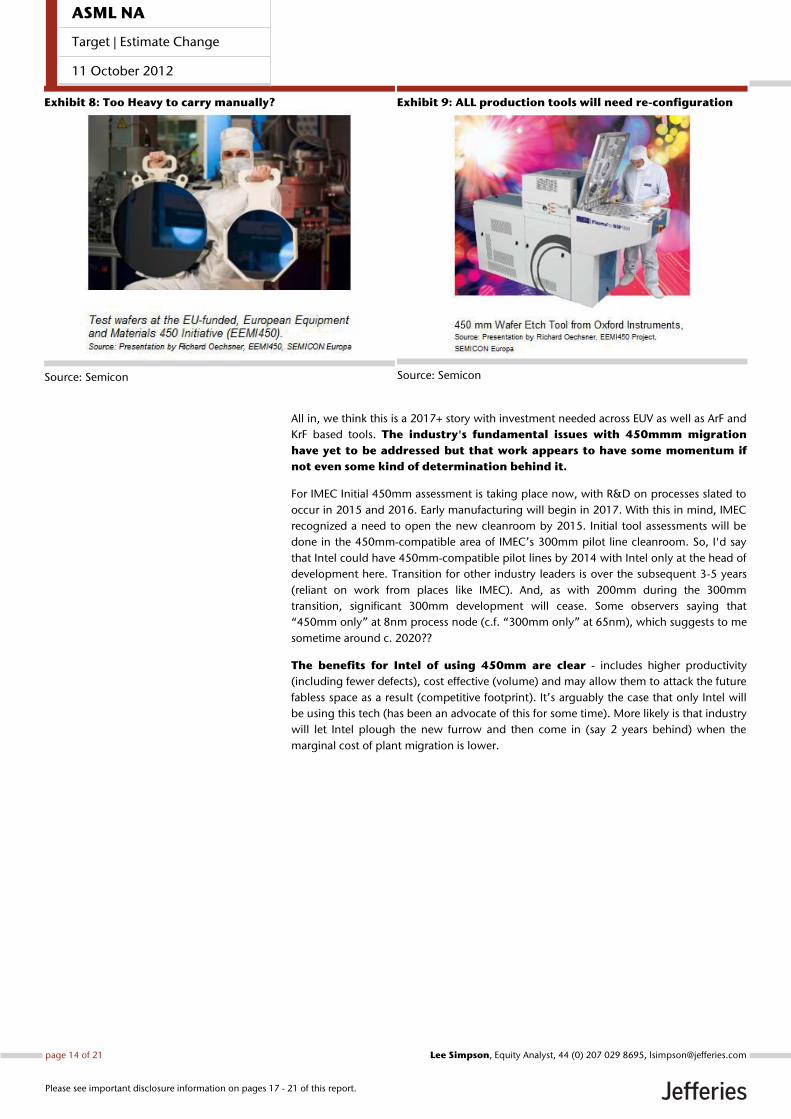
Exhibit 8: Too Heavy to carry manually?
Source: Semicon
Exhibit 9: ALL production tools will need re-configuration
Source: Semicon
All in, we think this is a 2017+ story with investment needed across EUV as well as ArF and
KrF based tools. The industry's fundamental issues with 450mmm migration
have yet to be addressed but that work appears to have some momentum if
not even some kind of determination behind it.
For IMEC Initial 450mm assessment is taking place now, with R&D on processes slated to
occur in 2015 and 2016. Early manufacturing will begin in 2017. With this in mind, IMEC
recognized a need to open the new cleanroom by 2015. Initial tool assessments will be
done in the 450mm-compatible area of IMEC’s 300mm pilot line cleanroom. So, I'd say
that Intel could have 450mm-compatible pilot lines by 2014 with Intel only at the head of
development here. Transition for other industry leaders is over the subsequent 3-5 years
(reliant on work from places like IMEC). And, as with 200mm during the 300mm
transition, significant 300mm development will cease. Some observers saying that
‚450mm only‛ at 8nm process node (c.f. ‚300mm only‛ at 65nm), which suggests to me
sometime around c. 2020??
The benefits for Intel of using 450mm are clear - includes higher productivity
(including fewer defects), cost effective (volume) and may allow them to attack the future
fabless space as a result (competitive footprint). It’s arguably the case that only Intel will
be using this tech (has been an advocate of this for some time). More likely is that industry
will let Intel plough the new furrow and then come in (say 2 years behind) when the
marginal cost of plant migration is lower.
page 14 of 21 , Equity Analyst, 44 (0) 207 029 8695, [email protected] Simpson
Please see important disclosure information on pages 17 - 21 of this report.
ASML NA
Target | Estimate Change
11 October 2012
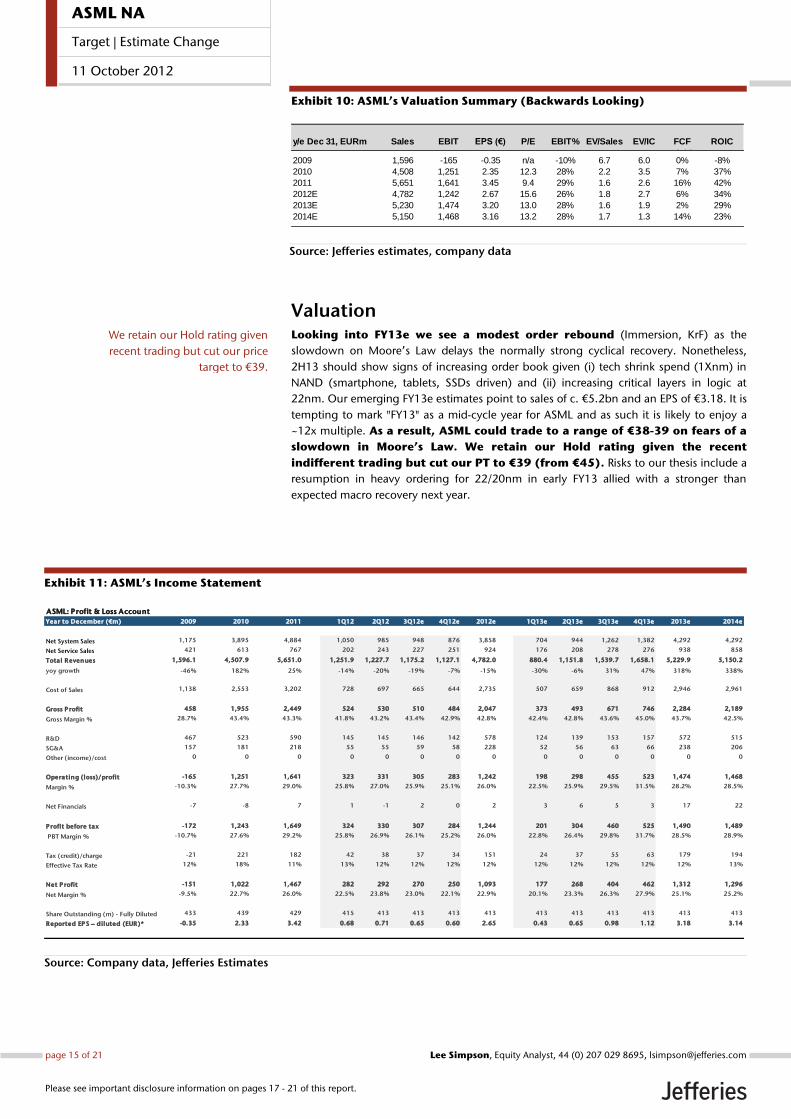
Exhibit 10: ASML’s Valuation Summary (Backwards Looking)
Source: Jefferies estimates, company data
Valuation Looking into FY13e we see a modest order rebound (Immersion, KrF) as the
slowdown on Moore’s Law delays the normally strong cyclical recovery. Nonetheless,
2H13 should show signs of increasing order book given (i) tech shrink spend (1Xnm) in
NAND (smartphone, tablets, SSDs driven) and (ii) increasing critical layers in logic at
22nm. Our emerging FY13e estimates point to sales of c. €5.2bn and an EPS of €3.18. It is
tempting to mark "FY13" as a mid-cycle year for ASML and as such it is likely to enjoy a
~12x multiple. As a result, ASML could trade to a range of €38-39 on fears of a
slowdown in Moore’s Law. We retain our Hold rating given the recent
indifferent trading but cut our PT to €39 (from €45). Risks to our thesis include a
resumption in heavy ordering for 22/20nm in early FY13 allied with a stronger than
expected macro recovery next year.
Exhibit 11: ASML’s Income Statement
Source: Company data, Jefferies Estimates
Sales EBIT EPS (€) P/E EBIT% EV/Sales EV/IC FCF
yield
ROIC
2009 1,596 -165 -0.35 n/a -10% 6.7 6.0 0% -8%
2010 4,508 1,251 2.35 12.3 28% 2.2 3.5 7% 37%
2011 5,651 1,641 3.45 9.4 29% 1.6 2.6 16% 42%
2012E 4,782 1,242 2.67 15.6 26% 1.8 2.7 6% 34%
2013E 5,230 1,474 3.20 13.0 28% 1.6 1.9 2% 29%
2014E 5,150 1,468 3.16 13.2 28% 1.7 1.3 14% 23%
y/e Dec 31, EURm
2009 2010 2011 1Q12 2Q12 3Q12e 4Q12e 2012e 1Q13e 2Q13e 3Q13e 4Q13e 2013e 2014e
Net System Sales 1,175 3,895 4,884 1,050 985 948 876 3,858 704 944 1,262 1,382 4,292 4,292
Net Service Sales 421 613 767 202 243 227 251 924 176 208 278 276 938 858
Total Revenues 1,596.1 4,507.9 5,651.0 1,251.9 1,227.7 1,175.2 1,127.1 4,782.0 880.4 1,151.8 1,539.7 1,658.1 5,229.9 5,150.2
yoy growth -46% 182% 25% -14% -20% -19% -7% -15% -30% -6% 31% 47% 318% 338%
Cost of Sales 1,138 2,553 3,202 728 697 665 644 2,735 507 659 868 912 2,946 2,961
Gross Profit 458 1,955 2,449 524 530 510 484 2,047 373 493 671 746 2,284 2,189
Gross Margin % 28.7% 43.4% 43.3% 41.8% 43.2% 43.4% 42.9% 42.8% 42.4% 42.8% 43.6% 45.0% 43.7% 42.5%
R&D 467 523 590 145 145 146 142 578 124 139 153 157 572 515
SG&A 157 181 218 55 55 59 58 228 52 56 63 66 238 206
Other (income)/cost 0 0 0 0 0 0 0 0 0 0 0 0 0 0
Operating (loss)/profit -165 1,251 1,641 323 331 305 283 1,242 198 298 455 523 1,474 1,468
Margin % -10.3% 27.7% 29.0% 25.8% 27.0% 25.9% 25.1% 26.0% 22.5% 25.9% 29.5% 31.5% 28.2% 28.5%
Net Financials -7 -8 7 1 -1 2 0 2 3 6 5 3 17 22
Profit before tax -172 1,243 1,649 324 330 307 284 1,244 201 304 460 525 1,490 1,489
PBT Margin % -10.7% 27.6% 29.2% 25.8% 26.9% 26.1% 25.2% 26.0% 22.8% 26.4% 29.8% 31.7% 28.5% 28.9%
Tax (credit)/charge -21 221 182 42 38 37 34 151 24 37 55 63 179 194
Effective Tax Rate 12% 18% 11% 13% 12% 12% 12% 12% 12% 12% 12% 12% 12% 13%
Net Profit -151 1,022 1,467 282 292 270 250 1,093 177 268 404 462 1,312 1,296
Net Margin % -9.5% 22.7% 26.0% 22.5% 23.8% 23.0% 22.1% 22.9% 20.1% 23.3% 26.3% 27.9% 25.1% 25.2%
Share Outstanding (m) - Fully Diluted 433 439 429 415 413 413 413 413 413 413 413 413 413 413
Reported EPS – diluted (EUR)* -0.35 2.33 3.42 0.68 0.71 0.65 0.60 2.65 0.43 0.65 0.98 1.12 3.18 3.14
Year to December (€m)
ASML: Profit & Loss Account
We retain our Hold rating given
recent trading but cut our price
target to €39.
page 15 of 21 , Equity Analyst, 44 (0) 207 029 8695, [email protected] Simpson
Please see important disclosure information on pages 17 - 21 of this report.
ASML NA
Target | Estimate Change
11 October 2012
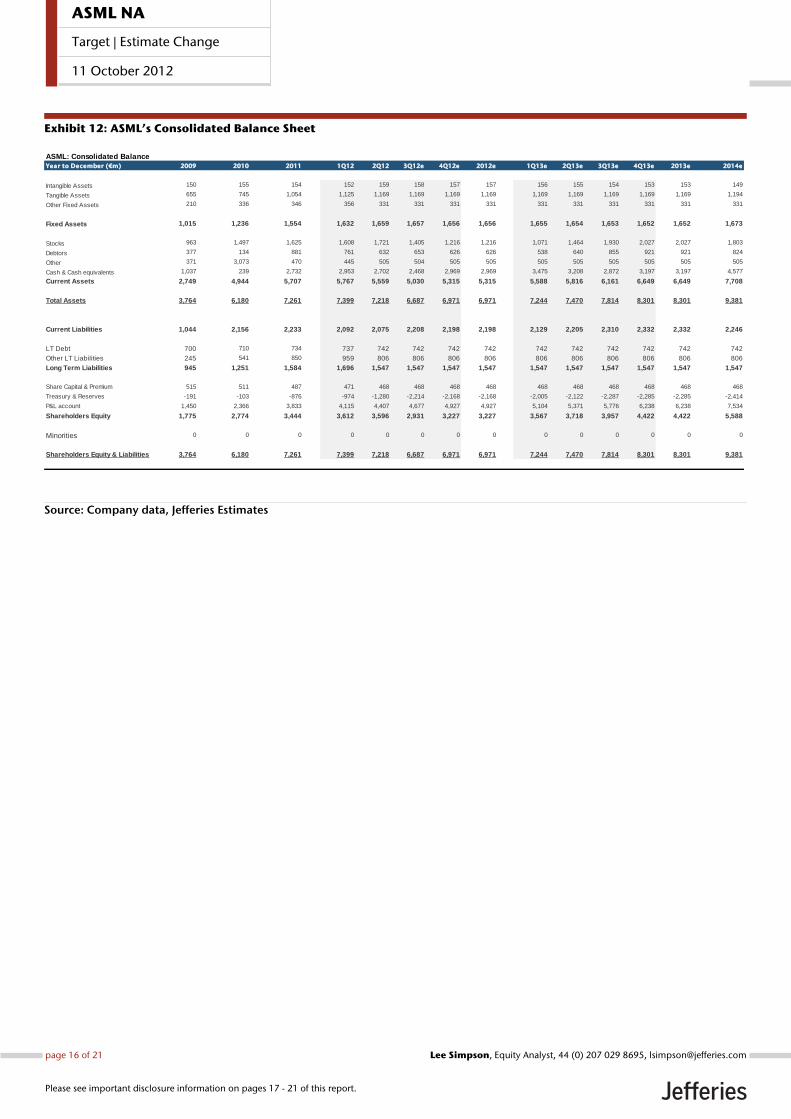
Exhibit 12: ASML’s Consolidated Balance Sheet
Source: Company data, Jefferies Estimates
2009 2010 2011 1Q12 2Q12 3Q12e 4Q12e 2012e 1Q13e 2Q13e 3Q13e 4Q13e 2013e 2014e
Intangible Assets 150 155 154 152 159 158 157 157 156 155 154 153 153 149
Tangible Assets 655 745 1,054 1,125 1,169 1,169 1,169 1,169 1,169 1,169 1,169 1,169 1,169 1,194
Other Fixed Assets 210 336 346 356 331 331 331 331 331 331 331 331 331 331
Fixed Assets 1,015 1,236 1,554 1,632 1,659 1,657 1,656 1,656 1,655 1,654 1,653 1,652 1,652 1,673
Stocks 963 1,497 1,625 1,608 1,721 1,405 1,216 1,216 1,071 1,464 1,930 2,027 2,027 1,803
Debtors 377 134 881 761 632 653 626 626 538 640 855 921 921 824
Other 371 3,073 470 445 505 504 505 505 505 505 505 505 505 505
Cash & Cash equivalents 1,037 239 2,732 2,953 2,702 2,468 2,969 2,969 3,475 3,208 2,872 3,197 3,197 4,577
Current Assets 2,749 4,944 5,707 5,767 5,559 5,030 5,315 5,315 5,588 5,816 6,161 6,649 6,649 7,708
Total Assets 3,764 6,180 7,261 7,399 7,218 6,687 6,971 6,971 7,244 7,470 7,814 8,301 8,301 9,381
Current Liabilities 1,044 2,156 2,233 2,092 2,075 2,208 2,198 2,198 2,129 2,205 2,310 2,332 2,332 2,246
LT Debt 700 710 734 737 742 742 742 742 742 742 742 742 742 742
Other LT Liabilities 245 541 850 959 806 806 806 806 806 806 806 806 806 806
Long Term Liabilities 945 1,251 1,584 1,696 1,547 1,547 1,547 1,547 1,547 1,547 1,547 1,547 1,547 1,547
Share Capital & Premium 515 511 487 471 468 468 468 468 468 468 468 468 468 468
Treasury & Reserves -191 -103 -876 -974 -1,280 -2,214 -2,168 -2,168 -2,005 -2,122 -2,287 -2,285 -2,285 -2,414
P&L account 1,450 2,366 3,833 4,115 4,407 4,677 4,927 4,927 5,104 5,371 5,776 6,238 6,238 7,534
Shareholders Equity 1,775 2,774 3,444 3,612 3,596 2,931 3,227 3,227 3,567 3,718 3,957 4,422 4,422 5,588
Minorities 0 0 0 0 0 0 0 0 0 0 0 0 0 0
Shareholders Equity & Liabilities 3,764 6,180 7,261 7,399 7,218 6,687 6,971 6,971 7,244 7,470 7,814 8,301 8,301 9,381
Year to December (€m)
ASML: Consolidated Balance
page 16 of 21 , Equity Analyst, 44 (0) 207 029 8695, [email protected] Simpson
Please see important disclosure information on pages 17 - 21 of this report.
ASML NA
Target | Estimate Change
11 October 2012
Company DescriptionDutch-based (Veldhoven) ASML Holdings NV is the dominant supplier (75% share) of lithography equipment to the global semiconductorindustry. ASML designs, develops, integrates, markets and services lithography systems, which are necessary for the fabrication ofmicroelectronic chips. The company retains a focus on next-gen R&D and marketing whilst outsourcing c.90% of its production to third-party system assemblers. Formerly part of Philips, ASML was spun off in 1984 (renamed as Philips Labs). By 1988, Philips Labs was renamedas ASML and floated on the Amsterdam and New York exchanges. Today, ASML has a 100% free float.
Analyst CertificationI, Lee Simpson, certify that all of the views expressed in this research report accurately reflect my personal views about the subject security(ies) andsubject company(ies). I also certify that no part of my compensation was, is, or will be, directly or indirectly, related to the specific recommendationsor views expressed in this research report.Registration of non-US analysts: Lee Simpson is employed by Jefferies International Limited, a non-US affiliate of Jefferies & Company, Inc. andis not registered/qualified as a research analyst with FINRA. This analyst(s) may not be an associated person of Jefferies & Company, Inc., a FINRAmember firm, and therefore may not be subject to the NASD Rule 2711 and Incorporated NYSE Rule 472 restrictions on communications with a subjectcompany, public appearances and trading securities held by a research analyst.
As is the case with all Jefferies employees, the analyst(s) responsible for the coverage of the financial instruments discussed in this report receivescompensation based in part on the overall performance of the firm, including investment banking income. We seek to update our research asappropriate, but various regulations may prevent us from doing so. Aside from certain industry reports published on a periodic basis, the large majorityof reports are published at irregular intervals as appropriate in the analyst's judgement.
Rafi Hassan owns shares of Nividia Corporation common stock.Jefferies Group, Inc. makes a market in the securities or ADRs of ASML Holding NV.Jefferies Group, Inc. makes a market in the securities or ADRs of Intel Corporation.Jefferies Group, Inc. makes a market in the securities or ADRs of NVIDIA Corporation.Within the past twelve months, Jefferies & Company, Inc. and/or its affiliates received compensation for products and services other than investmentbanking services from non-investment banking, securities related compensation for client services it provided to Advanced Micro Devices, Inc..Within the past twelve months, Jefferies & Company, Inc. and/or its affiliates received compensation for products and services other than investmentbanking services from non-investment banking, securities related compensation for client services it provided to Intel Corporation.
Meanings of Jefferies RatingsBuy - Describes stocks that we expect to provide a total return (price appreciation plus yield) of 15% or more within a 12-month period.Hold - Describes stocks that we expect to provide a total return (price appreciation plus yield) of plus 15% or minus 10% within a 12-month period.Underperform - Describes stocks that we expect to provide a total negative return (price appreciation plus yield) of 10% or more within a 12-monthperiod.The expected total return (price appreciation plus yield) for Buy rated stocks with an average stock price consistently below $10 is 20% or more withina 12-month period as these companies are typically more volatile than the overall stock market. For Hold rated stocks with an average stock priceconsistently below $10, the expected total return (price appreciation plus yield) is plus or minus 20% within a 12-month period. For Underperformrated stocks with an average stock price consistently below $10, the expected total return (price appreciation plus yield) is minus 20% within a 12-month period.NR - The investment rating and price target have been temporarily suspended. Such suspensions are in compliance with applicable regulations and/or Jefferies policies.CS - Coverage Suspended. Jefferies has suspended coverage of this company.NC - Not covered. Jefferies does not cover this company.Restricted - Describes issuers where, in conjunction with Jefferies engagement in certain transactions, company policy or applicable securitiesregulations prohibit certain types of communications, including investment recommendations.Monitor - Describes stocks whose company fundamentals and financials are being monitored, and for which no financial projections or opinions onthe investment merits of the company are provided.
Valuation MethodologyJefferies' methodology for assigning ratings may include the following: market capitalization, maturity, growth/value, volatility and expected totalreturn over the next 12 months. The price targets are based on several methodologies, which may include, but are not restricted to, analyses of marketrisk, growth rate, revenue stream, discounted cash flow (DCF), EBITDA, EPS, cash flow (CF), free cash flow (FCF), EV/EBITDA, P/E, PE/growth, P/CF,P/FCF, premium (discount)/average group EV/EBITDA, premium (discount)/average group P/E, sum of the parts, net asset value, dividend returns,and return on equity (ROE) over the next 12 months.
Conviction List Methodology
1. The aim of the conviction list is to publicise the best individual stock ideas from Jefferies Global Research2. Only stocks with a Buy rating are allowed to be included in the recommended list.3. Stocks are screened for minimum market capitalisation and adequate daily turnover. Furthermore, a valuation, correlation and style screen
is used to ensure a well-diversified portfolio.4. Stocks are sorted to a maximum of 30 stocks with the maximum country exposure at around 50%. Limits are also imposed on a sector basis.5. Once a month, analysts are invited to recommend their best ideas. Analysts’ stock selection can be based on one or more of the following:
non-Consensus investment view, difference in earnings relative to Consensus, valuation methodology, target upside/downside % relative
page 17 of 21 , Equity Analyst, 44 (0) 207 029 8695, [email protected] Simpson
Please see important disclosure information on pages 17 - 21 of this report.
ASML NA
Target | Estimate Change
11 October 2012
to the current stock price. These are then assessed against existing holdings to ensure consistency. Stocks that have either reached theirtarget price, been downgraded over the course of the month or where a more suitable candidate has been found are removed.
6. All stocks are inserted at the last closing price and removed at the last closing price. There are no changes to the conviction list duringthe month.
7. Performance is calculated in US dollars on an equally weighted basis and is compared to MSCI World AC US$.8. The conviction list is published once a month whilst global equity markets are closed.9. Transaction fees are not included.
10. All corporate actions are taken into account.
Risk which may impede the achievement of our Price TargetThis report was prepared for general circulation and does not provide investment recommendations specific to individual investors. As such, thefinancial instruments discussed in this report may not be suitable for all investors and investors must make their own investment decisions basedupon their specific investment objectives and financial situation utilizing their own financial advisors as they deem necessary. Past performance ofthe financial instruments recommended in this report should not be taken as an indication or guarantee of future results. The price, value of, andincome from, any of the financial instruments mentioned in this report can rise as well as fall and may be affected by changes in economic, financialand political factors. If a financial instrument is denominated in a currency other than the investor's home currency, a change in exchange rates mayadversely affect the price of, value of, or income derived from the financial instrument described in this report. In addition, investors in securities suchas ADRs, whose values are affected by the currency of the underlying security, effectively assume currency risk.
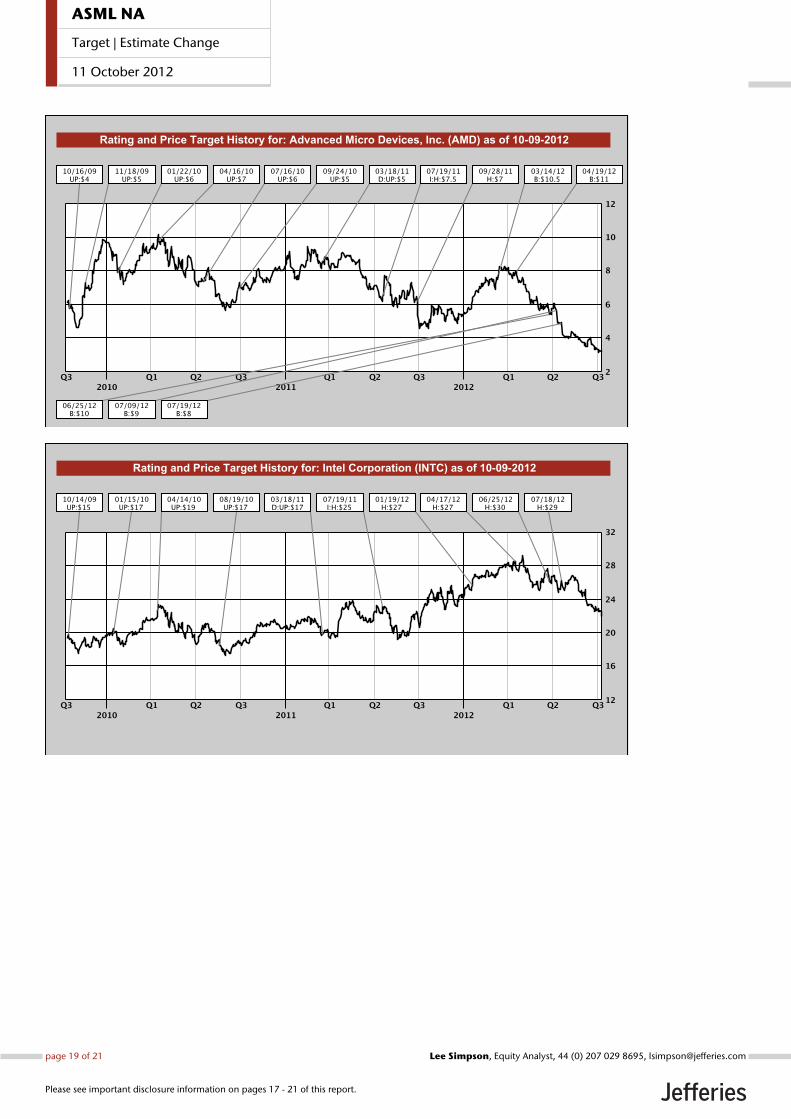
Other Companies Mentioned in This Report• Advanced Micro Devices, Inc. (AMD: $3.15, BUY)• Intel Corporation (INTC: $21.76, HOLD)• NVIDIA Corporation (NVDA: $12.67, HOLD)
page 18 of 21 , Equity Analyst, 44 (0) 207 029 8695, [email protected] Simpson
Please see important disclosure information on pages 17 - 21 of this report.
ASML NA
Target | Estimate Change
11 October 2012
page 19 of 21 , Equity Analyst, 44 (0) 207 029 8695, [email protected] Simpson
Please see important disclosure information on pages 17 - 21 of this report.
ASML NA
Target | Estimate Change
11 October 2012
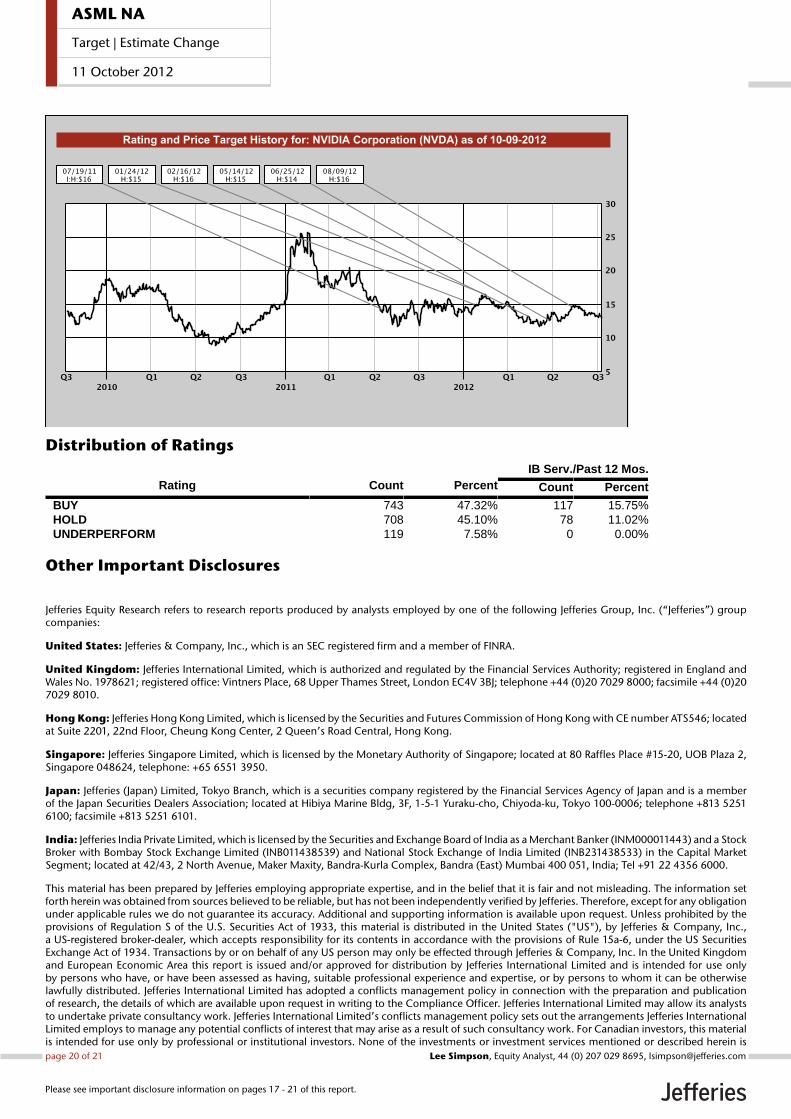
Distribution of RatingsIB Serv./Past 12 Mos.
Rating Count Percent Count Percent
BUY 743 47.32% 117 15.75%HOLD 708 45.10% 78 11.02%UNDERPERFORM 119 7.58% 0 0.00%
Other Important Disclosures
Jefferies Equity Research refers to research reports produced by analysts employed by one of the following Jefferies Group, Inc. (“Jefferies”) groupcompanies:
United States: Jefferies & Company, Inc., which is an SEC registered firm and a member of FINRA.
United Kingdom: Jefferies International Limited, which is authorized and regulated by the Financial Services Authority; registered in England andWales No. 1978621; registered office: Vintners Place, 68 Upper Thames Street, London EC4V 3BJ; telephone +44 (0)20 7029 8000; facsimile +44 (0)207029 8010.
Hong Kong: Jefferies Hong Kong Limited, which is licensed by the Securities and Futures Commission of Hong Kong with CE number ATS546; locatedat Suite 2201, 22nd Floor, Cheung Kong Center, 2 Queen’s Road Central, Hong Kong.
Singapore: Jefferies Singapore Limited, which is licensed by the Monetary Authority of Singapore; located at 80 Raffles Place #15-20, UOB Plaza 2,Singapore 048624, telephone: +65 6551 3950.
Japan: Jefferies (Japan) Limited, Tokyo Branch, which is a securities company registered by the Financial Services Agency of Japan and is a memberof the Japan Securities Dealers Association; located at Hibiya Marine Bldg, 3F, 1-5-1 Yuraku-cho, Chiyoda-ku, Tokyo 100-0006; telephone +813 52516100; facsimile +813 5251 6101.
India: Jefferies India Private Limited, which is licensed by the Securities and Exchange Board of India as a Merchant Banker (INM000011443) and a StockBroker with Bombay Stock Exchange Limited (INB011438539) and National Stock Exchange of India Limited (INB231438533) in the Capital MarketSegment; located at 42/43, 2 North Avenue, Maker Maxity, Bandra-Kurla Complex, Bandra (East) Mumbai 400 051, India; Tel +91 22 4356 6000.
This material has been prepared by Jefferies employing appropriate expertise, and in the belief that it is fair and not misleading. The information setforth herein was obtained from sources believed to be reliable, but has not been independently verified by Jefferies. Therefore, except for any obligationunder applicable rules we do not guarantee its accuracy. Additional and supporting information is available upon request. Unless prohibited by theprovisions of Regulation S of the U.S. Securities Act of 1933, this material is distributed in the United States ("US"), by Jefferies & Company, Inc.,a US-registered broker-dealer, which accepts responsibility for its contents in accordance with the provisions of Rule 15a-6, under the US SecuritiesExchange Act of 1934. Transactions by or on behalf of any US person may only be effected through Jefferies & Company, Inc. In the United Kingdomand European Economic Area this report is issued and/or approved for distribution by Jefferies International Limited and is intended for use onlyby persons who have, or have been assessed as having, suitable professional experience and expertise, or by persons to whom it can be otherwiselawfully distributed. Jefferies International Limited has adopted a conflicts management policy in connection with the preparation and publicationof research, the details of which are available upon request in writing to the Compliance Officer. Jefferies International Limited may allow its analyststo undertake private consultancy work. Jefferies International Limited’s conflicts management policy sets out the arrangements Jefferies InternationalLimited employs to manage any potential conflicts of interest that may arise as a result of such consultancy work. For Canadian investors, this materialis intended for use only by professional or institutional investors. None of the investments or investment services mentioned or described herein ispage 20 of 21 , Equity Analyst, 44 (0) 207 029 8695, [email protected] Simpson
Please see important disclosure information on pages 17 - 21 of this report.
ASML NA
Target | Estimate Change
11 October 2012
available to other persons or to anyone in Canada who is not a "Designated Institution" as defined by the Securities Act (Ontario). For investors inthe Republic of Singapore, this material is provided by Jefferies Singapore Limited pursuant to Regulation 32C of the Financial Advisers Regulations.The material contained in this document is intended solely for accredited, expert or institutional investors, as defined under the Securities and FuturesAct (Cap. 289 of Singapore). If there are any matters arising from, or in connection with this material, please contact Jefferies Singapore Limited. InJapan this material is issued and distributed by Jefferies (Japan) Limited to institutional investors only. In Hong Kong, this report is issued and approvedby Jefferies Hong Kong Limited and is intended for use only by professional investors as defined in the Hong Kong Securities and Futures Ordinanceand its subsidiary legislation. In the Republic of China (Taiwan), this report should not be distributed. In India this report is made available by JefferiesIndia Private Limited. In Australia this information is issued solely by Jefferies International Limited and is directed solely at wholesale clients withinthe meaning of the Corporations Act 2001 of Australia (the "Act") in connection with their consideration of any investment or investment servicethat is the subject of this document. Any offer or issue that is the subject of this document does not require, and this document is not, a disclosuredocument or product disclosure statement within the meaning of the Act. Jefferies International Limited is authorised and regulated by the FinancialServices Authority under the laws of the United Kingdom, which differ from Australian laws. Jefferies International Limited has obtained relief underAustralian Securities and Investments Commission Class Order 03/1099, which conditionally exempts it from holding an Australian financial serviceslicence under the Act in respect of the provision of certain financial services to wholesale clients. Recipients of this document in any other jurisdictionsshould inform themselves about and observe any applicable legal requirements in relation to the receipt of this document.
This report is not an offer or solicitation of an offer to buy or sell any security or derivative instrument, or to make any investment. Any opinion orestimate constitutes the preparer's best judgment as of the date of preparation, and is subject to change without notice. Jefferies assumes no obligationto maintain or update this report based on subsequent information and events. Jefferies, its associates or affiliates, and its respective officers, directors,and employees may have long or short positions in, or may buy or sell any of the securities, derivative instruments or other investments mentioned ordescribed herein, either as agent or as principal for their own account. Upon request Jefferies may provide specialized research products or servicesto certain customers focusing on the prospects for individual covered stocks as compared to other covered stocks over varying time horizons orunder differing market conditions. While the views expressed in these situations may not always be directionally consistent with the long-term viewsexpressed in the analyst's published research, the analyst has a reasonable basis and any inconsistencies can be reasonably explained. This materialdoes not constitute a personal recommendation or take into account the particular investment objectives, financial situations, or needs of individualclients. Clients should consider whether any advice or recommendation in this report is suitable for their particular circumstances and, if appropriate,seek professional advice, including tax advice. The price and value of the investments referred to herein and the income from them may fluctuate. Pastperformance is not a guide to future performance, future returns are not guaranteed, and a loss of original capital may occur. Fluctuations in exchangerates could have adverse effects on the value or price of, or income derived from, certain investments. This report has been prepared independently ofany issuer of securities mentioned herein and not in connection with any proposed offering of securities or as agent of any issuer of securities. Noneof Jefferies, any of its affiliates or its research analysts has any authority whatsoever to make any representations or warranty on behalf of the issuer(s).Jefferies policy prohibits research personnel from disclosing a recommendation, investment rating, or investment thesis for review by an issuer priorto the publication of a research report containing such rating, recommendation or investment thesis. Any comments or statements made herein arethose of the author(s) and may differ from the views of Jefferies.
This report may contain information obtained from third parties, including ratings from credit ratings agencies such as Standard & Poor’s. Reproductionand distribution of third party content in any form is prohibited except with the prior written permission of the related third party. Third party contentproviders do not guarantee the accuracy, completeness, timeliness or availability of any information, including ratings, and are not responsible forany errors or omissions (negligent or otherwise), regardless of the cause, or for the results obtained from the use of such content. Third party contentproviders give no express or implied warranties, including, but not limited to, any warranties of merchantability or fitness for a particular purpose oruse. Third party content providers shall not be liable for any direct, indirect, incidental, exemplary, compensatory, punitive, special or consequentialdamages, costs, expenses, legal fees, or losses (including lost income or profits and opportunity costs) in connection with any use of their content,including ratings. Credit ratings are statements of opinions and are not statements of fact or recommendations to purchase, hold or sell securities. Theydo not address the suitability of securities or the suitability of securities for investment purposes, and should not be relied on as investment advice.
Jefferies research reports are disseminated and available primarily electronically, and, in some cases, in printed form. Electronic research issimultaneously available to all clients. This report or any portion hereof may not be reprinted, sold or redistributed without the written consent ofJefferies. Neither Jefferies nor any officer nor employee of Jefferies accepts any liability whatsoever for any direct, indirect or consequential damagesor losses arising from any use of this report or its contents.
For Important Disclosure information, please visit our website at https://javatar.bluematrix.com/sellside/Disclosures.action or call 1.888.JEFFERIES
© 2012 Jefferies Group, Inc.
page 21 of 21 , Equity Analyst, 44 (0) 207 029 8695, [email protected] Simpson
Please see important disclosure information on pages 17 - 21 of this report.
ASML NA
Target | Estimate Change
11 October 2012