Embed Size (px)
Citation preview

1
September 2016
ASIA PACIFIC DIGITAL LIMITED
FY16 Results Presentation
For
per
sona
l use
onl
y
2ASIA PACIFIC DIGITAL
DISCLAIMER
FY16 FULL YEAR RESULTS PRESENTATION
Not an offer
This Presentation is not a prospectus, product
disclosure statement or other offering document under
Australian law or any other law. This Presentation is for
information purposes only and is not an invitation or
offer of securities for subscription, purchase or sale in
any jurisdiction (and will not be lodged with the U.S
Securities Exchange Commission).
No Advice
This Presentation does not constitute investment or
financial product advice (nor tax, accounting or legal
advice) or any recommendation to acquire entitlements
or shares in the Company and does not and will not
form any part of any contract for the acquisition of
shares in the Company. Each recipient of this
Presentation should make its own enquiries and
investigations regarding all information in this
Presentation including but not limited to the
assumptions, uncertainties and contingencies which
may affect future operations of the Company and the
impact that different future outcomes may have on the
Company. Before making an investment decision,
prospective investors should consider the
appropriateness of the information having regard to
their own investment objectives, financial situation and
needs and seek legal, accounting and taxation advice
appropriate to their jurisdiction.
Foreign Jurisdictions
This Presentation may not be released or distributed in
the United States. This Presentation does not
constitute an offer to sell, or the solicitation of an offer
to buy, any securities in the United States.
Future performance
This Presentation contains certain ‘forward looking
statements’. Forward looking statements can generally
be identified by the use of forward looking words such
as, ‘expect’, ‘anticipate’, ‘likely’, ‘intend’, ‘should’,
‘could’, ‘may’, ‘predict’, ‘plan’, ‘propose’, ‘will’, ‘believe’,
‘forecast’, ‘estimate’, ‘target’ ‘outlook’, ‘guidance’ and
other similar expressions within the meaning of
securities laws of applicable jurisdictions. You are
cautioned not to place undue reliance on forward
looking statements. The statements, opinions and
estimates in this Presentation are based on
assumptions and contingencies subject to change
without notice, as are statements about market and
industry trends, projections, guidance and
estimates. The forward looking statements contained
in this Presentation are not guarantees or predictions of
future performance and involve known and unknown
risks and uncertainties and other factors, many of
which are beyond the control of the Company, and may
involve significant elements of subjective judgement
and assumptions as to future events which may or may
not be correct. There can be no assurance that actual
outcomes will not differ materially from these forward-
looking statements. A number of important factors
could cause actual results, achievements or
performance to differ materially from the forward
looking statements, including the risk factors set out in
this Presentation. The forward looking statements are
based on information available to the Company as at
the date of this Presentation.
Past performance
Investors should note that past performance is given
for illustrative purposes only and cannot be relied upon
as an indicator of (and provides no guidance as to)
future the Company’s performance. The pro forma
historical information is not represented as being
indicative of the Company’s views on its future financial
condition and/or performance.
Disclaimer
Neither the Company or its advisers or any of their
respective affiliates, related bodies corporate, directors,
officers, partners, employees and agents, have
authorised, permitted or caused the issue, submission,
dispatch or provision of this Presentation and, except to
the extent referred to in this Presentation, none of them
makes or purports to make any statement in this
Presentation and there is no statement in this
Presentation which is based on any statement by any
of them. To the maximum extent permitted by law, the
Company and its advisers, affiliates, related bodies
corporate, directors, officers, partners, employees and
agents make no representation or warranty, express or
implied, as to the currency, accuracy, reliability or
completeness of information in this Presentation.
Statements made in this Presentation are made only as
the date of this Presentation. The information in this
Presentation remains subject to change without notice.
For
per
sona
l use
onl
y
3VALUATION & INVESTMENT HIGHLIGHTSVALUATION & INVESTMENT HIGHLIGHTS
FY16 FULL YEAR RESULTS PRESENTATION
INVESTMENT HIGHLIGHTS
After platform
build, on track to
move to sustained
profitability in
FY17
p.24
South East Asia
is the world’s
highest growth
digital market
p.19
APD is uniquely
positioned to
participate in this
growth
p.20
Largely de-risked
with regional
platform
established
p.11-12
Expert team
with deep
industry
experience and
tech track
record
p.7-8
Valuation
undemanding
relative to market
peers and
transaction
metrics
p.29
1 2 3
4 5 6For
per
sona
l use
onl
y

4
OVERVIEW OF APD
For
per
sona
l use
onl
y
5
OVERVIEW OF APD
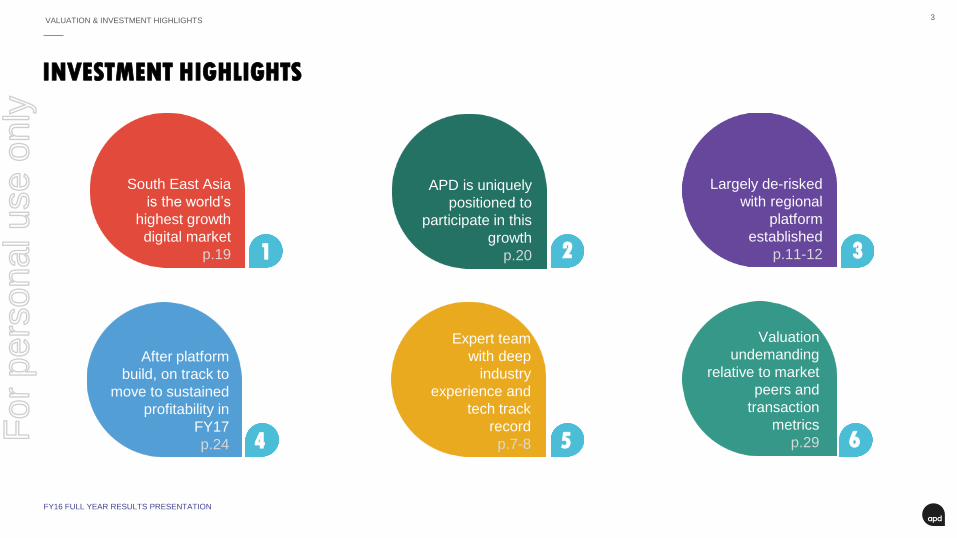
OVERVIEW OF APD
APAC’s largest
independent digital
services company
ASX: DIG ~400-strong team in
nine countries
$55m FY16 revenues
FY16 FULL YEAR RESULTS PRESENTATION
For
per
sona
l use
onl
y
6OVERVIEW OF APD
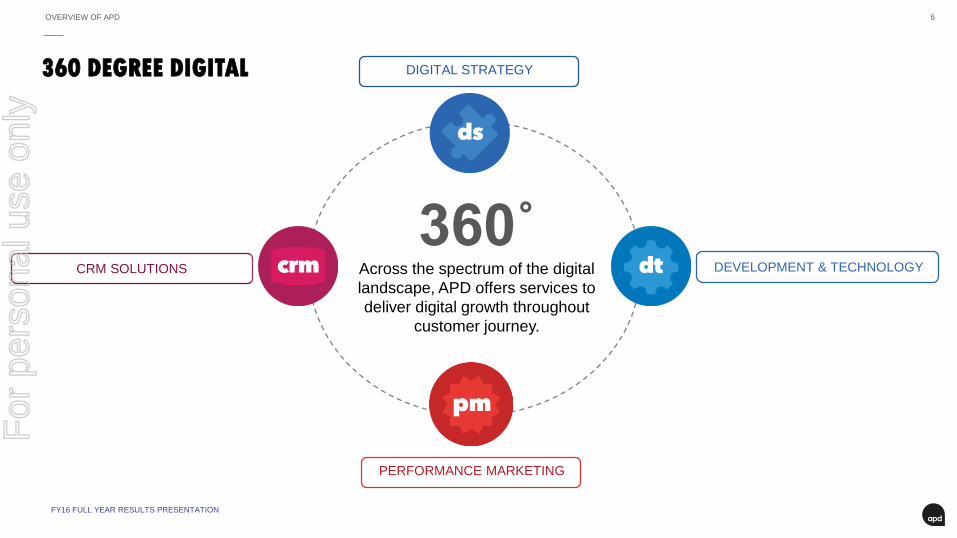
DIGITAL STRATEGY
DEVELOPMENT & TECHNOLOGY
PERFORMANCE MARKETING
CRM SOLUTIONS
360˚Across the spectrum of the digital
landscape, APD offers services to
deliver digital growth throughout
customer journey.
360 DEGREE DIGITAL
FY16 FULL YEAR RESULTS PRESENTATION
For
per
sona
l use
onl
y
7
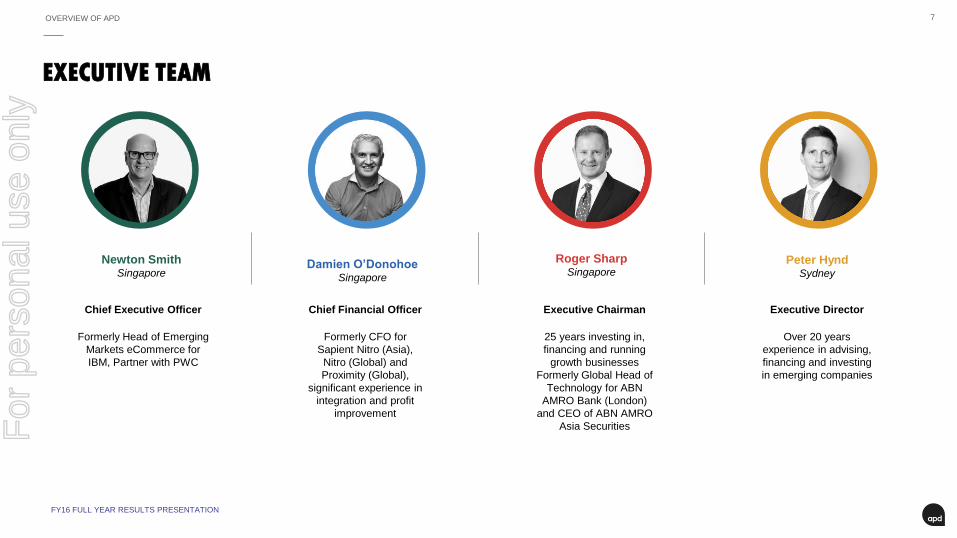
EXECUTIVE TEAM
Newton SmithSingapore
Chief Executive Officer
Formerly Head of Emerging
Markets eCommerce for
IBM, Partner with PWC
Damien O’DonohoeSingapore
Chief Financial Officer
Formerly CFO for
Sapient Nitro (Asia),
Nitro (Global) and
Proximity (Global),
significant experience in
integration and profit
improvement
Roger SharpSingapore
Peter HyndSydney
Executive Director
Over 20 years
experience in advising,
financing and investing
in emerging companies
Executive Chairman
25 years investing in,
financing and running
growth businesses
Formerly Global Head of
Technology for ABN
AMRO Bank (London)
and CEO of ABN AMRO
Asia Securities
OVERVIEW OF APD
FY16 FULL YEAR RESULTS PRESENTATION
For
per
sona
l use
onl
y
8
MAJOR SHAREHOLDER
OVERVIEW OF APD
FY16 FULL YEAR RESULTS PRESENTATION
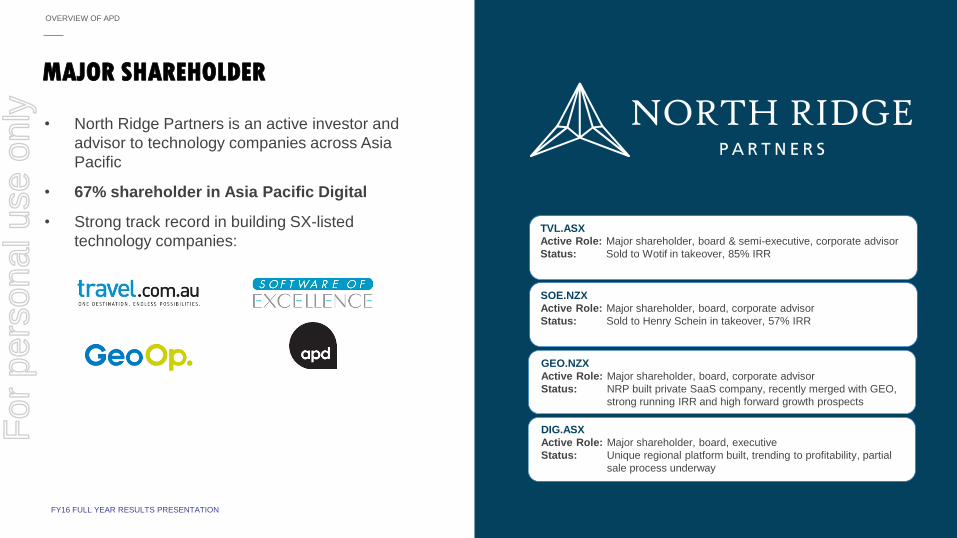
• North Ridge Partners is an active investor and
advisor to technology companies across Asia
Pacific
• 67% shareholder in Asia Pacific Digital
• Strong track record in building SX-listed
technology companies:TVL.ASX
Active Role: Major shareholder, board & semi-executive, corporate advisor
Status: Sold to Wotif in takeover, 85% IRR
SOE.NZX
Active Role: Major shareholder, board, corporate advisor
Status: Sold to Henry Schein in takeover, 57% IRR
GEO.NZX
Active Role: Major shareholder, board, corporate advisor
Status: NRP built private SaaS company, recently merged with GEO,
strong running IRR and high forward growth prospects
DIG.ASX
Active Role: Major shareholder, board, executive
Status: Unique regional platform built, trending to profitability, partial
sale process underway
For
per
sona
l use
onl
y
9OVERVIEW OF APD
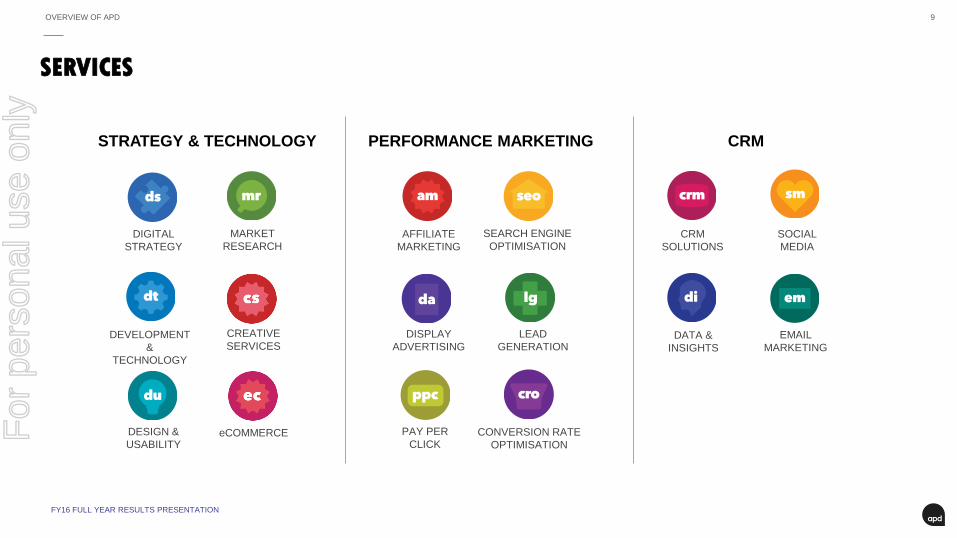
SERVICES
STRATEGY & TECHNOLOGY
DIGITAL
STRATEGY
DEVELOPMENT
&
TECHNOLOGY
DESIGN &
USABILITY
MARKET
RESEARCH
CREATIVE
SERVICES
eCOMMERCE
PERFORMANCE MARKETING
AFFILIATE
MARKETING
DISPLAY
ADVERTISING
PAY PER
CLICKCONVERSION RATE
OPTIMISATION
LEAD
GENERATION
SEARCH ENGINE
OPTIMISATION
CRM
CRM
SOLUTIONS
DATA &
INSIGHTS
MARKETING
SOCIAL
MEDIA
FY16 FULL YEAR RESULTS PRESENTATION
For
per
sona
l use
onl
y
10OVERVIEW OF APD
FY16 FULL YEAR RESULTS PRESENTATION
(1) TNS Marketing Monitor Study (2016)
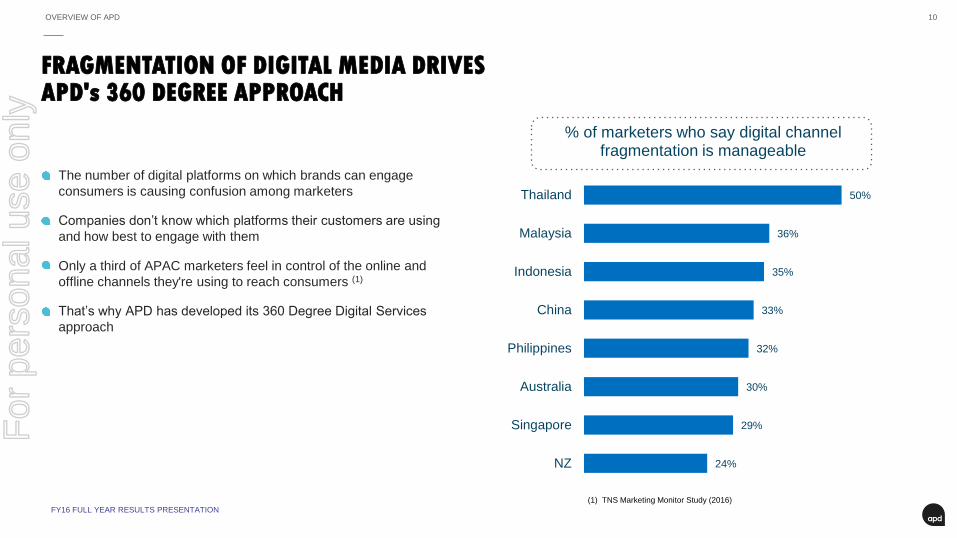
The number of digital platforms on which brands can engage
consumers is causing confusion among marketers
Companies don’t know which platforms their customers are using
and how best to engage with them
Only a third of APAC marketers feel in control of the online and
offline channels they're using to reach consumers (1)
That’s why APD has developed its 360 Degree Digital Services
approach
24%
29%
30%
32%
33%
35%
36%
50%
NZ
Singapore
Australia
Philippines
China
Indonesia
Malaysia
Thailand
% of marketers who say digital channel fragmentation is manageable
FRAGMENTATION OF DIGITAL MEDIA DRIVES APD's 360 DEGREE APPROACH
For
per
sona
l use
onl
y
11
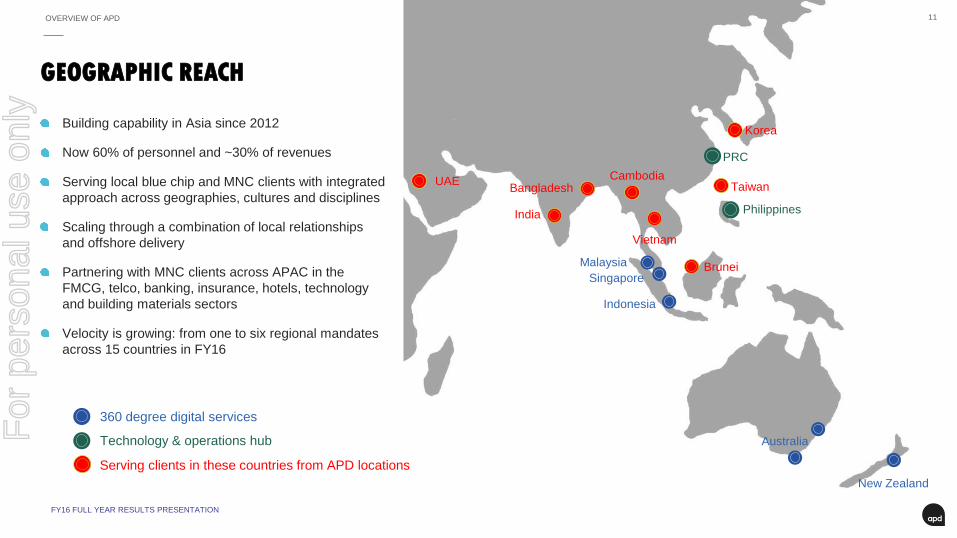
Building capability in Asia since 2012
Now 60% of personnel and ~30% of revenues
Serving local blue chip and MNC clients with integrated
approach across geographies, cultures and disciplines
Scaling through a combination of local relationships
and offshore delivery
Partnering with MNC clients across APAC in the
FMCG, telco, banking, insurance, hotels, technology
and building materials sectors
Velocity is growing: from one to six regional mandates
across 15 countries in FY16
PRC
Malaysia
Singapore
Australia
New Zealand
Indonesia
GEOGRAPHIC REACH
Serving clients in these countries from APD locations
Korea
Taiwan
Philippines
Vietnam
Brunei
CambodiaBangladesh
India
UAE
Technology & operations hub
360 degree digital services
OVERVIEW OF APD
FY16 FULL YEAR RESULTS PRESENTATION
For
per
sona
l use
onl
y
12
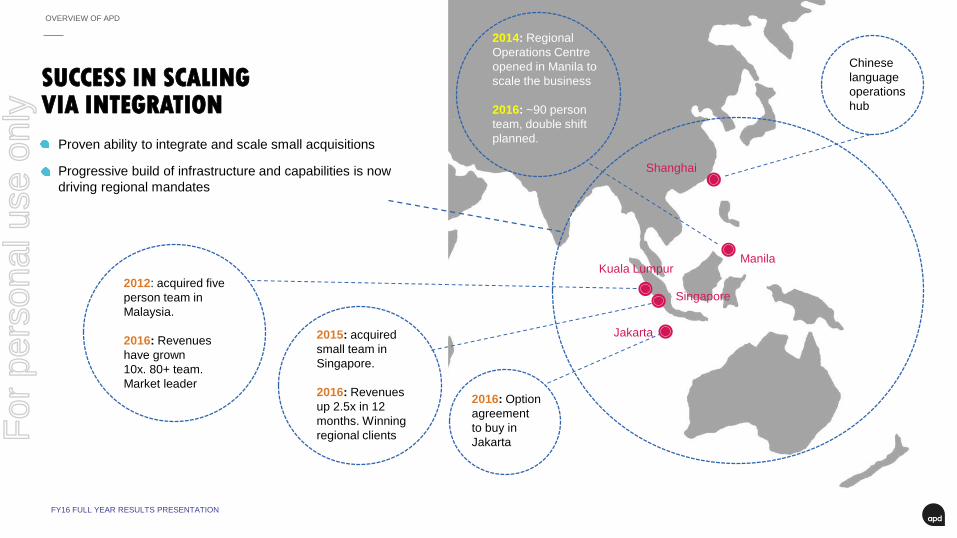
Proven ability to integrate and scale small acquisitions
Progressive build of infrastructure and capabilities is now
driving regional mandates
SUCCESS IN SCALING VIA INTEGRATION
OVERVIEW OF APD
FY16 FULL YEAR RESULTS PRESENTATION
Kuala Lumpur
Singapore
Manila
2012: acquired five
person team in
Malaysia.
2016: Revenues
have grown
10x. 80+ team.
Market leader
2014: Regional
Operations Centre
opened in Manila to
scale the business
2016: ~90 person
team, double shift
planned.
2015: acquired
small team in
Singapore.
2016: Revenues
up 2.5x in 12
months. Winning
regional clients
2016: Option
agreement
to buy in
Jakarta
Jakarta
Shanghai
Chinese
language
operations
hub
For
per
sona
l use
onl
y
13OVERVIEW OF APD
20 YEARS OF CLIENT SUCCESS STORIES
FY16 FULL YEAR RESULTS PRESENTATION
For
per
sona
l use
onl
y
14OVERVIEW OF APD
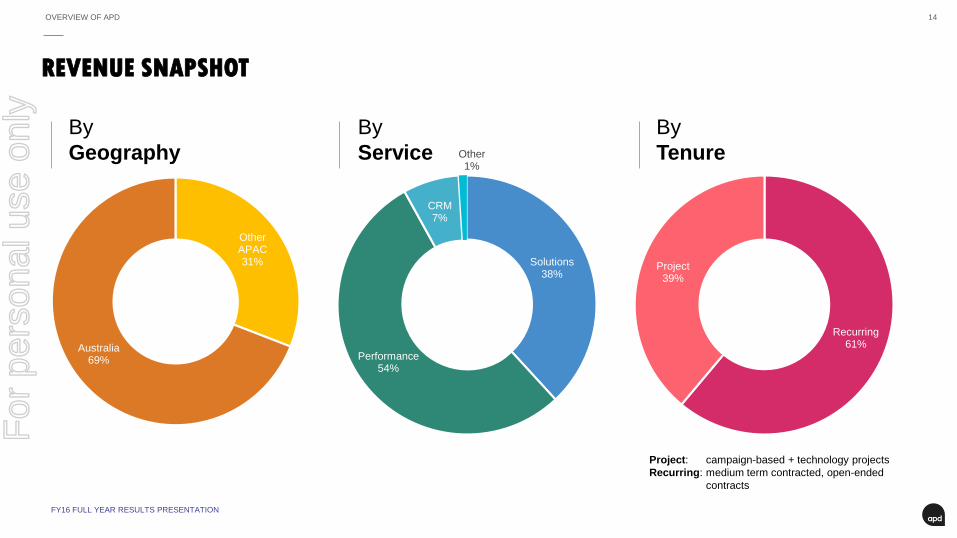
REVENUE SNAPSHOT
Other APAC31%
Australia69%
Solutions38%
Performance54%
CRM7%
Other1%
Recurring61%
Project39%
By
Geography
By
Service
By
Tenure
FY16 FULL YEAR RESULTS PRESENTATION
Project: campaign-based + technology projects
Recurring: medium term contracted, open-ended
contracts
For
per
sona
l use
onl
y
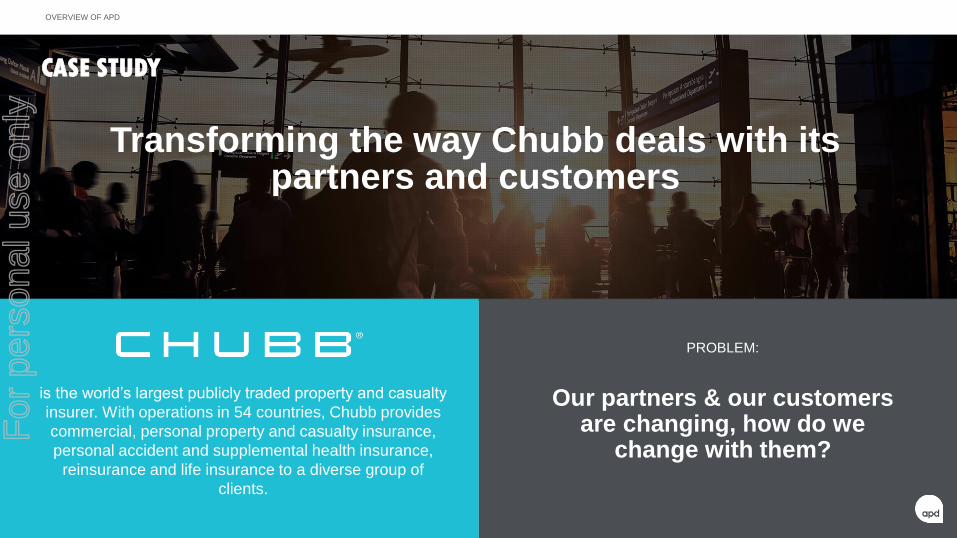
is the world’s largest publicly traded property and casualty
insurer. With operations in 54 countries, Chubb provides
commercial, personal property and casualty insurance,
personal accident and supplemental health insurance,
reinsurance and life insurance to a diverse group of
clients.
Transforming the way Chubb deals with its partners and customers
Our partners & our customers are changing, how do we
change with them?
PROBLEM:
CASE STUDY
OVERVIEW OF APDF
or p
erso
nal u
se o
nly
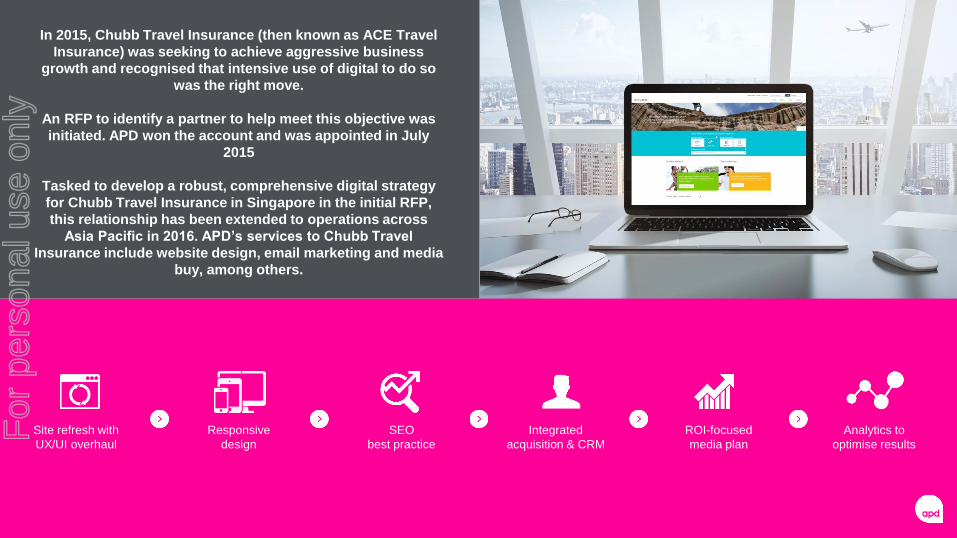
In 2015, Chubb Travel Insurance (then known as ACE Travel
Insurance) was seeking to achieve aggressive business
growth and recognised that intensive use of digital to do so
was the right move.
An RFP to identify a partner to help meet this objective was
initiated. APD won the account and was appointed in July
2015
Tasked to develop a robust, comprehensive digital strategy
for Chubb Travel Insurance in Singapore in the initial RFP,
this relationship has been extended to operations across
Asia Pacific in 2016. APD’s services to Chubb Travel
Insurance include website design, email marketing and media
buy, among others.
Site refresh with
UX/UI overhaul
Responsive
design
SEO
best practice
Integrated
acquisition & CRM
ROI-focused
media plan
Analytics to
optimise results
For
per
sona
l use
onl
y
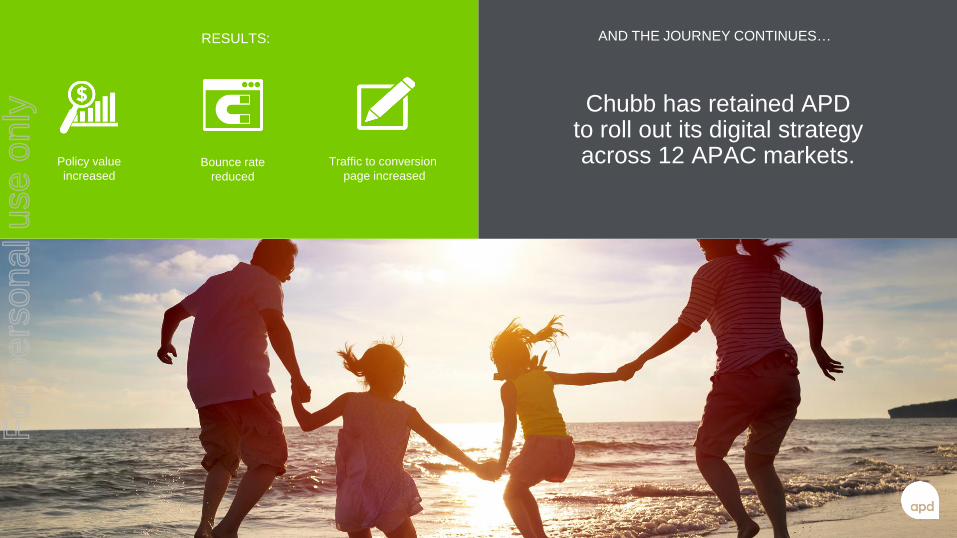
Traffic to conversion
page increased
RESULTS:
Bounce rate
reduced
Chubb has retained APD to roll out its digital strategy across 12 APAC markets. Policy value
increased
AND THE JOURNEY CONTINUES…F
or p
erso
nal u
se o
nly

18
MARKET & OPPORTUNITY
For
per
sona
l use
onl
y
19MARKET & OPPORTUNITY
FY16 FULL YEAR RESULTS PRESENTATION
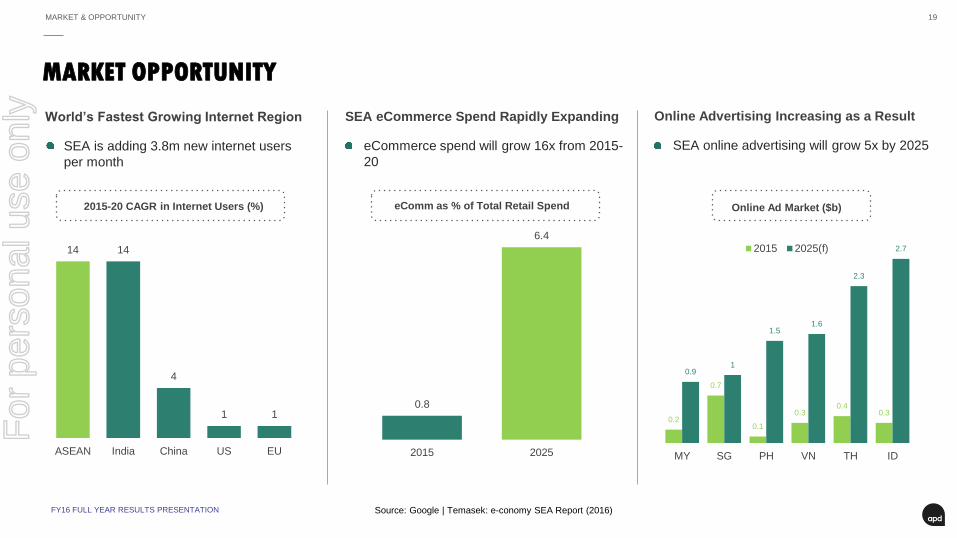
MARKET OPPORTUNITY
World’s Fastest Growing Internet Region
SEA is adding 3.8m new internet users
per month
14 14
4
1 1
ASEAN India China US EU
2015-20 CAGR in Internet Users (%)
0.8
6.4
2015 2025
eComm as % of Total Retail Spend
SEA eCommerce Spend Rapidly Expanding
eCommerce spend will grow 16x from 2015-
20
Online Advertising Increasing as a Result
SEA online advertising will grow 5x by 2025
0.2
0.7
0.1
0.30.4
0.3
0.91
1.51.6
2.3
2.7
MY SG PH VN TH ID
Online Ad Market ($b)
2015 2025(f)
Source: Google | Temasek: e-conomy SEA Report (2016)
For
per
sona
l use
onl
y
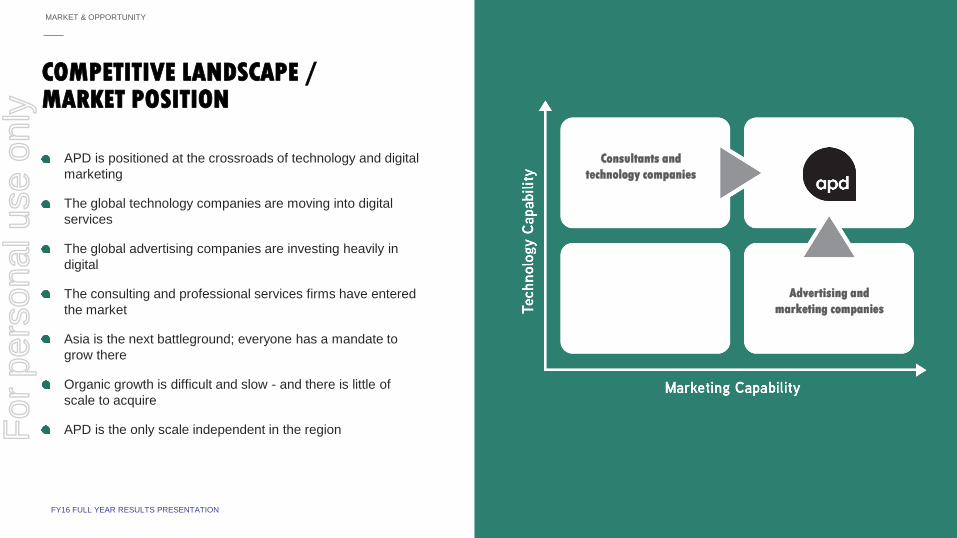
20MARKET & OPPORTUNITY
APD is positioned at the crossroads of technology and digital
marketing
The global technology companies are moving into digital
services
The global advertising companies are investing heavily in
digital
The consulting and professional services firms have entered
the market
Asia is the next battleground; everyone has a mandate to
grow there
Organic growth is difficult and slow - and there is little of
scale to acquire
APD is the only scale independent in the region
COMPETITIVE LANDSCAPE / MARKET POSITION
FY16 FULL YEAR RESULTS PRESENTATION
Advertising and
marketing companies
Consultants and
technology companies
For
per
sona
l use
onl
y

21
FY16 RESULTS OVERVIEW
For
per
sona
l use
onl
y
22
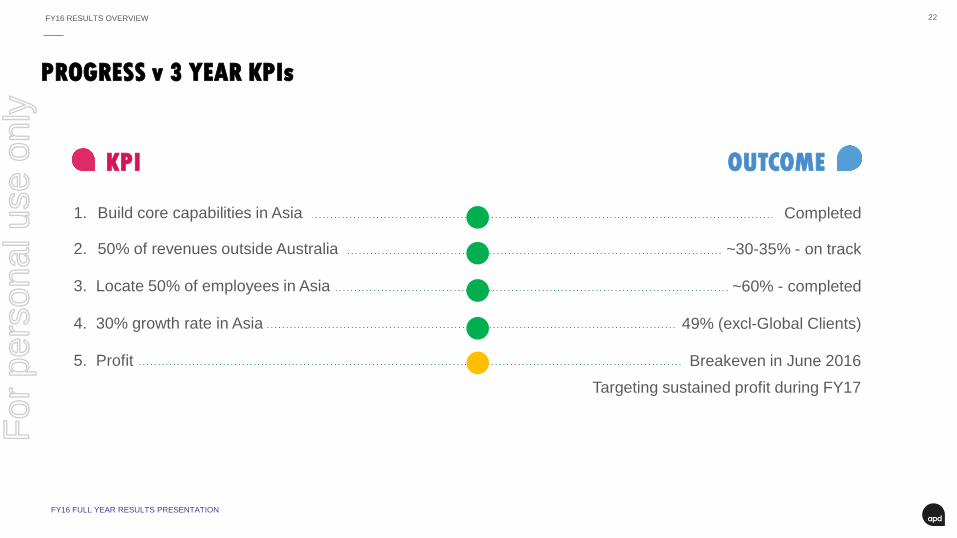
PROGRESS v 3 YEAR KPIs
FY16 RESULTS OVERVIEW
Completed
~30-35% - on track
~60% - completed
49% (excl-Global Clients)
Breakeven in June 2016
Targeting sustained profit during FY17
1. Build core capabilities in Asia
2. 50% of revenues outside Australia
3. Locate 50% of employees in Asia
4. 30% growth rate in Asia
5. Profit
KPI OUTCOME
FY16 RESULTS OVERVIEW
FY16 FULL YEAR RESULTS PRESENTATION
For
per
sona
l use
onl
y
23
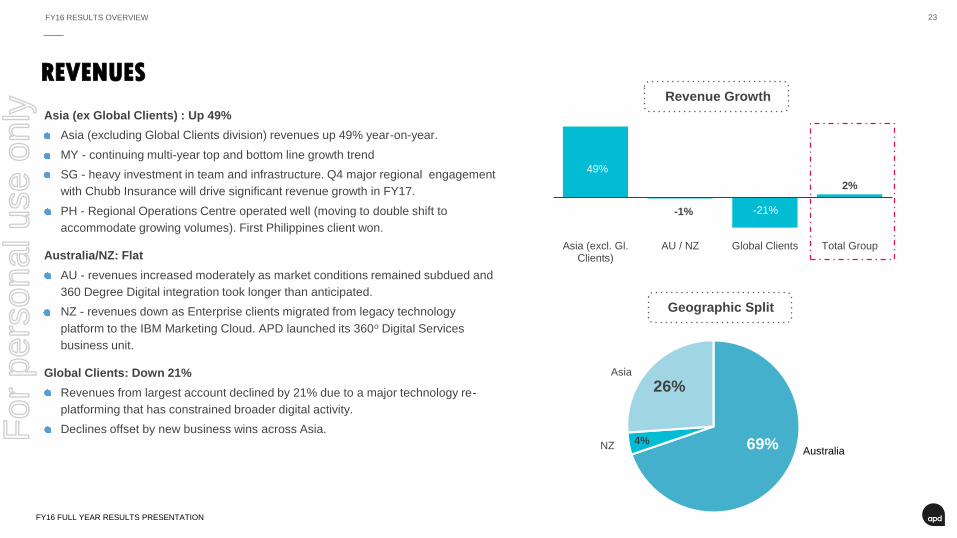
49%
-1% -21%
2%
Asia (excl. Gl.Clients)
AU / NZ Global Clients Total Group
Revenue Growth
REVENUES
FY16 RESULTS OVERVIEW
FY16 FULL YEAR RESULTS PRESENTATION
Asia (ex Global Clients) : Up 49%
Asia (excluding Global Clients division) revenues up 49% year-on-year.
MY - continuing multi-year top and bottom line growth trend
SG - heavy investment in team and infrastructure. Q4 major regional engagement
with Chubb Insurance will drive significant revenue growth in FY17.
PH - Regional Operations Centre operated well (moving to double shift to
accommodate growing volumes). First Philippines client won.
Australia/NZ: Flat
AU - revenues increased moderately as market conditions remained subdued and
360 Degree Digital integration took longer than anticipated.
NZ - revenues down as Enterprise clients migrated from legacy technology
platform to the IBM Marketing Cloud. APD launched its 360o Digital Services
business unit.
Global Clients: Down 21%
Revenues from largest account declined by 21% due to a major technology re-
platforming that has constrained broader digital activity.
Declines offset by new business wins across Asia.
69%4%
26%
Geographic Split
Australia
Asia
NZ
For
per
sona
l use
onl
y
24
PROFITABILITY
FY16 RESULTS OVERVIEW
FY16 FULL YEAR RESULTS PRESENTATION
$2m
$3m
$4m
J F M A M J
H2Y16 Financial Progression
Revenue, net of direct variable costs
Other Expenses
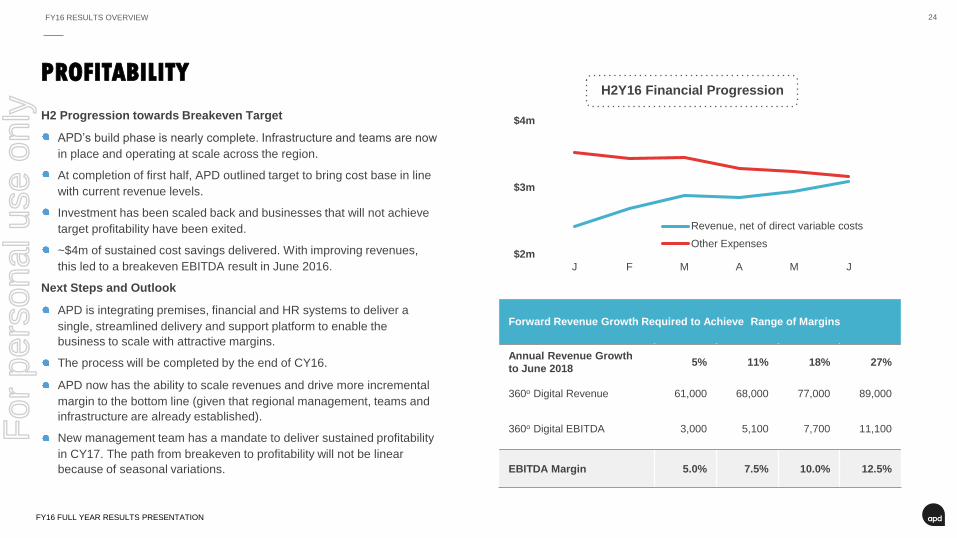
H2 Progression towards Breakeven Target
APD’s build phase is nearly complete. Infrastructure and teams are now
in place and operating at scale across the region.
At completion of first half, APD outlined target to bring cost base in line
with current revenue levels.
Investment has been scaled back and businesses that will not achieve
target profitability have been exited.
~$4m of sustained cost savings delivered. With improving revenues,
this led to a breakeven EBITDA result in June 2016.
Next Steps and Outlook
APD is integrating premises, financial and HR systems to deliver a
single, streamlined delivery and support platform to enable the
business to scale with attractive margins.
The process will be completed by the end of CY16.
APD now has the ability to scale revenues and drive more incremental
margin to the bottom line (given that regional management, teams and
infrastructure are already established).
New management team has a mandate to deliver sustained profitability
in CY17. The path from breakeven to profitability will not be linear
because of seasonal variations.
Forward Revenue Growth Required to Achieve Range of Margins
Annual Revenue Growth
to June 20185% 11% 18% 27%
360o Digital Revenue 61,000 68,000 77,000 89,000
360o Digital EBITDA 3,000 5,100 7,700 11,100
EBITDA Margin 5.0% 7.5% 10.0% 12.5%
For
per
sona
l use
onl
y
25
FY16 FULL YEAR RESULTS PRESENTATION
FY16 RESULTS OVERVIEW
FINANCIAL RESULTS
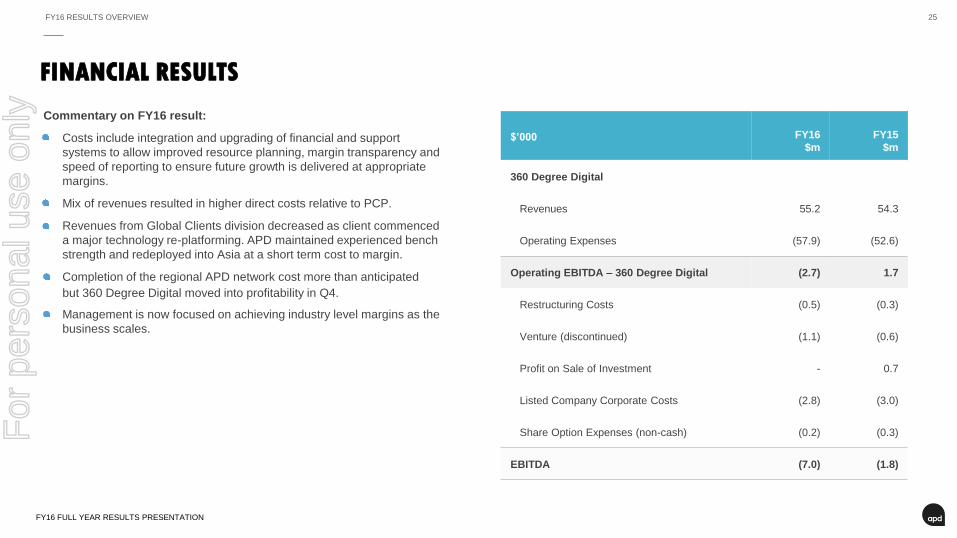
Commentary on FY16 result:
Costs include integration and upgrading of financial and support
systems to allow improved resource planning, margin transparency and
speed of reporting to ensure future growth is delivered at appropriate
margins.
Mix of revenues resulted in higher direct costs relative to PCP.
Revenues from Global Clients division decreased as client commenced
a major technology re-platforming. APD maintained experienced bench
strength and redeployed into Asia at a short term cost to margin.
Completion of the regional APD network cost more than anticipated
but 360 Degree Digital moved into profitability in Q4.
Management is now focused on achieving industry level margins as the
business scales.
$’000 FY16
$m
FY15
$m
360 Degree Digital
Revenues 55.2 54.3
Operating Expenses (57.9) (52.6)
Operating EBITDA – 360 Degree Digital (2.7) 1.7
Restructuring Costs (0.5) (0.3)
Venture (discontinued) (1.1) (0.6)
Profit on Sale of Investment - 0.7
Listed Company Corporate Costs (2.8) (3.0)
Share Option Expenses (non-cash) (0.2) (0.3)
EBITDA (7.0) (1.8)
For
per
sona
l use
onl
y
26FY16 RESULTS OVERVIEW
BALANCE SHEET
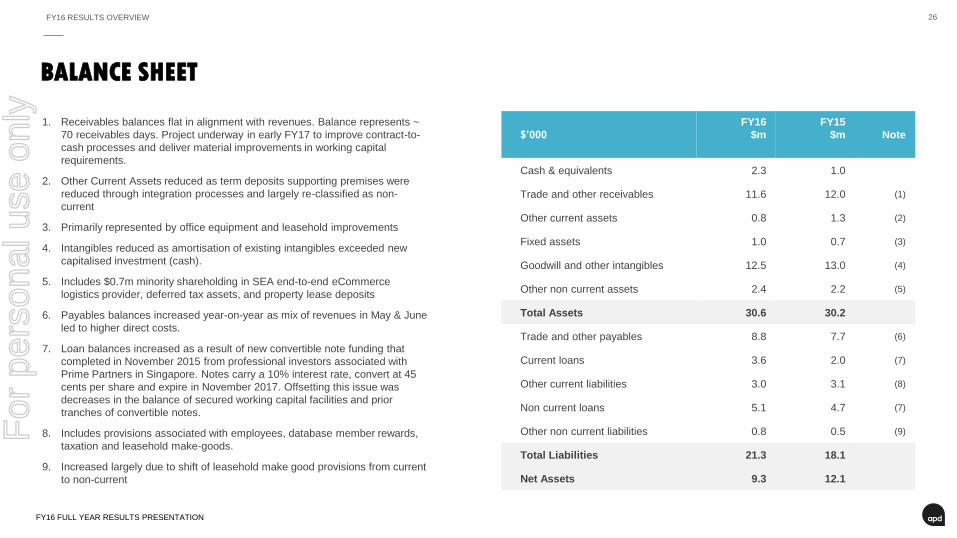
$’000
FY16
$m
FY15
$m Note
Cash & equivalents 2.3 1.0
Trade and other receivables 11.6 12.0 (1)
Other current assets 0.8 1.3 (2)
Fixed assets 1.0 0.7 (3)
Goodwill and other intangibles 12.5 13.0 (4)
Other non current assets 2.4 2.2 (5)
Total Assets 30.6 30.2
Trade and other payables 8.8 7.7 (6)
Current loans 3.6 2.0 (7)
Other current liabilities 3.0 3.1 (8)
Non current loans 5.1 4.7 (7)
Other non current liabilities 0.8 0.5 (9)
Total Liabilities 21.3 18.1
Net Assets 9.3 12.1
• [x]
FY16 FULL YEAR RESULTS PRESENTATION
1. Receivables balances flat in alignment with revenues. Balance represents ~
70 receivables days. Project underway in early FY17 to improve contract-to-
cash processes and deliver material improvements in working capital
requirements.
2. Other Current Assets reduced as term deposits supporting premises were
reduced through integration processes and largely re-classified as non-
current
3. Primarily represented by office equipment and leasehold improvements
4. Intangibles reduced as amortisation of existing intangibles exceeded new
capitalised investment (cash).
5. Includes $0.7m minority shareholding in SEA end-to-end eCommerce
logistics provider, deferred tax assets, and property lease deposits
6. Payables balances increased year-on-year as mix of revenues in May & June
led to higher direct costs.
7. Loan balances increased as a result of new convertible note funding that
completed in November 2015 from professional investors associated with
Prime Partners in Singapore. Notes carry a 10% interest rate, convert at 45
cents per share and expire in November 2017. Offsetting this issue was
decreases in the balance of secured working capital facilities and prior
tranches of convertible notes.
8. Includes provisions associated with employees, database member rewards,
taxation and leasehold make-goods.
9. Increased largely due to shift of leasehold make good provisions from current
to non-current
For
per
sona
l use
onl
y
27FY16 RESULTS OVERVIEW
2
7
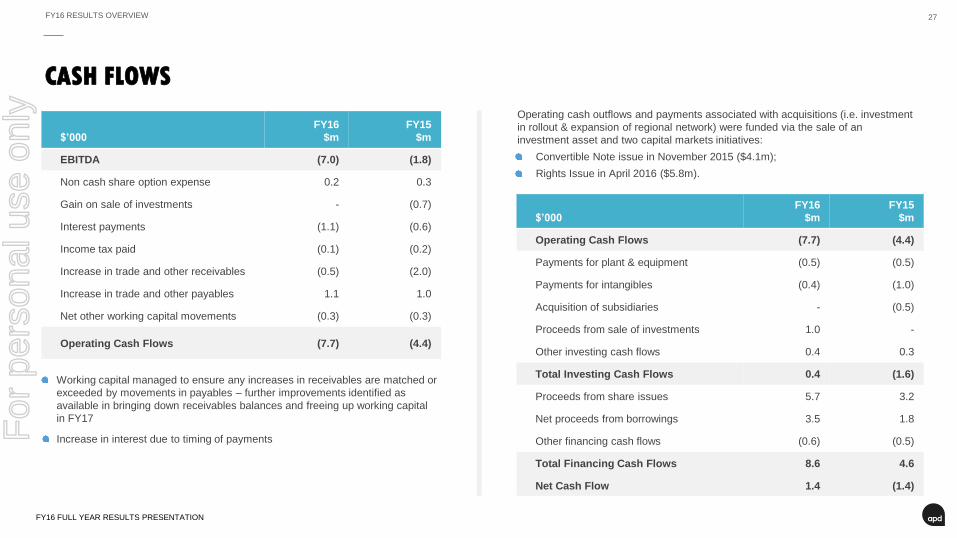
$’000
FY16
$m
FY15
$m
EBITDA (7.0) (1.8)
Non cash share option expense 0.2 0.3
Gain on sale of investments - (0.7)
Interest payments (1.1) (0.6)
Income tax paid (0.1) (0.2)
Increase in trade and other receivables (0.5) (2.0)
Increase in trade and other payables 1.1 1.0
Net other working capital movements (0.3) (0.3)
Operating Cash Flows (7.7) (4.4)
FY16 FULL YEAR RESULTS PRESENTATION
CASH FLOWS
Working capital managed to ensure any increases in receivables are matched or
exceeded by movements in payables – further improvements identified as
available in bringing down receivables balances and freeing up working capital
in FY17
Increase in interest due to timing of payments
$’000
FY16
$m
FY15
$m
Operating Cash Flows (7.7) (4.4)
Payments for plant & equipment (0.5) (0.5)
Payments for intangibles (0.4) (1.0)
Acquisition of subsidiaries - (0.5)
Proceeds from sale of investments 1.0 -
Other investing cash flows 0.4 0.3
Total Investing Cash Flows 0.4 (1.6)
Proceeds from share issues 5.7 3.2
Net proceeds from borrowings 3.5 1.8
Other financing cash flows (0.6) (0.5)
Total Financing Cash Flows 8.6 4.6
Net Cash Flow 1.4 (1.4)
Operating cash outflows and payments associated with acquisitions (i.e. investment
in rollout & expansion of regional network) were funded via the sale of an
investment asset and two capital markets initiatives:
• Convertible Note issue in November 2015 ($4.1m);
• Rights Issue in April 2016 ($5.8m).
For
per
sona
l use
onl
y

28
VALUATION & INVESTMENT
HIGHLIGHTS
For
per
sona
l use
onl
y
29VALUATION & INVESTMENT HIGHLIGHTS
2
9
• [x]
FY16 FULL YEAR RESULTS PRESENTATION
PEER GROUP VALUATIONS
-
1.0
2.0
3.0
4.0
5.0
6.0
7.0
8.0
9.0
10.0
Trading Transactions APD (Current)
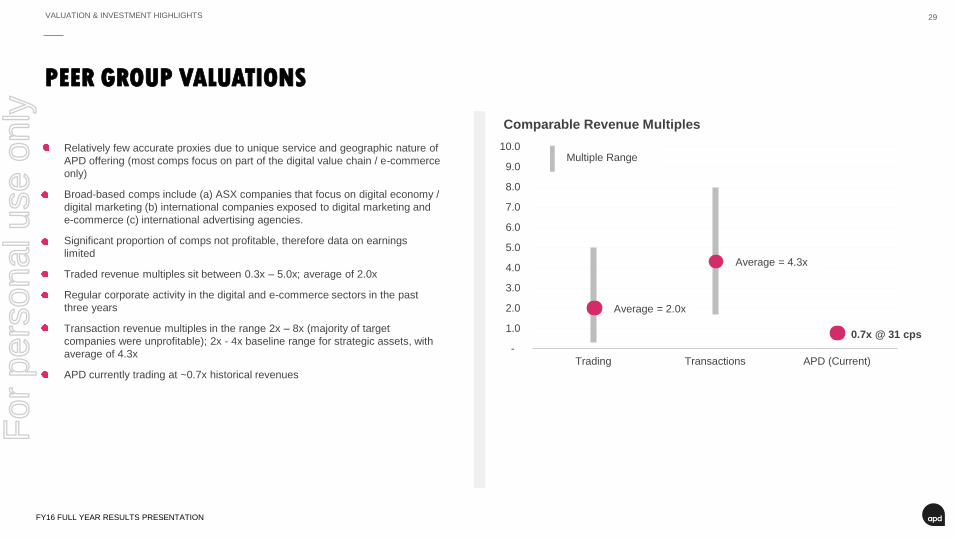
Relatively few accurate proxies due to unique service and geographic nature of
APD offering (most comps focus on part of the digital value chain / e-commerce
only)
Broad-based comps include (a) ASX companies that focus on digital economy /
digital marketing (b) international companies exposed to digital marketing and
e-commerce (c) international advertising agencies.
Significant proportion of comps not profitable, therefore data on earnings
limited
Traded revenue multiples sit between 0.3x – 5.0x; average of 2.0x
Regular corporate activity in the digital and e-commerce sectors in the past
three years
Transaction revenue multiples in the range 2x – 8x (majority of target
companies were unprofitable); 2x - 4x baseline range for strategic assets, with
average of 4.3x
APD currently trading at ~0.7x historical revenues
Comparable Revenue Multiples
Multiple Range
Average = 2.0x
Average = 4.3x
0.7x @ 31 cps
For
per
sona
l use
onl
y
30VALUATION & INVESTMENT HIGHLIGHTSVALUATION & INVESTMENT HIGHLIGHTS
FY16 FULL YEAR RESULTS PRESENTATION
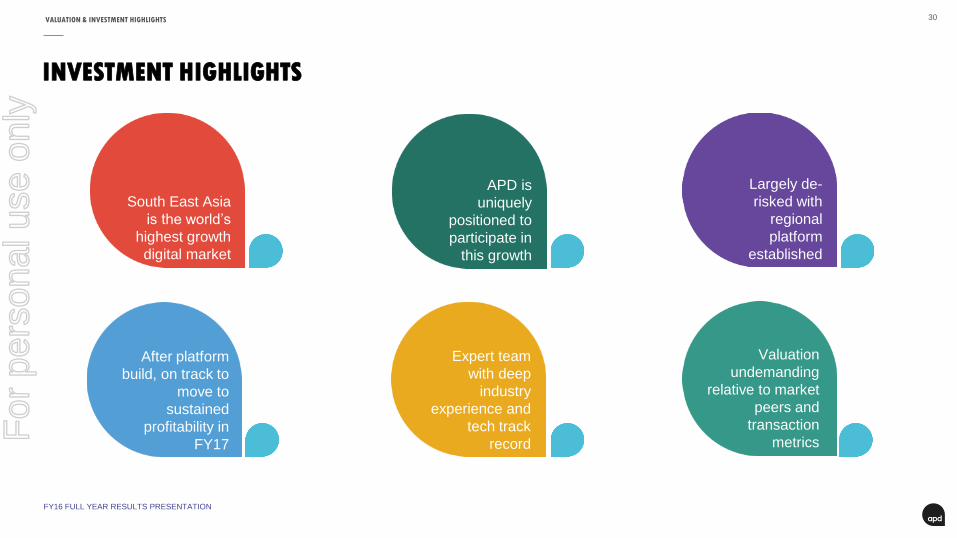
INVESTMENT HIGHLIGHTS
After platform
build, on track to
move to
sustained
profitability in
FY17
South East Asia
is the world’s
highest growth
digital market
APD is
uniquely
positioned to
participate in
this growth
Largely de-
risked with
regional
platform
established
Expert team
with deep
industry
experience and
tech track
record
Valuation
undemanding
relative to market
peers and
transaction
metricsFor
per
sona
l use
onl
y

31
APPENDIX
For
per
sona
l use
onl
y
32MARKET & OPPORTUNITY
FY16 FULL YEAR RESULTS PRESENTATION
APPENDIX - MARKET OPPORTUNITY (DETAILED)
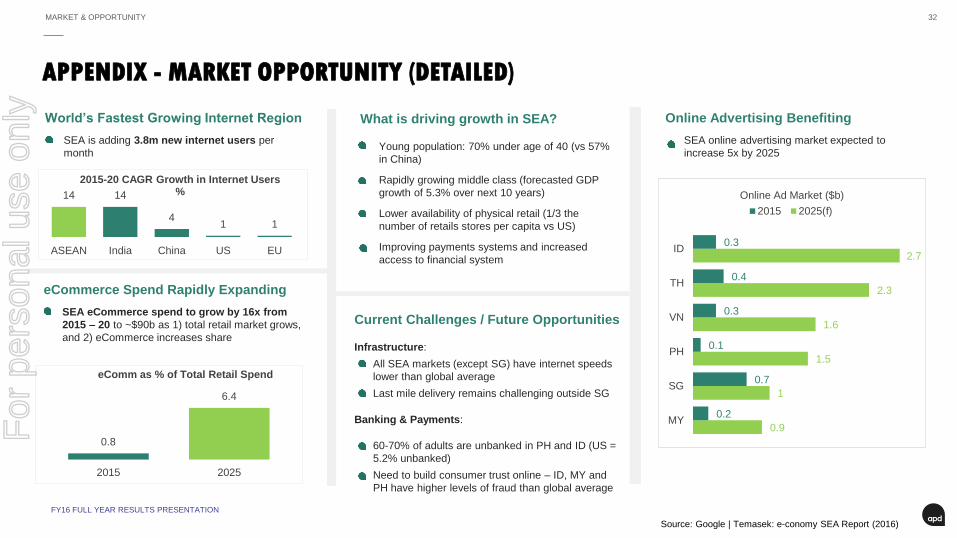
World’s Fastest Growing Internet Region
SEA is adding 3.8m new internet users per
month
What is driving growth in SEA?
Young population: 70% under age of 40 (vs 57%
in China)
Rapidly growing middle class (forecasted GDP
growth of 5.3% over next 10 years)
Lower availability of physical retail (1/3 the
number of retails stores per capita vs US)
Improving payments systems and increased
access to financial system
14 14
41 1
ASEAN India China US EU
2015-20 CAGR Growth in Internet Users %
0.8
6.4
2015 2025
eComm as % of Total Retail Spend
eCommerce Spend Rapidly Expanding
SEA eCommerce spend to grow by 16x from
2015 – 20 to ~$90b as 1) total retail market grows,
and 2) eCommerce increases share
Current Challenges / Future Opportunities
Infrastructure:
All SEA markets (except SG) have internet speeds
lower than global average
Last mile delivery remains challenging outside SG
Banking & Payments:
60-70% of adults are unbanked in PH and ID (US =
5.2% unbanked)
Need to build consumer trust online – ID, MY and
PH have higher levels of fraud than global average
Online Advertising Benefiting
SEA online advertising market expected to
increase 5x by 2025
0.9
1
1.5
1.6
2.3
2.7
0.2
0.7
0.1
0.3
0.4
0.3
MY
SG
PH
VN
TH
ID
Online Ad Market ($b)
2015 2025(f)
Source: Google | Temasek: e-conomy SEA Report (2016)
For
per
sona
l use
onl
y

33
THANK YOU
For
per
sona
l use
onl
y